Comanche Wage/Income Gap

COMPARE

Comanche
Race
Ancestry
AfghanAfricanAlaska NativeAlaskan AthabascanAlbanianAleutAlsatianAmericanApacheArabArapahoArgentineanArmenianAssyrian/Chaldean/SyriacAustralianAustrianBahamianBangladeshiBarbadianBasqueBelgianBelizeanBermudanBhutaneseBlackfeetBolivianBrazilianBritishBritish West IndianBulgarianBurmeseCajunCambodianCanadianCape VerdeanCarpatho RusynCelticCentral AmericanCentral American IndianCherokeeCheyenneChickasawChileanChineseChippewaChoctawColombianColvilleComancheCosta RicanCreeCreekCroatianCrowCubanCypriotCzechCzechoslovakianDanishDelawareDominicanDutchDutch West IndianEastern EuropeanEcuadorianEgyptianEnglishEstonianEthiopianEuropeanFijianFilipinoFinnishFrenchFrench American IndianFrench CanadianGermanGerman RussianGhanaianGreekGuamanian/ChamorroGuatemalanGuyaneseHaitianHmongHonduranHopiHoumaHungarianIcelanderIndian (Asian)IndonesianInupiatIranianIraqiIrishIroquoisIsraeliItalianJamaicanJapaneseJordanianKenyanKiowaKoreanLaotianLatvianLebaneseLiberianLithuanianLumbeeLuxembourgerMacedonianMalaysianMalteseMarshalleseMenomineeMexicanMexican American IndianMongolianMoroccanNative HawaiianNavajoNepaleseNew ZealanderNicaraguanNigerianNorthern EuropeanNorwegianOkinawanOsageOttawaPaiutePakistaniPalestinianPanamanianParaguayanPennsylvania GermanPeruvianPimaPolishPortuguesePotawatomiPuebloPuerto RicanPuget Sound SalishRomanianRussianSalvadoranSamoanScandinavianScotch-IrishScottishSeminoleSenegaleseSerbianShoshoneSierra LeoneanSiouxSlavicSlovakSloveneSomaliSouth AfricanSouth AmericanSouth American IndianSoviet UnionSpaniardSpanishSpanish AmericanSpanish American IndianSri LankanSubsaharan AfricanSudaneseSwedishSwissSyrianTaiwaneseThaiTlingit-HaidaTohono O'OdhamTonganTrinidadian and TobagonianTsimshianTurkishU.S. Virgin IslanderUgandanUkrainianUruguayanUteVenezuelanVietnameseWelshWest IndianYakamaYaquiYugoslavianYumanYup'ikZimbabwean
Immigration
NonimmigrantsImmigrantsAfghanistanAfricaAlbaniaArgentinaArmeniaAsiaAustraliaAustriaBahamasBangladeshBarbadosBelarusBelgiumBelizeBoliviaBosnia and HerzegovinaBrazilBulgariaBurma/MyanmarCabo VerdeCambodiaCameroonCanadaCaribbeanCentral AmericaChileChinaColombiaCongoCosta RicaCroatiaCubaCzechoslovakiaDenmarkDominicaDominican RepublicEastern AfricaEastern AsiaEastern EuropeEcuadorEgyptEl SalvadorEnglandEritreaEthiopiaEuropeFijiFranceGermanyGhanaGreeceGrenadaGuatemalaGuyanaHaitiHondurasHong KongHungaryIndiaIndonesiaIranIraqIrelandIsraelItalyJamaicaJapanJordanKazakhstanKenyaKoreaKuwaitLaosLatin AmericaLatviaLebanonLiberiaLithuaniaMalaysiaMexicoMicronesiaMiddle AfricaMoldovaMoroccoNepalNetherlandsNicaraguaNigeriaNorth AmericaNorth MacedoniaNorthern AfricaNorthern EuropeNorwayOceaniaPakistanPanamaPeruPhilippinesPolandPortugalRomaniaRussiaSaudi ArabiaScotlandSenegalSerbiaSierra LeoneSingaporeSomaliaSouth AfricaSouth AmericaSouth Central AsiaSouth Eastern AsiaSouthern EuropeSpainSri LankaSt. Vincent and the GrenadinesSudanSwedenSwitzerlandSyriaTaiwanThailandTrinidad and TobagoTurkeyUgandaUkraineUruguayUzbekistanVenezuelaVietnamWest IndiesWestern AfricaWestern AsiaWestern EuropeYemenZaireZimbabweAzores
Select to Compare
Race
Ancestry
AfghanAfricanAlaska NativeAlaskan AthabascanAlbanianAleutAlsatianAmericanApacheArabArapahoArgentineanArmenianAssyrian/Chaldean/SyriacAustralianAustrianBahamianBangladeshiBarbadianBasqueBelgianBelizeanBermudanBhutaneseBlackfeetBolivianBrazilianBritishBritish West IndianBulgarianBurmeseCajunCambodianCanadianCape VerdeanCarpatho RusynCelticCentral AmericanCentral American IndianCherokeeCheyenneChickasawChileanChineseChippewaChoctawColombianColvilleCosta RicanCreeCreekCroatianCrowCubanCypriotCzechCzechoslovakianDanishDelawareDominicanDutchDutch West IndianEastern EuropeanEcuadorianEgyptianEnglishEstonianEthiopianEuropeanFijianFilipinoFinnishFrenchFrench American IndianFrench CanadianGermanGerman RussianGhanaianGreekGuamanian/ChamorroGuatemalanGuyaneseHaitianHmongHonduranHopiHoumaHungarianIcelanderIndian (Asian)IndonesianInupiatIranianIraqiIrishIroquoisIsraeliItalianJamaicanJapaneseJordanianKenyanKiowaKoreanLaotianLatvianLebaneseLiberianLithuanianLumbeeLuxembourgerMacedonianMalaysianMalteseMarshalleseMenomineeMexicanMexican American IndianMongolianMoroccanNative HawaiianNavajoNepaleseNew ZealanderNicaraguanNigerianNorthern EuropeanNorwegianOkinawanOsageOttawaPaiutePakistaniPalestinianPanamanianParaguayanPennsylvania GermanPeruvianPimaPolishPortuguesePotawatomiPuebloPuerto RicanPuget Sound SalishRomanianRussianSalvadoranSamoanScandinavianScotch-IrishScottishSeminoleSenegaleseSerbianShoshoneSierra LeoneanSiouxSlavicSlovakSloveneSomaliSouth AfricanSouth AmericanSouth American IndianSoviet UnionSpaniardSpanishSpanish AmericanSpanish American IndianSri LankanSubsaharan AfricanSudaneseSwedishSwissSyrianTaiwaneseThaiTlingit-HaidaTohono O'OdhamTonganTrinidadian and TobagonianTsimshianTurkishU.S. Virgin IslanderUgandanUkrainianUruguayanUteVenezuelanVietnameseWelshWest IndianYakamaYaquiYugoslavianYumanYup'ikZimbabwean
Immigration
NonimmigrantsImmigrantsAfghanistanAfricaAlbaniaArgentinaArmeniaAsiaAustraliaAustriaBahamasBangladeshBarbadosBelarusBelgiumBelizeBoliviaBosnia and HerzegovinaBrazilBulgariaBurma/MyanmarCabo VerdeCambodiaCameroonCanadaCaribbeanCentral AmericaChileChinaColombiaCongoCosta RicaCroatiaCubaCzechoslovakiaDenmarkDominicaDominican RepublicEastern AfricaEastern AsiaEastern EuropeEcuadorEgyptEl SalvadorEnglandEritreaEthiopiaEuropeFijiFranceGermanyGhanaGreeceGrenadaGuatemalaGuyanaHaitiHondurasHong KongHungaryIndiaIndonesiaIranIraqIrelandIsraelItalyJamaicaJapanJordanKazakhstanKenyaKoreaKuwaitLaosLatin AmericaLatviaLebanonLiberiaLithuaniaMalaysiaMexicoMicronesiaMiddle AfricaMoldovaMoroccoNepalNetherlandsNicaraguaNigeriaNorth AmericaNorth MacedoniaNorthern AfricaNorthern EuropeNorwayOceaniaPakistanPanamaPeruPhilippinesPolandPortugalRomaniaRussiaSaudi ArabiaScotlandSenegalSerbiaSierra LeoneSingaporeSomaliaSouth AfricaSouth AmericaSouth Central AsiaSouth Eastern AsiaSouthern EuropeSpainSri LankaSt. Vincent and the GrenadinesSudanSwedenSwitzerlandSyriaTaiwanThailandTrinidad and TobagoTurkeyUgandaUkraineUruguayUzbekistanVenezuelaVietnamWest IndiesWestern AfricaWestern AsiaWestern EuropeYemenZaireZimbabweAzores
Wage/Income Gap
Income
Poverty
Unemployment
Labor Participation
Family Structure
Vehicle Availability
Education Level
Disability

Comanche Wage/Income Gap
Excellent

25.0%
WAGE/INCOME GAP
85.2/ 100
METRIC RATING
145th/ 347
METRIC RANK

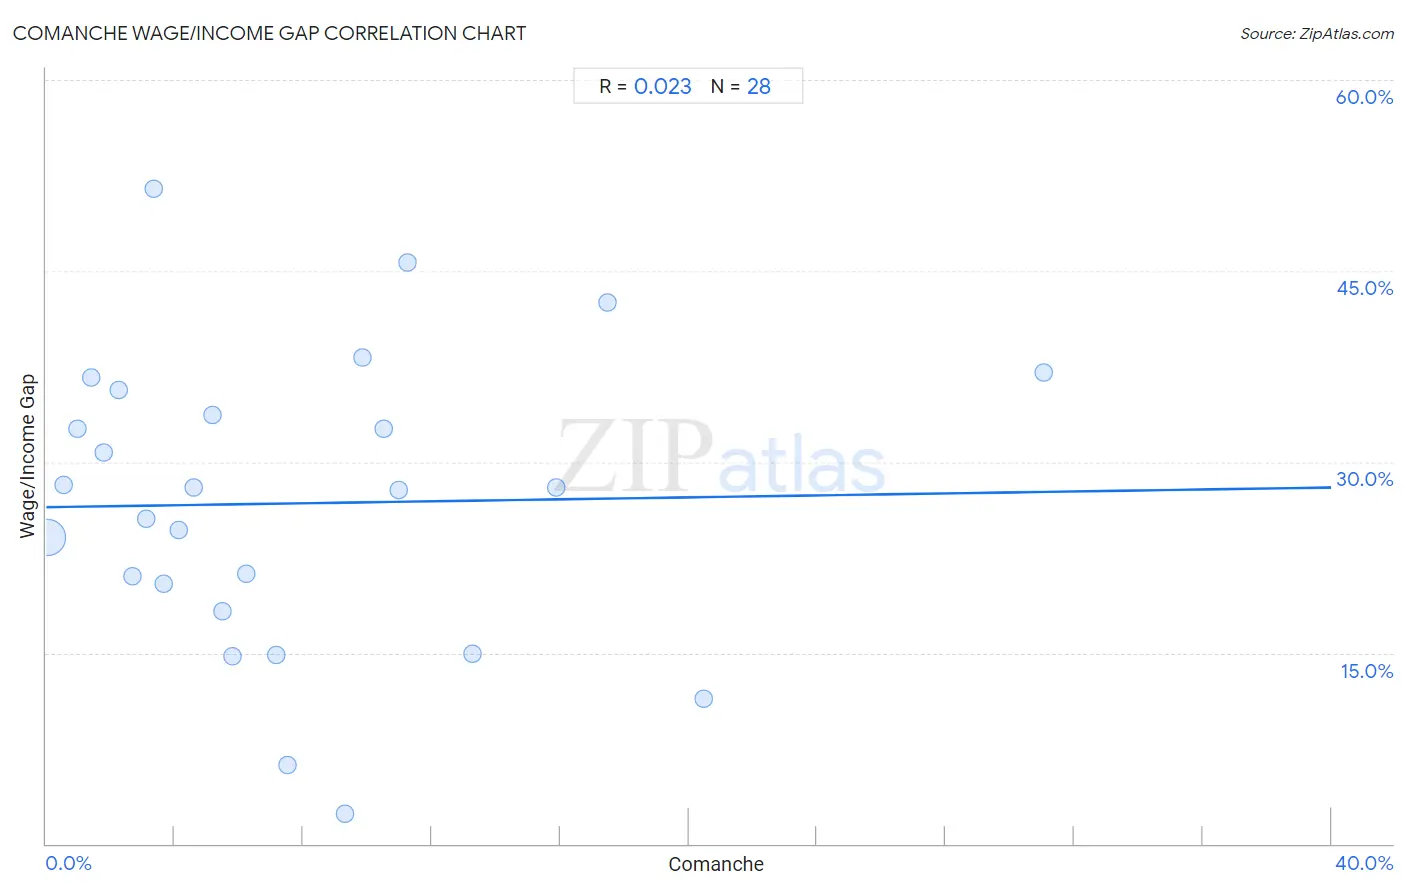
Comanche Wage/Income Gap Correlation Chart

The statistical analysis conducted on geographies consisting of 109,744,354 people shows no correlation between the proportion of Comanche and wage/income gap percentage in the United States with a correlation coefficient (R) of 0.023 and weighted average of 25.0%. On average, for every 1% (one percent) increase in Comanche within a typical geography, there is an increase of 0.039% in wage/income gap percentage.
Comanche Wage/Income Gap
It is essential to understand that the correlation between the percentage of Comanche and wage/income gap percentage does not imply a direct cause-and-effect relationship. It remains uncertain whether the presence of Comanche influences an upward or downward trend in the level of wage/income gap percentage within an area, or if Comanche simply ended up residing in those areas with higher or lower levels of wage/income gap percentage due to other factors.

Demographics Similar to Comanche by Wage/Income Gap

In terms of wage/income gap, the demographic groups most similar to Comanche are South American (25.0%, a difference of 0.0%), Malaysian (25.0%, a difference of 0.030%), Iroquois (25.1%, a difference of 0.16%), Chippewa (25.0%, a difference of 0.24%), and Immigrants from Peru (25.1%, a difference of 0.31%).
DemographicsRating | RankWage/Income Gap
Immigrants from Bosnia and Herzegovina
90.1
/100
|
#138
Exceptional
24.8%
Hispanics or Latinos
89.5
/100
|
#139
Excellent
24.9%
Immigrants from Nepal
89.3
/100
|
#140
Excellent
24.9%
Hawaiians
89.3
/100
|
#141
Excellent
24.9%
Afghans
88.1
/100
|
#142
Excellent
24.9%
Immigrants from Uganda
88.0
/100
|
#143
Excellent
24.9%
Chippewa
86.9
/100
|
#144
Excellent
25.0%
Comanche
85.2
/100
|
#145
Excellent
25.0%
South Americans
85.2
/100
|
#146
Excellent
25.0%
Malaysians
84.9
/100
|
#147
Excellent
25.0%
Iroquois
83.9
/100
|
#148
Excellent
25.1%
Immigrants from Peru
82.6
/100
|
#149
Excellent
25.1%
Immigrants
82.3
/100
|
#150
Excellent
25.1%
Taiwanese
81.6
/100
|
#151
Excellent
25.1%
Uruguayans
81.3
/100
|
#152
Excellent
25.2%

Comanche Wage/Income Gap Correlation Summary

MeasurementComanche DataWage/Income Gap Data
Minimum0.034%2.4%
Maximum31.0%51.5%
Range31.0%49.1%
Mean7.7%26.7%
Median5.6%27.9%
Interquartile 25% (IQ1)2.9%19.4%
Interquartile 75% (IQ3)10.8%34.7%
Interquartile Range (IQR)7.8%15.3%
Standard Deviation (Sample)7.0%11.6%
Standard Deviation (Population)6.9%11.4%

Correlation Details

Comanche PercentileSample SizeWage/Income Gap
[
0.0%
-
0.5%
]
0.034%
108,074,14024.1%
[
0.5%
-
1.0%
]
0.53%
1,117,32428.2%
[
0.5%
-
1.0%
]
0.98%
162,00332.6%
[
1.0%
-
1.5%
]
1.40%
60,65736.6%
[
1.5%
-
2.0%
]
1.80%
37,11930.8%
[
2.0%
-
2.5%
]
2.26%
18,91135.6%
[
2.5%
-
3.0%
]
2.69%
159,44821.0%
[
3.0%
-
3.5%
]
3.12%
35,00825.5%
[
3.0%
-
3.5%
]
3.34%
4,24651.5%
[
3.5%
-
4.0%
]
3.65%
25,95820.5%
[
4.0%
-
4.5%
]
4.11%
1,65424.6%
[
4.5%
-
5.0%
]
4.61%
4,14528.0%
[
5.0%
-
5.5%
]
5.19%
4,21933.7%
[
5.5%
-
6.0%
]
5.50%
9,63618.3%
[
5.5%
-
6.0%
]
5.78%
2,99414.7%
[
6.0%
-
6.5%
]
6.23%
6,08621.2%
[
7.0%
-
7.5%
]
7.14%
1,14814.8%
[
7.0%
-
7.5%
]
7.49%
3,2306.2%
[
9.0%
-
9.5%
]
9.29%
3122.4%
[
9.5%
-
10.0%
]
9.83%
2,56338.2%
[
10.5%
-
11.0%
]
10.52%
4,86732.6%
[
10.5%
-
11.0%
]
10.99%
1,43827.8%
[
11.0%
-
11.5%
]
11.26%
1,37745.7%
[
13.0%
-
13.5%
]
13.27%
1,34114.9%
[
15.5%
-
16.0%
]
15.87%
2,97428.0%
[
17.0%
-
17.5%
]
17.46%
1,06542.6%
[
20.0%
-
20.5%
]
20.49%
28811.3%
[
31.0%
-
31.5%
]
31.03%
20337.1%