Immigrants from Chile Wage/Income Gap

COMPARE

Immigrants from Chile
Race
Ancestry
AfghanAfricanAlaska NativeAlaskan AthabascanAlbanianAleutAlsatianAmericanApacheArabArapahoArgentineanArmenianAssyrian/Chaldean/SyriacAustralianAustrianBahamianBangladeshiBarbadianBasqueBelgianBelizeanBermudanBhutaneseBlackfeetBolivianBrazilianBritishBritish West IndianBulgarianBurmeseCajunCambodianCanadianCape VerdeanCarpatho RusynCelticCentral AmericanCentral American IndianCherokeeCheyenneChickasawChileanChineseChippewaChoctawColombianColvilleComancheCosta RicanCreeCreekCroatianCrowCubanCypriotCzechCzechoslovakianDanishDelawareDominicanDutchDutch West IndianEastern EuropeanEcuadorianEgyptianEnglishEstonianEthiopianEuropeanFijianFilipinoFinnishFrenchFrench American IndianFrench CanadianGermanGerman RussianGhanaianGreekGuamanian/ChamorroGuatemalanGuyaneseHaitianHmongHonduranHopiHoumaHungarianIcelanderIndian (Asian)IndonesianInupiatIranianIraqiIrishIroquoisIsraeliItalianJamaicanJapaneseJordanianKenyanKiowaKoreanLaotianLatvianLebaneseLiberianLithuanianLumbeeLuxembourgerMacedonianMalaysianMalteseMarshalleseMenomineeMexicanMexican American IndianMongolianMoroccanNative HawaiianNavajoNepaleseNew ZealanderNicaraguanNigerianNorthern EuropeanNorwegianOkinawanOsageOttawaPaiutePakistaniPalestinianPanamanianParaguayanPennsylvania GermanPeruvianPimaPolishPortuguesePotawatomiPuebloPuerto RicanPuget Sound SalishRomanianRussianSalvadoranSamoanScandinavianScotch-IrishScottishSeminoleSenegaleseSerbianShoshoneSierra LeoneanSiouxSlavicSlovakSloveneSomaliSouth AfricanSouth AmericanSouth American IndianSoviet UnionSpaniardSpanishSpanish AmericanSpanish American IndianSri LankanSubsaharan AfricanSudaneseSwedishSwissSyrianTaiwaneseThaiTlingit-HaidaTohono O'OdhamTonganTrinidadian and TobagonianTsimshianTurkishU.S. Virgin IslanderUgandanUkrainianUruguayanUteVenezuelanVietnameseWelshWest IndianYakamaYaquiYugoslavianYumanYup'ikZimbabwean
Immigration
NonimmigrantsImmigrantsAfghanistanAfricaAlbaniaArgentinaArmeniaAsiaAustraliaAustriaBahamasBangladeshBarbadosBelarusBelgiumBelizeBoliviaBosnia and HerzegovinaBrazilBulgariaBurma/MyanmarCabo VerdeCambodiaCameroonCanadaCaribbeanCentral AmericaChileChinaColombiaCongoCosta RicaCroatiaCubaCzechoslovakiaDenmarkDominicaDominican RepublicEastern AfricaEastern AsiaEastern EuropeEcuadorEgyptEl SalvadorEnglandEritreaEthiopiaEuropeFijiFranceGermanyGhanaGreeceGrenadaGuatemalaGuyanaHaitiHondurasHong KongHungaryIndiaIndonesiaIranIraqIrelandIsraelItalyJamaicaJapanJordanKazakhstanKenyaKoreaKuwaitLaosLatin AmericaLatviaLebanonLiberiaLithuaniaMalaysiaMexicoMicronesiaMiddle AfricaMoldovaMoroccoNepalNetherlandsNicaraguaNigeriaNorth AmericaNorth MacedoniaNorthern AfricaNorthern EuropeNorwayOceaniaPakistanPanamaPeruPhilippinesPolandPortugalRomaniaRussiaSaudi ArabiaScotlandSenegalSerbiaSierra LeoneSingaporeSomaliaSouth AfricaSouth AmericaSouth Central AsiaSouth Eastern AsiaSouthern EuropeSpainSri LankaSt. Vincent and the GrenadinesSudanSwedenSwitzerlandSyriaTaiwanThailandTrinidad and TobagoTurkeyUgandaUkraineUruguayUzbekistanVenezuelaVietnamWest IndiesWestern AfricaWestern AsiaWestern EuropeYemenZaireZimbabweAzores
Select to Compare
Race
Ancestry
AfghanAfricanAlaska NativeAlaskan AthabascanAlbanianAleutAlsatianAmericanApacheArabArapahoArgentineanArmenianAssyrian/Chaldean/SyriacAustralianAustrianBahamianBangladeshiBarbadianBasqueBelgianBelizeanBermudanBhutaneseBlackfeetBolivianBrazilianBritishBritish West IndianBulgarianBurmeseCajunCambodianCanadianCape VerdeanCarpatho RusynCelticCentral AmericanCentral American IndianCherokeeCheyenneChickasawChileanChineseChippewaChoctawColombianColvilleComancheCosta RicanCreeCreekCroatianCrowCubanCypriotCzechCzechoslovakianDanishDelawareDominicanDutchDutch West IndianEastern EuropeanEcuadorianEgyptianEnglishEstonianEthiopianEuropeanFijianFilipinoFinnishFrenchFrench American IndianFrench CanadianGermanGerman RussianGhanaianGreekGuamanian/ChamorroGuatemalanGuyaneseHaitianHmongHonduranHopiHoumaHungarianIcelanderIndian (Asian)IndonesianInupiatIranianIraqiIrishIroquoisIsraeliItalianJamaicanJapaneseJordanianKenyanKiowaKoreanLaotianLatvianLebaneseLiberianLithuanianLumbeeLuxembourgerMacedonianMalaysianMalteseMarshalleseMenomineeMexicanMexican American IndianMongolianMoroccanNative HawaiianNavajoNepaleseNew ZealanderNicaraguanNigerianNorthern EuropeanNorwegianOkinawanOsageOttawaPaiutePakistaniPalestinianPanamanianParaguayanPennsylvania GermanPeruvianPimaPolishPortuguesePotawatomiPuebloPuerto RicanPuget Sound SalishRomanianRussianSalvadoranSamoanScandinavianScotch-IrishScottishSeminoleSenegaleseSerbianShoshoneSierra LeoneanSiouxSlavicSlovakSloveneSomaliSouth AfricanSouth AmericanSouth American IndianSoviet UnionSpaniardSpanishSpanish AmericanSpanish American IndianSri LankanSubsaharan AfricanSudaneseSwedishSwissSyrianTaiwaneseThaiTlingit-HaidaTohono O'OdhamTonganTrinidadian and TobagonianTsimshianTurkishU.S. Virgin IslanderUgandanUkrainianUruguayanUteVenezuelanVietnameseWelshWest IndianYakamaYaquiYugoslavianYumanYup'ikZimbabwean
Immigration
NonimmigrantsImmigrantsAfghanistanAfricaAlbaniaArgentinaArmeniaAsiaAustraliaAustriaBahamasBangladeshBarbadosBelarusBelgiumBelizeBoliviaBosnia and HerzegovinaBrazilBulgariaBurma/MyanmarCabo VerdeCambodiaCameroonCanadaCaribbeanCentral AmericaChinaColombiaCongoCosta RicaCroatiaCubaCzechoslovakiaDenmarkDominicaDominican RepublicEastern AfricaEastern AsiaEastern EuropeEcuadorEgyptEl SalvadorEnglandEritreaEthiopiaEuropeFijiFranceGermanyGhanaGreeceGrenadaGuatemalaGuyanaHaitiHondurasHong KongHungaryIndiaIndonesiaIranIraqIrelandIsraelItalyJamaicaJapanJordanKazakhstanKenyaKoreaKuwaitLaosLatin AmericaLatviaLebanonLiberiaLithuaniaMalaysiaMexicoMicronesiaMiddle AfricaMoldovaMoroccoNepalNetherlandsNicaraguaNigeriaNorth AmericaNorth MacedoniaNorthern AfricaNorthern EuropeNorwayOceaniaPakistanPanamaPeruPhilippinesPolandPortugalRomaniaRussiaSaudi ArabiaScotlandSenegalSerbiaSierra LeoneSingaporeSomaliaSouth AfricaSouth AmericaSouth Central AsiaSouth Eastern AsiaSouthern EuropeSpainSri LankaSt. Vincent and the GrenadinesSudanSwedenSwitzerlandSyriaTaiwanThailandTrinidad and TobagoTurkeyUgandaUkraineUruguayUzbekistanVenezuelaVietnamWest IndiesWestern AfricaWestern AsiaWestern EuropeYemenZaireZimbabweAzores
Wage/Income Gap
Income
Poverty
Unemployment
Labor Participation
Family Structure
Vehicle Availability
Education Level
Disability

Immigrants from Chile Wage/Income Gap
Average

25.7%
WAGE/INCOME GAP
53.2/ 100
METRIC RATING
172nd/ 347
METRIC RANK

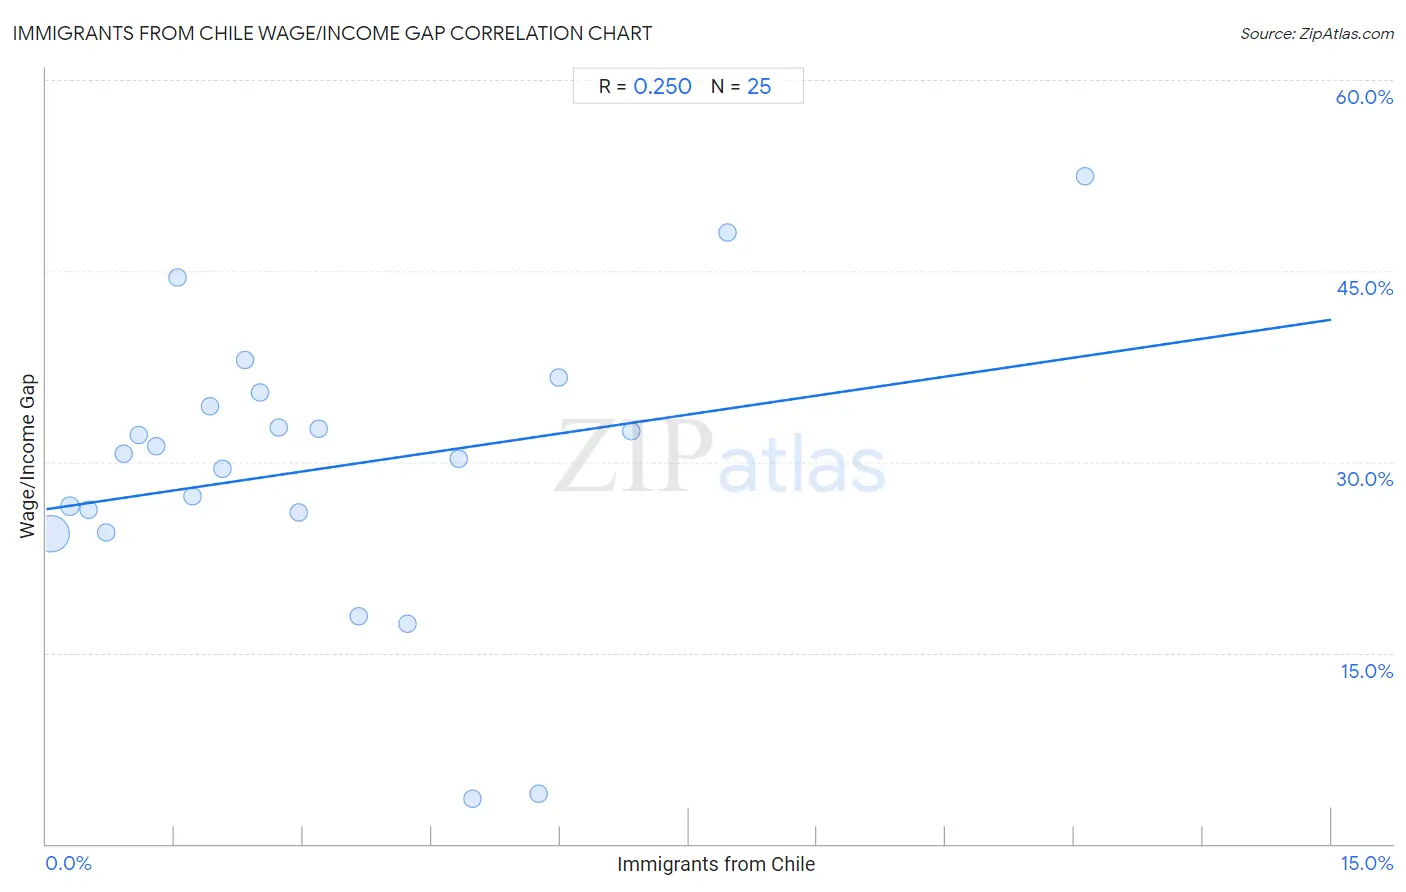
Immigrants from Chile Wage/Income Gap Correlation Chart

The statistical analysis conducted on geographies consisting of 218,595,517 people shows a weak positive correlation between the proportion of Immigrants from Chile and wage/income gap percentage in the United States with a correlation coefficient (R) of 0.250 and weighted average of 25.7%. On average, for every 1% (one percent) increase in Immigrants from Chile within a typical geography, there is an increase of 0.99% in wage/income gap percentage.
Immigrants from Chile Wage/Income Gap
It is essential to understand that the correlation between the percentage of Immigrants from Chile and wage/income gap percentage does not imply a direct cause-and-effect relationship. It remains uncertain whether the presence of Immigrants from Chile influences an upward or downward trend in the level of wage/income gap percentage within an area, or if Immigrants from Chile simply ended up residing in those areas with higher or lower levels of wage/income gap percentage due to other factors.

Demographics Similar to Immigrants from Chile by Wage/Income Gap

In terms of wage/income gap, the demographic groups most similar to Immigrants from Chile are Immigrants from Belarus (25.7%, a difference of 0.020%), Alaskan Athabascan (25.8%, a difference of 0.21%), Immigrants from Greece (25.7%, a difference of 0.22%), Immigrants from Oceania (25.6%, a difference of 0.28%), and Sri Lankan (25.8%, a difference of 0.41%).
DemographicsRating | RankWage/Income Gap
Immigrants from Hong Kong
64.0
/100
|
#165
Good
25.5%
Immigrants from Ukraine
63.8
/100
|
#166
Good
25.5%
Paiute
62.9
/100
|
#167
Good
25.5%
Seminole
62.6
/100
|
#168
Good
25.6%
Peruvians
60.1
/100
|
#169
Good
25.6%
Immigrants from Oceania
57.5
/100
|
#170
Average
25.6%
Immigrants from Greece
56.6
/100
|
#171
Average
25.7%
Immigrants from Chile
53.2
/100
|
#172
Average
25.7%
Immigrants from Belarus
52.9
/100
|
#173
Average
25.7%
Alaskan Athabascans
50.0
/100
|
#174
Average
25.8%
Sri Lankans
47.0
/100
|
#175
Average
25.8%
Paraguayans
46.7
/100
|
#176
Average
25.8%
Cambodians
45.1
/100
|
#177
Average
25.8%
Chinese
42.0
/100
|
#178
Average
25.9%
Samoans
38.6
/100
|
#179
Fair
26.0%

Immigrants from Chile Wage/Income Gap Correlation Summary

MeasurementImmigrants from Chile DataWage/Income Gap Data
Minimum0.054%3.5%
Maximum12.1%52.4%
Range12.1%48.9%
Mean3.3%29.5%
Median2.5%30.7%
Interquartile 25% (IQ1)1.2%25.2%
Interquartile 75% (IQ3)4.9%34.9%
Interquartile Range (IQR)3.7%9.7%
Standard Deviation (Sample)2.8%11.2%
Standard Deviation (Population)2.8%11.0%

Correlation Details

Immigrants from Chile PercentileSample SizeWage/Income Gap
[
0.0%
-
0.5%
]
0.054%
197,861,39424.4%
[
0.0%
-
0.5%
]
0.28%
13,496,47526.5%
[
0.0%
-
0.5%
]
0.49%
4,071,56926.2%
[
0.5%
-
1.0%
]
0.70%
1,427,59524.4%
[
0.5%
-
1.0%
]
0.90%
652,76630.7%
[
1.0%
-
1.5%
]
1.08%
552,57332.2%
[
1.0%
-
1.5%
]
1.29%
211,17331.2%
[
1.5%
-
2.0%
]
1.53%
56,97644.5%
[
1.5%
-
2.0%
]
1.70%
60,46427.3%
[
1.5%
-
2.0%
]
1.91%
52,04734.3%
[
2.0%
-
2.5%
]
2.06%
47,43529.5%
[
2.0%
-
2.5%
]
2.32%
17,41238.0%
[
2.0%
-
2.5%
]
2.50%
27,33135.4%
[
2.5%
-
3.0%
]
2.71%
9,93832.7%
[
2.5%
-
3.0%
]
2.95%
20,97126.0%
[
3.0%
-
3.5%
]
3.18%
5,12832.6%
[
3.5%
-
4.0%
]
3.64%
2,82617.9%
[
4.0%
-
4.5%
]
4.21%
28517.3%
[
4.5%
-
5.0%
]
4.81%
18730.3%
[
4.5%
-
5.0%
]
4.97%
8,4503.5%
[
5.5%
-
6.0%
]
5.75%
7,3073.9%
[
5.5%
-
6.0%
]
5.99%
1,90436.7%
[
6.5%
-
7.0%
]
6.83%
73232.4%
[
7.5%
-
8.0%
]
7.95%
1,62248.0%
[
12.0%
-
12.5%
]
12.12%
95752.4%