Zip Codes with the Highest Percentage of Population with a Degree in Communications in Iowa
RELATED REPORTS & OPTIONS
Communications
Iowa
Compare Zip Codes
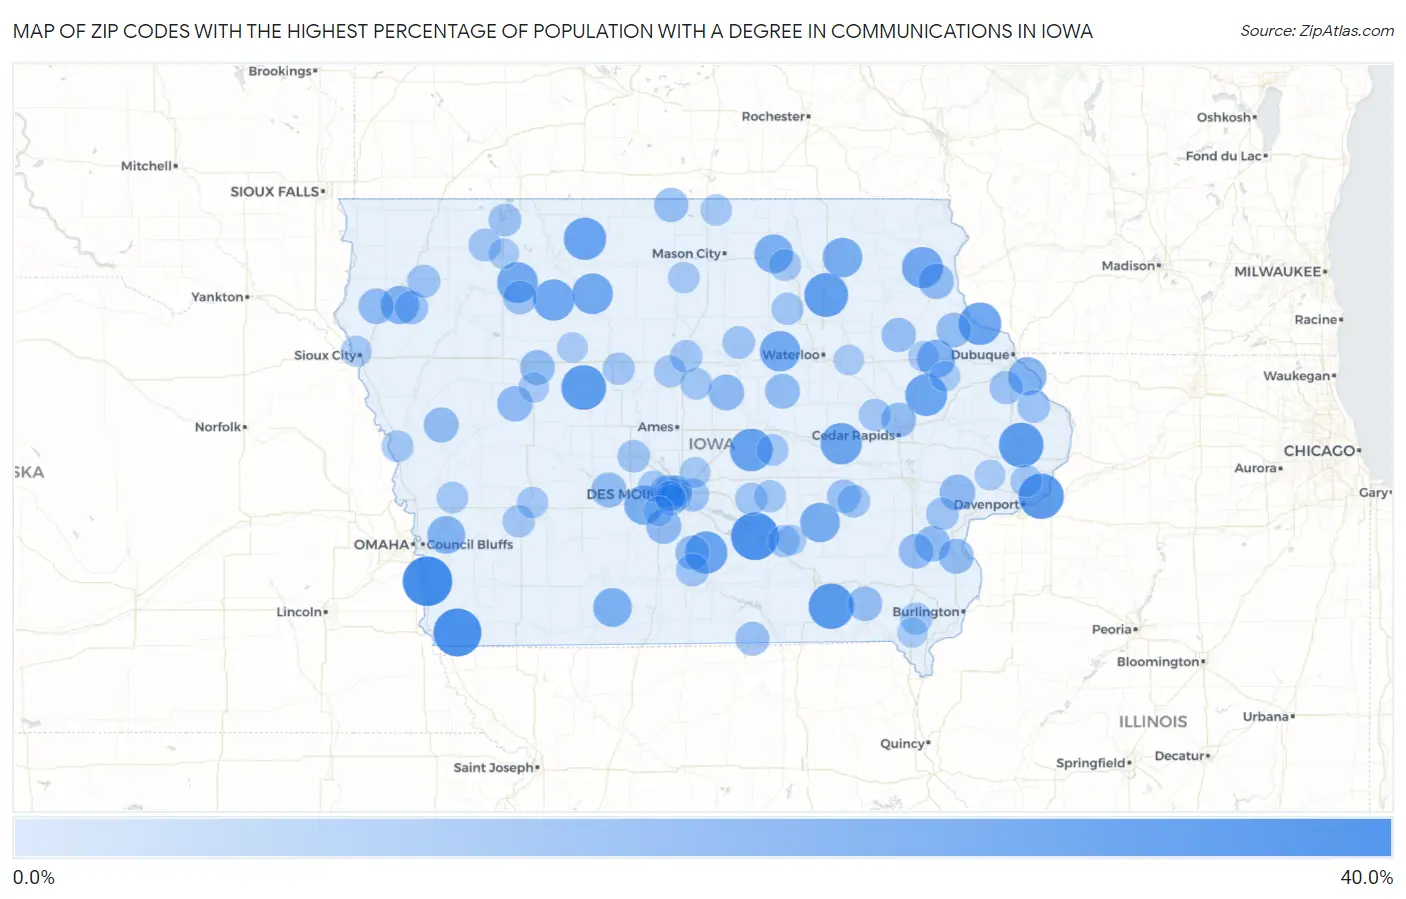
Map of Zip Codes with the Highest Percentage of Population with a Degree in Communications in Iowa
0.0%
40.0%
Zip Codes with the Highest Percentage of Population with a Degree in Communications in Iowa
| Zip Code | % Graduates | vs State | vs National | |
| 1. | 51561 | 31.3% | 3.9%(+27.4)#1 | 4.1%(+27.2)#146 |
| 2. | 51650 | 29.2% | 3.9%(+25.3)#2 | 4.1%(+25.0)#163 |
| 3. | 50119 | 28.9% | 3.9%(+25.0)#3 | 4.1%(+24.8)#167 |
| 4. | 52560 | 25.8% | 3.9%(+21.9)#4 | 4.1%(+21.6)#199 |
| 5. | 52767 | 25.7% | 3.9%(+21.8)#5 | 4.1%(+21.6)#200 |
| 6. | 50538 | 25.0% | 3.9%(+21.1)#6 | 4.1%(+20.9)#210 |
| 7. | 52774 | 25.0% | 3.9%(+21.1)#7 | 4.1%(+20.9)#219 |
| 8. | 50631 | 23.8% | 3.9%(+19.9)#8 | 4.1%(+19.7)#239 |
| 9. | 50141 | 22.4% | 3.9%(+18.6)#9 | 4.1%(+18.3)#260 |
| 10. | 52066 | 22.2% | 3.9%(+18.3)#10 | 4.1%(+18.1)#269 |
| 11. | 50539 | 22.0% | 3.9%(+18.1)#11 | 4.1%(+17.9)#274 |
| 12. | 50139 | 21.8% | 3.9%(+17.9)#12 | 4.1%(+17.7)#281 |
| 13. | 52219 | 21.4% | 3.9%(+17.5)#13 | 4.1%(+17.3)#287 |
| 14. | 52257 | 20.8% | 3.9%(+16.9)#14 | 4.1%(+16.7)#307 |
| 15. | 50546 | 20.5% | 3.9%(+16.6)#15 | 4.1%(+16.4)#314 |
| 16. | 52156 | 20.4% | 3.9%(+16.5)#16 | 4.1%(+16.3)#319 |
| 17. | 51366 | 20.0% | 3.9%(+16.1)#17 | 4.1%(+15.9)#329 |
| 18. | 50570 | 20.0% | 3.9%(+16.1)#18 | 4.1%(+15.9)#332 |
| 19. | 50673 | 19.4% | 3.9%(+15.6)#19 | 4.1%(+15.3)#350 |
| 20. | 50268 | 18.5% | 3.9%(+14.6)#20 | 4.1%(+14.4)#384 |
| 21. | 52154 | 18.4% | 3.9%(+14.5)#21 | 4.1%(+14.2)#390 |
| 22. | 50038 | 17.9% | 3.9%(+14.1)#22 | 4.1%(+13.8)#398 |
| 23. | 50435 | 17.5% | 3.9%(+13.6)#23 | 4.1%(+13.3)#420 |
| 24. | 50863 | 17.3% | 3.9%(+13.4)#24 | 4.1%(+13.2)#425 |
| 25. | 52036 | 16.7% | 3.9%(+12.8)#25 | 4.1%(+12.5)#462 |
| 26. | 52071 | 16.7% | 3.9%(+12.8)#26 | 4.1%(+12.5)#464 |
| 27. | 51045 | 16.7% | 3.9%(+12.8)#27 | 4.1%(+12.5)#466 |
| 28. | 51548 | 16.2% | 3.9%(+12.3)#28 | 4.1%(+12.0)#485 |
| 29. | 50206 | 13.6% | 3.9%(+9.72)#29 | 4.1%(+9.47)#647 |
| 30. | 52720 | 13.5% | 3.9%(+9.63)#30 | 4.1%(+9.38)#656 |
| 31. | 52047 | 13.3% | 3.9%(+9.45)#31 | 4.1%(+9.20)#671 |
| 32. | 52737 | 13.3% | 3.9%(+9.45)#32 | 4.1%(+9.20)#674 |
| 33. | 51008 | 13.3% | 3.9%(+9.45)#33 | 4.1%(+9.20)#676 |
| 34. | 51436 | 13.2% | 3.9%(+9.35)#34 | 4.1%(+9.10)#684 |
| 35. | 50160 | 13.0% | 3.9%(+9.08)#35 | 4.1%(+8.83)#709 |
| 36. | 50233 | 12.7% | 3.9%(+8.84)#36 | 4.1%(+8.59)#733 |
| 37. | 51060 | 12.7% | 3.9%(+8.81)#37 | 4.1%(+8.56)#739 |
| 38. | 52653 | 12.6% | 3.9%(+8.76)#38 | 4.1%(+8.51)#747 |
| 39. | 50561 | 12.6% | 3.9%(+8.72)#39 | 4.1%(+8.47)#752 |
| 40. | 50652 | 12.5% | 3.9%(+8.61)#40 | 4.1%(+8.36)#766 |
| 41. | 52621 | 12.4% | 3.9%(+8.48)#41 | 4.1%(+8.24)#777 |
| 42. | 52328 | 12.3% | 3.9%(+8.38)#42 | 4.1%(+8.14)#783 |
| 43. | 52035 | 12.2% | 3.9%(+8.33)#43 | 4.1%(+8.08)#791 |
| 44. | 52535 | 12.2% | 3.9%(+8.31)#44 | 4.1%(+8.06)#795 |
| 45. | 50311 | 12.0% | 3.9%(+8.10)#45 | 4.1%(+7.86)#822 |
| 46. | 50650 | 11.8% | 3.9%(+7.88)#46 | 4.1%(+7.63)#852 |
| 47. | 50145 | 11.6% | 3.9%(+7.74)#47 | 4.1%(+7.49)#875 |
| 48. | 50473 | 11.6% | 3.9%(+7.71)#48 | 4.1%(+7.46)#881 |
| 49. | 52549 | 11.1% | 3.9%(+7.22)#49 | 4.1%(+6.98)#957 |
| 50. | 50565 | 11.1% | 3.9%(+7.22)#50 | 4.1%(+6.98)#960 |
| 51. | 51050 | 10.8% | 3.9%(+6.93)#51 | 4.1%(+6.68)#1,005 |
| 52. | 52308 | 10.8% | 3.9%(+6.92)#52 | 4.1%(+6.68)#1,008 |
| 53. | 52079 | 10.6% | 3.9%(+6.73)#53 | 4.1%(+6.48)#1,042 |
| 54. | 51022 | 10.3% | 3.9%(+6.41)#54 | 4.1%(+6.16)#1,087 |
| 55. | 50327 | 10.3% | 3.9%(+6.37)#55 | 4.1%(+6.12)#1,095 |
| 56. | 50151 | 10.1% | 3.9%(+6.24)#56 | 4.1%(+5.99)#1,113 |
| 57. | 52075 | 10.0% | 3.9%(+6.11)#57 | 4.1%(+5.86)#1,149 |
| 58. | 51338 | 9.9% | 3.9%(+6.04)#58 | 4.1%(+5.79)#1,167 |
| 59. | 51331 | 9.8% | 3.9%(+5.91)#59 | 4.1%(+5.66)#1,197 |
| 60. | 52766 | 9.7% | 3.9%(+5.83)#60 | 4.1%(+5.59)#1,212 |
| 61. | 52316 | 9.7% | 3.9%(+5.81)#61 | 4.1%(+5.56)#1,217 |
| 62. | 50601 | 9.7% | 3.9%(+5.77)#62 | 4.1%(+5.52)#1,225 |
| 63. | 50039 | 9.6% | 3.9%(+5.73)#63 | 4.1%(+5.48)#1,234 |
| 64. | 50309 | 9.5% | 3.9%(+5.63)#64 | 4.1%(+5.38)#1,264 |
| 65. | 50271 | 9.3% | 3.9%(+5.45)#65 | 4.1%(+5.20)#1,320 |
| 66. | 50022 | 9.3% | 3.9%(+5.37)#66 | 4.1%(+5.12)#1,338 |
| 67. | 50619 | 9.3% | 3.9%(+5.36)#67 | 4.1%(+5.12)#1,339 |
| 68. | 50569 | 9.2% | 3.9%(+5.34)#68 | 4.1%(+5.10)#1,346 |
| 69. | 50232 | 9.2% | 3.9%(+5.29)#69 | 4.1%(+5.04)#1,365 |
| 70. | 50324 | 9.2% | 3.9%(+5.28)#70 | 4.1%(+5.03)#1,372 |
| 71. | 52332 | 9.1% | 3.9%(+5.24)#71 | 4.1%(+4.99)#1,384 |
| 72. | 52534 | 9.1% | 3.9%(+5.20)#72 | 4.1%(+4.96)#1,404 |
| 73. | 52657 | 9.1% | 3.9%(+5.20)#73 | 4.1%(+4.96)#1,407 |
| 74. | 50616 | 8.9% | 3.9%(+5.03)#74 | 4.1%(+4.78)#1,470 |
| 75. | 50153 | 8.9% | 3.9%(+5.02)#75 | 4.1%(+4.78)#1,471 |
| 76. | 50132 | 8.9% | 3.9%(+5.00)#76 | 4.1%(+4.75)#1,478 |
| 77. | 50106 | 8.7% | 3.9%(+4.84)#77 | 4.1%(+4.59)#1,533 |
| 78. | 52748 | 8.7% | 3.9%(+4.82)#78 | 4.1%(+4.58)#1,542 |
| 79. | 51523 | 8.6% | 3.9%(+4.73)#79 | 4.1%(+4.49)#1,582 |
| 80. | 50230 | 8.5% | 3.9%(+4.59)#80 | 4.1%(+4.34)#1,637 |
| 81. | 51563 | 8.5% | 3.9%(+4.56)#81 | 4.1%(+4.32)#1,657 |
| 82. | 50314 | 8.4% | 3.9%(+4.55)#82 | 4.1%(+4.30)#1,663 |
| 83. | 50449 | 8.3% | 3.9%(+4.45)#83 | 4.1%(+4.20)#1,710 |
| 84. | 50459 | 8.1% | 3.9%(+4.23)#84 | 4.1%(+3.98)#1,811 |
| 85. | 50042 | 8.1% | 3.9%(+4.22)#85 | 4.1%(+3.97)#1,821 |
| 86. | 50323 | 8.1% | 3.9%(+4.18)#86 | 4.1%(+3.93)#1,842 |
| 87. | 50321 | 8.0% | 3.9%(+4.12)#87 | 4.1%(+3.88)#1,873 |
| 88. | 50035 | 7.7% | 3.9%(+3.77)#88 | 4.1%(+3.53)#2,092 |
| 89. | 51103 | 7.6% | 3.9%(+3.76)#89 | 4.1%(+3.51)#2,097 |
| 90. | 52057 | 7.4% | 3.9%(+3.55)#90 | 4.1%(+3.30)#2,241 |
| 91. | 51301 | 7.3% | 3.9%(+3.37)#91 | 4.1%(+3.12)#2,393 |
| 92. | 50648 | 7.2% | 3.9%(+3.29)#92 | 4.1%(+3.04)#2,453 |
| 93. | 52765 | 7.1% | 3.9%(+3.25)#93 | 4.1%(+3.01)#2,489 |
| 94. | 50563 | 7.0% | 3.9%(+3.16)#94 | 4.1%(+2.91)#2,554 |
| 95. | 52237 | 7.0% | 3.9%(+3.14)#95 | 4.1%(+2.90)#2,579 |
| 96. | 51433 | 7.0% | 3.9%(+3.13)#96 | 4.1%(+2.88)#2,593 |
| 97. | 52625 | 6.9% | 3.9%(+3.06)#97 | 4.1%(+2.81)#2,654 |
| 98. | 50312 | 6.9% | 3.9%(+3.04)#98 | 4.1%(+2.79)#2,677 |
| 99. | 52595 | 6.8% | 3.9%(+2.87)#99 | 4.1%(+2.62)#2,842 |
| 100. | 50061 | 6.8% | 3.9%(+2.87)#100 | 4.1%(+2.62)#2,844 |
Common Questions
What are the Top 10 Zip Codes with the Highest Percentage of Population with a Degree in Communications in Iowa?
Top 10 Zip Codes with the Highest Percentage of Population with a Degree in Communications in Iowa are:
What zip code has the Highest Percentage of Population with a Degree in Communications in Iowa?
51561 has the Highest Percentage of Population with a Degree in Communications in Iowa with 31.3%.
What is the Percentage of Population with a Degree in Communications in the State of Iowa?
Percentage of Population with a Degree in Communications in Iowa is 3.9%.
What is the Percentage of Population with a Degree in Communications in the United States?
Percentage of Population with a Degree in Communications in the United States is 4.1%.