Jesup, IA Map & Demographics
Jesup Map
Jesup Overview
$31,799
PER CAPITA INCOME
$85,268
AVG FAMILY INCOME
$83,519
AVG HOUSEHOLD INCOME
24.2%
WAGE / INCOME GAP [ % ]
75.8¢/ $1
WAGE / INCOME GAP [ $ ]
0.32
INEQUALITY / GINI INDEX
2,502
TOTAL POPULATION
1,350
MALE POPULATION
1,152
FEMALE POPULATION
117.19
MALES / 100 FEMALES
85.33
FEMALES / 100 MALES
33.0
MEDIAN AGE
3.1
AVG FAMILY SIZE
2.8
AVG HOUSEHOLD SIZE
1,332
LABOR FORCE [ PEOPLE ]
69.9%
PERCENT IN LABOR FORCE
4.7%
UNEMPLOYMENT RATE
Jesup Zip Codes
Jesup Area Codes
Income in Jesup
Income Overview in Jesup
Per Capita Income in Jesup is $31,799, while median incomes of families and households are $85,268 and $83,519 respectively.
| Characteristic | Number | Measure |
| Per Capita Income | 2,502 | $31,799 |
| Median Family Income | 708 | $85,268 |
| Mean Family Income | 708 | $94,725 |
| Median Household Income | 890 | $83,519 |
| Mean Household Income | 890 | $87,373 |
| Income Deficit | 708 | $0 |
| Wage / Income Gap (%) | 2,502 | 24.22% |
| Wage / Income Gap ($) | 2,502 | 75.78¢ per $1 |
| Gini / Inequality Index | 2,502 | 0.32 |
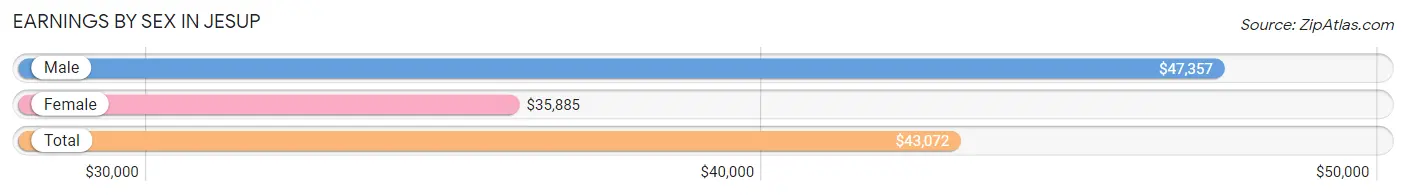
Earnings by Sex in Jesup
Average Earnings in Jesup are $43,072, $47,357 for men and $35,885 for women, a difference of 24.2%.
| Sex | Number | Average Earnings |
| Male | 734 (52.2%) | $47,357 |
| Female | 671 (47.8%) | $35,885 |
| Total | 1,405 (100.0%) | $43,072 |
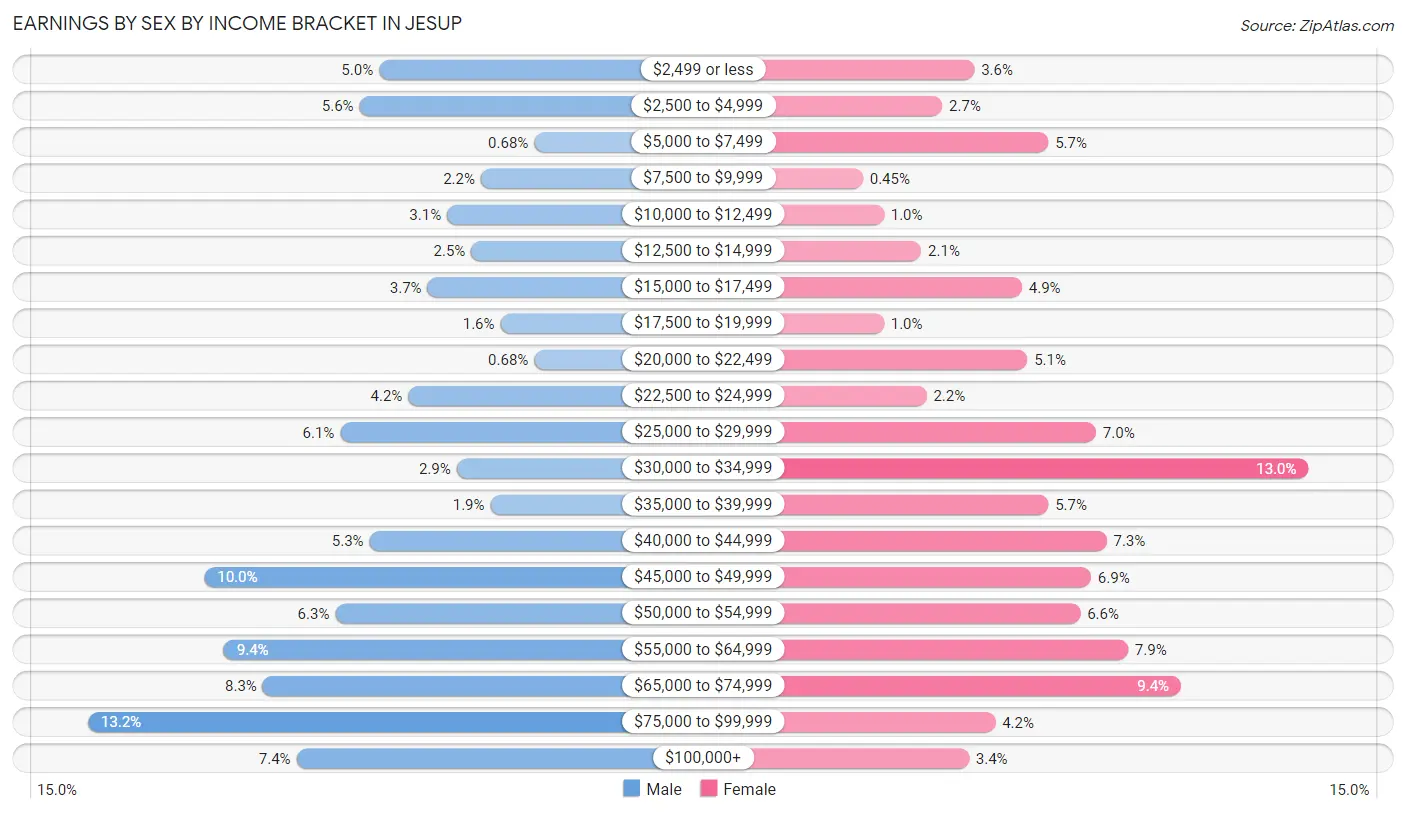
Earnings by Sex by Income Bracket in Jesup
The most common earnings brackets in Jesup are $75,000 to $99,999 for men (97 | 13.2%) and $30,000 to $34,999 for women (87 | 13.0%).
| Income | Male | Female |
| $2,499 or less | 37 (5.0%) | 24 (3.6%) |
| $2,500 to $4,999 | 41 (5.6%) | 18 (2.7%) |
| $5,000 to $7,499 | 5 (0.7%) | 38 (5.7%) |
| $7,500 to $9,999 | 16 (2.2%) | 3 (0.4%) |
| $10,000 to $12,499 | 23 (3.1%) | 7 (1.0%) |
| $12,500 to $14,999 | 18 (2.5%) | 14 (2.1%) |
| $15,000 to $17,499 | 27 (3.7%) | 33 (4.9%) |
| $17,500 to $19,999 | 12 (1.6%) | 7 (1.0%) |
| $20,000 to $22,499 | 5 (0.7%) | 34 (5.1%) |
| $22,500 to $24,999 | 31 (4.2%) | 15 (2.2%) |
| $25,000 to $29,999 | 45 (6.1%) | 47 (7.0%) |
| $30,000 to $34,999 | 21 (2.9%) | 87 (13.0%) |
| $35,000 to $39,999 | 14 (1.9%) | 38 (5.7%) |
| $40,000 to $44,999 | 39 (5.3%) | 49 (7.3%) |
| $45,000 to $49,999 | 73 (10.0%) | 46 (6.9%) |
| $50,000 to $54,999 | 46 (6.3%) | 44 (6.6%) |
| $55,000 to $64,999 | 69 (9.4%) | 53 (7.9%) |
| $65,000 to $74,999 | 61 (8.3%) | 63 (9.4%) |
| $75,000 to $99,999 | 97 (13.2%) | 28 (4.2%) |
| $100,000+ | 54 (7.4%) | 23 (3.4%) |
| Total | 734 (100.0%) | 671 (100.0%) |
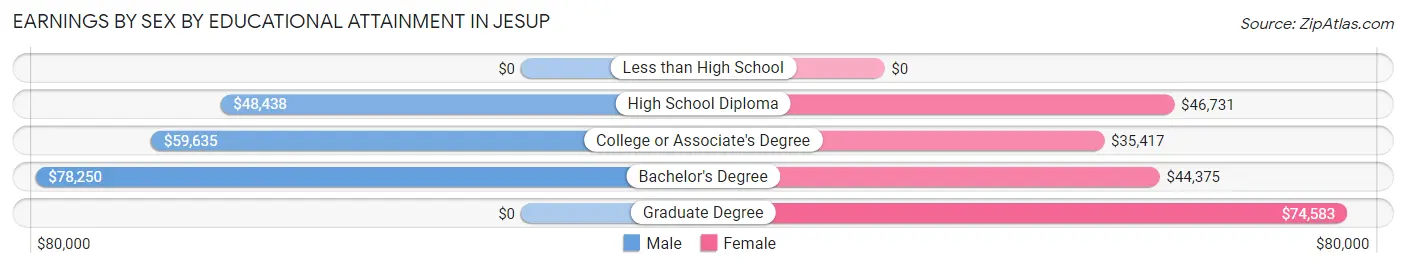
Earnings by Sex by Educational Attainment in Jesup
Average earnings in Jesup are $54,000 for men and $43,831 for women, a difference of 18.8%. Men with an educational attainment of bachelor's degree enjoy the highest average annual earnings of $78,250, while those with high school diploma education earn the least with $48,438. Women with an educational attainment of graduate degree earn the most with the average annual earnings of $74,583, while those with college or associate's degree education have the smallest earnings of $35,417.
| Educational Attainment | Male Income | Female Income |
| Less than High School | - | - |
| High School Diploma | $48,438 | $46,731 |
| College or Associate's Degree | $59,635 | $35,417 |
| Bachelor's Degree | $78,250 | $44,375 |
| Graduate Degree | - | - |
| Total | $54,000 | $43,831 |
Family Income in Jesup
Family Income Brackets in Jesup
According to the Jesup family income data, there are 174 families falling into the $100,000 to $149,999 income range, which is the most common income bracket and makes up 24.6% of all families.
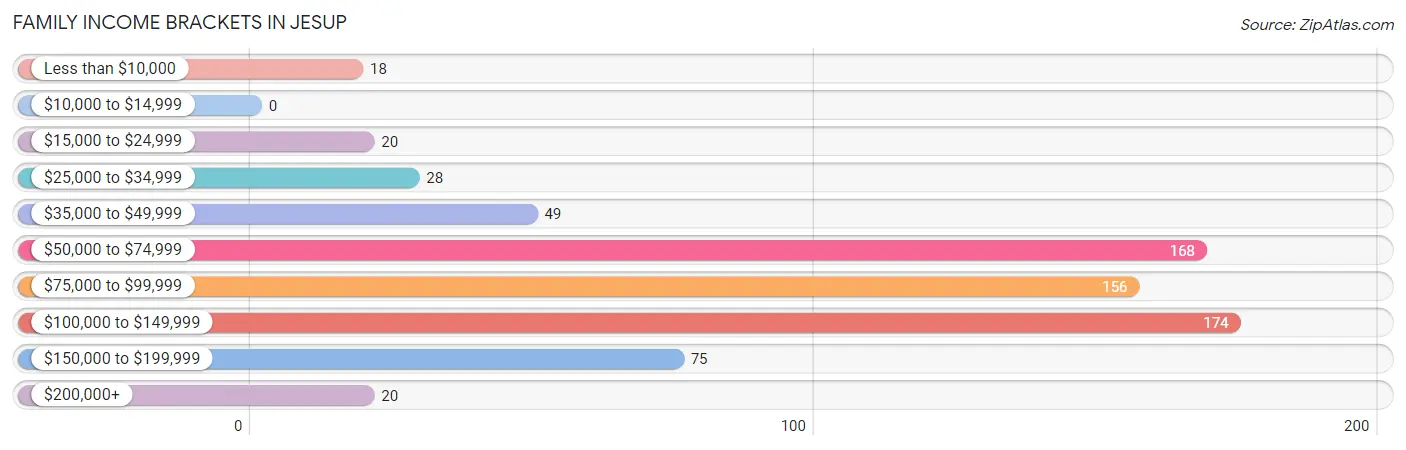
| Income Bracket | # Families | % Families |
| Less than $10,000 | 18 | 2.5% |
| $10,000 to $14,999 | 0 | 0.0% |
| $15,000 to $24,999 | 20 | 2.8% |
| $25,000 to $34,999 | 28 | 4.0% |
| $35,000 to $49,999 | 49 | 6.9% |
| $50,000 to $74,999 | 168 | 23.7% |
| $75,000 to $99,999 | 156 | 22.0% |
| $100,000 to $149,999 | 174 | 24.6% |
| $150,000 to $199,999 | 75 | 10.6% |
| $200,000+ | 20 | 2.8% |
Family Income by Famaliy Size in Jesup
5-person families (77 | 10.9%) account for the highest median family income in Jesup with $190,938 per family, while 5-person families (77 | 10.9%) have the highest median income of $38,188 per family member.
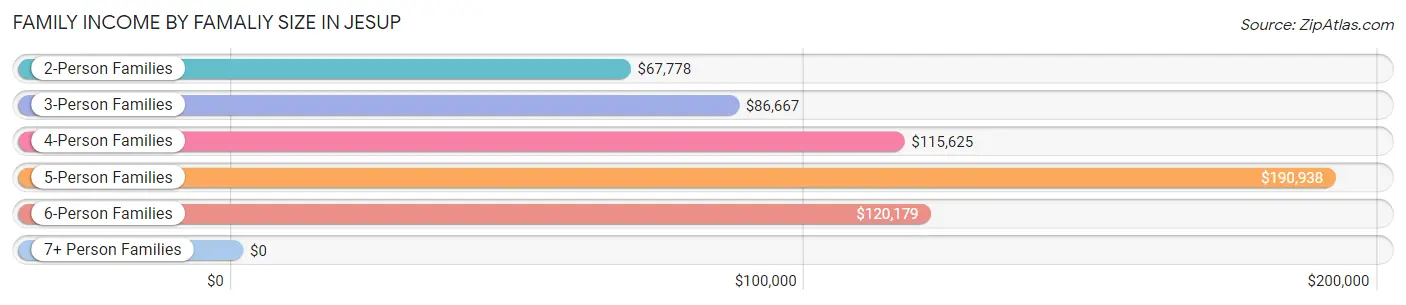
| Income Bracket | # Families | Median Income |
| 2-Person Families | 334 (47.2%) | $67,778 |
| 3-Person Families | 198 (28.0%) | $86,667 |
| 4-Person Families | 74 (10.4%) | $115,625 |
| 5-Person Families | 77 (10.9%) | $190,938 |
| 6-Person Families | 25 (3.5%) | $120,179 |
| 7+ Person Families | 0 (0.0%) | $0 |
| Total | 708 (100.0%) | $85,268 |
Family Income by Number of Earners in Jesup
The median family income in Jesup is $85,268, with families comprising 3+ earners (87) having the highest median family income of $114,044, while families with 1 earner (159) have the lowest median family income of $53,558, accounting for 12.3% and 22.5% of families, respectively.
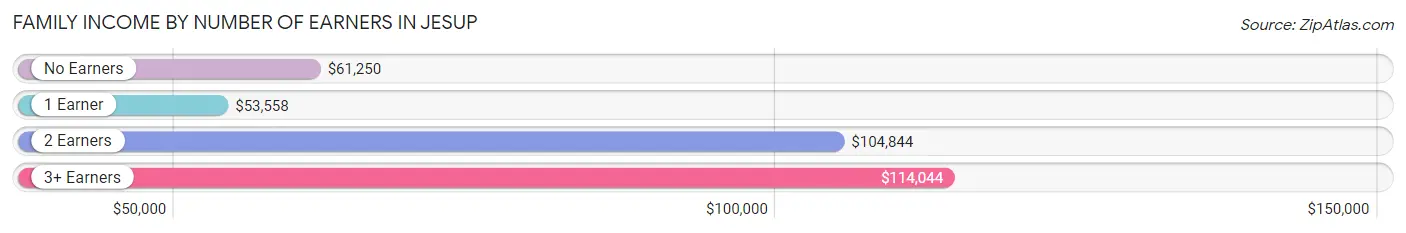
| Number of Earners | # Families | Median Income |
| No Earners | 73 (10.3%) | $61,250 |
| 1 Earner | 159 (22.5%) | $53,558 |
| 2 Earners | 389 (54.9%) | $104,844 |
| 3+ Earners | 87 (12.3%) | $114,044 |
| Total | 708 (100.0%) | $85,268 |
Household Income in Jesup
Household Income Brackets in Jesup
With 217 households falling in the category, the $100,000 to $149,999 income range is the most frequent in Jesup, accounting for 24.4% of all households. In contrast, only 7 households (0.8%) fall into the $10,000 to $14,999 income bracket, making it the least populous group.
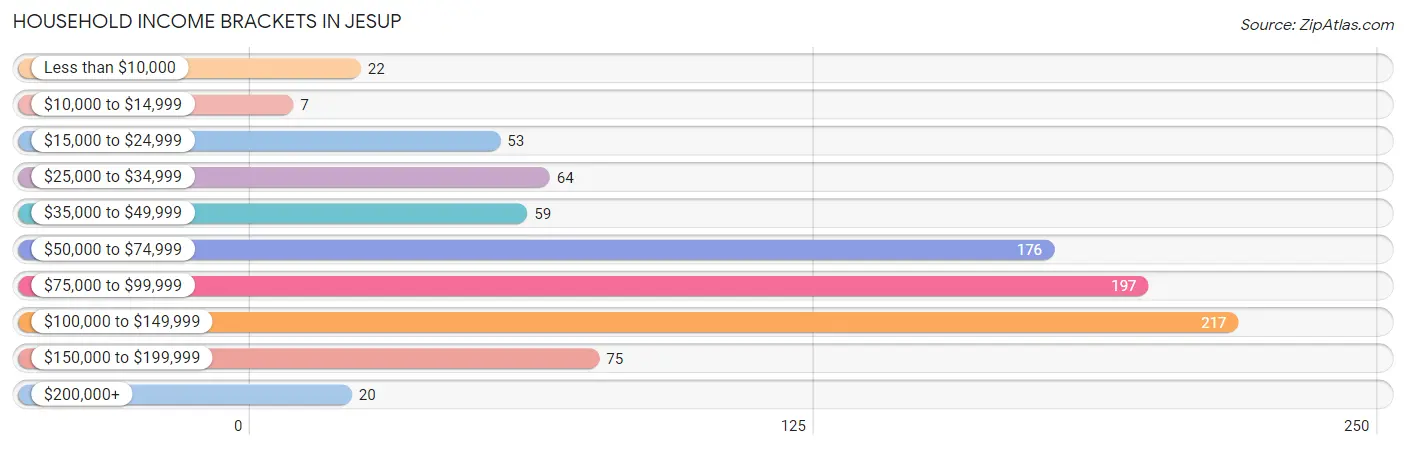
| Income Bracket | # Households | % Households |
| Less than $10,000 | 22 | 2.5% |
| $10,000 to $14,999 | 7 | 0.8% |
| $15,000 to $24,999 | 53 | 6.0% |
| $25,000 to $34,999 | 64 | 7.2% |
| $35,000 to $49,999 | 59 | 6.6% |
| $50,000 to $74,999 | 176 | 19.8% |
| $75,000 to $99,999 | 197 | 22.1% |
| $100,000 to $149,999 | 217 | 24.4% |
| $150,000 to $199,999 | 75 | 8.4% |
| $200,000+ | 20 | 2.2% |
Household Income by Householder Age in Jesup
The median household income in Jesup is $83,519, with the highest median household income of $97,604 found in the 45 to 64 years age bracket for the primary householder. A total of 273 households (30.7%) fall into this category. Meanwhile, the 15 to 24 years age bracket for the primary householder has the lowest median household income of $58,482, with 58 households (6.5%) in this group.
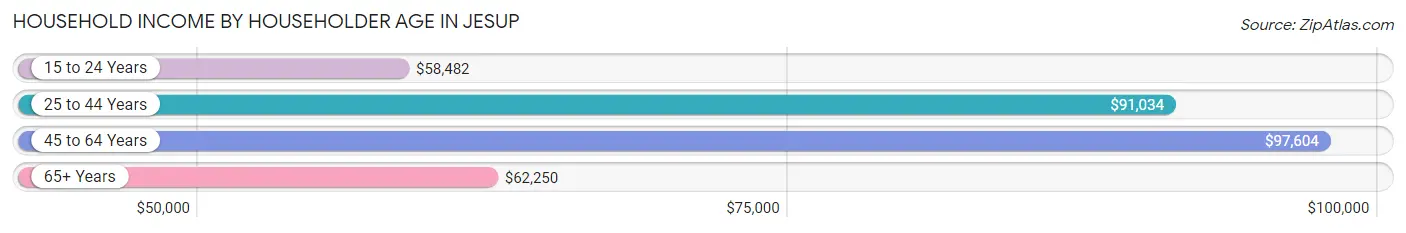
| Income Bracket | # Households | Median Income |
| 15 to 24 Years | 58 (6.5%) | $58,482 |
| 25 to 44 Years | 346 (38.9%) | $91,034 |
| 45 to 64 Years | 273 (30.7%) | $97,604 |
| 65+ Years | 213 (23.9%) | $62,250 |
| Total | 890 (100.0%) | $83,519 |
Poverty in Jesup
Income Below Poverty by Sex and Age in Jesup
With 7.2% poverty level for males and 5.4% for females among the residents of Jesup, 65 to 74 year old males and 16 and 17 year old females are the most vulnerable to poverty, with 45 males (34.1%) and 13 females (30.2%) in their respective age groups living below the poverty level.
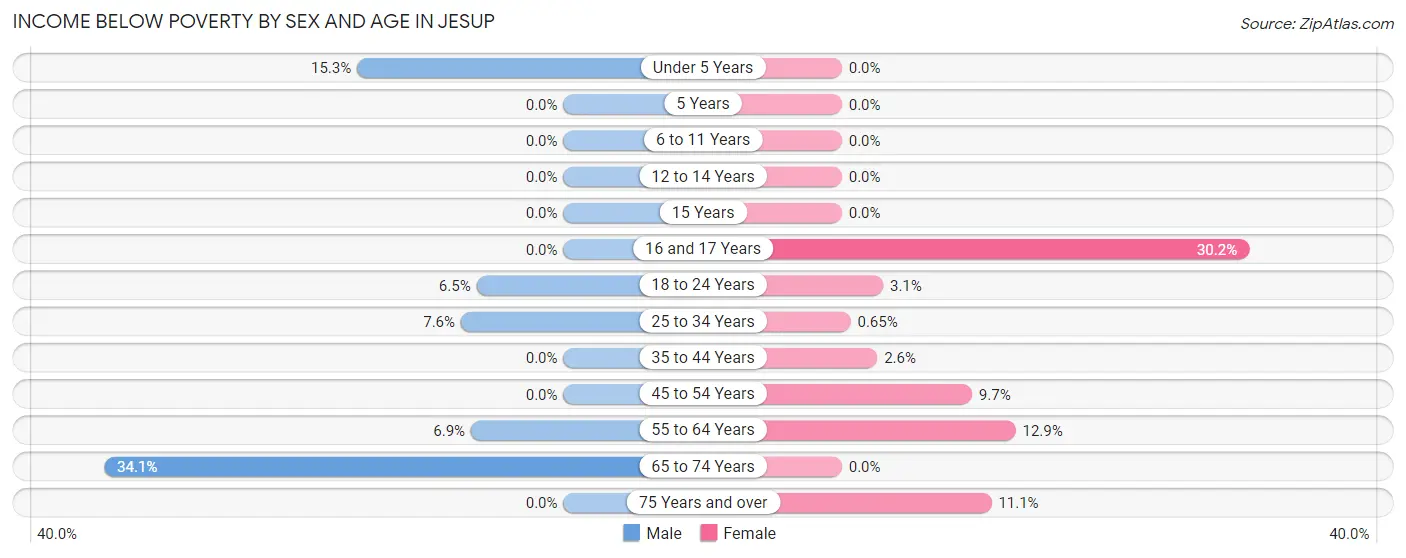
| Age Bracket | Male | Female |
| Under 5 Years | 17 (15.3%) | 0 (0.0%) |
| 5 Years | 0 (0.0%) | 0 (0.0%) |
| 6 to 11 Years | 0 (0.0%) | 0 (0.0%) |
| 12 to 14 Years | 0 (0.0%) | 0 (0.0%) |
| 15 Years | 0 (0.0%) | 0 (0.0%) |
| 16 and 17 Years | 0 (0.0%) | 13 (30.2%) |
| 18 to 24 Years | 14 (6.5%) | 3 (3.1%) |
| 25 to 34 Years | 14 (7.6%) | 1 (0.6%) |
| 35 to 44 Years | 0 (0.0%) | 4 (2.6%) |
| 45 to 54 Years | 0 (0.0%) | 17 (9.7%) |
| 55 to 64 Years | 7 (6.9%) | 16 (12.9%) |
| 65 to 74 Years | 45 (34.1%) | 0 (0.0%) |
| 75 Years and over | 0 (0.0%) | 8 (11.1%) |
| Total | 97 (7.2%) | 62 (5.4%) |
Income Above Poverty by Sex and Age in Jesup
According to the poverty statistics in Jesup, males aged 5 years and females aged under 5 years are the age groups that are most secure financially, with 100.0% of males and 100.0% of females in these age groups living above the poverty line.
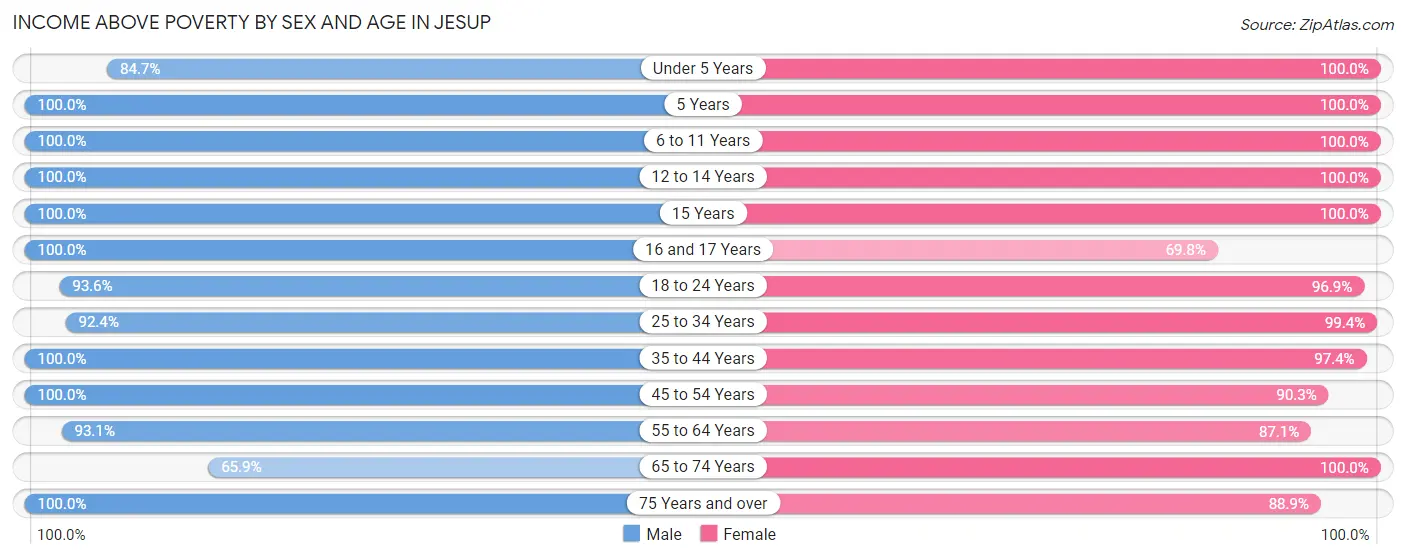
| Age Bracket | Male | Female |
| Under 5 Years | 94 (84.7%) | 81 (100.0%) |
| 5 Years | 40 (100.0%) | 4 (100.0%) |
| 6 to 11 Years | 118 (100.0%) | 100 (100.0%) |
| 12 to 14 Years | 59 (100.0%) | 53 (100.0%) |
| 15 Years | 6 (100.0%) | 25 (100.0%) |
| 16 and 17 Years | 35 (100.0%) | 30 (69.8%) |
| 18 to 24 Years | 203 (93.5%) | 95 (96.9%) |
| 25 to 34 Years | 170 (92.4%) | 153 (99.4%) |
| 35 to 44 Years | 171 (100.0%) | 148 (97.4%) |
| 45 to 54 Years | 113 (100.0%) | 159 (90.3%) |
| 55 to 64 Years | 95 (93.1%) | 108 (87.1%) |
| 65 to 74 Years | 87 (65.9%) | 70 (100.0%) |
| 75 Years and over | 62 (100.0%) | 64 (88.9%) |
| Total | 1,253 (92.8%) | 1,090 (94.6%) |
Income Below Poverty Among Married-Couple Families in Jesup
The poverty statistics for married-couple families in Jesup show that 2.9% or 16 of the total 555 families live below the poverty line. Families with no children have the highest poverty rate of 5.2%, comprising of 16 families. On the other hand, families with 1 or 2 children have the lowest poverty rate of 0.0%, which includes 0 families.
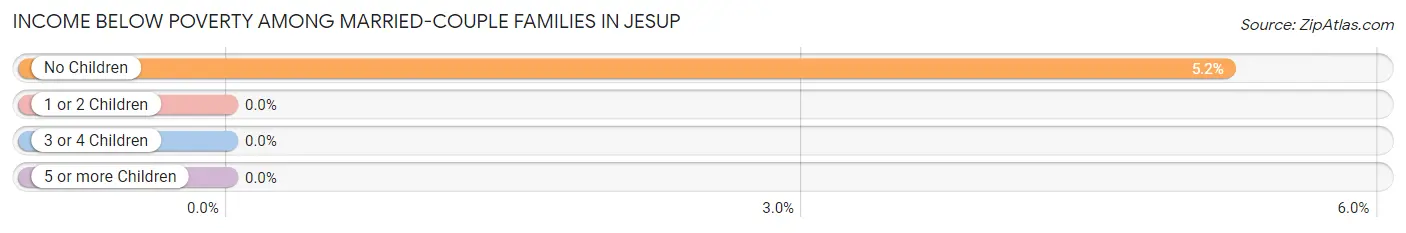
| Children | Above Poverty | Below Poverty |
| No Children | 291 (94.8%) | 16 (5.2%) |
| 1 or 2 Children | 173 (100.0%) | 0 (0.0%) |
| 3 or 4 Children | 75 (100.0%) | 0 (0.0%) |
| 5 or more Children | 0 (0.0%) | 0 (0.0%) |
| Total | 539 (97.1%) | 16 (2.9%) |
Income Below Poverty Among Single-Parent Households in Jesup
According to the poverty data in Jesup, 24.6% or 14 single-father households and 8.3% or 8 single-mother households are living below the poverty line. Among single-father households, those with 1 or 2 children have the highest poverty rate, with 14 households (28.6%) experiencing poverty. Likewise, among single-mother households, those with no children have the highest poverty rate, with 4 households (28.6%) falling below the poverty line.
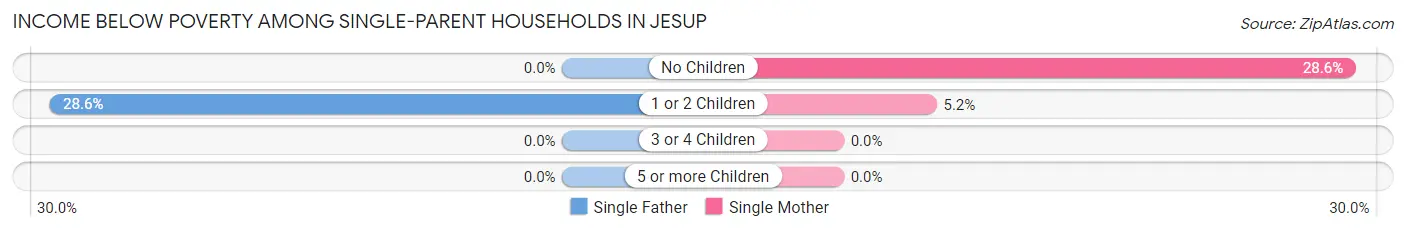
| Children | Single Father | Single Mother |
| No Children | 0 (0.0%) | 4 (28.6%) |
| 1 or 2 Children | 14 (28.6%) | 4 (5.2%) |
| 3 or 4 Children | 0 (0.0%) | 0 (0.0%) |
| 5 or more Children | 0 (0.0%) | 0 (0.0%) |
| Total | 14 (24.6%) | 8 (8.3%) |
Income Below Poverty Among Married-Couple vs Single-Parent Households in Jesup
The poverty data for Jesup shows that 16 of the married-couple family households (2.9%) and 22 of the single-parent households (14.4%) are living below the poverty level. Within the married-couple family households, those with no children have the highest poverty rate, with 16 households (5.2%) falling below the poverty line. Among the single-parent households, those with no children have the highest poverty rate, with 4 household (18.2%) living below poverty.
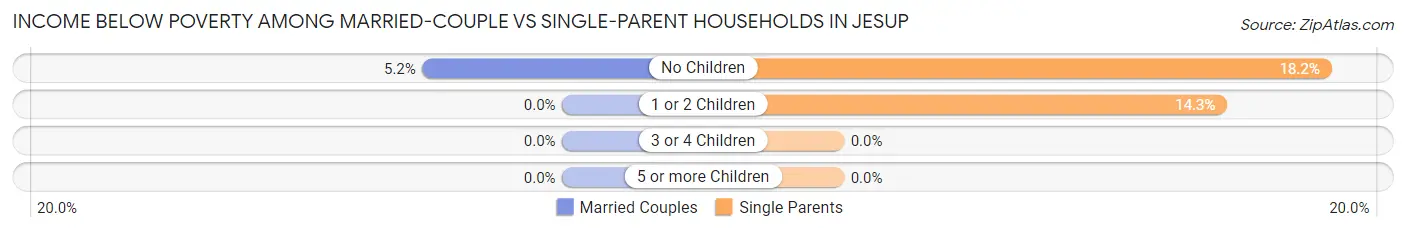
| Children | Married-Couple Families | Single-Parent Households |
| No Children | 16 (5.2%) | 4 (18.2%) |
| 1 or 2 Children | 0 (0.0%) | 18 (14.3%) |
| 3 or 4 Children | 0 (0.0%) | 0 (0.0%) |
| 5 or more Children | 0 (0.0%) | 0 (0.0%) |
| Total | 16 (2.9%) | 22 (14.4%) |
Race in Jesup
The most populous races in Jesup are White / Caucasian (2,459 | 98.3%), Two or more Races (42 | 1.7%), and Hispanic or Latino (29 | 1.2%).
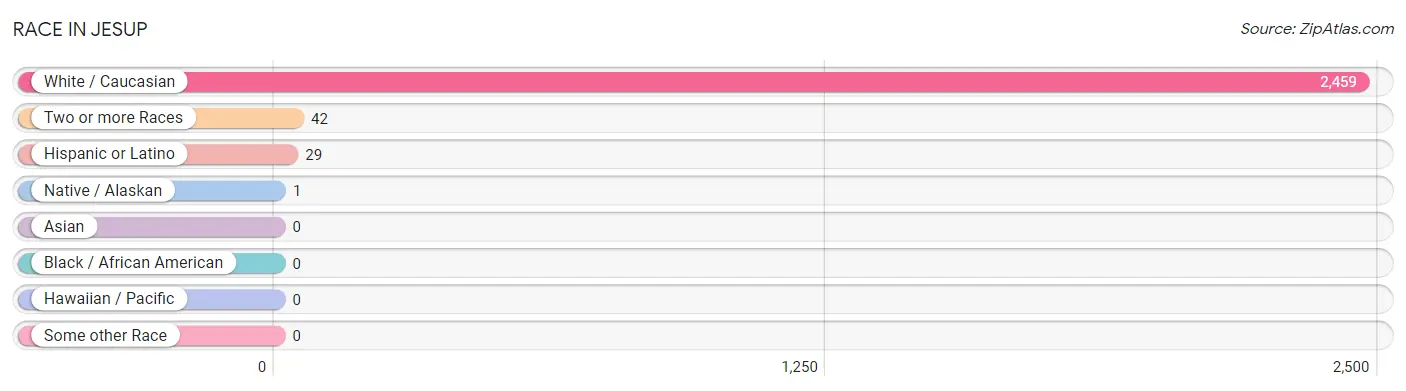
| Race | # Population | % Population |
| Asian | 0 | 0.0% |
| Black / African American | 0 | 0.0% |
| Hawaiian / Pacific | 0 | 0.0% |
| Hispanic or Latino | 29 | 1.2% |
| Native / Alaskan | 1 | 0.0% |
| White / Caucasian | 2,459 | 98.3% |
| Two or more Races | 42 | 1.7% |
| Some other Race | 0 | 0.0% |
| Total | 2,502 | 100.0% |
Ancestry in Jesup
The most populous ancestries reported in Jesup are German (1,175 | 47.0%), English (322 | 12.9%), Irish (227 | 9.1%), American (147 | 5.9%), and Norwegian (107 | 4.3%), together accounting for 79.1% of all Jesup residents.
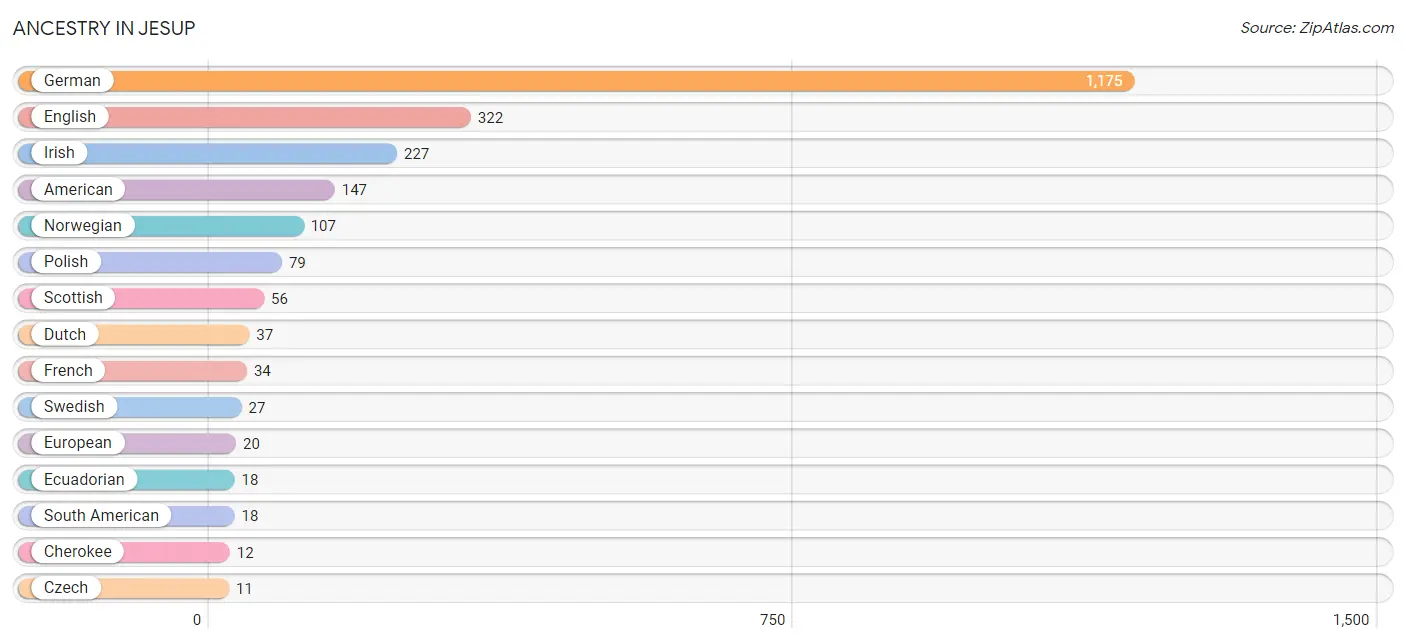
| Ancestry | # Population | % Population |
| American | 147 | 5.9% |
| Cherokee | 12 | 0.5% |
| Czech | 11 | 0.4% |
| Danish | 10 | 0.4% |
| Dutch | 37 | 1.5% |
| Ecuadorian | 18 | 0.7% |
| English | 322 | 12.9% |
| European | 20 | 0.8% |
| French | 34 | 1.4% |
| French Canadian | 3 | 0.1% |
| German | 1,175 | 47.0% |
| Irish | 227 | 9.1% |
| Italian | 4 | 0.2% |
| Mexican | 11 | 0.4% |
| Norwegian | 107 | 4.3% |
| Polish | 79 | 3.2% |
| Scotch-Irish | 7 | 0.3% |
| Scottish | 56 | 2.2% |
| Sioux | 1 | 0.0% |
| South American | 18 | 0.7% |
| Swedish | 27 | 1.1% |
| Welsh | 4 | 0.2% | View All 22 Rows |
Immigrants in Jesup
The most numerous immigrant groups reported in Jesup came from Africa (6 | 0.2%), Eastern Africa (6 | 0.2%), and Somalia (6 | 0.2%), together accounting for 0.7% of all Jesup residents.
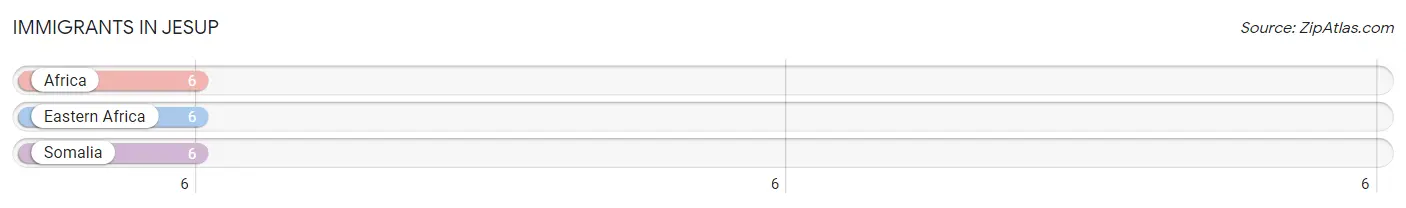
| Immigration Origin | # Population | % Population |
| Africa | 6 | 0.2% |
| Eastern Africa | 6 | 0.2% |
| Somalia | 6 | 0.2% | View All 3 Rows |
Sex and Age in Jesup
Sex and Age in Jesup
The most populous age groups in Jesup are 20 to 24 Years (164 | 12.1%) for men and 30 to 34 Years (102 | 8.8%) for women.
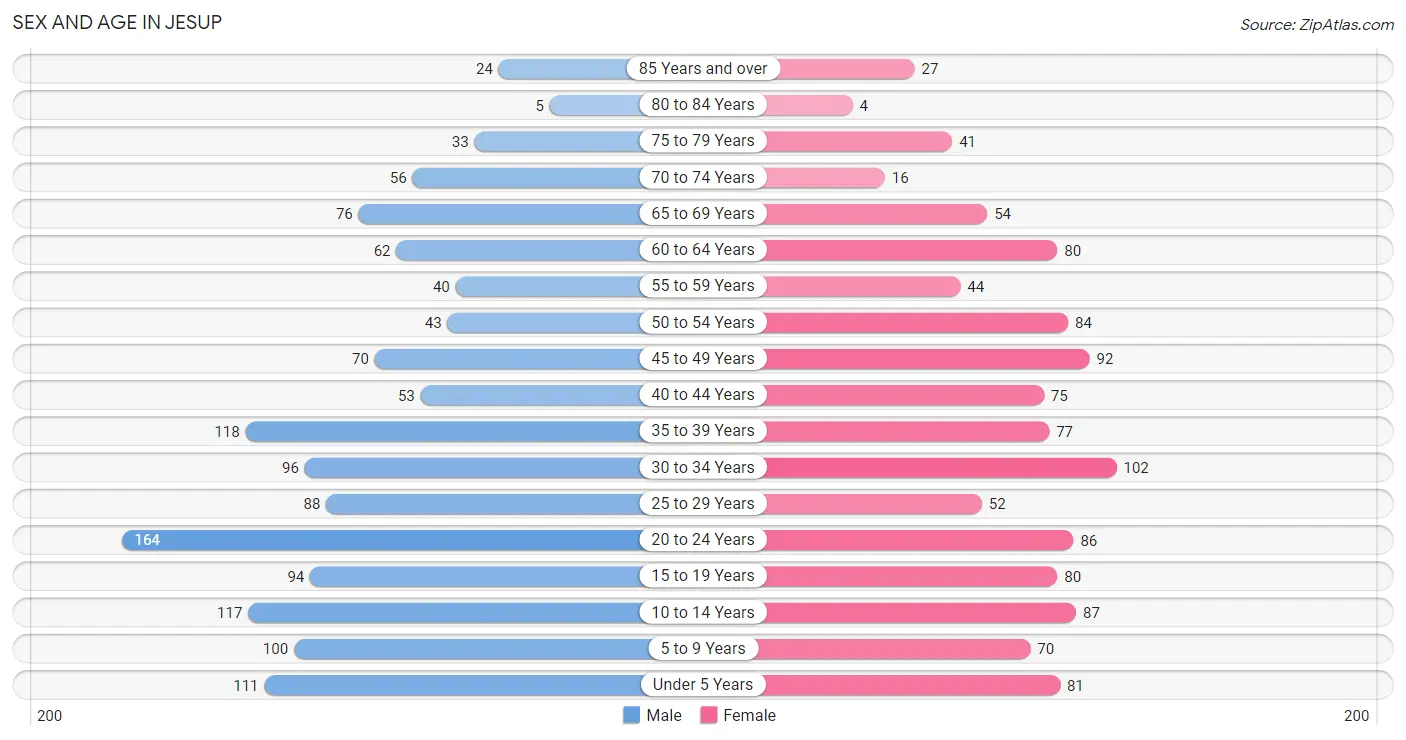
| Age Bracket | Male | Female |
| Under 5 Years | 111 (8.2%) | 81 (7.0%) |
| 5 to 9 Years | 100 (7.4%) | 70 (6.1%) |
| 10 to 14 Years | 117 (8.7%) | 87 (7.5%) |
| 15 to 19 Years | 94 (7.0%) | 80 (6.9%) |
| 20 to 24 Years | 164 (12.1%) | 86 (7.5%) |
| 25 to 29 Years | 88 (6.5%) | 52 (4.5%) |
| 30 to 34 Years | 96 (7.1%) | 102 (8.8%) |
| 35 to 39 Years | 118 (8.7%) | 77 (6.7%) |
| 40 to 44 Years | 53 (3.9%) | 75 (6.5%) |
| 45 to 49 Years | 70 (5.2%) | 92 (8.0%) |
| 50 to 54 Years | 43 (3.2%) | 84 (7.3%) |
| 55 to 59 Years | 40 (3.0%) | 44 (3.8%) |
| 60 to 64 Years | 62 (4.6%) | 80 (6.9%) |
| 65 to 69 Years | 76 (5.6%) | 54 (4.7%) |
| 70 to 74 Years | 56 (4.2%) | 16 (1.4%) |
| 75 to 79 Years | 33 (2.4%) | 41 (3.6%) |
| 80 to 84 Years | 5 (0.4%) | 4 (0.4%) |
| 85 Years and over | 24 (1.8%) | 27 (2.3%) |
| Total | 1,350 (100.0%) | 1,152 (100.0%) |
Families and Households in Jesup
Median Family Size in Jesup
The median family size in Jesup is 3.11 persons per family, with married-couple families (555 | 78.4%) accounting for the largest median family size of 3.25 persons per family. On the other hand, single male/father families (57 | 8.1%) represent the smallest median family size with 2.46 persons per family.
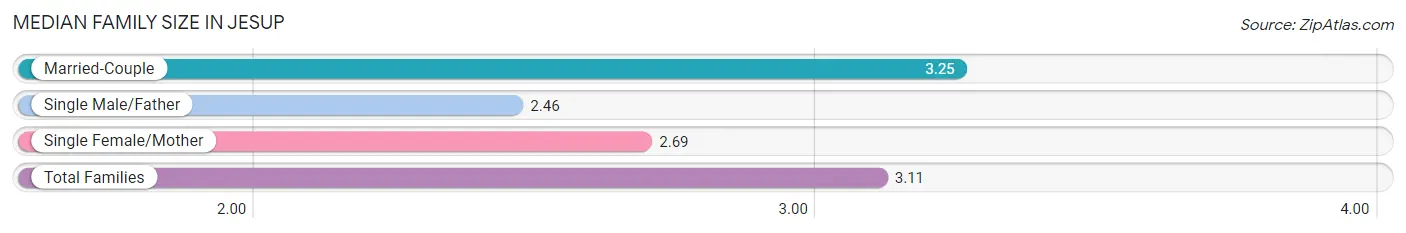
| Family Type | # Families | Family Size |
| Married-Couple | 555 (78.4%) | 3.25 |
| Single Male/Father | 57 (8.1%) | 2.46 |
| Single Female/Mother | 96 (13.6%) | 2.69 |
| Total Families | 708 (100.0%) | 3.11 |
Median Household Size in Jesup
The median household size in Jesup is 2.81 persons per household, with married-couple households (555 | 62.4%) accounting for the largest median household size of 3.25 persons per household. non-family households (182 | 20.4%) represent the smallest median household size with 1.33 persons per household.
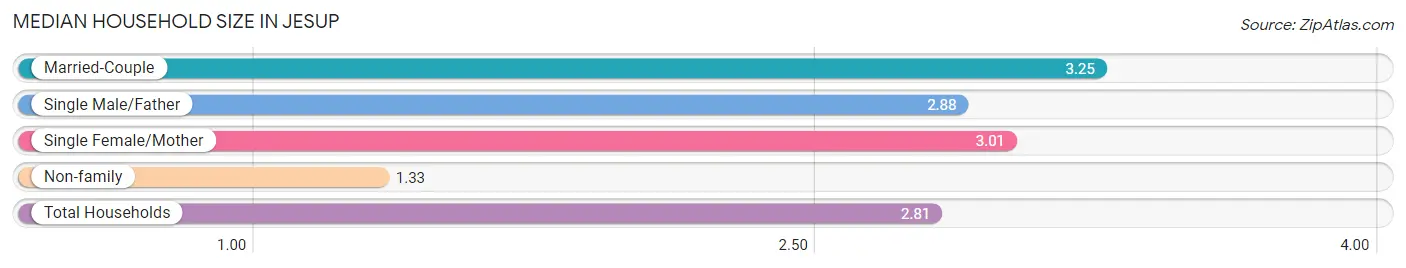
| Household Type | # Households | Household Size |
| Married-Couple | 555 (62.4%) | 3.25 |
| Single Male/Father | 57 (6.4%) | 2.88 |
| Single Female/Mother | 96 (10.8%) | 3.01 |
| Non-family | 182 (20.4%) | 1.33 |
| Total Households | 890 (100.0%) | 2.81 |
Household Size by Marriage Status in Jesup
Out of a total of 890 households in Jesup, 708 (79.5%) are family households, while 182 (20.4%) are nonfamily households. The most numerous type of family households are 2-person households, comprising 301, and the most common type of nonfamily households are 1-person households, comprising 150.
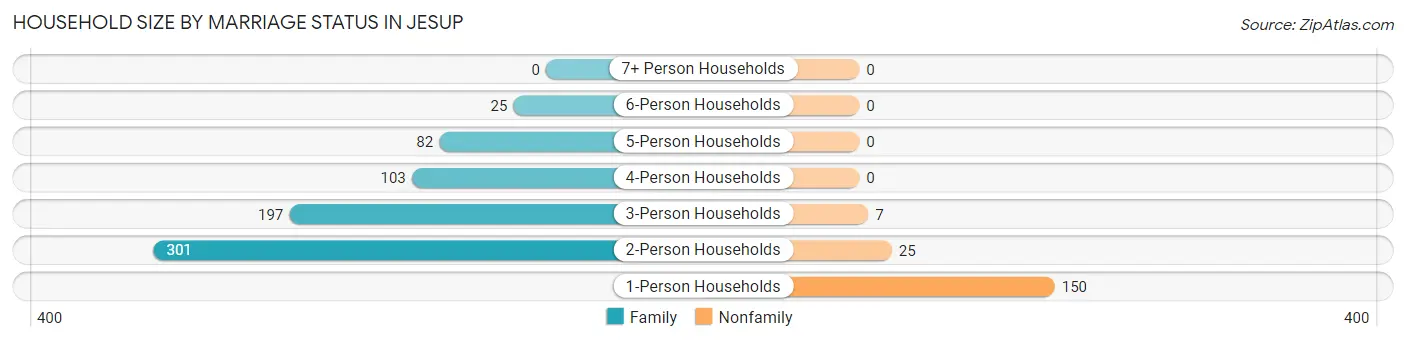
| Household Size | Family Households | Nonfamily Households |
| 1-Person Households | - | 150 (16.9%) |
| 2-Person Households | 301 (33.8%) | 25 (2.8%) |
| 3-Person Households | 197 (22.1%) | 7 (0.8%) |
| 4-Person Households | 103 (11.6%) | 0 (0.0%) |
| 5-Person Households | 82 (9.2%) | 0 (0.0%) |
| 6-Person Households | 25 (2.8%) | 0 (0.0%) |
| 7+ Person Households | 0 (0.0%) | 0 (0.0%) |
| Total | 708 (79.5%) | 182 (20.4%) |
Female Fertility in Jesup
Fertility by Age in Jesup
Average fertility rate in Jesup is 104.0 births per 1,000 women. Women in the age bracket of 20 to 34 years have the highest fertility rate with 188.0 births per 1,000 women. Women in the age bracket of 20 to 34 years acount for 75.0% of all women with births.
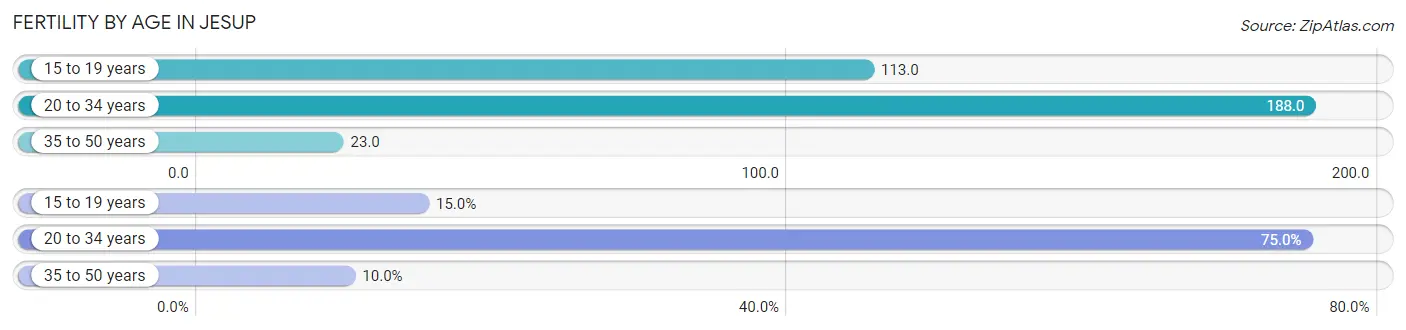
| Age Bracket | Women with Births | Births / 1,000 Women |
| 15 to 19 years | 9 (15.0%) | 113.0 |
| 20 to 34 years | 45 (75.0%) | 188.0 |
| 35 to 50 years | 6 (10.0%) | 23.0 |
| Total | 60 (100.0%) | 104.0 |
Fertility by Age by Marriage Status in Jesup
51.7% of women with births (60) in Jesup are married. The highest percentage of unmarried women with births falls into 15 to 19 years age bracket with 100.0% of them unmarried at the time of birth, while the lowest percentage of unmarried women with births belong to 35 to 50 years age bracket with 0.0% of them unmarried.
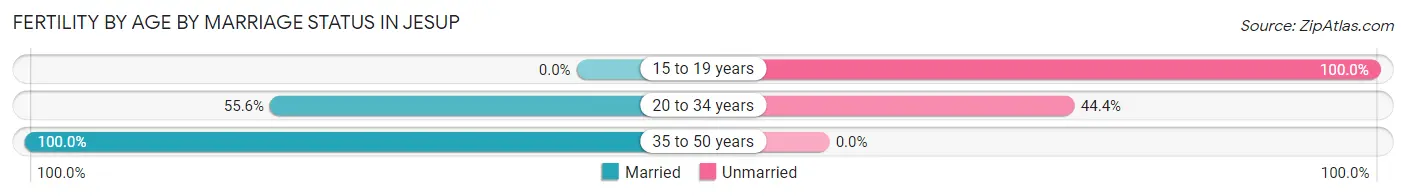
| Age Bracket | Married | Unmarried |
| 15 to 19 years | 0 (0.0%) | 9 (100.0%) |
| 20 to 34 years | 25 (55.6%) | 20 (44.4%) |
| 35 to 50 years | 6 (100.0%) | 0 (0.0%) |
| Total | 31 (51.7%) | 29 (48.3%) |
Fertility by Education in Jesup
Average fertility rate in Jesup is 104.0 births per 1,000 women. Women with the education attainment of graduate degree have the highest fertility rate of 169.0 births per 1,000 women, while women with the education attainment of bachelor's degree have the lowest fertility at 45.0 births per 1,000 women. Women with the education attainment of college or associate's degree represent 36.7% of all women with births.
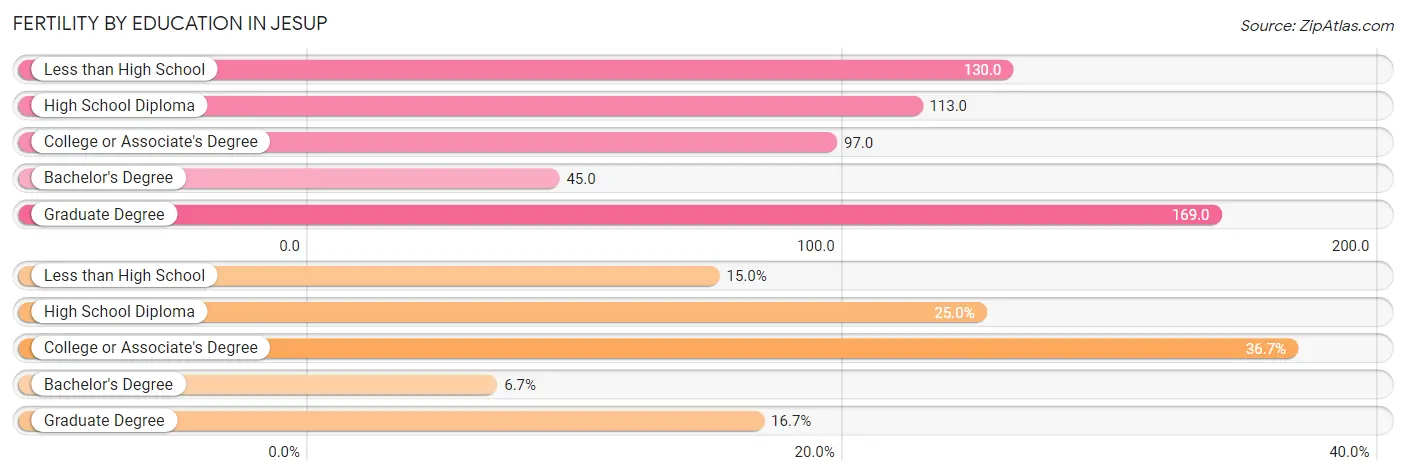
| Educational Attainment | Women with Births | Births / 1,000 Women |
| Less than High School | 9 (15.0%) | 130.0 |
| High School Diploma | 15 (25.0%) | 113.0 |
| College or Associate's Degree | 22 (36.7%) | 97.0 |
| Bachelor's Degree | 4 (6.7%) | 45.0 |
| Graduate Degree | 10 (16.7%) | 169.0 |
| Total | 60 (100.0%) | 104.0 |
Fertility by Education by Marriage Status in Jesup
48.3% of women with births in Jesup are unmarried. Women with the educational attainment of bachelor's degree are most likely to be married with 100.0% of them married at childbirth, while women with the educational attainment of less than high school are least likely to be married with 100.0% of them unmarried at childbirth.
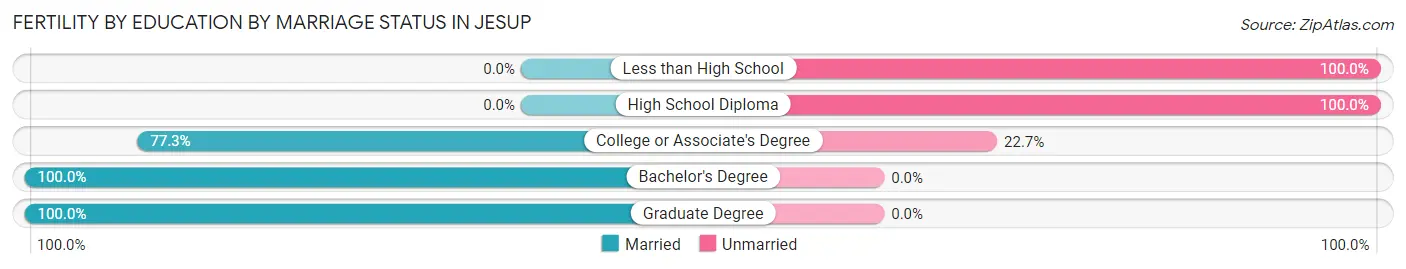
| Educational Attainment | Married | Unmarried |
| Less than High School | 0 (0.0%) | 9 (100.0%) |
| High School Diploma | 0 (0.0%) | 15 (100.0%) |
| College or Associate's Degree | 17 (77.3%) | 5 (22.7%) |
| Bachelor's Degree | 4 (100.0%) | 0 (0.0%) |
| Graduate Degree | 10 (100.0%) | 0 (0.0%) |
| Total | 31 (51.7%) | 29 (48.3%) |
Employment Characteristics in Jesup
Employment by Class of Employer in Jesup
Among the 1,269 employed individuals in Jesup, private company employees (908 | 71.6%), local government employees (137 | 10.8%), and not-for-profit organizations (96 | 7.6%) make up the most common classes of employment.
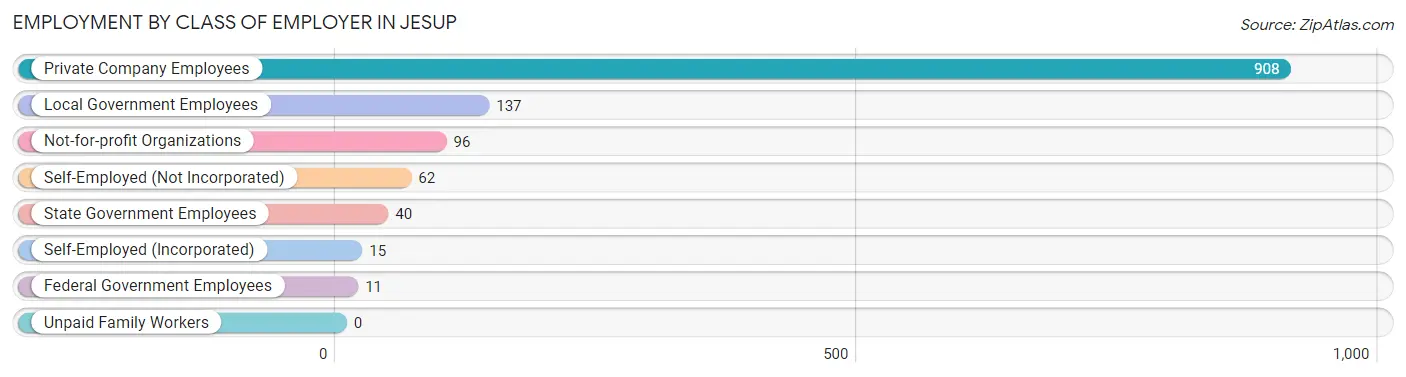
| Employer Class | # Employees | % Employees |
| Private Company Employees | 908 | 71.6% |
| Self-Employed (Incorporated) | 15 | 1.2% |
| Self-Employed (Not Incorporated) | 62 | 4.9% |
| Not-for-profit Organizations | 96 | 7.6% |
| Local Government Employees | 137 | 10.8% |
| State Government Employees | 40 | 3.2% |
| Federal Government Employees | 11 | 0.9% |
| Unpaid Family Workers | 0 | 0.0% |
| Total | 1,269 | 100.0% |
Employment Status by Age in Jesup
According to the labor force statistics for Jesup, out of the total population over 16 years of age (1,905), 69.9% or 1,332 individuals are in the labor force, with 4.7% or 63 of them unemployed. The age group with the highest labor force participation rate is 35 to 44 years, with 91.0% or 294 individuals in the labor force. Within the labor force, the 16 to 19 years age range has the highest percentage of unemployed individuals, with 31.1% or 23 of them being unemployed.
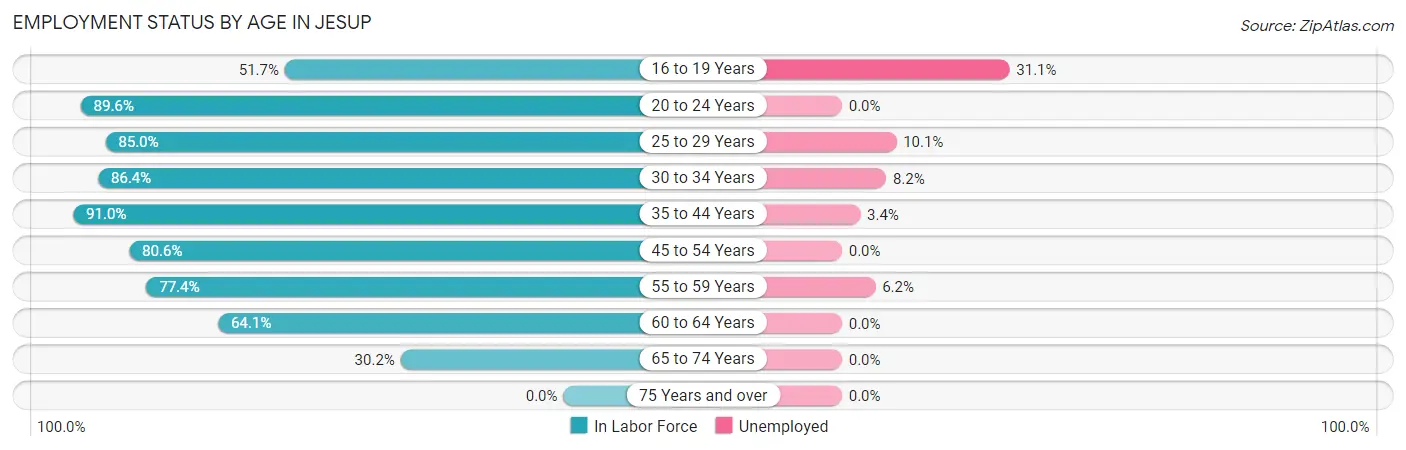
| Age Bracket | In Labor Force | Unemployed |
| 16 to 19 Years | 74 (51.7%) | 23 (31.1%) |
| 20 to 24 Years | 224 (89.6%) | 0 (0.0%) |
| 25 to 29 Years | 119 (85.0%) | 12 (10.1%) |
| 30 to 34 Years | 171 (86.4%) | 14 (8.2%) |
| 35 to 44 Years | 294 (91.0%) | 10 (3.4%) |
| 45 to 54 Years | 233 (80.6%) | 0 (0.0%) |
| 55 to 59 Years | 65 (77.4%) | 4 (6.2%) |
| 60 to 64 Years | 91 (64.1%) | 0 (0.0%) |
| 65 to 74 Years | 61 (30.2%) | 0 (0.0%) |
| 75 Years and over | 0 (0.0%) | 0 (0.0%) |
| Total | 1,332 (69.9%) | 63 (4.7%) |
Employment Status by Educational Attainment in Jesup
According to labor force statistics for Jesup, 82.7% of individuals (973) out of the total population between 25 and 64 years of age (1,176) are in the labor force, with 4.1% or 40 of them being unemployed. The group with the highest labor force participation rate are those with the educational attainment of bachelor's degree or higher, with 94.7% or 249 individuals in the labor force. Within the labor force, individuals with high school diploma education have the highest percentage of unemployment, with 6.7% or 18 of them being unemployed.
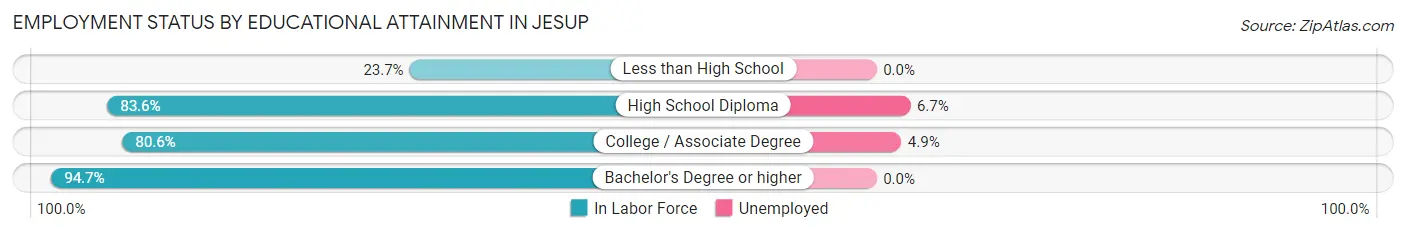
| Educational Attainment | In Labor Force | Unemployed |
| Less than High School | 9 (23.7%) | 0 (0.0%) |
| High School Diploma | 270 (83.6%) | 22 (6.7%) |
| College / Associate Degree | 445 (80.6%) | 27 (4.9%) |
| Bachelor's Degree or higher | 249 (94.7%) | 0 (0.0%) |
| Total | 973 (82.7%) | 48 (4.1%) |
Employment Occupations by Sex in Jesup
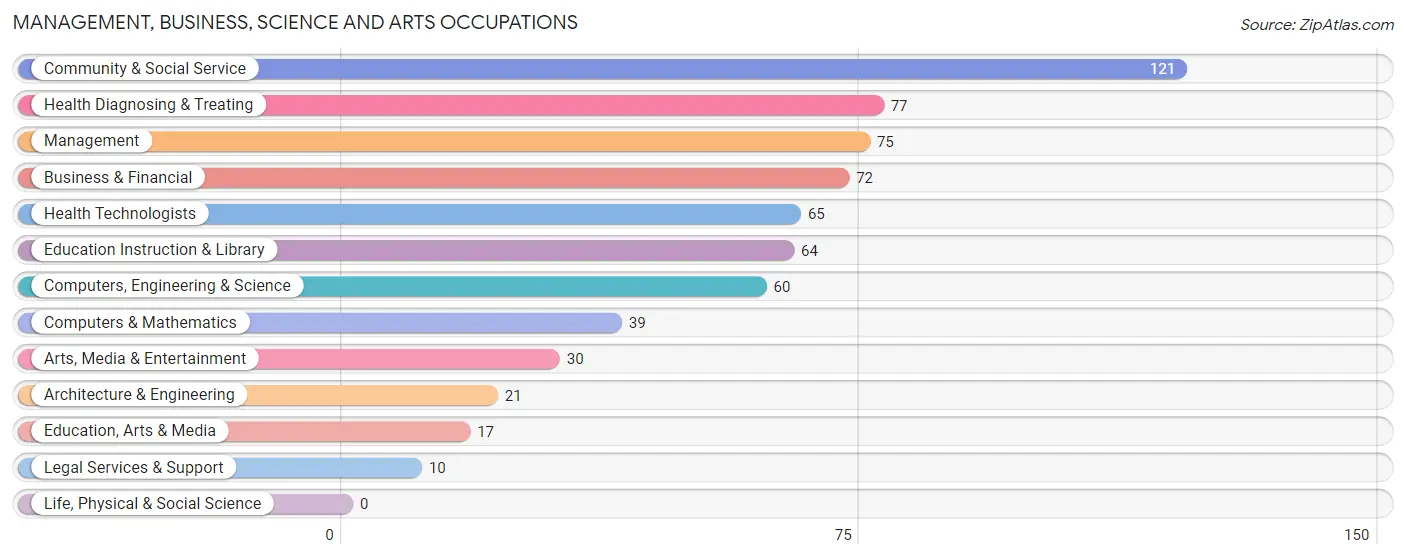
Management, Business, Science and Arts Occupations
The most common Management, Business, Science and Arts occupations in Jesup are Community & Social Service (121 | 9.5%), Health Diagnosing & Treating (77 | 6.1%), Management (75 | 5.9%), Business & Financial (72 | 5.7%), and Health Technologists (65 | 5.1%).
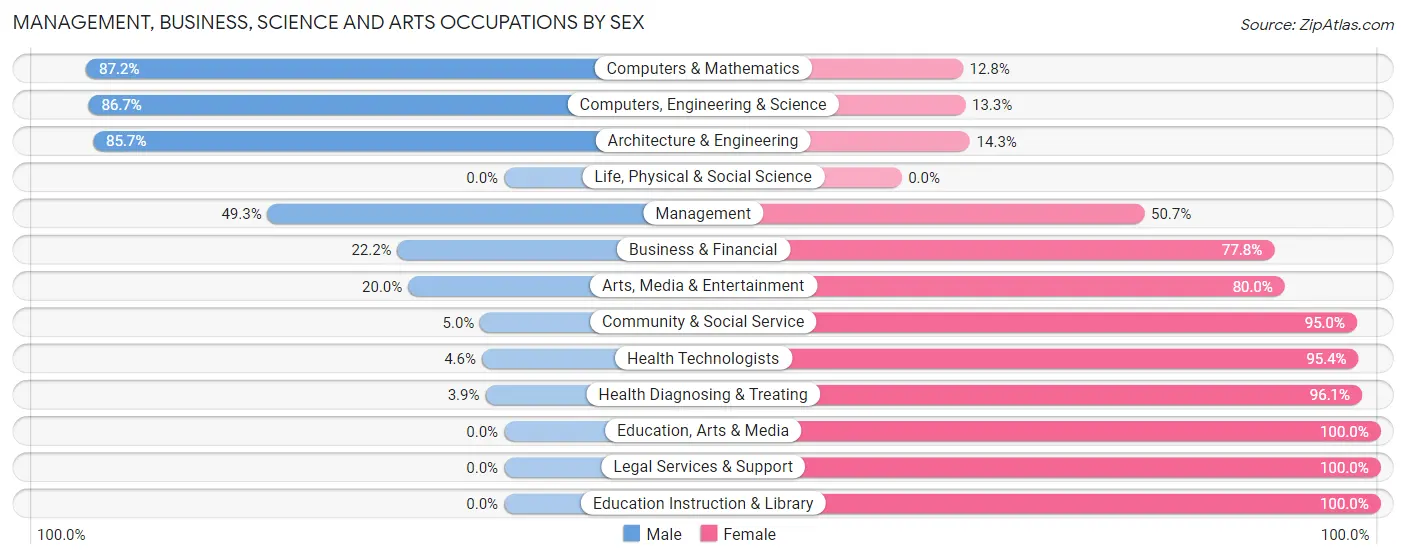
Management, Business, Science and Arts Occupations by Sex
Within the Management, Business, Science and Arts occupations in Jesup, the most male-oriented occupations are Computers & Mathematics (87.2%), Computers, Engineering & Science (86.7%), and Architecture & Engineering (85.7%), while the most female-oriented occupations are Education, Arts & Media (100.0%), Legal Services & Support (100.0%), and Education Instruction & Library (100.0%).
| Occupation | Male | Female |
| Management | 37 (49.3%) | 38 (50.7%) |
| Business & Financial | 16 (22.2%) | 56 (77.8%) |
| Computers, Engineering & Science | 52 (86.7%) | 8 (13.3%) |
| Computers & Mathematics | 34 (87.2%) | 5 (12.8%) |
| Architecture & Engineering | 18 (85.7%) | 3 (14.3%) |
| Life, Physical & Social Science | 0 (0.0%) | 0 (0.0%) |
| Community & Social Service | 6 (5.0%) | 115 (95.0%) |
| Education, Arts & Media | 0 (0.0%) | 17 (100.0%) |
| Legal Services & Support | 0 (0.0%) | 10 (100.0%) |
| Education Instruction & Library | 0 (0.0%) | 64 (100.0%) |
| Arts, Media & Entertainment | 6 (20.0%) | 24 (80.0%) |
| Health Diagnosing & Treating | 3 (3.9%) | 74 (96.1%) |
| Health Technologists | 3 (4.6%) | 62 (95.4%) |
| Total (Category) | 114 (28.1%) | 291 (71.9%) |
| Total (Overall) | 647 (51.0%) | 622 (49.0%) |
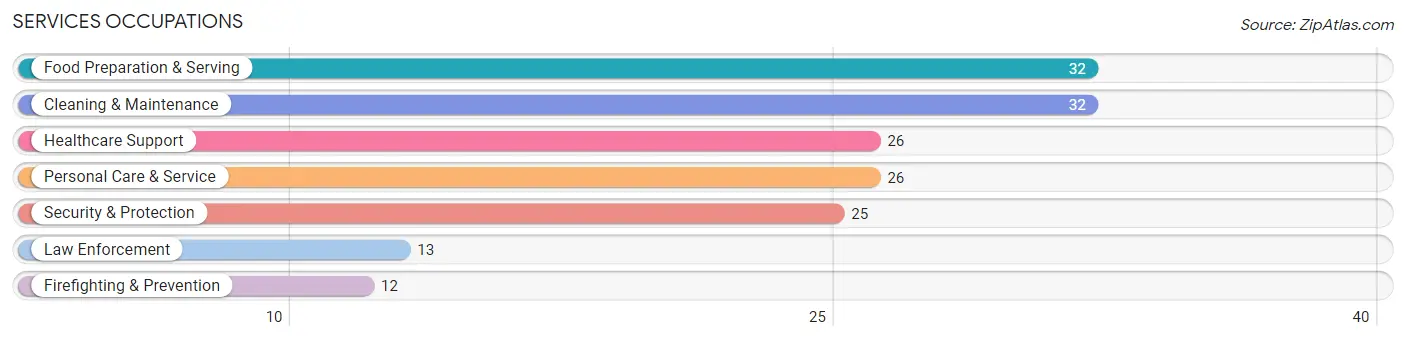
Services Occupations
The most common Services occupations in Jesup are Food Preparation & Serving (32 | 2.5%), Cleaning & Maintenance (32 | 2.5%), Healthcare Support (26 | 2.1%), Personal Care & Service (26 | 2.1%), and Security & Protection (25 | 2.0%).
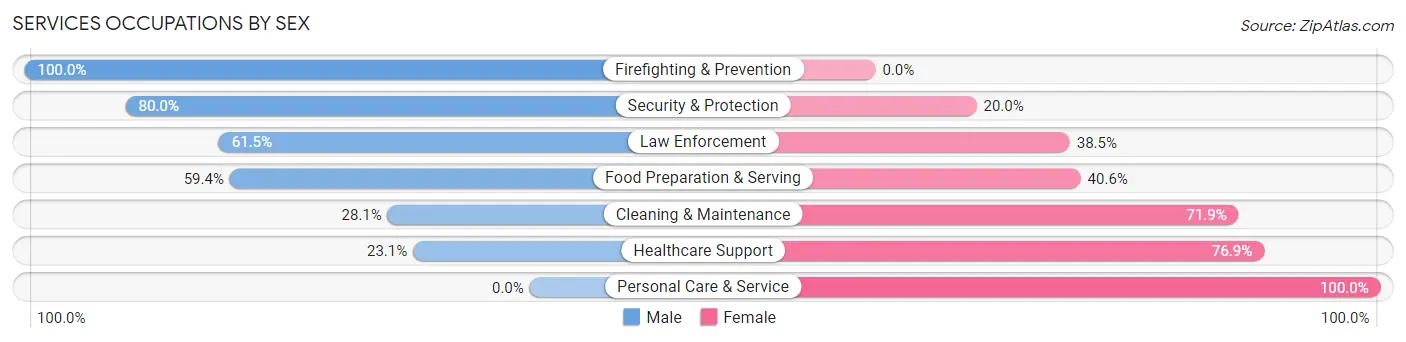
Services Occupations by Sex
Within the Services occupations in Jesup, the most male-oriented occupations are Firefighting & Prevention (100.0%), Security & Protection (80.0%), and Law Enforcement (61.5%), while the most female-oriented occupations are Personal Care & Service (100.0%), Healthcare Support (76.9%), and Cleaning & Maintenance (71.9%).
| Occupation | Male | Female |
| Healthcare Support | 6 (23.1%) | 20 (76.9%) |
| Security & Protection | 20 (80.0%) | 5 (20.0%) |
| Firefighting & Prevention | 12 (100.0%) | 0 (0.0%) |
| Law Enforcement | 8 (61.5%) | 5 (38.5%) |
| Food Preparation & Serving | 19 (59.4%) | 13 (40.6%) |
| Cleaning & Maintenance | 9 (28.1%) | 23 (71.9%) |
| Personal Care & Service | 0 (0.0%) | 26 (100.0%) |
| Total (Category) | 54 (38.3%) | 87 (61.7%) |
| Total (Overall) | 647 (51.0%) | 622 (49.0%) |
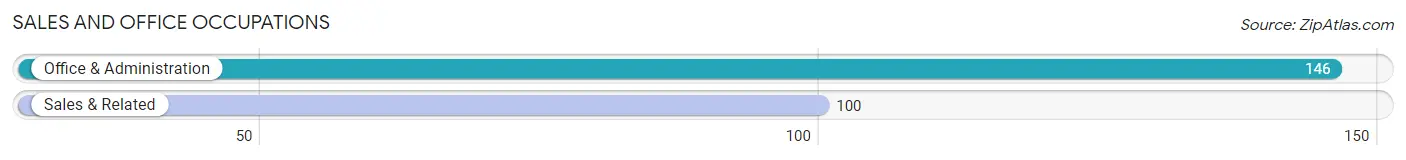
Sales and Office Occupations
The most common Sales and Office occupations in Jesup are Office & Administration (146 | 11.5%), and Sales & Related (100 | 7.9%).
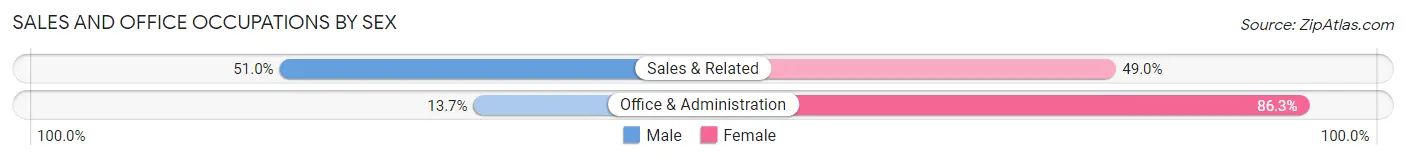
Sales and Office Occupations by Sex
| Occupation | Male | Female |
| Sales & Related | 51 (51.0%) | 49 (49.0%) |
| Office & Administration | 20 (13.7%) | 126 (86.3%) |
| Total (Category) | 71 (28.9%) | 175 (71.1%) |
| Total (Overall) | 647 (51.0%) | 622 (49.0%) |
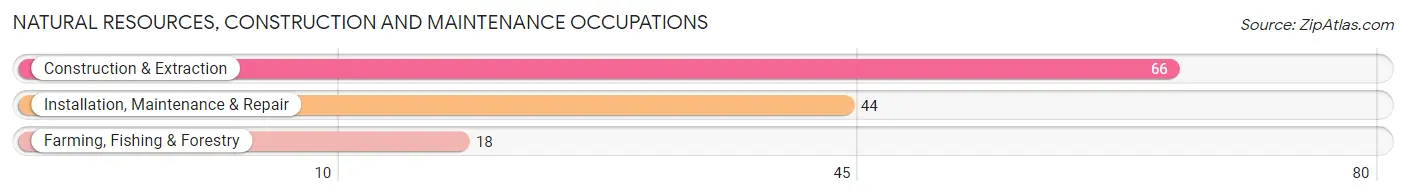
Natural Resources, Construction and Maintenance Occupations
The most common Natural Resources, Construction and Maintenance occupations in Jesup are Construction & Extraction (66 | 5.2%), Installation, Maintenance & Repair (44 | 3.5%), and Farming, Fishing & Forestry (18 | 1.4%).
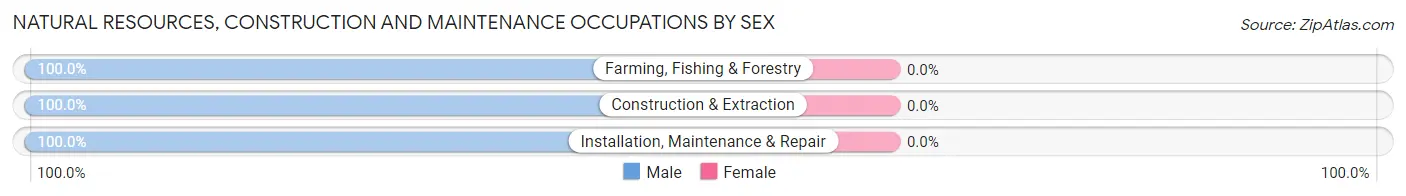
Natural Resources, Construction and Maintenance Occupations by Sex
| Occupation | Male | Female |
| Farming, Fishing & Forestry | 18 (100.0%) | 0 (0.0%) |
| Construction & Extraction | 66 (100.0%) | 0 (0.0%) |
| Installation, Maintenance & Repair | 44 (100.0%) | 0 (0.0%) |
| Total (Category) | 128 (100.0%) | 0 (0.0%) |
| Total (Overall) | 647 (51.0%) | 622 (49.0%) |
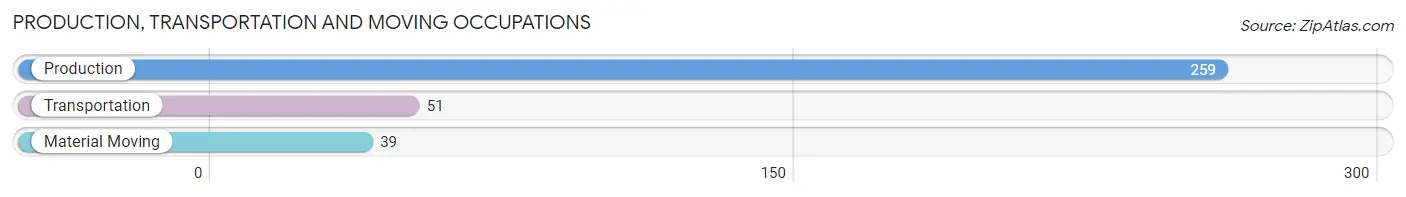
Production, Transportation and Moving Occupations
The most common Production, Transportation and Moving occupations in Jesup are Production (259 | 20.4%), Transportation (51 | 4.0%), and Material Moving (39 | 3.1%).
Production, Transportation and Moving Occupations by Sex
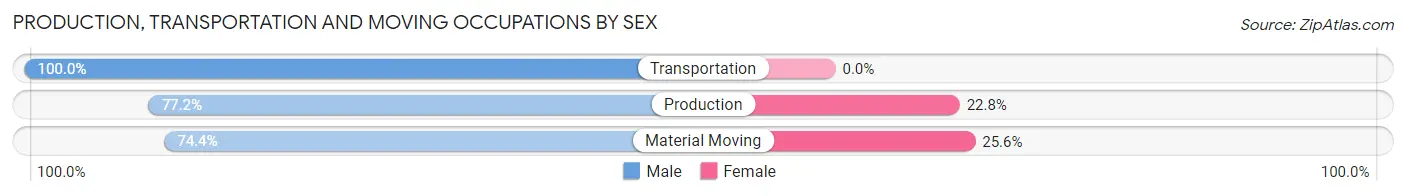
| Occupation | Male | Female |
| Production | 200 (77.2%) | 59 (22.8%) |
| Transportation | 51 (100.0%) | 0 (0.0%) |
| Material Moving | 29 (74.4%) | 10 (25.6%) |
| Total (Category) | 280 (80.2%) | 69 (19.8%) |
| Total (Overall) | 647 (51.0%) | 622 (49.0%) |
Employment Industries by Sex in Jesup
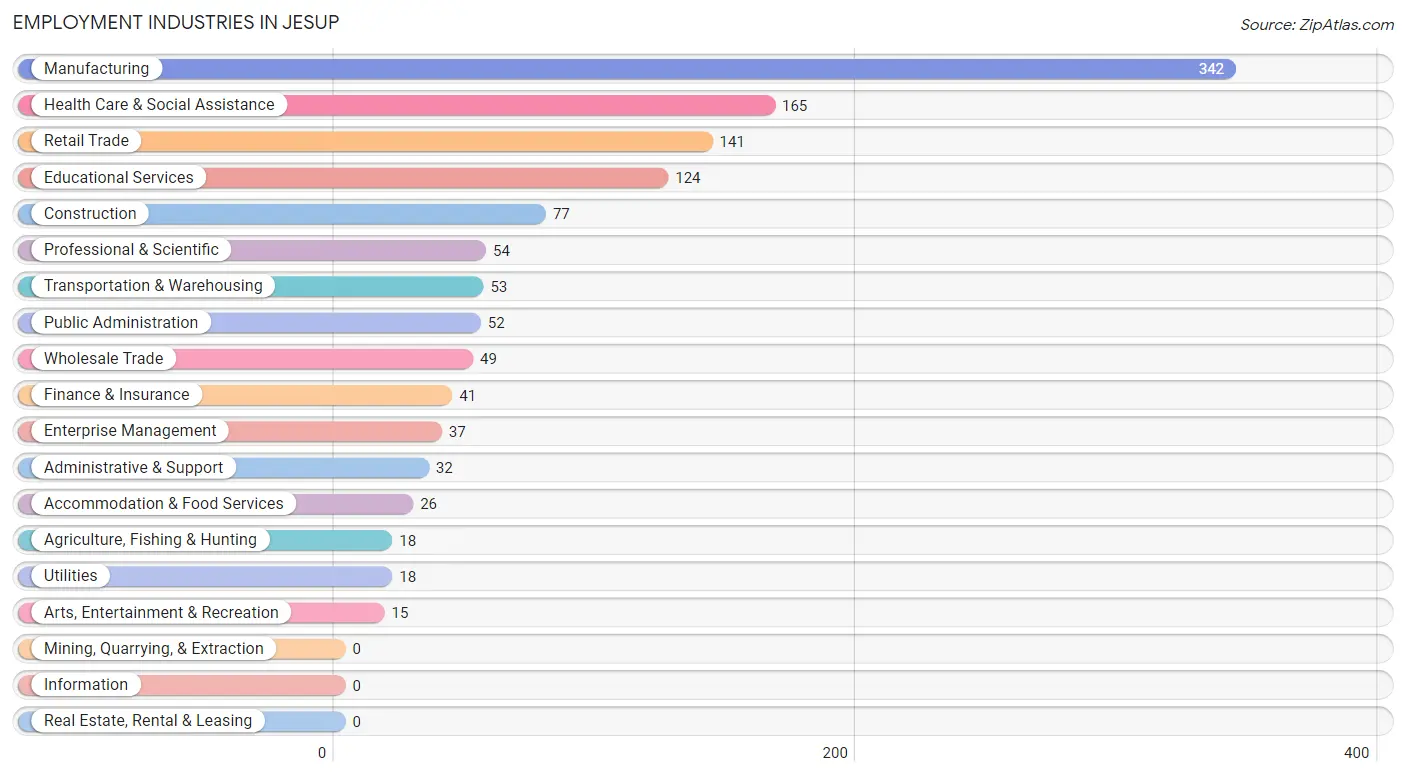
Employment Industries in Jesup
The major employment industries in Jesup include Manufacturing (342 | 27.0%), Health Care & Social Assistance (165 | 13.0%), Retail Trade (141 | 11.1%), Educational Services (124 | 9.8%), and Construction (77 | 6.1%).
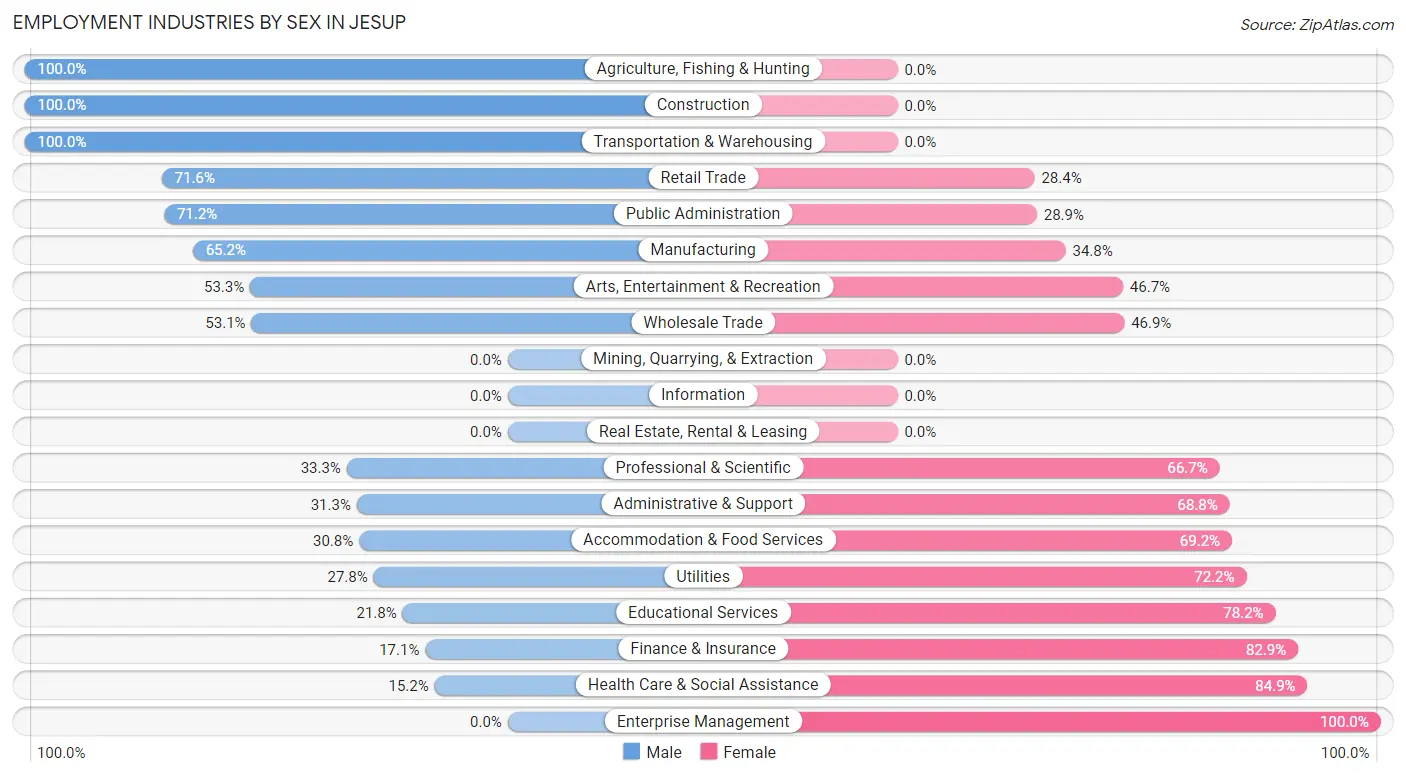
Employment Industries by Sex in Jesup
The Jesup industries that see more men than women are Agriculture, Fishing & Hunting (100.0%), Construction (100.0%), and Transportation & Warehousing (100.0%), whereas the industries that tend to have a higher number of women are Enterprise Management (100.0%), Health Care & Social Assistance (84.9%), and Finance & Insurance (82.9%).
| Industry | Male | Female |
| Agriculture, Fishing & Hunting | 18 (100.0%) | 0 (0.0%) |
| Mining, Quarrying, & Extraction | 0 (0.0%) | 0 (0.0%) |
| Construction | 77 (100.0%) | 0 (0.0%) |
| Manufacturing | 223 (65.2%) | 119 (34.8%) |
| Wholesale Trade | 26 (53.1%) | 23 (46.9%) |
| Retail Trade | 101 (71.6%) | 40 (28.4%) |
| Transportation & Warehousing | 53 (100.0%) | 0 (0.0%) |
| Utilities | 5 (27.8%) | 13 (72.2%) |
| Information | 0 (0.0%) | 0 (0.0%) |
| Finance & Insurance | 7 (17.1%) | 34 (82.9%) |
| Real Estate, Rental & Leasing | 0 (0.0%) | 0 (0.0%) |
| Professional & Scientific | 18 (33.3%) | 36 (66.7%) |
| Enterprise Management | 0 (0.0%) | 37 (100.0%) |
| Administrative & Support | 10 (31.2%) | 22 (68.8%) |
| Educational Services | 27 (21.8%) | 97 (78.2%) |
| Health Care & Social Assistance | 25 (15.1%) | 140 (84.9%) |
| Arts, Entertainment & Recreation | 8 (53.3%) | 7 (46.7%) |
| Accommodation & Food Services | 8 (30.8%) | 18 (69.2%) |
| Public Administration | 37 (71.2%) | 15 (28.8%) |
| Total | 647 (51.0%) | 622 (49.0%) |
Education in Jesup
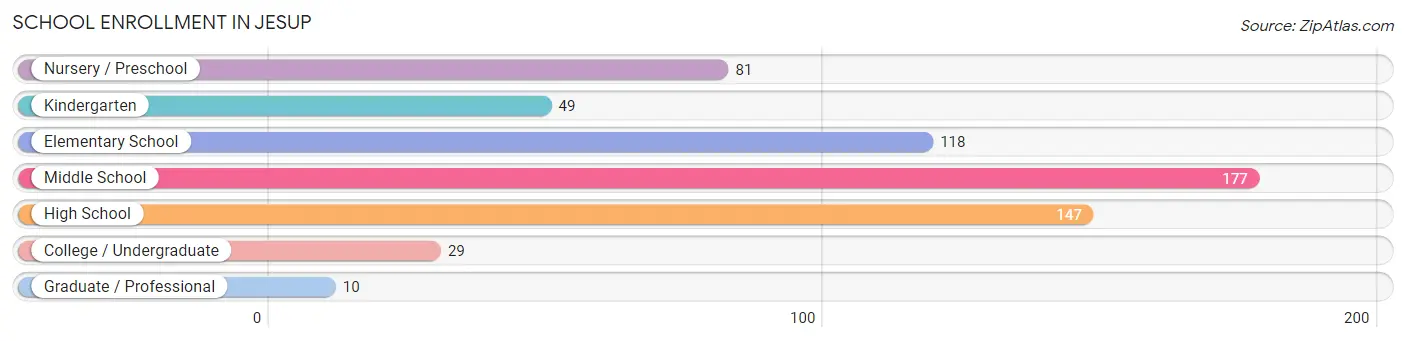
School Enrollment in Jesup
The most common levels of schooling among the 611 students in Jesup are middle school (177 | 29.0%), high school (147 | 24.1%), and elementary school (118 | 19.3%).
| School Level | # Students | % Students |
| Nursery / Preschool | 81 | 13.3% |
| Kindergarten | 49 | 8.0% |
| Elementary School | 118 | 19.3% |
| Middle School | 177 | 29.0% |
| High School | 147 | 24.1% |
| College / Undergraduate | 29 | 4.8% |
| Graduate / Professional | 10 | 1.6% |
| Total | 611 | 100.0% |
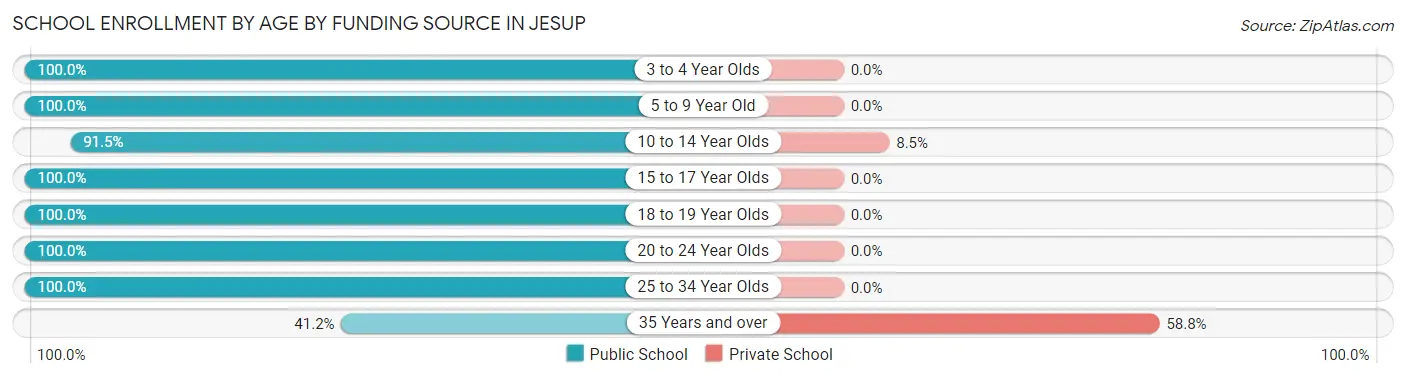
School Enrollment by Age by Funding Source in Jesup
Out of a total of 611 students who are enrolled in schools in Jesup, 27 (4.4%) attend a private institution, while the remaining 584 (95.6%) are enrolled in public schools. The age group of 35 years and over has the highest likelihood of being enrolled in private schools, with 10 (58.8% in the age bracket) enrolled. Conversely, the age group of 3 to 4 year olds has the lowest likelihood of being enrolled in a private school, with 68 (100.0% in the age bracket) attending a public institution.
| Age Bracket | Public School | Private School |
| 3 to 4 Year Olds | 68 (100.0%) | 0 (0.0%) |
| 5 to 9 Year Old | 170 (100.0%) | 0 (0.0%) |
| 10 to 14 Year Olds | 183 (91.5%) | 17 (8.5%) |
| 15 to 17 Year Olds | 109 (100.0%) | 0 (0.0%) |
| 18 to 19 Year Olds | 27 (100.0%) | 0 (0.0%) |
| 20 to 24 Year Olds | 9 (100.0%) | 0 (0.0%) |
| 25 to 34 Year Olds | 11 (100.0%) | 0 (0.0%) |
| 35 Years and over | 7 (41.2%) | 10 (58.8%) |
| Total | 584 (95.6%) | 27 (4.4%) |
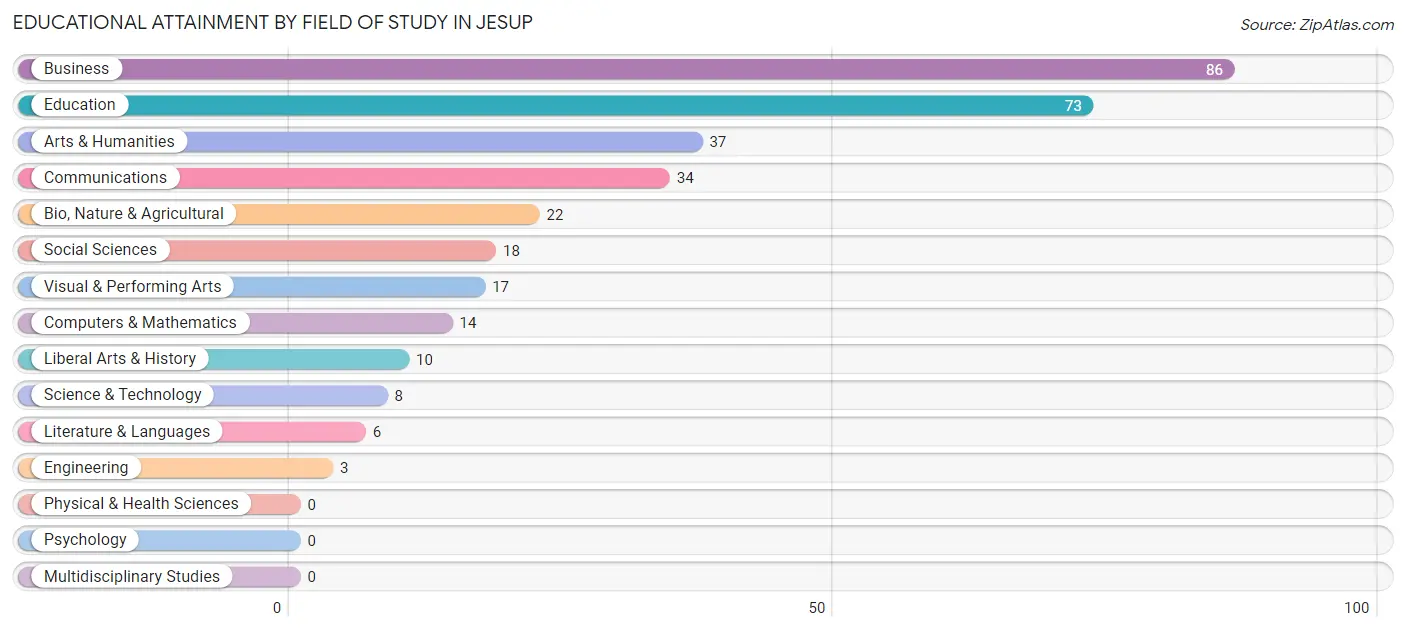
Educational Attainment by Field of Study in Jesup
Business (86 | 26.2%), education (73 | 22.3%), arts & humanities (37 | 11.3%), communications (34 | 10.4%), and bio, nature & agricultural (22 | 6.7%) are the most common fields of study among 328 individuals in Jesup who have obtained a bachelor's degree or higher.
| Field of Study | # Graduates | % Graduates |
| Computers & Mathematics | 14 | 4.3% |
| Bio, Nature & Agricultural | 22 | 6.7% |
| Physical & Health Sciences | 0 | 0.0% |
| Psychology | 0 | 0.0% |
| Social Sciences | 18 | 5.5% |
| Engineering | 3 | 0.9% |
| Multidisciplinary Studies | 0 | 0.0% |
| Science & Technology | 8 | 2.4% |
| Business | 86 | 26.2% |
| Education | 73 | 22.3% |
| Literature & Languages | 6 | 1.8% |
| Liberal Arts & History | 10 | 3.0% |
| Visual & Performing Arts | 17 | 5.2% |
| Communications | 34 | 10.4% |
| Arts & Humanities | 37 | 11.3% |
| Total | 328 | 100.0% |
Transportation & Commute in Jesup
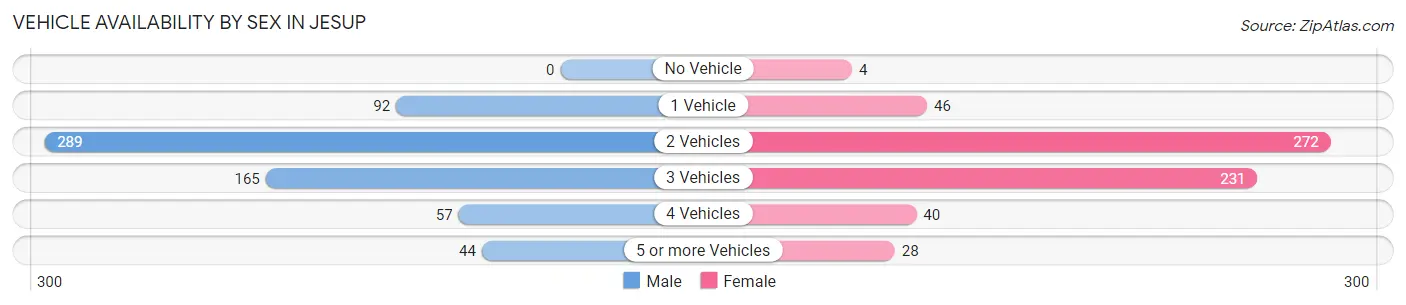
Vehicle Availability by Sex in Jesup
The most prevalent vehicle ownership categories in Jesup are males with 2 vehicles (289, accounting for 44.7%) and females with 2 vehicles (272, making up 46.5%).
| Vehicles Available | Male | Female |
| No Vehicle | 0 (0.0%) | 4 (0.6%) |
| 1 Vehicle | 92 (14.2%) | 46 (7.4%) |
| 2 Vehicles | 289 (44.7%) | 272 (43.8%) |
| 3 Vehicles | 165 (25.5%) | 231 (37.2%) |
| 4 Vehicles | 57 (8.8%) | 40 (6.4%) |
| 5 or more Vehicles | 44 (6.8%) | 28 (4.5%) |
| Total | 647 (100.0%) | 621 (100.0%) |
Commute Time in Jesup
The most frequently occuring commute durations in Jesup are 20 to 24 minutes (289 commuters, 24.2%), 25 to 29 minutes (222 commuters, 18.6%), and 30 to 34 minutes (186 commuters, 15.6%).
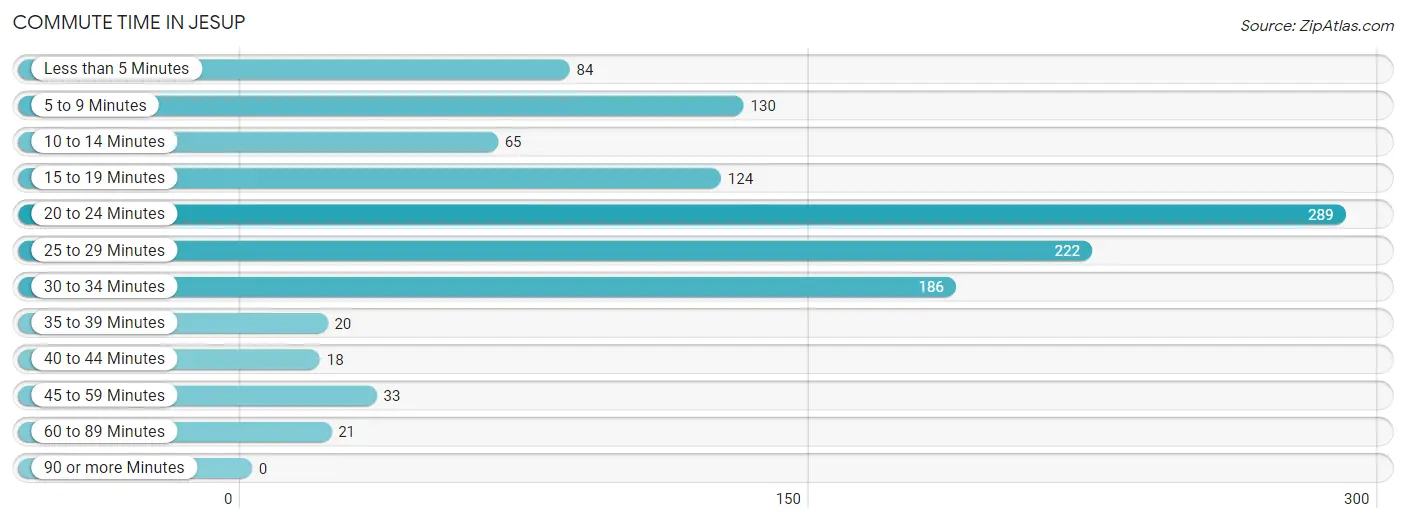
| Commute Time | # Commuters | % Commuters |
| Less than 5 Minutes | 84 | 7.0% |
| 5 to 9 Minutes | 130 | 10.9% |
| 10 to 14 Minutes | 65 | 5.4% |
| 15 to 19 Minutes | 124 | 10.4% |
| 20 to 24 Minutes | 289 | 24.2% |
| 25 to 29 Minutes | 222 | 18.6% |
| 30 to 34 Minutes | 186 | 15.6% |
| 35 to 39 Minutes | 20 | 1.7% |
| 40 to 44 Minutes | 18 | 1.5% |
| 45 to 59 Minutes | 33 | 2.8% |
| 60 to 89 Minutes | 21 | 1.8% |
| 90 or more Minutes | 0 | 0.0% |
Commute Time by Sex in Jesup
The most common commute times in Jesup are 20 to 24 minutes (135 commuters, 22.1%) for males and 20 to 24 minutes (154 commuters, 26.5%) for females.
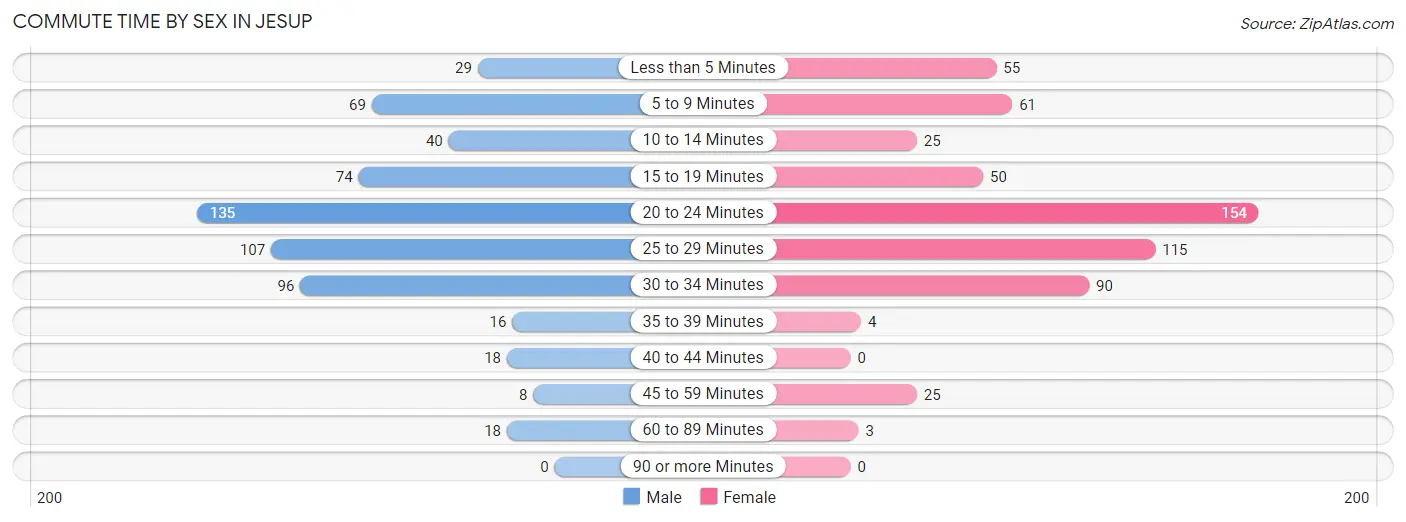
| Commute Time | Male | Female |
| Less than 5 Minutes | 29 (4.8%) | 55 (9.5%) |
| 5 to 9 Minutes | 69 (11.3%) | 61 (10.5%) |
| 10 to 14 Minutes | 40 (6.6%) | 25 (4.3%) |
| 15 to 19 Minutes | 74 (12.1%) | 50 (8.6%) |
| 20 to 24 Minutes | 135 (22.1%) | 154 (26.5%) |
| 25 to 29 Minutes | 107 (17.5%) | 115 (19.8%) |
| 30 to 34 Minutes | 96 (15.7%) | 90 (15.5%) |
| 35 to 39 Minutes | 16 (2.6%) | 4 (0.7%) |
| 40 to 44 Minutes | 18 (2.9%) | 0 (0.0%) |
| 45 to 59 Minutes | 8 (1.3%) | 25 (4.3%) |
| 60 to 89 Minutes | 18 (2.9%) | 3 (0.5%) |
| 90 or more Minutes | 0 (0.0%) | 0 (0.0%) |
Time of Departure to Work by Sex in Jesup
The most frequent times of departure to work in Jesup are 5:00 AM to 5:29 AM (84, 13.8%) for males and 7:00 AM to 7:29 AM (124, 21.3%) for females.
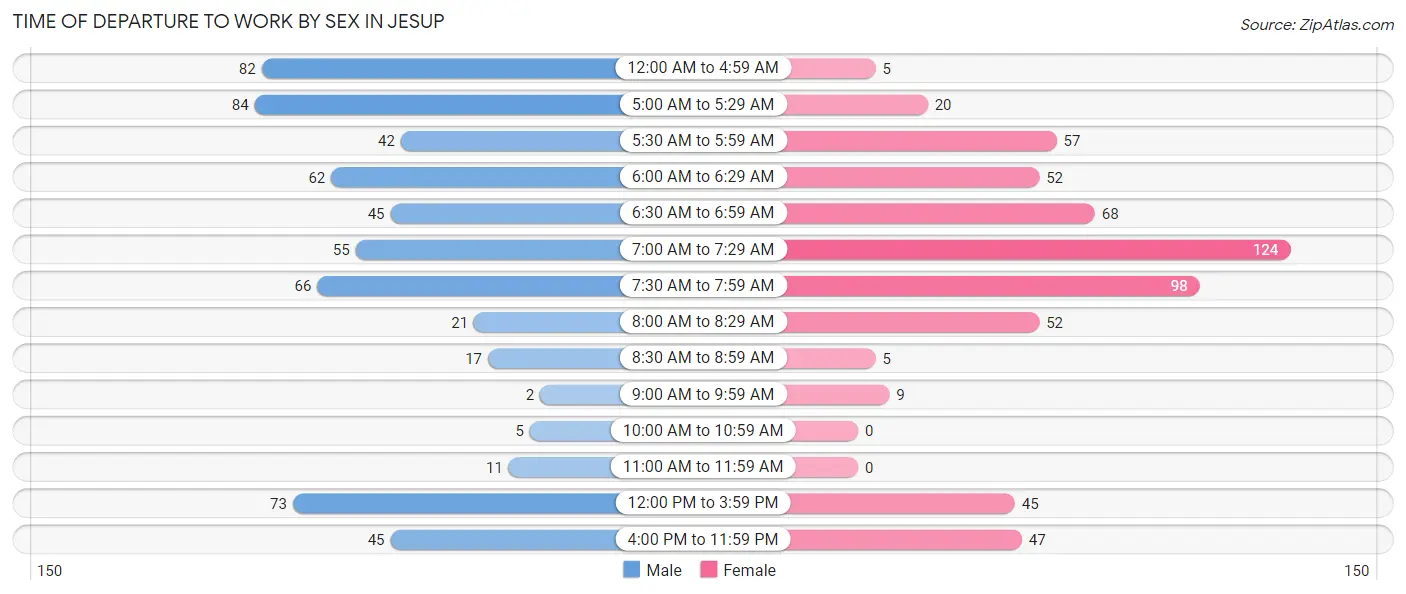
| Time of Departure | Male | Female |
| 12:00 AM to 4:59 AM | 82 (13.4%) | 5 (0.9%) |
| 5:00 AM to 5:29 AM | 84 (13.8%) | 20 (3.4%) |
| 5:30 AM to 5:59 AM | 42 (6.9%) | 57 (9.8%) |
| 6:00 AM to 6:29 AM | 62 (10.2%) | 52 (8.9%) |
| 6:30 AM to 6:59 AM | 45 (7.4%) | 68 (11.7%) |
| 7:00 AM to 7:29 AM | 55 (9.0%) | 124 (21.3%) |
| 7:30 AM to 7:59 AM | 66 (10.8%) | 98 (16.8%) |
| 8:00 AM to 8:29 AM | 21 (3.4%) | 52 (8.9%) |
| 8:30 AM to 8:59 AM | 17 (2.8%) | 5 (0.9%) |
| 9:00 AM to 9:59 AM | 2 (0.3%) | 9 (1.5%) |
| 10:00 AM to 10:59 AM | 5 (0.8%) | 0 (0.0%) |
| 11:00 AM to 11:59 AM | 11 (1.8%) | 0 (0.0%) |
| 12:00 PM to 3:59 PM | 73 (12.0%) | 45 (7.7%) |
| 4:00 PM to 11:59 PM | 45 (7.4%) | 47 (8.1%) |
| Total | 610 (100.0%) | 582 (100.0%) |
Housing Occupancy in Jesup
Occupancy by Ownership in Jesup
Of the total 890 dwellings in Jesup, owner-occupied units account for 758 (85.2%), while renter-occupied units make up 132 (14.8%).
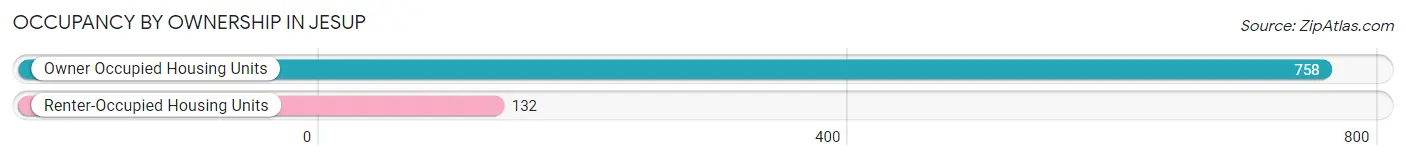
| Occupancy | # Housing Units | % Housing Units |
| Owner Occupied Housing Units | 758 | 85.2% |
| Renter-Occupied Housing Units | 132 | 14.8% |
| Total Occupied Housing Units | 890 | 100.0% |
Occupancy by Household Size in Jesup
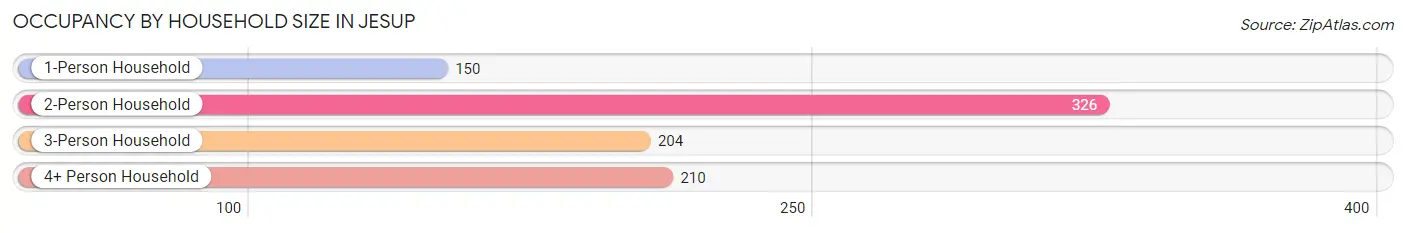
| Household Size | # Housing Units | % Housing Units |
| 1-Person Household | 150 | 16.9% |
| 2-Person Household | 326 | 36.6% |
| 3-Person Household | 204 | 22.9% |
| 4+ Person Household | 210 | 23.6% |
| Total Housing Units | 890 | 100.0% |
Occupancy by Ownership by Household Size in Jesup
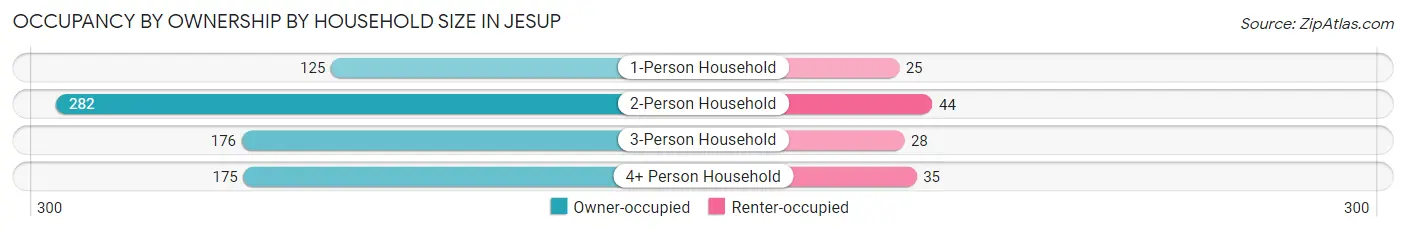
| Household Size | Owner-occupied | Renter-occupied |
| 1-Person Household | 125 (83.3%) | 25 (16.7%) |
| 2-Person Household | 282 (86.5%) | 44 (13.5%) |
| 3-Person Household | 176 (86.3%) | 28 (13.7%) |
| 4+ Person Household | 175 (83.3%) | 35 (16.7%) |
| Total Housing Units | 758 (85.2%) | 132 (14.8%) |
Occupancy by Educational Attainment in Jesup
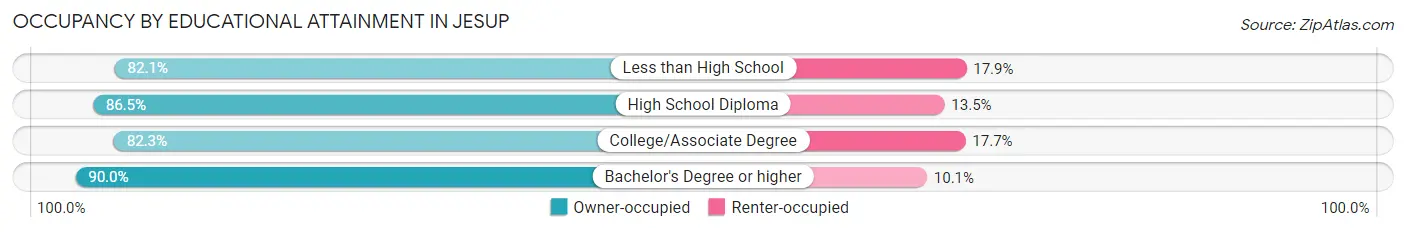
| Household Size | Owner-occupied | Renter-occupied |
| Less than High School | 23 (82.1%) | 5 (17.9%) |
| High School Diploma | 230 (86.5%) | 36 (13.5%) |
| College/Associate Degree | 335 (82.3%) | 72 (17.7%) |
| Bachelor's Degree or higher | 170 (89.9%) | 19 (10.1%) |
Occupancy by Age of Householder in Jesup
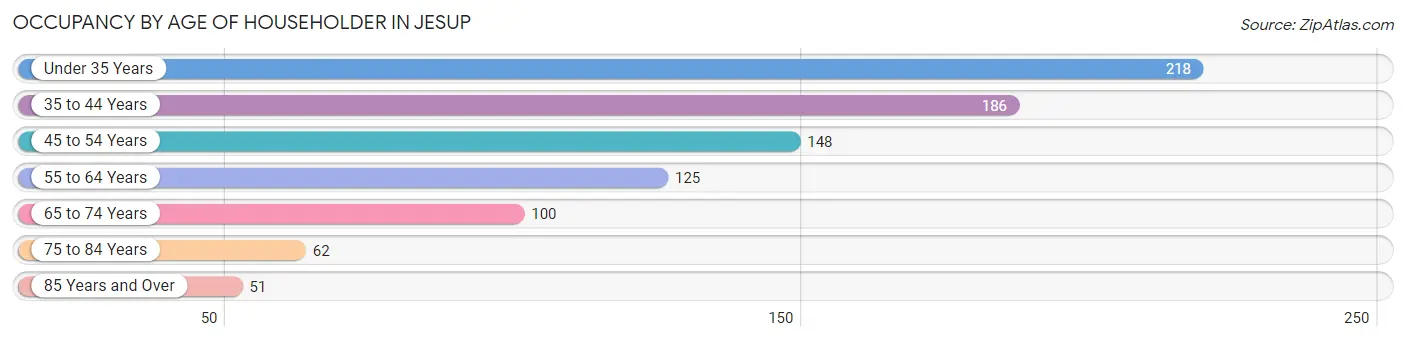
| Age Bracket | # Households | % Households |
| Under 35 Years | 218 | 24.5% |
| 35 to 44 Years | 186 | 20.9% |
| 45 to 54 Years | 148 | 16.6% |
| 55 to 64 Years | 125 | 14.0% |
| 65 to 74 Years | 100 | 11.2% |
| 75 to 84 Years | 62 | 7.0% |
| 85 Years and Over | 51 | 5.7% |
| Total | 890 | 100.0% |
Housing Finances in Jesup
Median Income by Occupancy in Jesup
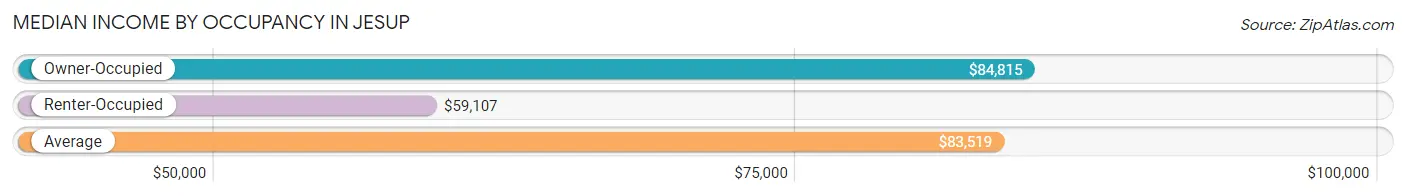
| Occupancy Type | # Households | Median Income |
| Owner-Occupied | 758 (85.2%) | $84,815 |
| Renter-Occupied | 132 (14.8%) | $59,107 |
| Average | 890 (100.0%) | $83,519 |
Occupancy by Householder Income Bracket in Jesup
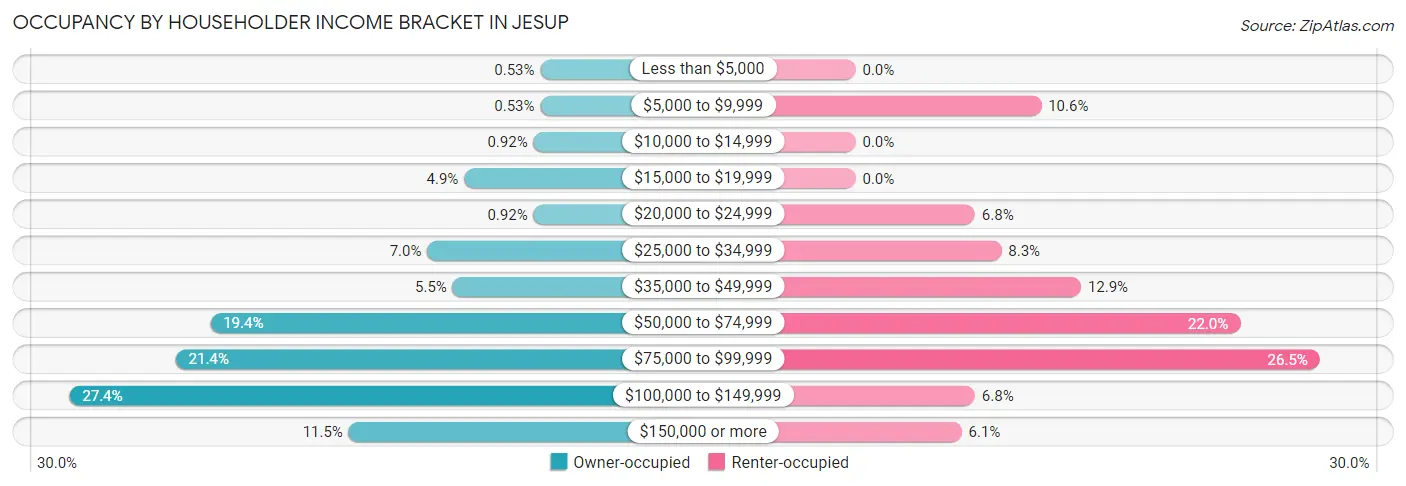
| Income Bracket | Owner-occupied | Renter-occupied |
| Less than $5,000 | 4 (0.5%) | 0 (0.0%) |
| $5,000 to $9,999 | 4 (0.5%) | 14 (10.6%) |
| $10,000 to $14,999 | 7 (0.9%) | 0 (0.0%) |
| $15,000 to $19,999 | 37 (4.9%) | 0 (0.0%) |
| $20,000 to $24,999 | 7 (0.9%) | 9 (6.8%) |
| $25,000 to $34,999 | 53 (7.0%) | 11 (8.3%) |
| $35,000 to $49,999 | 42 (5.5%) | 17 (12.9%) |
| $50,000 to $74,999 | 147 (19.4%) | 29 (22.0%) |
| $75,000 to $99,999 | 162 (21.4%) | 35 (26.5%) |
| $100,000 to $149,999 | 208 (27.4%) | 9 (6.8%) |
| $150,000 or more | 87 (11.5%) | 8 (6.1%) |
| Total | 758 (100.0%) | 132 (100.0%) |
Monthly Housing Cost Tiers in Jesup
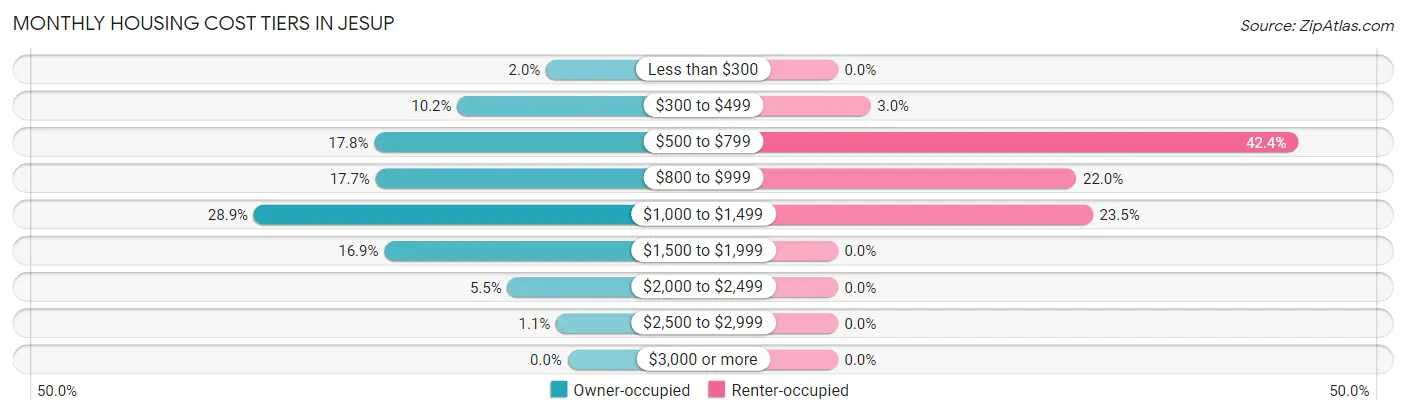
| Monthly Cost | Owner-occupied | Renter-occupied |
| Less than $300 | 15 (2.0%) | 0 (0.0%) |
| $300 to $499 | 77 (10.2%) | 4 (3.0%) |
| $500 to $799 | 135 (17.8%) | 56 (42.4%) |
| $800 to $999 | 134 (17.7%) | 29 (22.0%) |
| $1,000 to $1,499 | 219 (28.9%) | 31 (23.5%) |
| $1,500 to $1,999 | 128 (16.9%) | 0 (0.0%) |
| $2,000 to $2,499 | 42 (5.5%) | 0 (0.0%) |
| $2,500 to $2,999 | 8 (1.1%) | 0 (0.0%) |
| $3,000 or more | 0 (0.0%) | 0 (0.0%) |
| Total | 758 (100.0%) | 132 (100.0%) |
Physical Housing Characteristics in Jesup
Housing Structures in Jesup
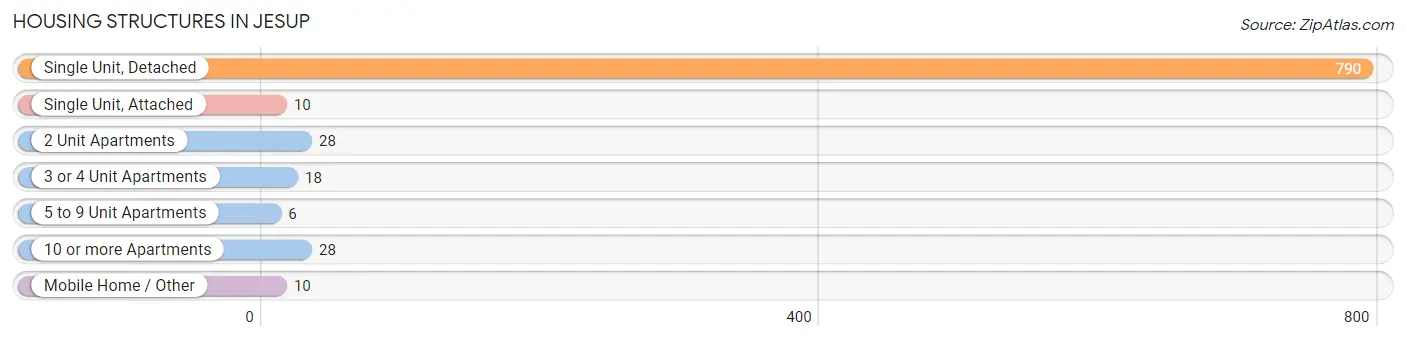
| Structure Type | # Housing Units | % Housing Units |
| Single Unit, Detached | 790 | 88.8% |
| Single Unit, Attached | 10 | 1.1% |
| 2 Unit Apartments | 28 | 3.2% |
| 3 or 4 Unit Apartments | 18 | 2.0% |
| 5 to 9 Unit Apartments | 6 | 0.7% |
| 10 or more Apartments | 28 | 3.2% |
| Mobile Home / Other | 10 | 1.1% |
| Total | 890 | 100.0% |
Housing Structures by Occupancy in Jesup
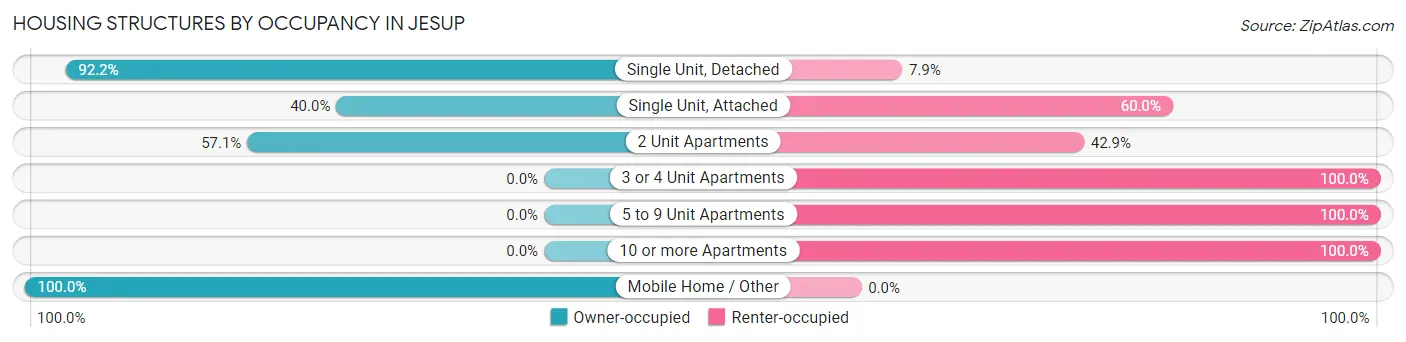
| Structure Type | Owner-occupied | Renter-occupied |
| Single Unit, Detached | 728 (92.1%) | 62 (7.9%) |
| Single Unit, Attached | 4 (40.0%) | 6 (60.0%) |
| 2 Unit Apartments | 16 (57.1%) | 12 (42.9%) |
| 3 or 4 Unit Apartments | 0 (0.0%) | 18 (100.0%) |
| 5 to 9 Unit Apartments | 0 (0.0%) | 6 (100.0%) |
| 10 or more Apartments | 0 (0.0%) | 28 (100.0%) |
| Mobile Home / Other | 10 (100.0%) | 0 (0.0%) |
| Total | 758 (85.2%) | 132 (14.8%) |
Housing Structures by Number of Rooms in Jesup
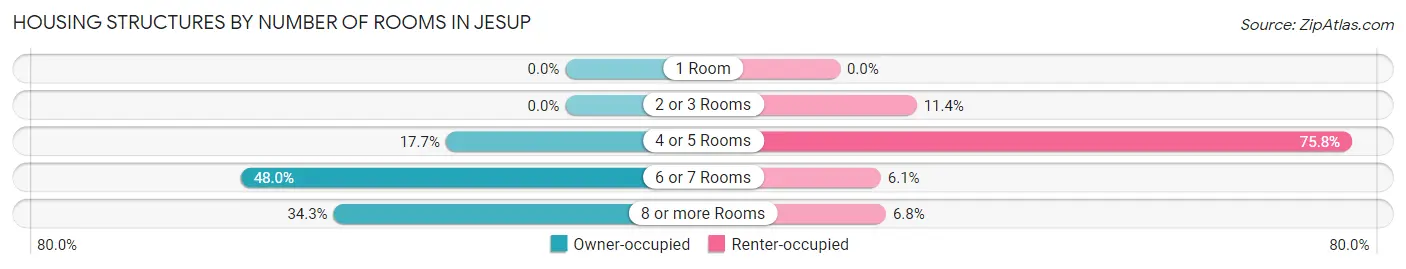
| Number of Rooms | Owner-occupied | Renter-occupied |
| 1 Room | 0 (0.0%) | 0 (0.0%) |
| 2 or 3 Rooms | 0 (0.0%) | 15 (11.4%) |
| 4 or 5 Rooms | 134 (17.7%) | 100 (75.8%) |
| 6 or 7 Rooms | 364 (48.0%) | 8 (6.1%) |
| 8 or more Rooms | 260 (34.3%) | 9 (6.8%) |
| Total | 758 (100.0%) | 132 (100.0%) |
Housing Structure by Heating Type in Jesup
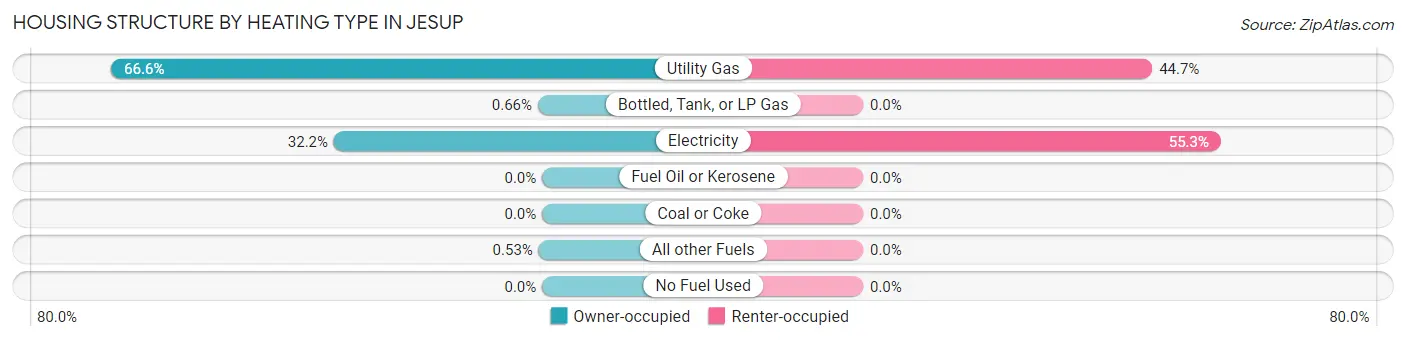
| Heating Type | Owner-occupied | Renter-occupied |
| Utility Gas | 505 (66.6%) | 59 (44.7%) |
| Bottled, Tank, or LP Gas | 5 (0.7%) | 0 (0.0%) |
| Electricity | 244 (32.2%) | 73 (55.3%) |
| Fuel Oil or Kerosene | 0 (0.0%) | 0 (0.0%) |
| Coal or Coke | 0 (0.0%) | 0 (0.0%) |
| All other Fuels | 4 (0.5%) | 0 (0.0%) |
| No Fuel Used | 0 (0.0%) | 0 (0.0%) |
| Total | 758 (100.0%) | 132 (100.0%) |
Household Vehicle Usage in Jesup
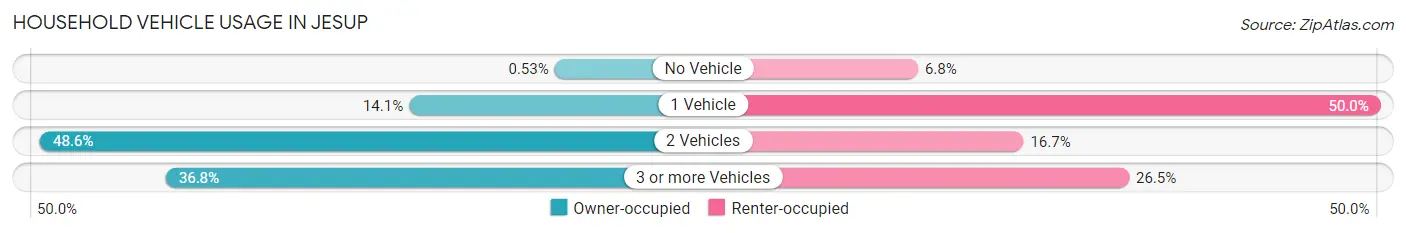
| Vehicles per Household | Owner-occupied | Renter-occupied |
| No Vehicle | 4 (0.5%) | 9 (6.8%) |
| 1 Vehicle | 107 (14.1%) | 66 (50.0%) |
| 2 Vehicles | 368 (48.5%) | 22 (16.7%) |
| 3 or more Vehicles | 279 (36.8%) | 35 (26.5%) |
| Total | 758 (100.0%) | 132 (100.0%) |
Real Estate & Mortgages in Jesup
Real Estate and Mortgage Overview in Jesup
| Characteristic | Without Mortgage | With Mortgage |
| Housing Units | 264 | 494 |
| Median Property Value | $182,100 | $178,000 |
| Median Household Income | $73,000 | $69 |
| Monthly Housing Costs | $568 | $0 |
| Real Estate Taxes | $3,040 | $6 |
Property Value by Mortgage Status in Jesup
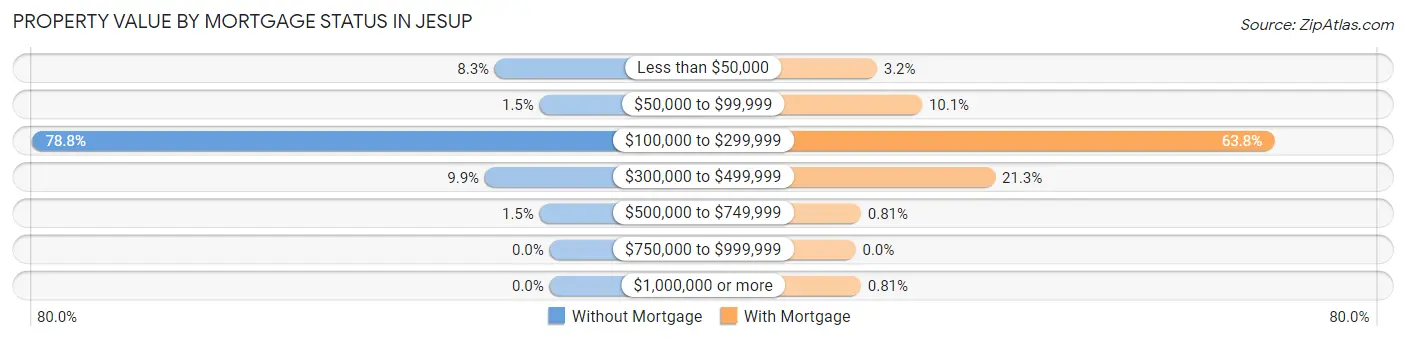
| Property Value | Without Mortgage | With Mortgage |
| Less than $50,000 | 22 (8.3%) | 16 (3.2%) |
| $50,000 to $99,999 | 4 (1.5%) | 50 (10.1%) |
| $100,000 to $299,999 | 208 (78.8%) | 315 (63.8%) |
| $300,000 to $499,999 | 26 (9.9%) | 105 (21.3%) |
| $500,000 to $749,999 | 4 (1.5%) | 4 (0.8%) |
| $750,000 to $999,999 | 0 (0.0%) | 0 (0.0%) |
| $1,000,000 or more | 0 (0.0%) | 4 (0.8%) |
| Total | 264 (100.0%) | 494 (100.0%) |
Household Income by Mortgage Status in Jesup
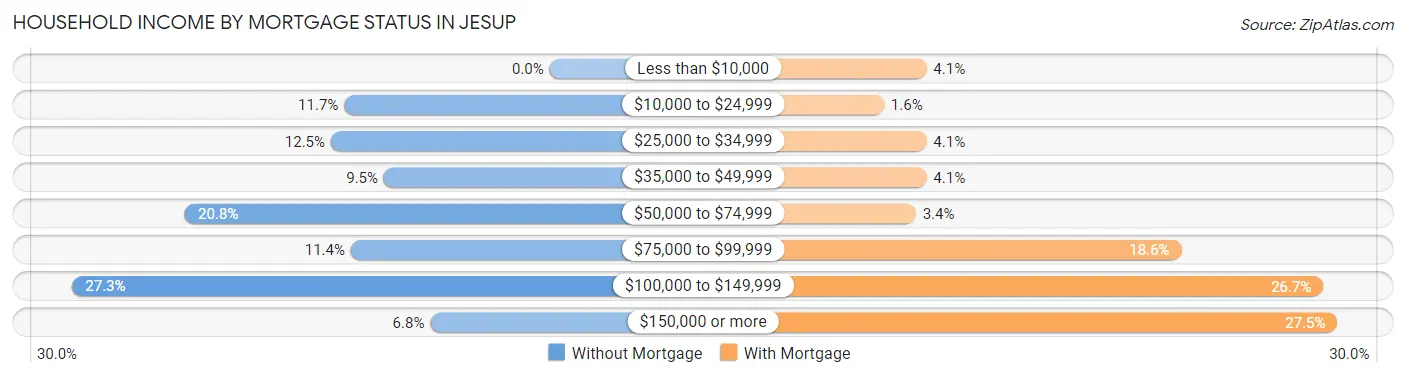
| Household Income | Without Mortgage | With Mortgage |
| Less than $10,000 | 0 (0.0%) | 20 (4.1%) |
| $10,000 to $24,999 | 31 (11.7%) | 8 (1.6%) |
| $25,000 to $34,999 | 33 (12.5%) | 20 (4.1%) |
| $35,000 to $49,999 | 25 (9.5%) | 20 (4.1%) |
| $50,000 to $74,999 | 55 (20.8%) | 17 (3.4%) |
| $75,000 to $99,999 | 30 (11.4%) | 92 (18.6%) |
| $100,000 to $149,999 | 72 (27.3%) | 132 (26.7%) |
| $150,000 or more | 18 (6.8%) | 136 (27.5%) |
| Total | 264 (100.0%) | 494 (100.0%) |
Property Value to Household Income Ratio in Jesup
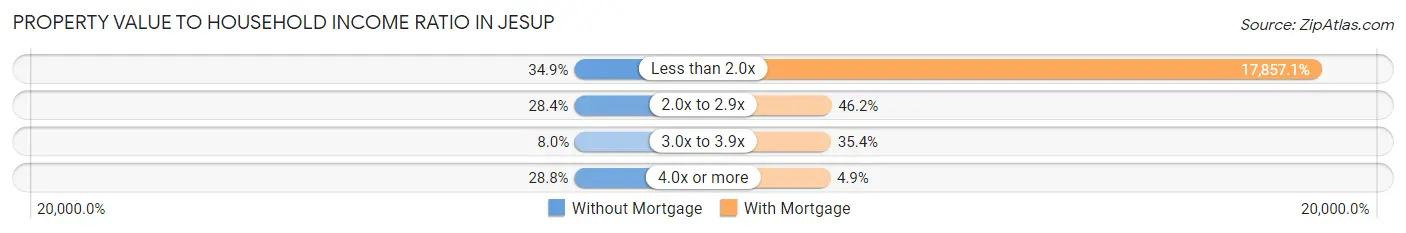
| Value-to-Income Ratio | Without Mortgage | With Mortgage |
| Less than 2.0x | 92 (34.8%) | 88,214 (17,857.1%) |
| 2.0x to 2.9x | 75 (28.4%) | 228 (46.2%) |
| 3.0x to 3.9x | 21 (8.0%) | 175 (35.4%) |
| 4.0x or more | 76 (28.8%) | 24 (4.9%) |
| Total | 264 (100.0%) | 494 (100.0%) |
Real Estate Taxes by Mortgage Status in Jesup
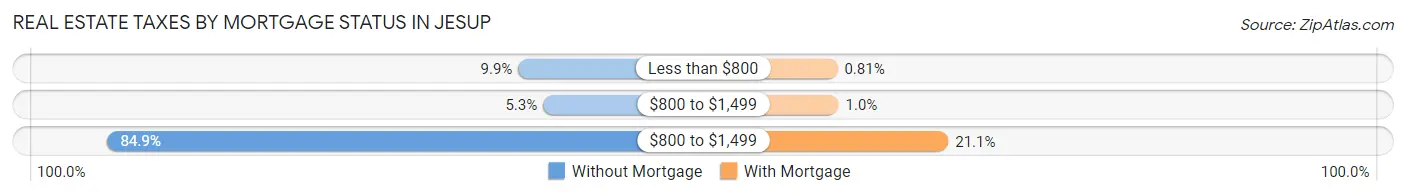
| Property Taxes | Without Mortgage | With Mortgage |
| Less than $800 | 26 (9.9%) | 4 (0.8%) |
| $800 to $1,499 | 14 (5.3%) | 5 (1.0%) |
| $800 to $1,499 | 224 (84.9%) | 104 (21.0%) |
| Total | 264 (100.0%) | 494 (100.0%) |
Health & Disability in Jesup
Health Insurance Coverage by Age in Jesup
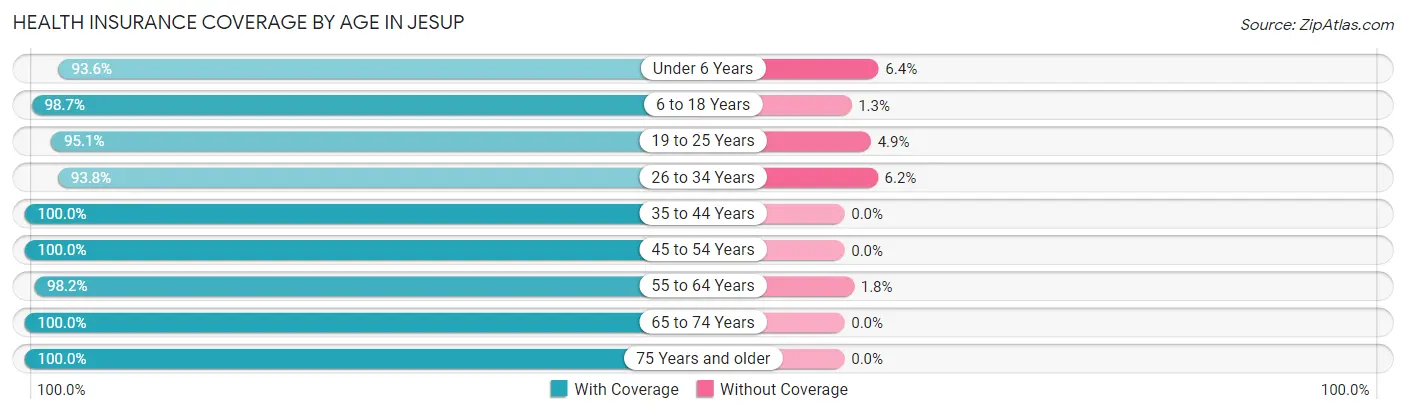
| Age Bracket | With Coverage | Without Coverage |
| Under 6 Years | 221 (93.6%) | 15 (6.4%) |
| 6 to 18 Years | 460 (98.7%) | 6 (1.3%) |
| 19 to 25 Years | 289 (95.1%) | 15 (4.9%) |
| 26 to 34 Years | 302 (93.8%) | 20 (6.2%) |
| 35 to 44 Years | 323 (100.0%) | 0 (0.0%) |
| 45 to 54 Years | 289 (100.0%) | 0 (0.0%) |
| 55 to 64 Years | 222 (98.2%) | 4 (1.8%) |
| 65 to 74 Years | 202 (100.0%) | 0 (0.0%) |
| 75 Years and older | 134 (100.0%) | 0 (0.0%) |
| Total | 2,442 (97.6%) | 60 (2.4%) |
Health Insurance Coverage by Citizenship Status in Jesup
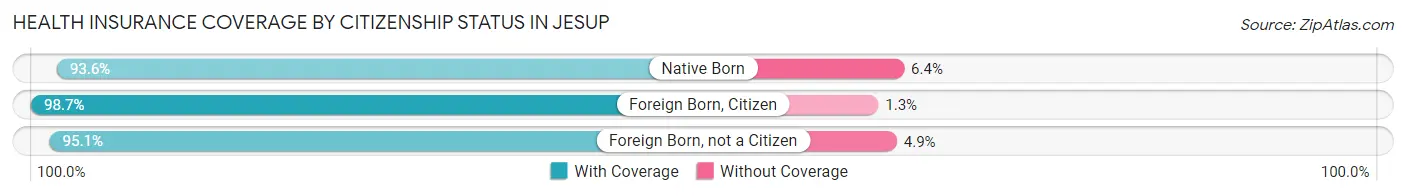
| Citizenship Status | With Coverage | Without Coverage |
| Native Born | 221 (93.6%) | 15 (6.4%) |
| Foreign Born, Citizen | 460 (98.7%) | 6 (1.3%) |
| Foreign Born, not a Citizen | 289 (95.1%) | 15 (4.9%) |
Health Insurance Coverage by Household Income in Jesup
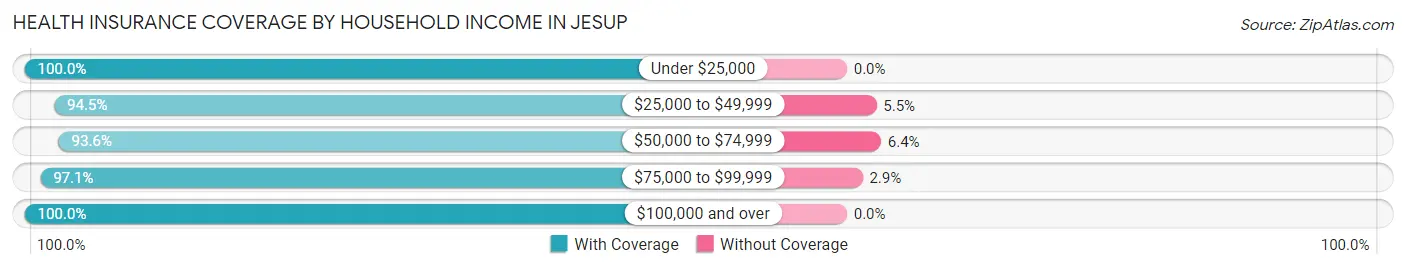
| Household Income | With Coverage | Without Coverage |
| Under $25,000 | 167 (100.0%) | 0 (0.0%) |
| $25,000 to $49,999 | 205 (94.5%) | 12 (5.5%) |
| $50,000 to $74,999 | 440 (93.6%) | 30 (6.4%) |
| $75,000 to $99,999 | 596 (97.1%) | 18 (2.9%) |
| $100,000 and over | 1,033 (100.0%) | 0 (0.0%) |
Public vs Private Health Insurance Coverage by Age in Jesup
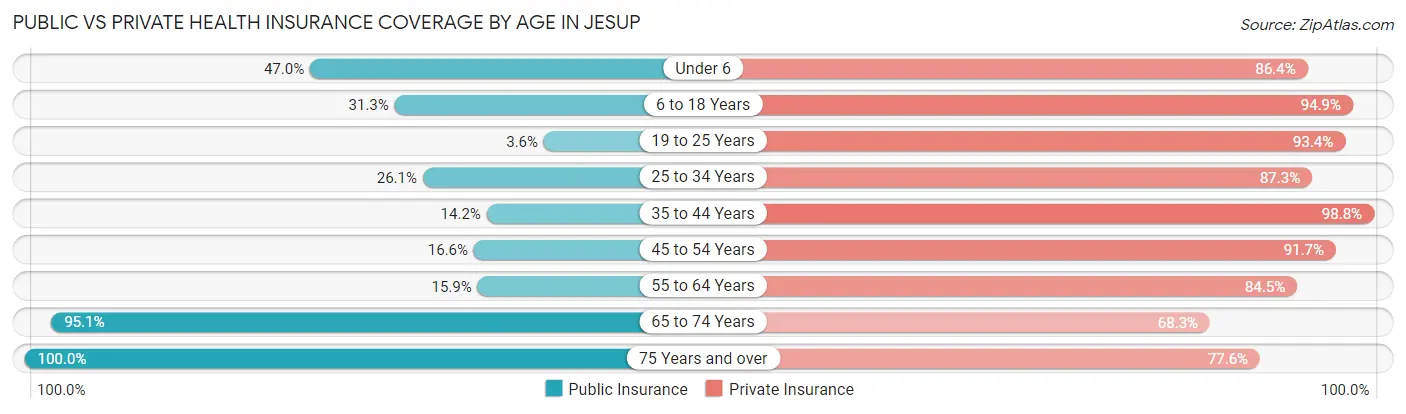
| Age Bracket | Public Insurance | Private Insurance |
| Under 6 | 111 (47.0%) | 204 (86.4%) |
| 6 to 18 Years | 146 (31.3%) | 442 (94.9%) |
| 19 to 25 Years | 11 (3.6%) | 284 (93.4%) |
| 25 to 34 Years | 84 (26.1%) | 281 (87.3%) |
| 35 to 44 Years | 46 (14.2%) | 319 (98.8%) |
| 45 to 54 Years | 48 (16.6%) | 265 (91.7%) |
| 55 to 64 Years | 36 (15.9%) | 191 (84.5%) |
| 65 to 74 Years | 192 (95.1%) | 138 (68.3%) |
| 75 Years and over | 134 (100.0%) | 104 (77.6%) |
| Total | 808 (32.3%) | 2,228 (89.0%) |
Disability Status by Sex by Age in Jesup
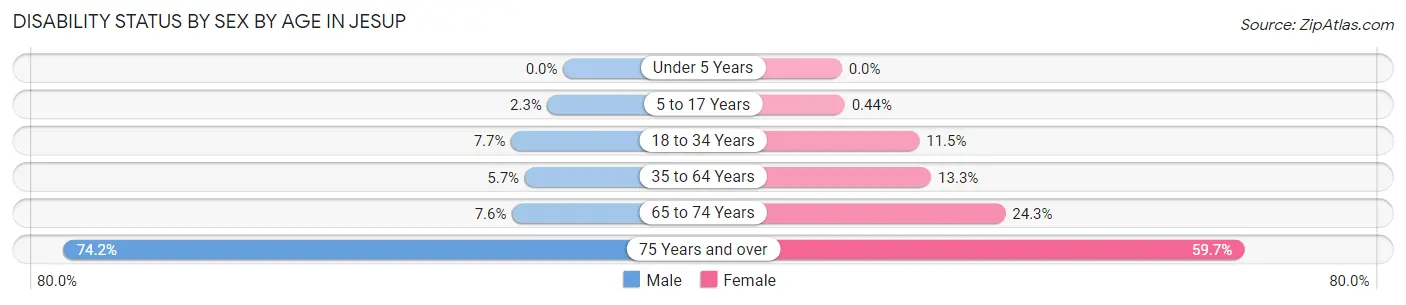
| Age Bracket | Male | Female |
| Under 5 Years | 0 (0.0%) | 0 (0.0%) |
| 5 to 17 Years | 6 (2.3%) | 1 (0.4%) |
| 18 to 34 Years | 31 (7.7%) | 29 (11.5%) |
| 35 to 64 Years | 22 (5.7%) | 60 (13.3%) |
| 65 to 74 Years | 10 (7.6%) | 17 (24.3%) |
| 75 Years and over | 46 (74.2%) | 43 (59.7%) |
Disability Class by Sex by Age in Jesup
Disability Class: Hearing Difficulty
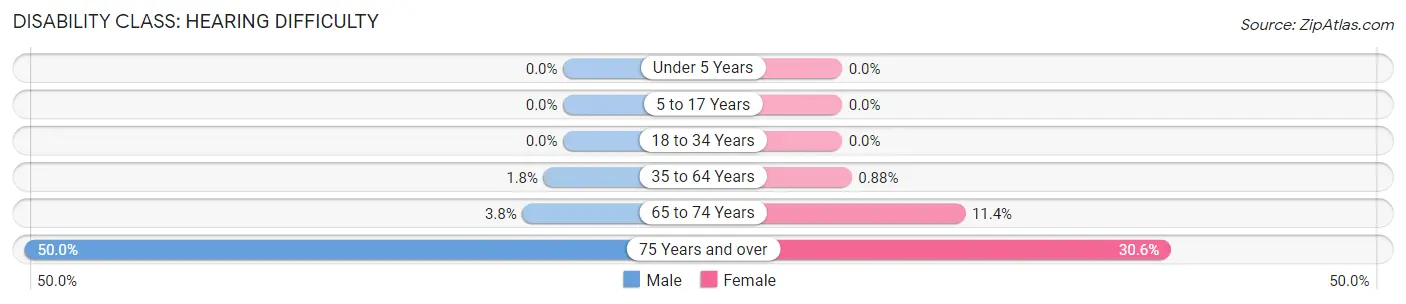
| Age Bracket | Male | Female |
| Under 5 Years | 0 (0.0%) | 0 (0.0%) |
| 5 to 17 Years | 0 (0.0%) | 0 (0.0%) |
| 18 to 34 Years | 0 (0.0%) | 0 (0.0%) |
| 35 to 64 Years | 7 (1.8%) | 4 (0.9%) |
| 65 to 74 Years | 5 (3.8%) | 8 (11.4%) |
| 75 Years and over | 31 (50.0%) | 22 (30.6%) |
Disability Class: Vision Difficulty
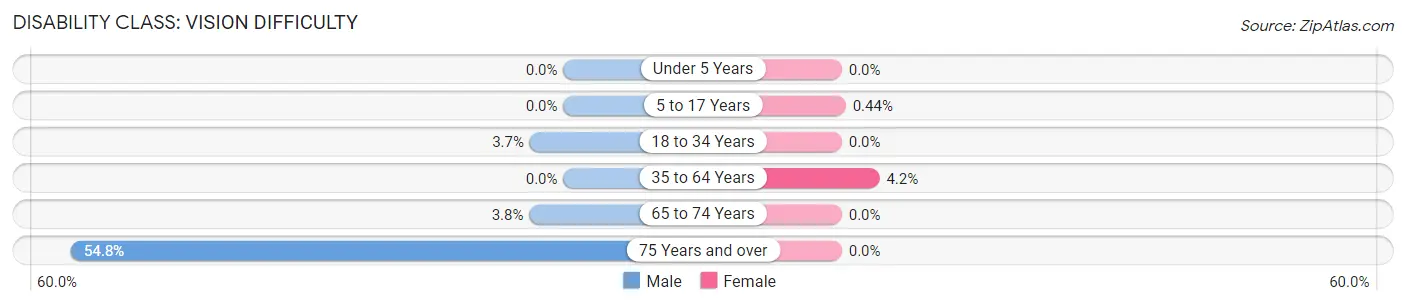
| Age Bracket | Male | Female |
| Under 5 Years | 0 (0.0%) | 0 (0.0%) |
| 5 to 17 Years | 0 (0.0%) | 1 (0.4%) |
| 18 to 34 Years | 15 (3.7%) | 0 (0.0%) |
| 35 to 64 Years | 0 (0.0%) | 19 (4.2%) |
| 65 to 74 Years | 5 (3.8%) | 0 (0.0%) |
| 75 Years and over | 34 (54.8%) | 0 (0.0%) |
Disability Class: Cognitive Difficulty
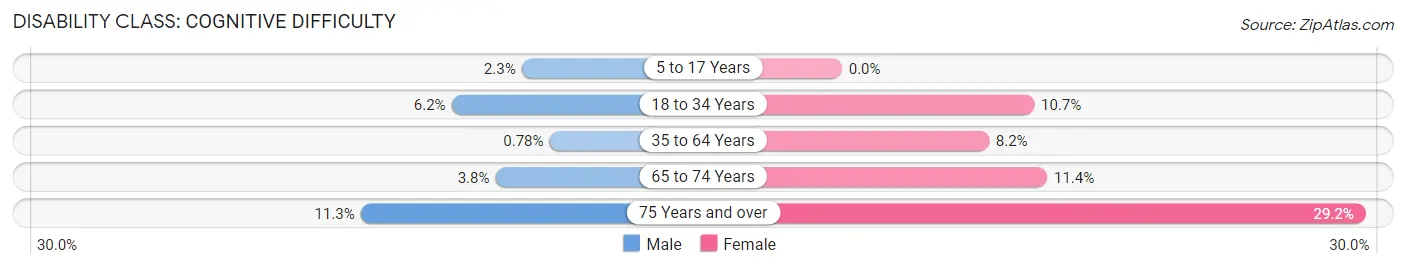
| Age Bracket | Male | Female |
| 5 to 17 Years | 6 (2.3%) | 0 (0.0%) |
| 18 to 34 Years | 25 (6.2%) | 27 (10.7%) |
| 35 to 64 Years | 3 (0.8%) | 37 (8.2%) |
| 65 to 74 Years | 5 (3.8%) | 8 (11.4%) |
| 75 Years and over | 7 (11.3%) | 21 (29.2%) |
Disability Class: Ambulatory Difficulty
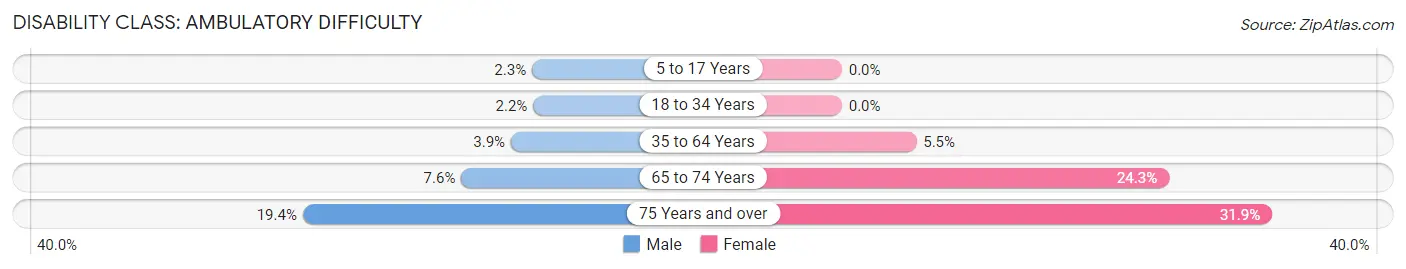
| Age Bracket | Male | Female |
| 5 to 17 Years | 6 (2.3%) | 0 (0.0%) |
| 18 to 34 Years | 9 (2.2%) | 0 (0.0%) |
| 35 to 64 Years | 15 (3.9%) | 25 (5.5%) |
| 65 to 74 Years | 10 (7.6%) | 17 (24.3%) |
| 75 Years and over | 12 (19.4%) | 23 (31.9%) |
Disability Class: Self-Care Difficulty
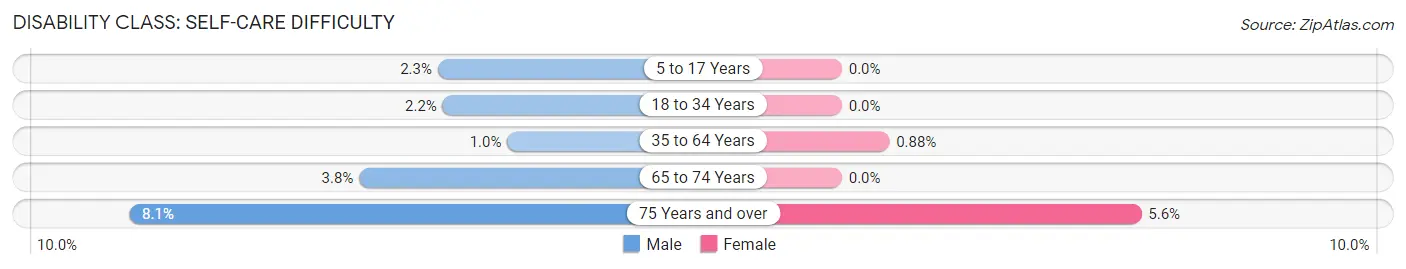
| Age Bracket | Male | Female |
| 5 to 17 Years | 6 (2.3%) | 0 (0.0%) |
| 18 to 34 Years | 9 (2.2%) | 0 (0.0%) |
| 35 to 64 Years | 4 (1.0%) | 4 (0.9%) |
| 65 to 74 Years | 5 (3.8%) | 0 (0.0%) |
| 75 Years and over | 5 (8.1%) | 4 (5.6%) |
Technology Access in Jesup
Computing Device Access in Jesup
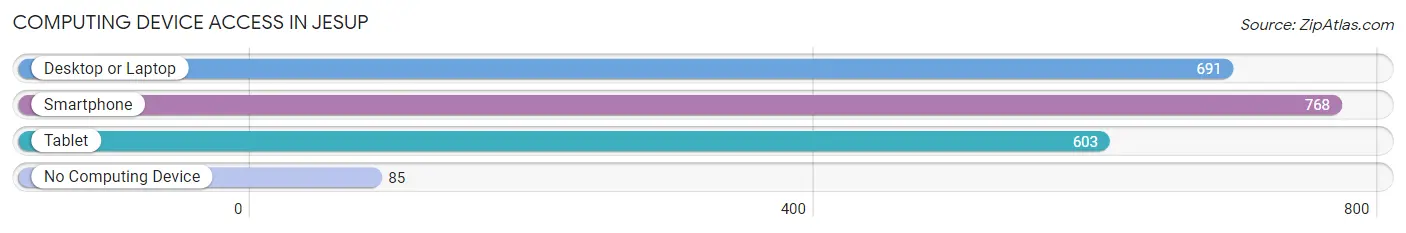
| Device Type | # Households | % Households |
| Desktop or Laptop | 691 | 77.6% |
| Smartphone | 768 | 86.3% |
| Tablet | 603 | 67.7% |
| No Computing Device | 85 | 9.6% |
| Total | 890 | 100.0% |
Internet Access in Jesup
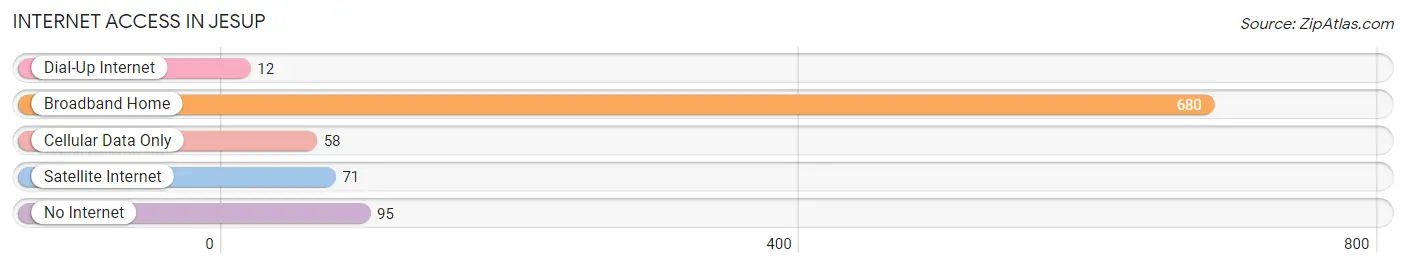
| Internet Type | # Households | % Households |
| Dial-Up Internet | 12 | 1.3% |
| Broadband Home | 680 | 76.4% |
| Cellular Data Only | 58 | 6.5% |
| Satellite Internet | 71 | 8.0% |
| No Internet | 95 | 10.7% |
| Total | 890 | 100.0% |
Jesup Summary
Jesup, Iowa is a small city located in Black Hawk County, Iowa. It is situated on the banks of the Cedar River, about 10 miles south of Waterloo. The city has a population of approximately 2,500 people and is part of the Waterloo-Cedar Falls Metropolitan Statistical Area.
History
Jesup was founded in 1855 by a group of settlers from New York. The city was named after a prominent local businessman, John Jesup. The city was incorporated in 1872 and has since grown to become a thriving community.
Jesup has a rich history of industry and agriculture. In the late 19th century, the city was home to a number of factories, including a flour mill, a sawmill, a brickyard, and a furniture factory. The city also had a thriving agricultural industry, with many farmers growing corn, oats, and hay.
In the early 20th century, Jesup was home to a number of businesses, including a bank, a hotel, a movie theater, and a variety of stores. The city also had a number of churches, including the First Presbyterian Church, which was founded in 1872.
Geography
Jesup is located in Black Hawk County, Iowa, about 10 miles south of Waterloo. The city is situated on the banks of the Cedar River, which flows through the city. The city has a total area of 1.7 square miles, all of which is land.
The city has a humid continental climate, with hot summers and cold winters. The average temperature in the summer is around 75 degrees Fahrenheit, while the average temperature in the winter is around 25 degrees Fahrenheit.
Economy
Jesup has a strong economy, with a variety of businesses and industries. The city is home to a number of manufacturing companies, including a furniture factory, a printing company, and a plastics manufacturer. The city also has a number of retail stores, including a grocery store, a hardware store, and a variety of specialty shops.
The city is also home to a number of healthcare facilities, including a hospital, a nursing home, and a number of medical clinics. The city also has a number of educational institutions, including a public school system and a community college.
Demographics
As of the 2010 census, Jesup had a population of 2,500 people. The racial makeup of the city was 97.2% White, 0.8% African American, 0.4% Native American, 0.4% Asian, and 0.2% from other races. The median household income was $41,250, and the median family income was $50,000.
The city has a large number of residents who are over the age of 65. The median age of the population is 44.7 years, and the gender ratio is almost even, with 50.2% of the population being female and 49.8% being male.
Conclusion
Jesup, Iowa is a small city located in Black Hawk County, Iowa. It is situated on the banks of the Cedar River, about 10 miles south of Waterloo. The city has a population of approximately 2,500 people and is part of the Waterloo-Cedar Falls Metropolitan Statistical Area. Jesup has a rich history of industry and agriculture, and a strong economy with a variety of businesses and industries. The city has a diverse population, with a median age of 44.7 years and a gender ratio that is almost even. Jesup is a thriving community that offers its residents a variety of opportunities for work, education, and recreation.
Common Questions
What is Per Capita Income in Jesup?
Per Capita income in Jesup is $31,799.
What is the Median Family Income in Jesup?
Median Family Income in Jesup is $85,268.
What is the Median Household income in Jesup?
Median Household Income in Jesup is $83,519.
What is Income or Wage Gap in Jesup?
Income or Wage Gap in Jesup is 24.2%.
Women in Jesup earn 75.8 cents for every dollar earned by a man.
What is Inequality or Gini Index in Jesup?
Inequality or Gini Index in Jesup is 0.32.
What is the Total Population of Jesup?
Total Population of Jesup is 2,502.
What is the Total Male Population of Jesup?
Total Male Population of Jesup is 1,350.
What is the Total Female Population of Jesup?
Total Female Population of Jesup is 1,152.
What is the Ratio of Males per 100 Females in Jesup?
There are 117.19 Males per 100 Females in Jesup.
What is the Ratio of Females per 100 Males in Jesup?
There are 85.33 Females per 100 Males in Jesup.
What is the Median Population Age in Jesup?
Median Population Age in Jesup is 33.0 Years.
What is the Average Family Size in Jesup
Average Family Size in Jesup is 3.1 People.
What is the Average Household Size in Jesup
Average Household Size in Jesup is 2.8 People.
How Large is the Labor Force in Jesup?
There are 1,332 People in the Labor Forcein in Jesup.
What is the Percentage of People in the Labor Force in Jesup?
69.9% of People are in the Labor Force in Jesup.
What is the Unemployment Rate in Jesup?
Unemployment Rate in Jesup is 4.7%.