St Paul, IA Map & Demographics
St Paul Map
St Paul Overview
$38,998
PER CAPITA INCOME
$83,750
AVG FAMILY INCOME
$83,250
AVG HOUSEHOLD INCOME
21.4%
WAGE / INCOME GAP [ % ]
78.6¢/ $1
WAGE / INCOME GAP [ $ ]
0.23
INEQUALITY / GINI INDEX
65
TOTAL POPULATION
27
MALE POPULATION
38
FEMALE POPULATION
71.05
MALES / 100 FEMALES
140.74
FEMALES / 100 MALES
32.7
MEDIAN AGE
2.4
AVG FAMILY SIZE
2.1
AVG HOUSEHOLD SIZE
41
LABOR FORCE [ PEOPLE ]
77.4%
PERCENT IN LABOR FORCE
Income in St Paul
Income Overview in St Paul
Per Capita Income in St Paul is $38,998, while median incomes of families and households are $83,750 and $83,250 respectively.
| Characteristic | Number | Measure |
| Per Capita Income | 65 | $38,998 |
| Median Family Income | 23 | $83,750 |
| Mean Family Income | 23 | $86,422 |
| Median Household Income | 31 | $83,250 |
| Mean Household Income | 31 | $82,281 |
| Income Deficit | 23 | $0 |
| Wage / Income Gap (%) | 65 | 21.36% |
| Wage / Income Gap ($) | 65 | 78.64¢ per $1 |
| Gini / Inequality Index | 65 | 0.23 |
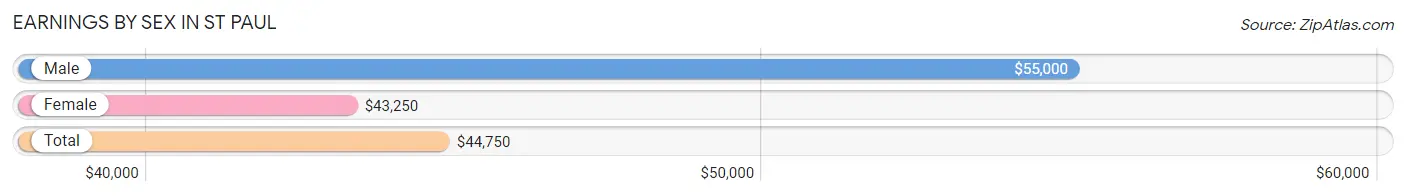
Earnings by Sex in St Paul
Average Earnings in St Paul are $44,750, $55,000 for men and $43,250 for women, a difference of 21.4%.
| Sex | Number | Average Earnings |
| Male | 14 (34.2%) | $55,000 |
| Female | 27 (65.8%) | $43,250 |
| Total | 41 (100.0%) | $44,750 |
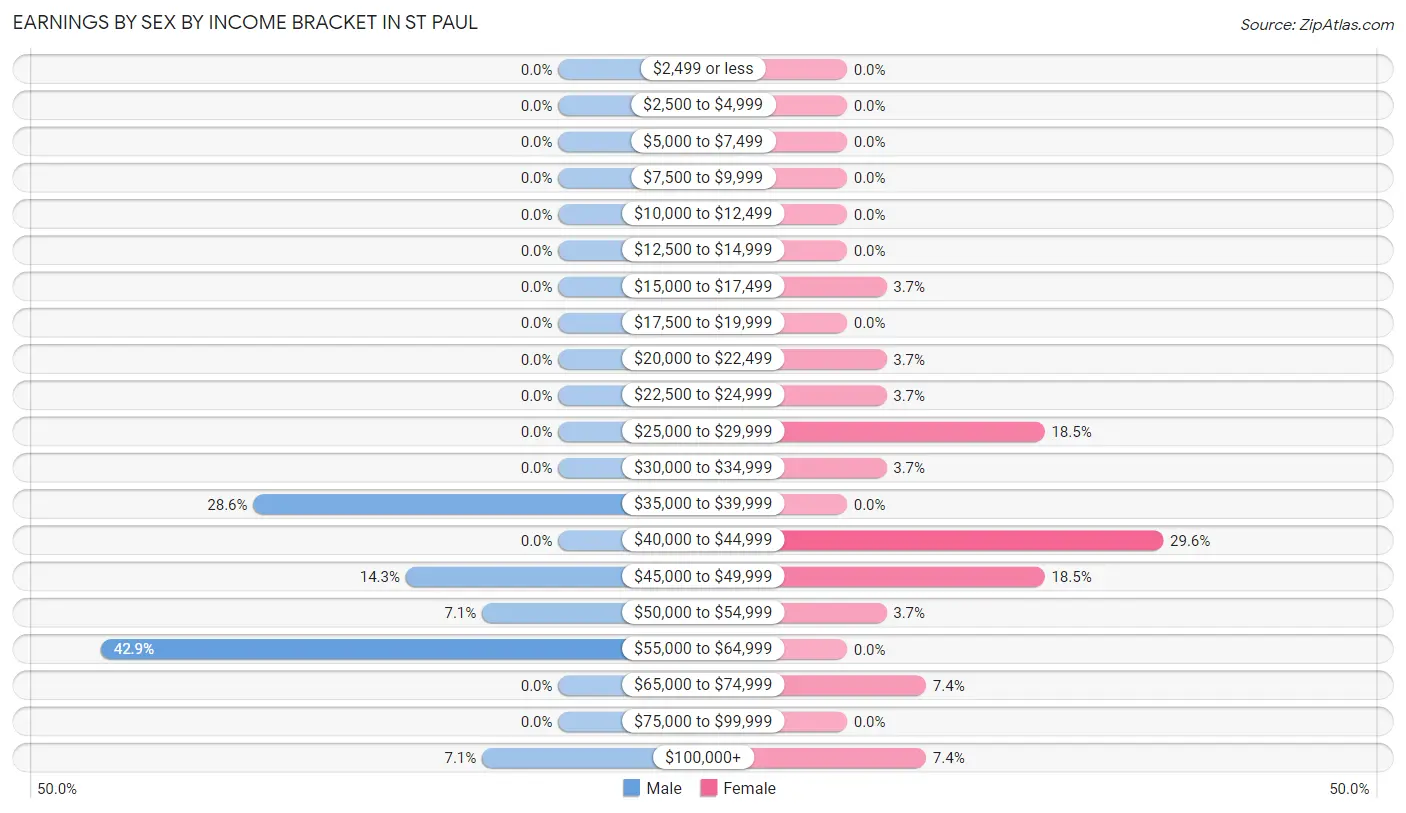
Earnings by Sex by Income Bracket in St Paul
The most common earnings brackets in St Paul are $55,000 to $64,999 for men (6 | 42.9%) and $40,000 to $44,999 for women (8 | 29.6%).
| Income | Male | Female |
| $2,499 or less | 0 (0.0%) | 0 (0.0%) |
| $2,500 to $4,999 | 0 (0.0%) | 0 (0.0%) |
| $5,000 to $7,499 | 0 (0.0%) | 0 (0.0%) |
| $7,500 to $9,999 | 0 (0.0%) | 0 (0.0%) |
| $10,000 to $12,499 | 0 (0.0%) | 0 (0.0%) |
| $12,500 to $14,999 | 0 (0.0%) | 0 (0.0%) |
| $15,000 to $17,499 | 0 (0.0%) | 1 (3.7%) |
| $17,500 to $19,999 | 0 (0.0%) | 0 (0.0%) |
| $20,000 to $22,499 | 0 (0.0%) | 1 (3.7%) |
| $22,500 to $24,999 | 0 (0.0%) | 1 (3.7%) |
| $25,000 to $29,999 | 0 (0.0%) | 5 (18.5%) |
| $30,000 to $34,999 | 0 (0.0%) | 1 (3.7%) |
| $35,000 to $39,999 | 4 (28.6%) | 0 (0.0%) |
| $40,000 to $44,999 | 0 (0.0%) | 8 (29.6%) |
| $45,000 to $49,999 | 2 (14.3%) | 5 (18.5%) |
| $50,000 to $54,999 | 1 (7.1%) | 1 (3.7%) |
| $55,000 to $64,999 | 6 (42.9%) | 0 (0.0%) |
| $65,000 to $74,999 | 0 (0.0%) | 2 (7.4%) |
| $75,000 to $99,999 | 0 (0.0%) | 0 (0.0%) |
| $100,000+ | 1 (7.1%) | 2 (7.4%) |
| Total | 14 (100.0%) | 27 (100.0%) |
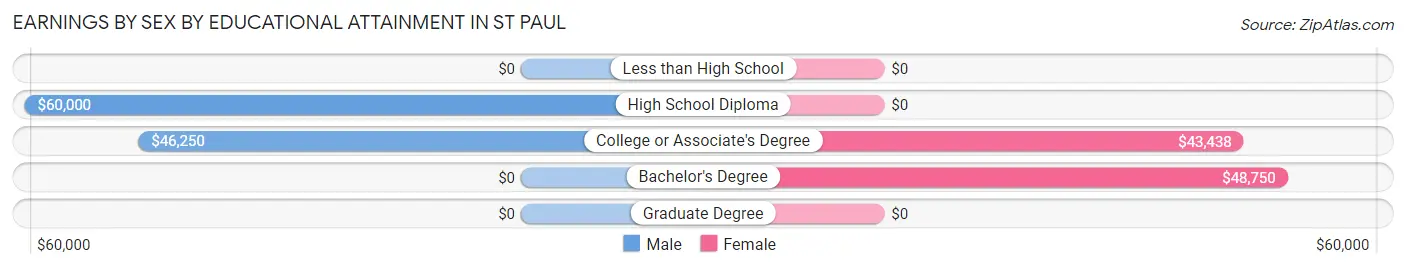
Earnings by Sex by Educational Attainment in St Paul
Average earnings in St Paul are $55,000 for men and $43,250 for women, a difference of 21.4%. Men with an educational attainment of high school diploma enjoy the highest average annual earnings of $60,000, while those with college or associate's degree education earn the least with $46,250. Women with an educational attainment of bachelor's degree earn the most with the average annual earnings of $48,750, while those with college or associate's degree education have the smallest earnings of $43,438.
| Educational Attainment | Male Income | Female Income |
| Less than High School | - | - |
| High School Diploma | $60,000 | $0 |
| College or Associate's Degree | $46,250 | $43,438 |
| Bachelor's Degree | - | - |
| Graduate Degree | - | - |
| Total | $55,000 | $43,250 |
Family Income in St Paul
Family Income Brackets in St Paul
According to the St Paul family income data, there are 11 families falling into the $75,000 to $99,999 income range, which is the most common income bracket and makes up 47.8% of all families.
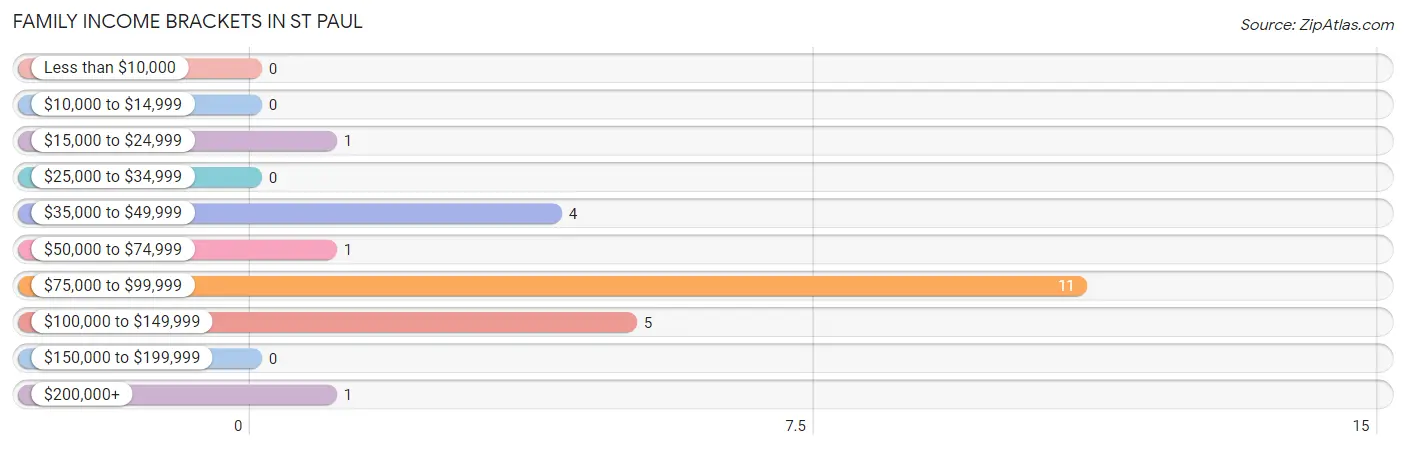
| Income Bracket | # Families | % Families |
| Less than $10,000 | 0 | 0.0% |
| $10,000 to $14,999 | 0 | 0.0% |
| $15,000 to $24,999 | 1 | 4.3% |
| $25,000 to $34,999 | 0 | 0.0% |
| $35,000 to $49,999 | 4 | 17.4% |
| $50,000 to $74,999 | 1 | 4.3% |
| $75,000 to $99,999 | 11 | 47.8% |
| $100,000 to $149,999 | 5 | 21.7% |
| $150,000 to $199,999 | 0 | 0.0% |
| $200,000+ | 1 | 4.3% |
Family Income by Famaliy Size in St Paul
2-person families (18 | 78.3%) account for the highest median family income in St Paul with $84,000 per family, while 2-person families (18 | 78.3%) have the highest median income of $42,000 per family member.
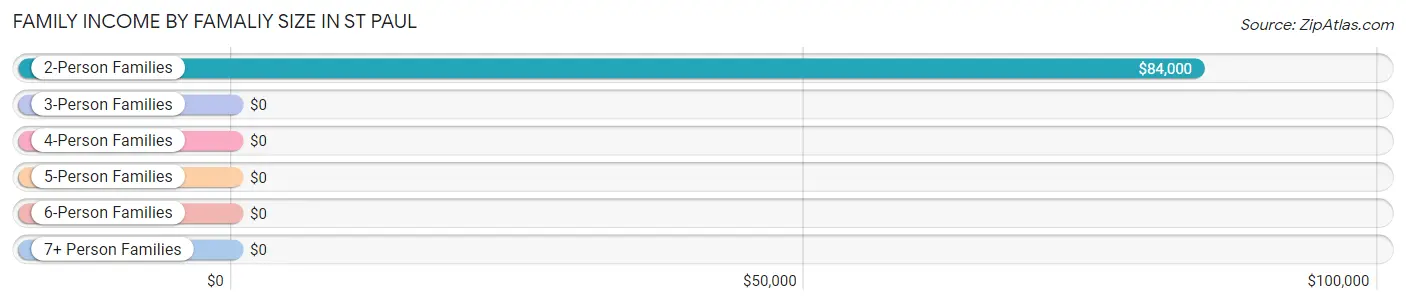
| Income Bracket | # Families | Median Income |
| 2-Person Families | 18 (78.3%) | $84,000 |
| 3-Person Families | 0 (0.0%) | $0 |
| 4-Person Families | 5 (21.7%) | $0 |
| 5-Person Families | 0 (0.0%) | $0 |
| 6-Person Families | 0 (0.0%) | $0 |
| 7+ Person Families | 0 (0.0%) | $0 |
| Total | 23 (100.0%) | $83,750 |
Family Income by Number of Earners in St Paul
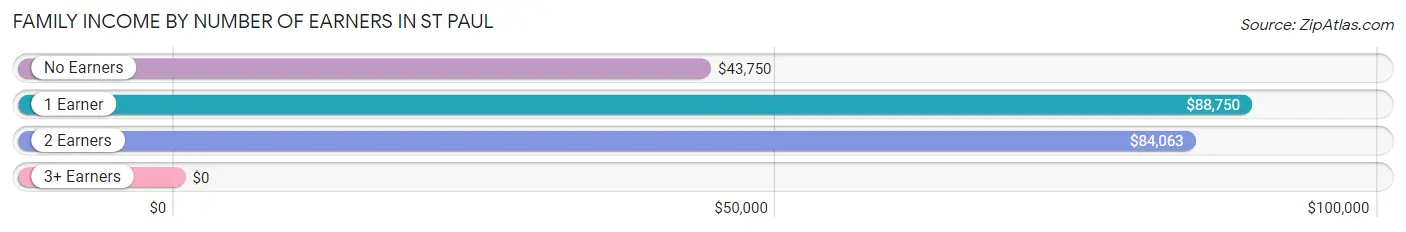
| Number of Earners | # Families | Median Income |
| No Earners | 4 (17.4%) | $43,750 |
| 1 Earner | 6 (26.1%) | $88,750 |
| 2 Earners | 13 (56.5%) | $84,063 |
| 3+ Earners | 0 (0.0%) | $0 |
| Total | 23 (100.0%) | $83,750 |
Household Income in St Paul
Household Income Brackets in St Paul
With 14 households falling in the category, the $75,000 to $99,999 income range is the most frequent in St Paul, accounting for 45.2% of all households.
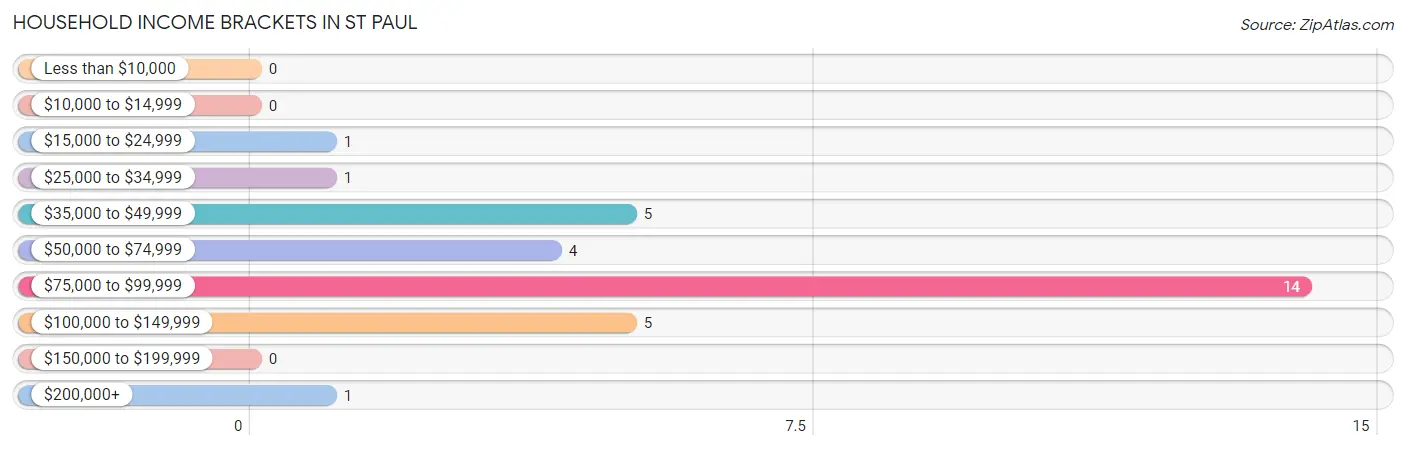
| Income Bracket | # Households | % Households |
| Less than $10,000 | 0 | 0.0% |
| $10,000 to $14,999 | 0 | 0.0% |
| $15,000 to $24,999 | 1 | 3.2% |
| $25,000 to $34,999 | 1 | 3.2% |
| $35,000 to $49,999 | 5 | 16.1% |
| $50,000 to $74,999 | 4 | 12.9% |
| $75,000 to $99,999 | 14 | 45.2% |
| $100,000 to $149,999 | 5 | 16.1% |
| $150,000 to $199,999 | 0 | 0.0% |
| $200,000+ | 1 | 3.2% |
Household Income by Householder Age in St Paul
The median household income in St Paul is $83,250, with the highest median household income of $84,063 found in the 25 to 44 years age bracket for the primary householder. A total of 19 households (61.3%) fall into this category.
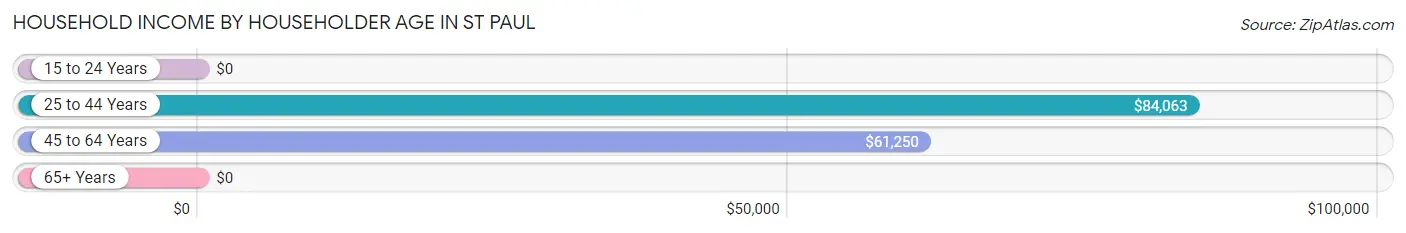
| Income Bracket | # Households | Median Income |
| 15 to 24 Years | 0 (0.0%) | $0 |
| 25 to 44 Years | 19 (61.3%) | $84,063 |
| 45 to 64 Years | 7 (22.6%) | $61,250 |
| 65+ Years | 5 (16.1%) | $0 |
| Total | 31 (100.0%) | $83,250 |
Poverty in St Paul
Income Below Poverty by Sex and Age in St Paul
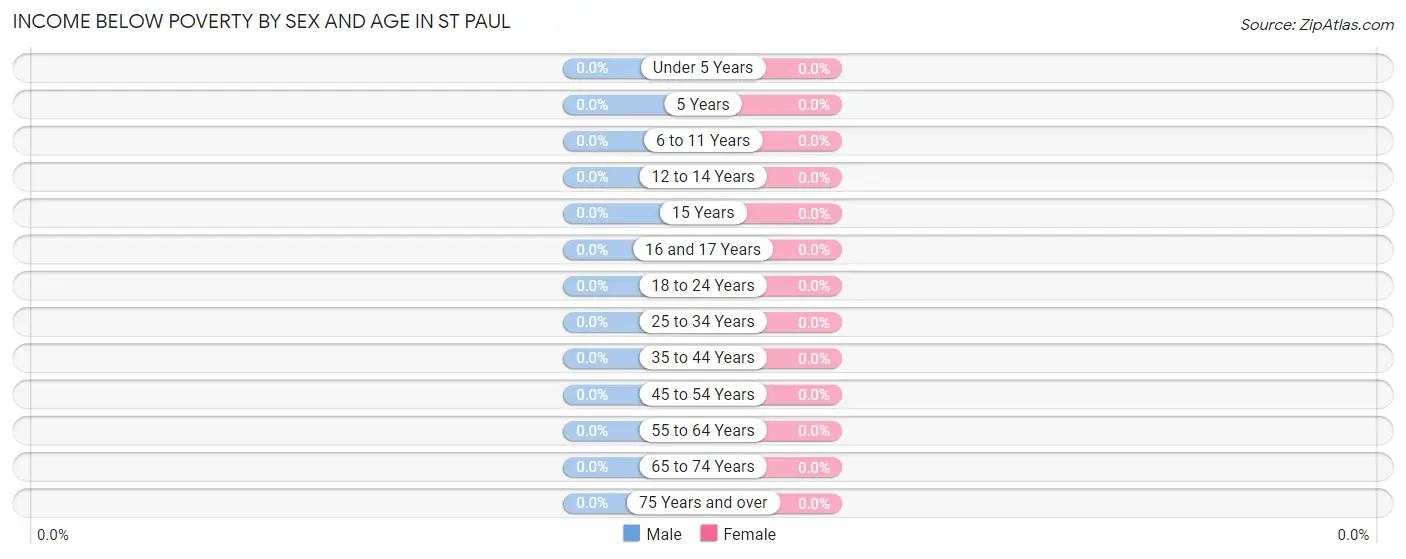
| Age Bracket | Male | Female |
| Under 5 Years | 0 (0.0%) | 0 (0.0%) |
| 5 Years | 0 (0.0%) | 0 (0.0%) |
| 6 to 11 Years | 0 (0.0%) | 0 (0.0%) |
| 12 to 14 Years | 0 (0.0%) | 0 (0.0%) |
| 15 Years | 0 (0.0%) | 0 (0.0%) |
| 16 and 17 Years | 0 (0.0%) | 0 (0.0%) |
| 18 to 24 Years | 0 (0.0%) | 0 (0.0%) |
| 25 to 34 Years | 0 (0.0%) | 0 (0.0%) |
| 35 to 44 Years | 0 (0.0%) | 0 (0.0%) |
| 45 to 54 Years | 0 (0.0%) | 0 (0.0%) |
| 55 to 64 Years | 0 (0.0%) | 0 (0.0%) |
| 65 to 74 Years | 0 (0.0%) | 0 (0.0%) |
| 75 Years and over | 0 (0.0%) | 0 (0.0%) |
| Total | 0 (0.0%) | 0 (0.0%) |
Income Above Poverty by Sex and Age in St Paul
According to the poverty statistics in St Paul, males aged under 5 years and females aged 6 to 11 years are the age groups that are most secure financially, with 100.0% of males and 100.0% of females in these age groups living above the poverty line.
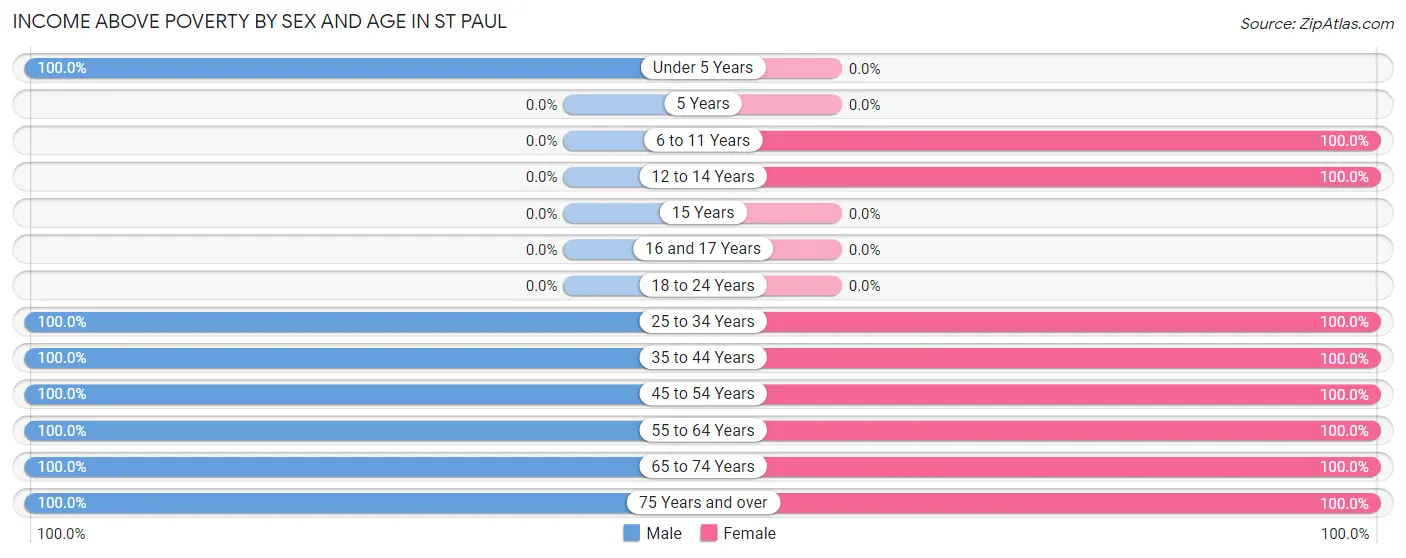
| Age Bracket | Male | Female |
| Under 5 Years | 5 (100.0%) | 0 (0.0%) |
| 5 Years | 0 (0.0%) | 0 (0.0%) |
| 6 to 11 Years | 0 (0.0%) | 5 (100.0%) |
| 12 to 14 Years | 0 (0.0%) | 2 (100.0%) |
| 15 Years | 0 (0.0%) | 0 (0.0%) |
| 16 and 17 Years | 0 (0.0%) | 0 (0.0%) |
| 18 to 24 Years | 0 (0.0%) | 0 (0.0%) |
| 25 to 34 Years | 5 (100.0%) | 17 (100.0%) |
| 35 to 44 Years | 6 (100.0%) | 4 (100.0%) |
| 45 to 54 Years | 2 (100.0%) | 2 (100.0%) |
| 55 to 64 Years | 4 (100.0%) | 4 (100.0%) |
| 65 to 74 Years | 4 (100.0%) | 2 (100.0%) |
| 75 Years and over | 1 (100.0%) | 2 (100.0%) |
| Total | 27 (100.0%) | 38 (100.0%) |
Income Below Poverty Among Married-Couple Families in St Paul
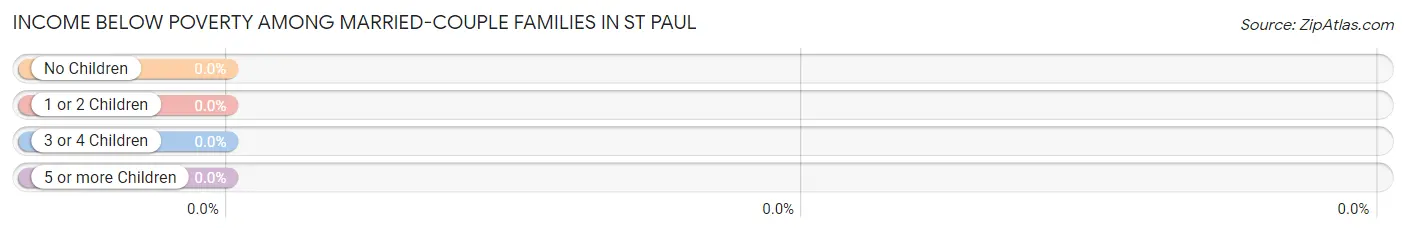
| Children | Above Poverty | Below Poverty |
| No Children | 15 (100.0%) | 0 (0.0%) |
| 1 or 2 Children | 5 (100.0%) | 0 (0.0%) |
| 3 or 4 Children | 0 (0.0%) | 0 (0.0%) |
| 5 or more Children | 0 (0.0%) | 0 (0.0%) |
| Total | 20 (100.0%) | 0 (0.0%) |
Income Below Poverty Among Single-Parent Households in St Paul
| Children | Single Father | Single Mother |
| No Children | 0 (0.0%) | 0 (0.0%) |
| 1 or 2 Children | 0 (0.0%) | 0 (0.0%) |
| 3 or 4 Children | 0 (0.0%) | 0 (0.0%) |
| 5 or more Children | 0 (0.0%) | 0 (0.0%) |
| Total | 0 (0.0%) | 0 (0.0%) |
Income Below Poverty Among Married-Couple vs Single-Parent Households in St Paul
| Children | Married-Couple Families | Single-Parent Households |
| No Children | 0 (0.0%) | 0 (0.0%) |
| 1 or 2 Children | 0 (0.0%) | 0 (0.0%) |
| 3 or 4 Children | 0 (0.0%) | 0 (0.0%) |
| 5 or more Children | 0 (0.0%) | 0 (0.0%) |
| Total | 0 (0.0%) | 0 (0.0%) |
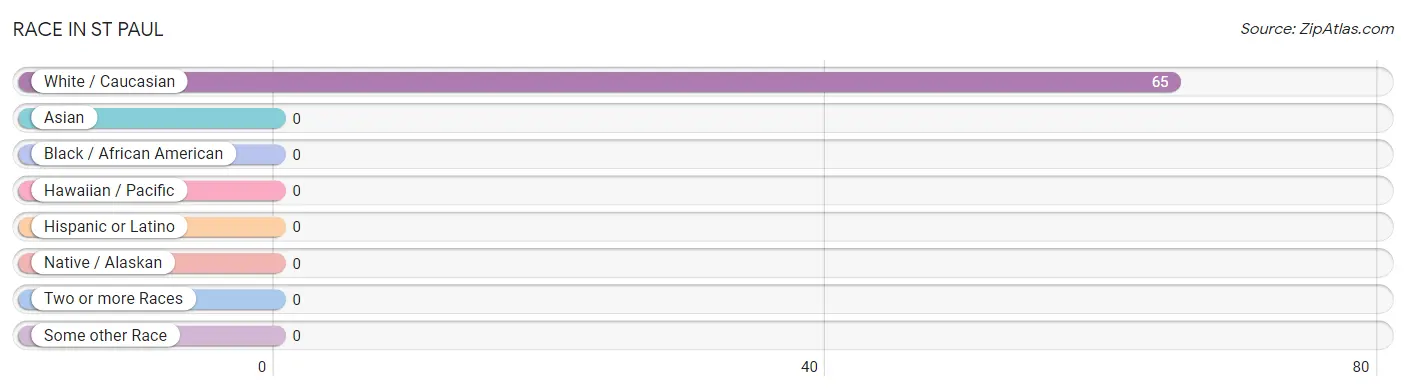
Race in St Paul
The most populous races in St Paul are , and White / Caucasian (65 | 100.0%).
| Race | # Population | % Population |
| Asian | 0 | 0.0% |
| Black / African American | 0 | 0.0% |
| Hawaiian / Pacific | 0 | 0.0% |
| Hispanic or Latino | 0 | 0.0% |
| Native / Alaskan | 0 | 0.0% |
| White / Caucasian | 65 | 100.0% |
| Two or more Races | 0 | 0.0% |
| Some other Race | 0 | 0.0% |
| Total | 65 | 100.0% |
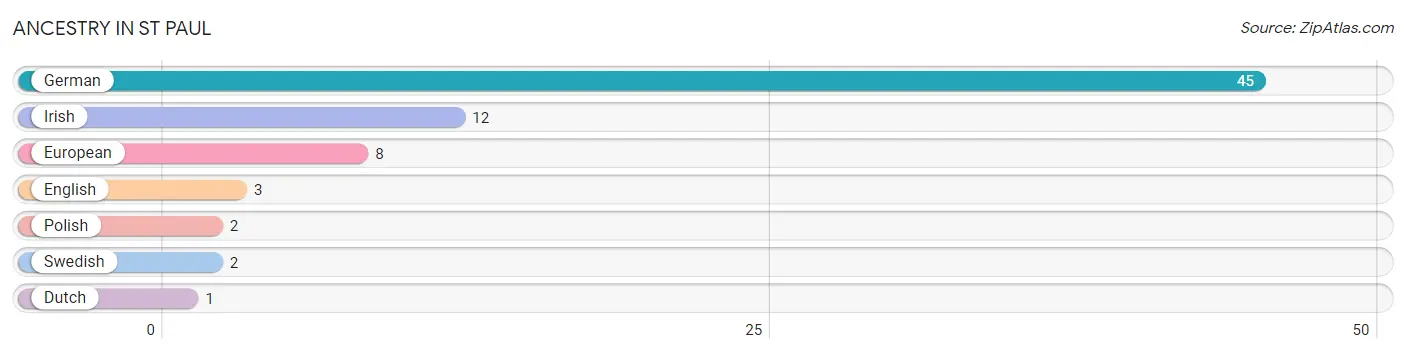
Ancestry in St Paul
The most populous ancestries reported in St Paul are German (45 | 69.2%), Irish (12 | 18.5%), European (8 | 12.3%), English (3 | 4.6%), and Polish (2 | 3.1%), together accounting for 107.7% of all St Paul residents.
| Ancestry | # Population | % Population |
| Dutch | 1 | 1.5% |
| English | 3 | 4.6% |
| European | 8 | 12.3% |
| German | 45 | 69.2% |
| Irish | 12 | 18.5% |
| Polish | 2 | 3.1% |
| Swedish | 2 | 3.1% | View All 7 Rows |
Immigrants in St Paul

| Immigration Origin | # Population | % Population | View All 0 Rows |
Sex and Age in St Paul
Sex and Age in St Paul
The most populous age groups in St Paul are Under 5 Years (5 | 18.5%) for men and 30 to 34 Years (11 | 28.9%) for women.
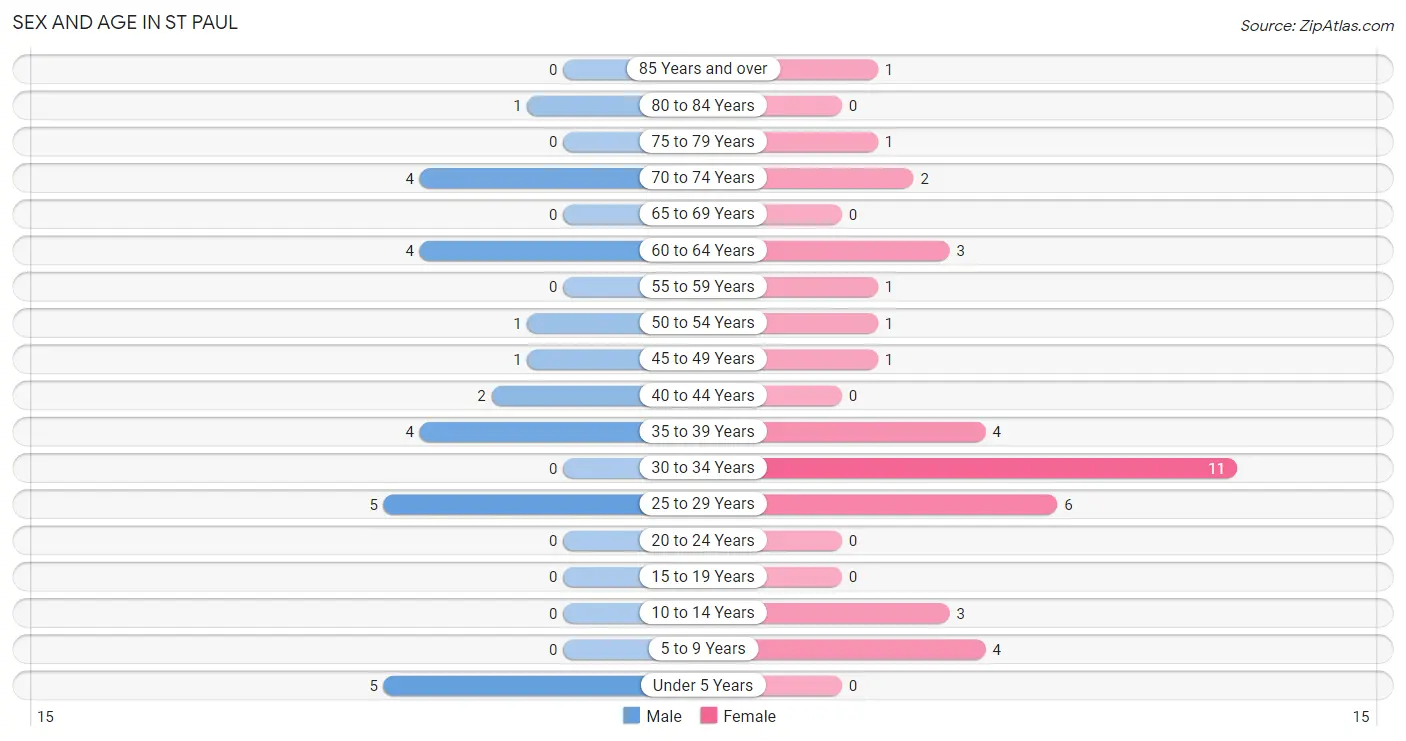
| Age Bracket | Male | Female |
| Under 5 Years | 5 (18.5%) | 0 (0.0%) |
| 5 to 9 Years | 0 (0.0%) | 4 (10.5%) |
| 10 to 14 Years | 0 (0.0%) | 3 (7.9%) |
| 15 to 19 Years | 0 (0.0%) | 0 (0.0%) |
| 20 to 24 Years | 0 (0.0%) | 0 (0.0%) |
| 25 to 29 Years | 5 (18.5%) | 6 (15.8%) |
| 30 to 34 Years | 0 (0.0%) | 11 (28.9%) |
| 35 to 39 Years | 4 (14.8%) | 4 (10.5%) |
| 40 to 44 Years | 2 (7.4%) | 0 (0.0%) |
| 45 to 49 Years | 1 (3.7%) | 1 (2.6%) |
| 50 to 54 Years | 1 (3.7%) | 1 (2.6%) |
| 55 to 59 Years | 0 (0.0%) | 1 (2.6%) |
| 60 to 64 Years | 4 (14.8%) | 3 (7.9%) |
| 65 to 69 Years | 0 (0.0%) | 0 (0.0%) |
| 70 to 74 Years | 4 (14.8%) | 2 (5.3%) |
| 75 to 79 Years | 0 (0.0%) | 1 (2.6%) |
| 80 to 84 Years | 1 (3.7%) | 0 (0.0%) |
| 85 Years and over | 0 (0.0%) | 1 (2.6%) |
| Total | 27 (100.0%) | 38 (100.0%) |
Families and Households in St Paul
Median Family Size in St Paul
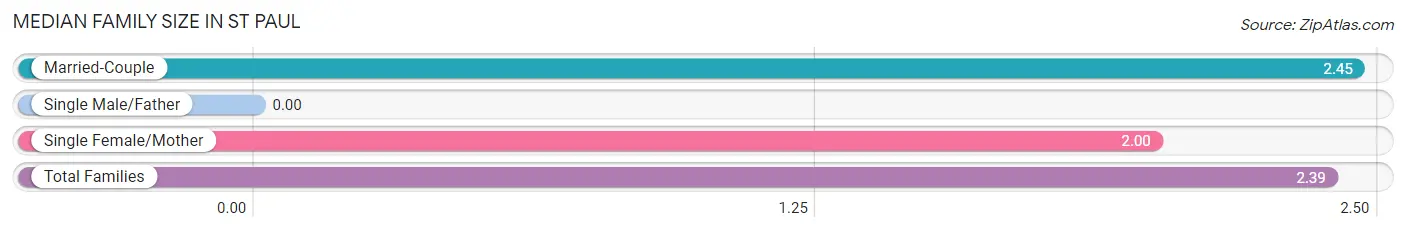
| Family Type | # Families | Family Size |
| Married-Couple | 20 (87.0%) | 2.45 |
| Single Male/Father | 0 (0.0%) | - |
| Single Female/Mother | 3 (13.0%) | 2.00 |
| Total Families | 23 (100.0%) | 2.39 |
Median Household Size in St Paul
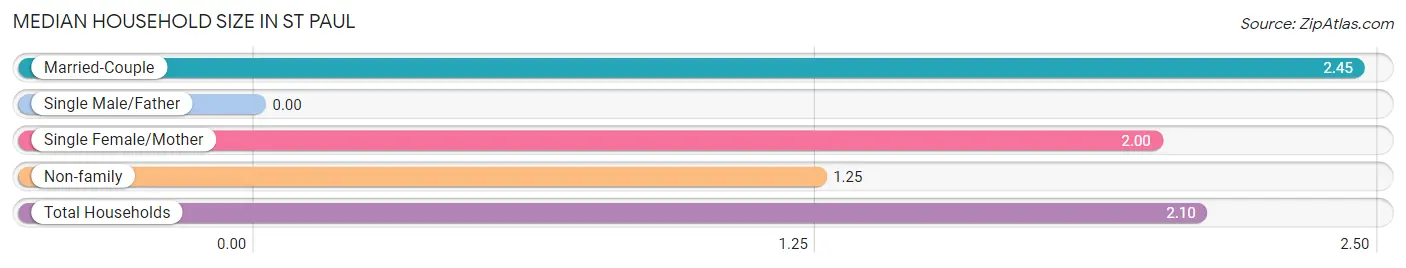
| Household Type | # Households | Household Size |
| Married-Couple | 20 (64.5%) | 2.45 |
| Single Male/Father | 0 (0.0%) | - |
| Single Female/Mother | 3 (9.7%) | 2.00 |
| Non-family | 8 (25.8%) | 1.25 |
| Total Households | 31 (100.0%) | 2.10 |
Household Size by Marriage Status in St Paul
Out of a total of 31 households in St Paul, 23 (74.2%) are family households, while 8 (25.8%) are nonfamily households. The most numerous type of family households are 2-person households, comprising 18, and the most common type of nonfamily households are 1-person households, comprising 5.
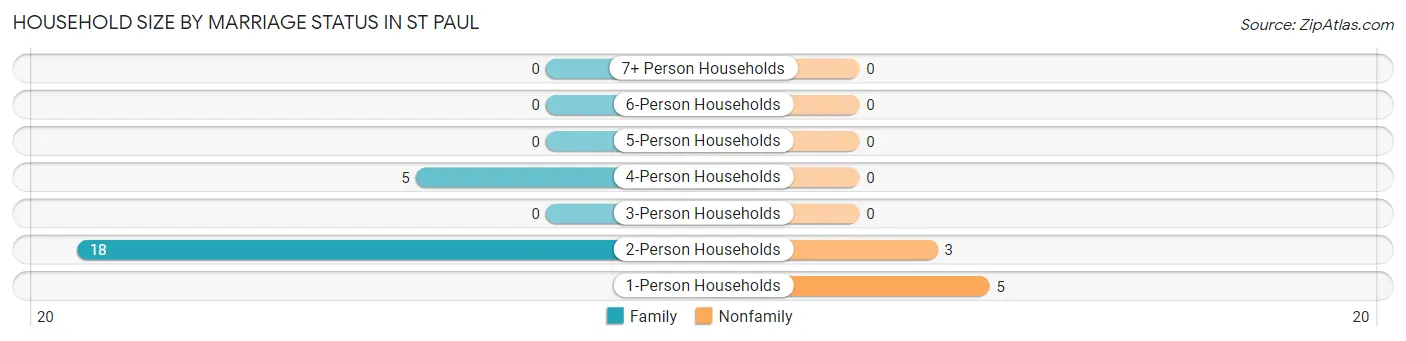
| Household Size | Family Households | Nonfamily Households |
| 1-Person Households | - | 5 (16.1%) |
| 2-Person Households | 18 (58.1%) | 3 (9.7%) |
| 3-Person Households | 0 (0.0%) | 0 (0.0%) |
| 4-Person Households | 5 (16.1%) | 0 (0.0%) |
| 5-Person Households | 0 (0.0%) | 0 (0.0%) |
| 6-Person Households | 0 (0.0%) | 0 (0.0%) |
| 7+ Person Households | 0 (0.0%) | 0 (0.0%) |
| Total | 23 (74.2%) | 8 (25.8%) |
Female Fertility in St Paul
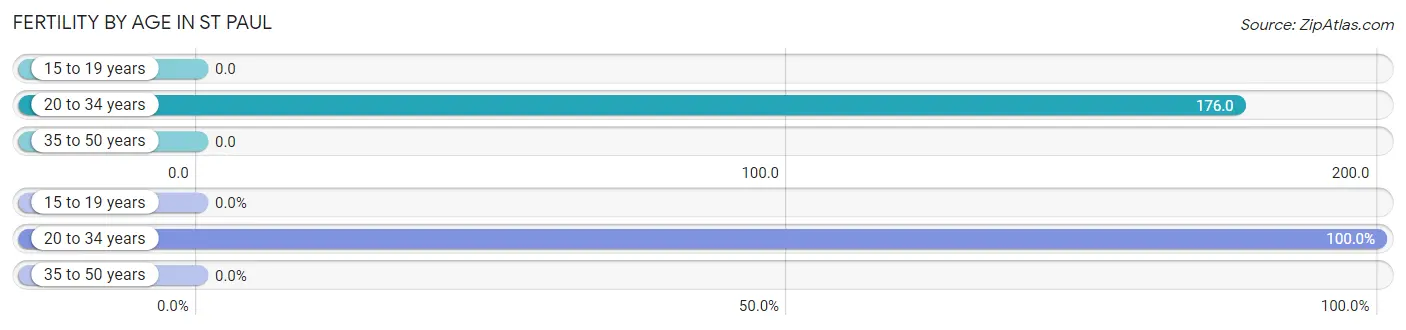
Fertility by Age in St Paul
Average fertility rate in St Paul is 136.0 births per 1,000 women. Women in the age bracket of 20 to 34 years have the highest fertility rate with 176.0 births per 1,000 women. Women in the age bracket of 20 to 34 years acount for 100.0% of all women with births.
| Age Bracket | Women with Births | Births / 1,000 Women |
| 15 to 19 years | 0 (0.0%) | 0.0 |
| 20 to 34 years | 3 (100.0%) | 176.0 |
| 35 to 50 years | 0 (0.0%) | 0.0 |
| Total | 3 (100.0%) | 136.0 |
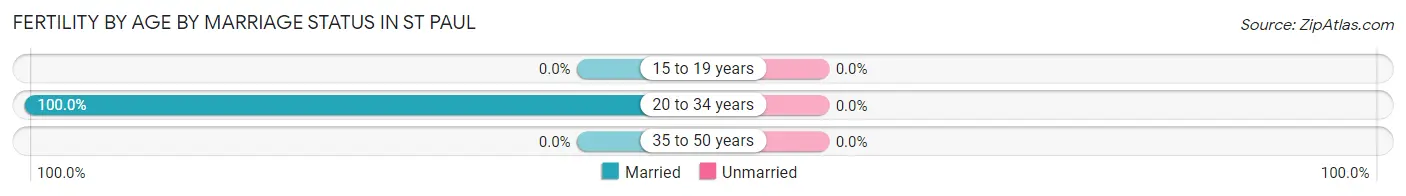
Fertility by Age by Marriage Status in St Paul
| Age Bracket | Married | Unmarried |
| 15 to 19 years | 0 (0.0%) | 0 (0.0%) |
| 20 to 34 years | 3 (100.0%) | 0 (0.0%) |
| 35 to 50 years | 0 (0.0%) | 0 (0.0%) |
| Total | 3 (100.0%) | 0 (0.0%) |
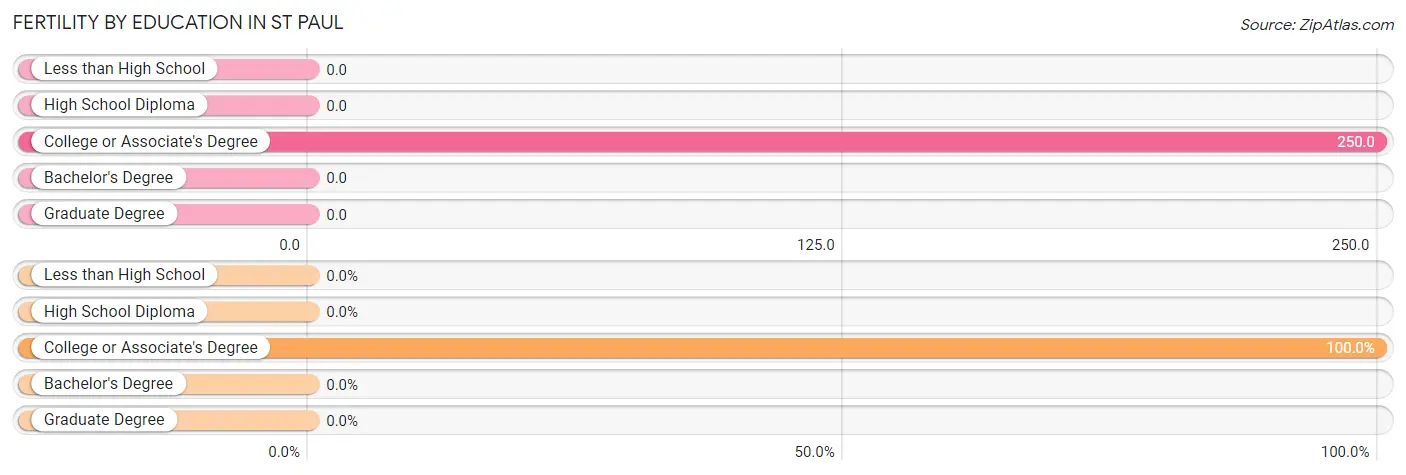
Fertility by Education in St Paul
| Educational Attainment | Women with Births | Births / 1,000 Women |
| Less than High School | 0 (0.0%) | 0.0 |
| High School Diploma | 0 (0.0%) | 0.0 |
| College or Associate's Degree | 3 (100.0%) | 250.0 |
| Bachelor's Degree | 0 (0.0%) | 0.0 |
| Graduate Degree | 0 (0.0%) | 0.0 |
| Total | 3 (100.0%) | 136.0 |
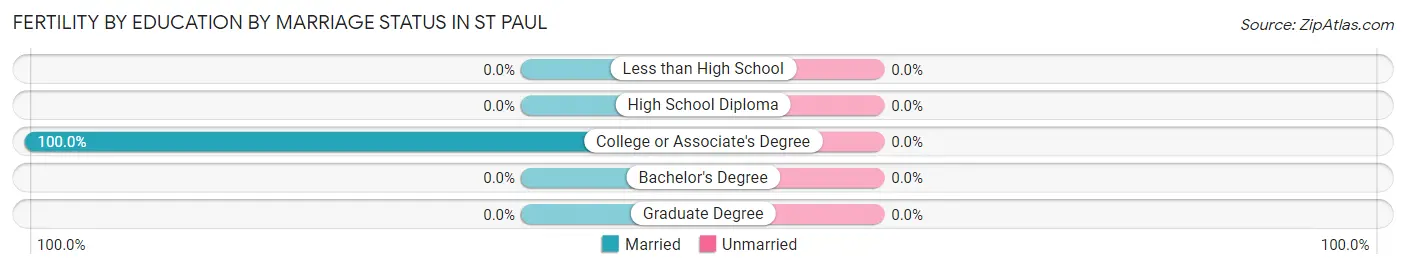
Fertility by Education by Marriage Status in St Paul
| Educational Attainment | Married | Unmarried |
| Less than High School | 0 (0.0%) | 0 (0.0%) |
| High School Diploma | 0 (0.0%) | 0 (0.0%) |
| College or Associate's Degree | 3 (100.0%) | 0 (0.0%) |
| Bachelor's Degree | 0 (0.0%) | 0 (0.0%) |
| Graduate Degree | 0 (0.0%) | 0 (0.0%) |
| Total | 3 (100.0%) | 0 (0.0%) |
Employment Characteristics in St Paul
Employment by Class of Employer in St Paul
Among the 41 employed individuals in St Paul, private company employees (32 | 78.0%), not-for-profit organizations (5 | 12.2%), and local government employees (2 | 4.9%) make up the most common classes of employment.
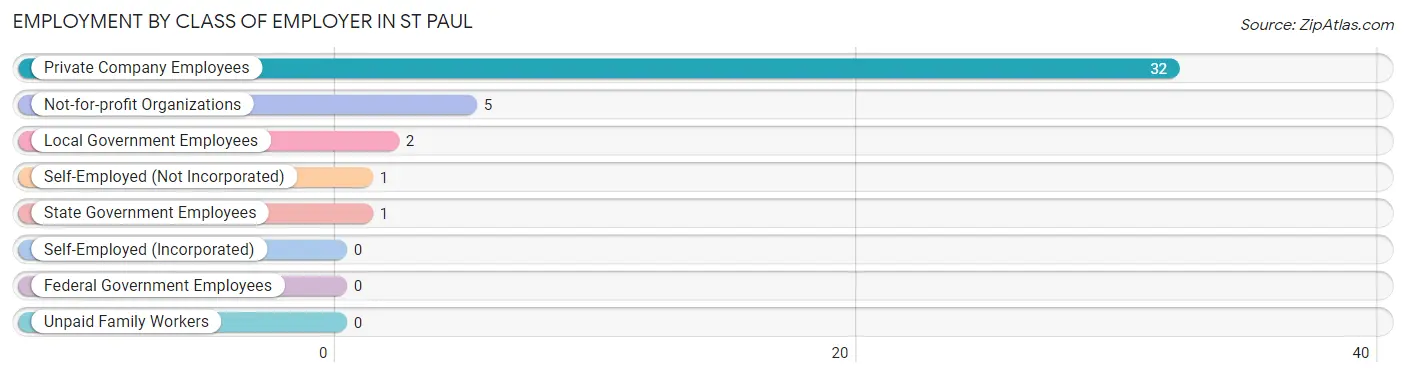
| Employer Class | # Employees | % Employees |
| Private Company Employees | 32 | 78.0% |
| Self-Employed (Incorporated) | 0 | 0.0% |
| Self-Employed (Not Incorporated) | 1 | 2.4% |
| Not-for-profit Organizations | 5 | 12.2% |
| Local Government Employees | 2 | 4.9% |
| State Government Employees | 1 | 2.4% |
| Federal Government Employees | 0 | 0.0% |
| Unpaid Family Workers | 0 | 0.0% |
| Total | 41 | 100.0% |
Employment Status by Age in St Paul
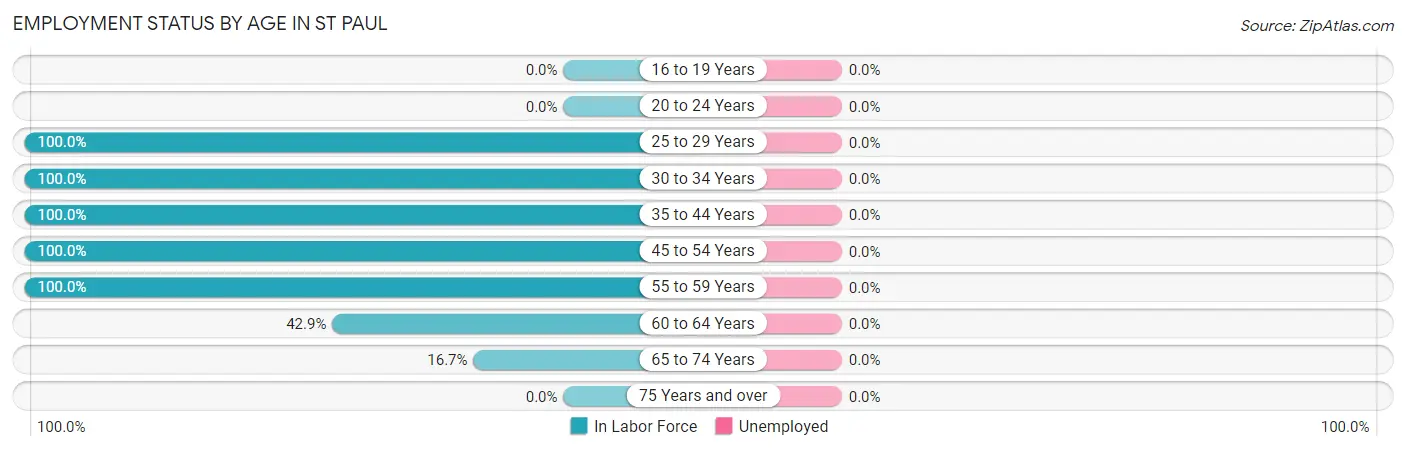
| Age Bracket | In Labor Force | Unemployed |
| 16 to 19 Years | 0 (0.0%) | 0 (0.0%) |
| 20 to 24 Years | 0 (0.0%) | 0 (0.0%) |
| 25 to 29 Years | 11 (100.0%) | 0 (0.0%) |
| 30 to 34 Years | 11 (100.0%) | 0 (0.0%) |
| 35 to 44 Years | 10 (100.0%) | 0 (0.0%) |
| 45 to 54 Years | 4 (100.0%) | 0 (0.0%) |
| 55 to 59 Years | 1 (100.0%) | 0 (0.0%) |
| 60 to 64 Years | 3 (42.9%) | 0 (0.0%) |
| 65 to 74 Years | 1 (16.7%) | 0 (0.0%) |
| 75 Years and over | 0 (0.0%) | 0 (0.0%) |
| Total | 41 (77.4%) | 0 (0.0%) |
Employment Status by Educational Attainment in St Paul
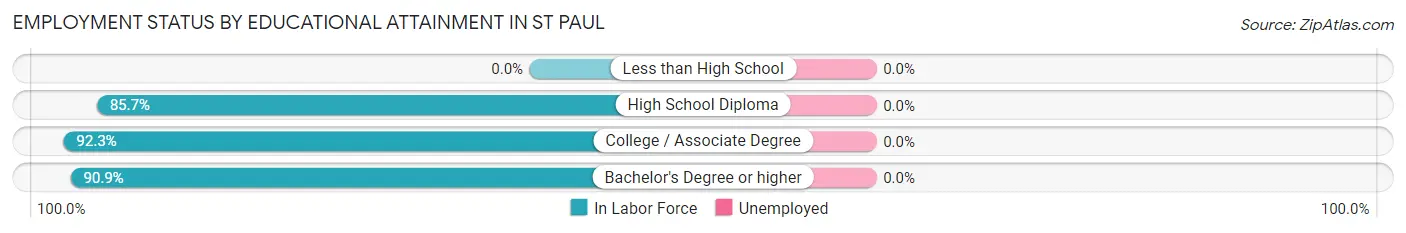
| Educational Attainment | In Labor Force | Unemployed |
| Less than High School | 0 (0.0%) | 0 (0.0%) |
| High School Diploma | 6 (85.7%) | 0 (0.0%) |
| College / Associate Degree | 24 (92.3%) | 0 (0.0%) |
| Bachelor's Degree or higher | 10 (90.9%) | 0 (0.0%) |
| Total | 40 (90.9%) | 0 (0.0%) |
Employment Occupations by Sex in St Paul
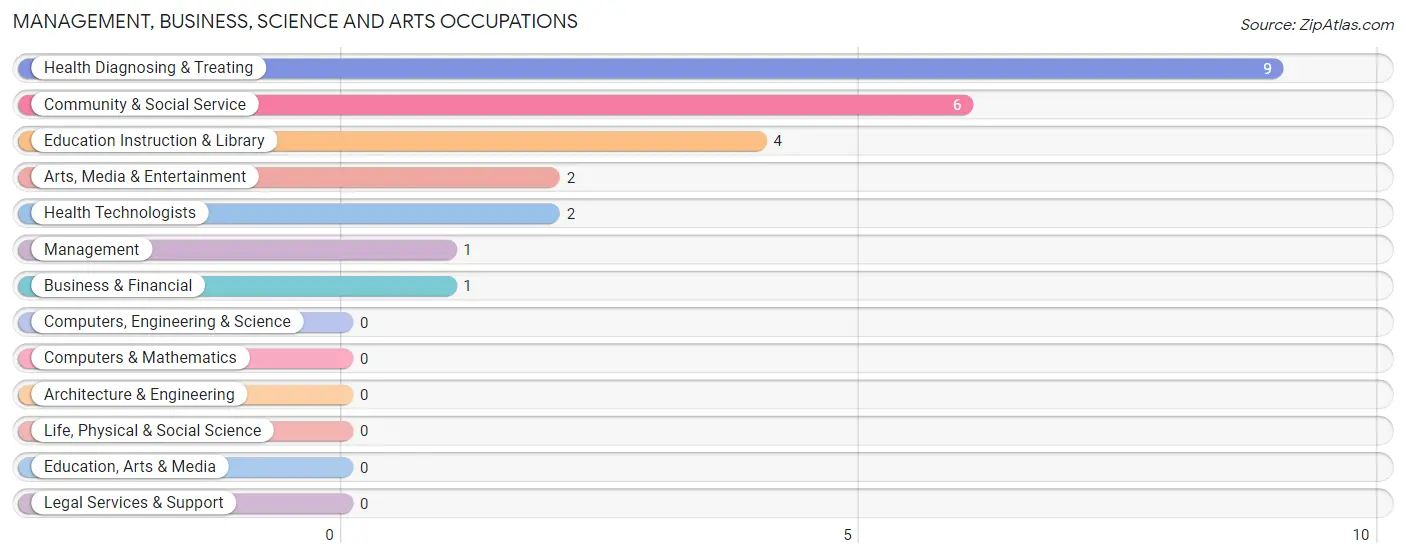
Management, Business, Science and Arts Occupations
The most common Management, Business, Science and Arts occupations in St Paul are Health Diagnosing & Treating (9 | 22.0%), Community & Social Service (6 | 14.6%), Education Instruction & Library (4 | 9.8%), Arts, Media & Entertainment (2 | 4.9%), and Health Technologists (2 | 4.9%).
Management, Business, Science and Arts Occupations by Sex
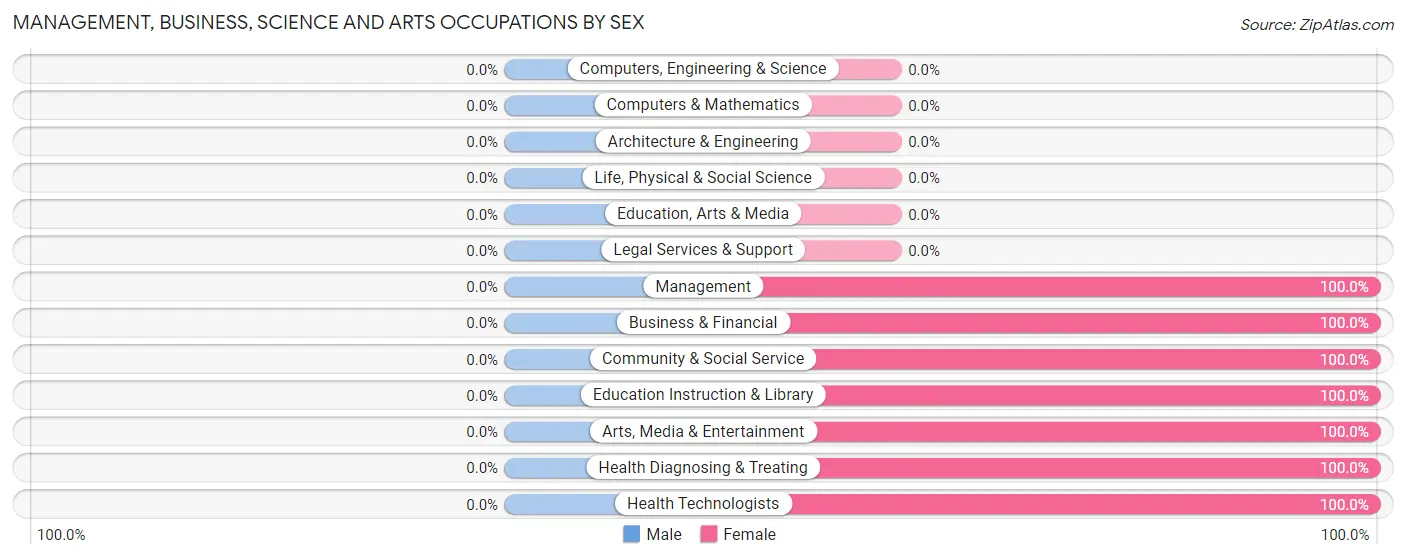
| Occupation | Male | Female |
| Management | 0 (0.0%) | 1 (100.0%) |
| Business & Financial | 0 (0.0%) | 1 (100.0%) |
| Computers, Engineering & Science | 0 (0.0%) | 0 (0.0%) |
| Computers & Mathematics | 0 (0.0%) | 0 (0.0%) |
| Architecture & Engineering | 0 (0.0%) | 0 (0.0%) |
| Life, Physical & Social Science | 0 (0.0%) | 0 (0.0%) |
| Community & Social Service | 0 (0.0%) | 6 (100.0%) |
| Education, Arts & Media | 0 (0.0%) | 0 (0.0%) |
| Legal Services & Support | 0 (0.0%) | 0 (0.0%) |
| Education Instruction & Library | 0 (0.0%) | 4 (100.0%) |
| Arts, Media & Entertainment | 0 (0.0%) | 2 (100.0%) |
| Health Diagnosing & Treating | 0 (0.0%) | 9 (100.0%) |
| Health Technologists | 0 (0.0%) | 2 (100.0%) |
| Total (Category) | 0 (0.0%) | 17 (100.0%) |
| Total (Overall) | 14 (34.2%) | 27 (65.8%) |
Services Occupations
The most common Services occupations in St Paul are Healthcare Support (1 | 2.4%), Food Preparation & Serving (1 | 2.4%), and Personal Care & Service (1 | 2.4%).
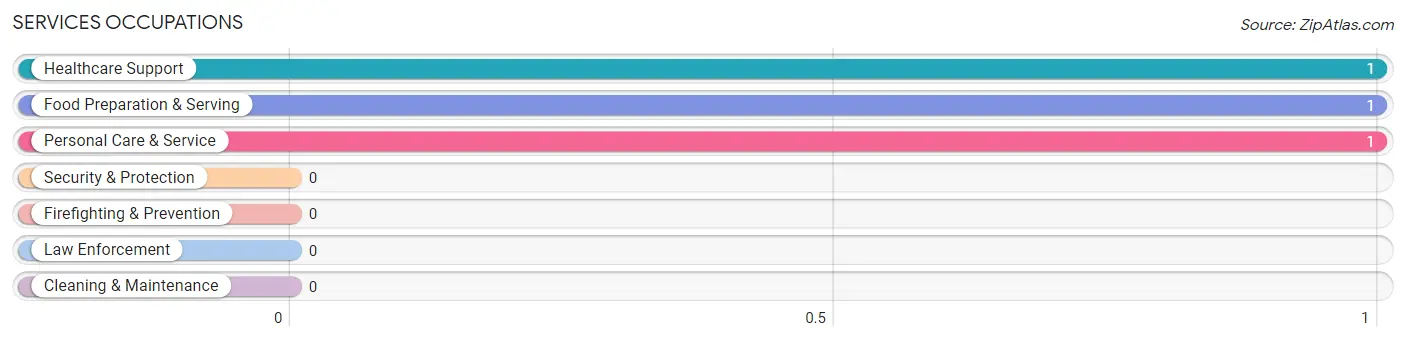
Services Occupations by Sex
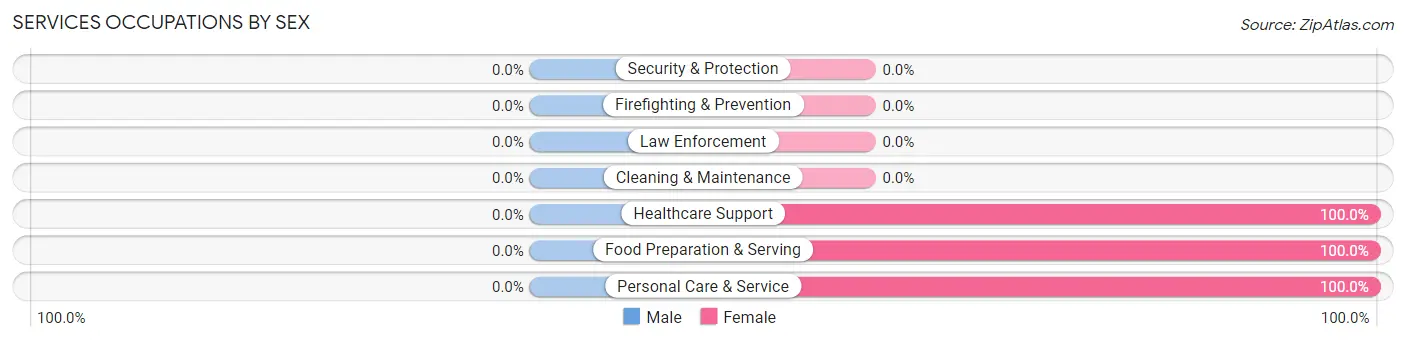
| Occupation | Male | Female |
| Healthcare Support | 0 (0.0%) | 1 (100.0%) |
| Security & Protection | 0 (0.0%) | 0 (0.0%) |
| Firefighting & Prevention | 0 (0.0%) | 0 (0.0%) |
| Law Enforcement | 0 (0.0%) | 0 (0.0%) |
| Food Preparation & Serving | 0 (0.0%) | 1 (100.0%) |
| Cleaning & Maintenance | 0 (0.0%) | 0 (0.0%) |
| Personal Care & Service | 0 (0.0%) | 1 (100.0%) |
| Total (Category) | 0 (0.0%) | 3 (100.0%) |
| Total (Overall) | 14 (34.2%) | 27 (65.8%) |
Sales and Office Occupations
The most common Sales and Office occupations in St Paul are Office & Administration (6 | 14.6%), and Sales & Related (1 | 2.4%).
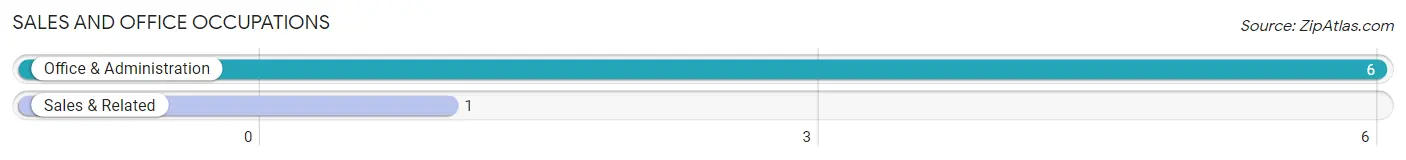
Sales and Office Occupations by Sex
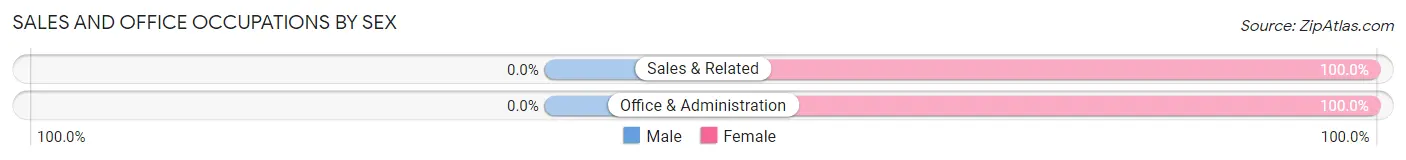
| Occupation | Male | Female |
| Sales & Related | 0 (0.0%) | 1 (100.0%) |
| Office & Administration | 0 (0.0%) | 6 (100.0%) |
| Total (Category) | 0 (0.0%) | 7 (100.0%) |
| Total (Overall) | 14 (34.2%) | 27 (65.8%) |
Natural Resources, Construction and Maintenance Occupations
The most common Natural Resources, Construction and Maintenance occupations in St Paul are Construction & Extraction (9 | 22.0%), and Installation, Maintenance & Repair (1 | 2.4%).
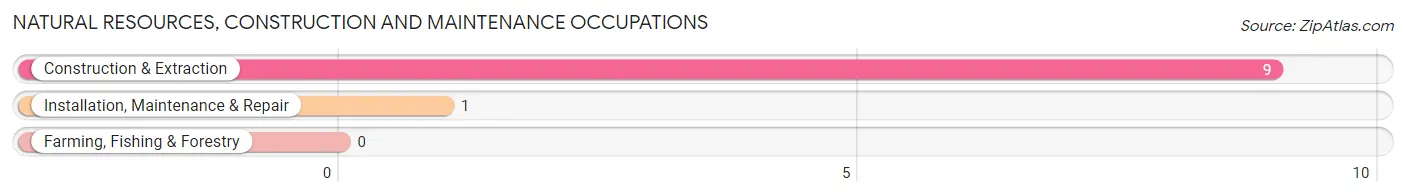
Natural Resources, Construction and Maintenance Occupations by Sex
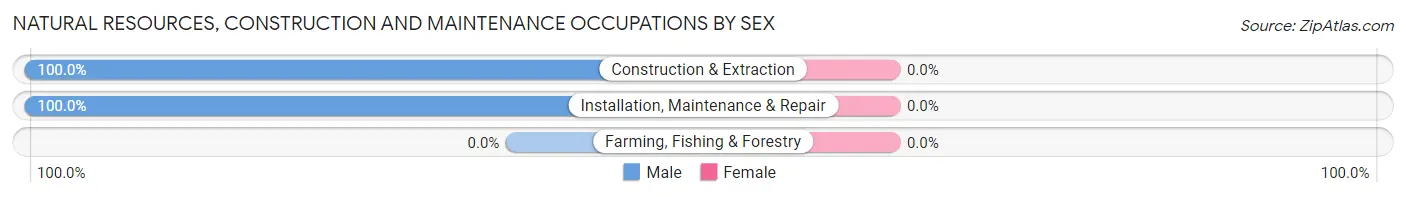
| Occupation | Male | Female |
| Farming, Fishing & Forestry | 0 (0.0%) | 0 (0.0%) |
| Construction & Extraction | 9 (100.0%) | 0 (0.0%) |
| Installation, Maintenance & Repair | 1 (100.0%) | 0 (0.0%) |
| Total (Category) | 10 (100.0%) | 0 (0.0%) |
| Total (Overall) | 14 (34.2%) | 27 (65.8%) |
Production, Transportation and Moving Occupations
The most common Production, Transportation and Moving occupations in St Paul are Production (3 | 7.3%), and Material Moving (1 | 2.4%).

Production, Transportation and Moving Occupations by Sex
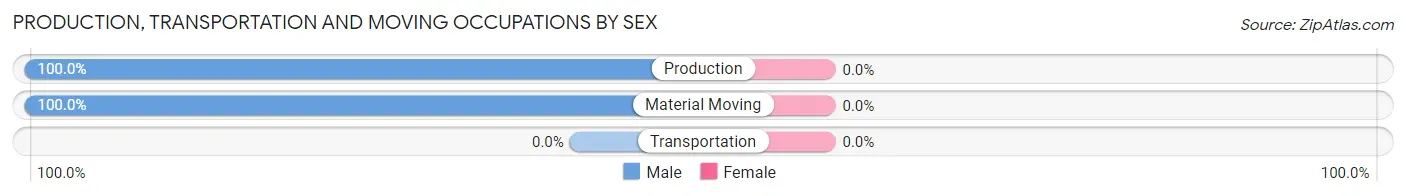
| Occupation | Male | Female |
| Production | 3 (100.0%) | 0 (0.0%) |
| Transportation | 0 (0.0%) | 0 (0.0%) |
| Material Moving | 1 (100.0%) | 0 (0.0%) |
| Total (Category) | 4 (100.0%) | 0 (0.0%) |
| Total (Overall) | 14 (34.2%) | 27 (65.8%) |
Employment Industries by Sex in St Paul
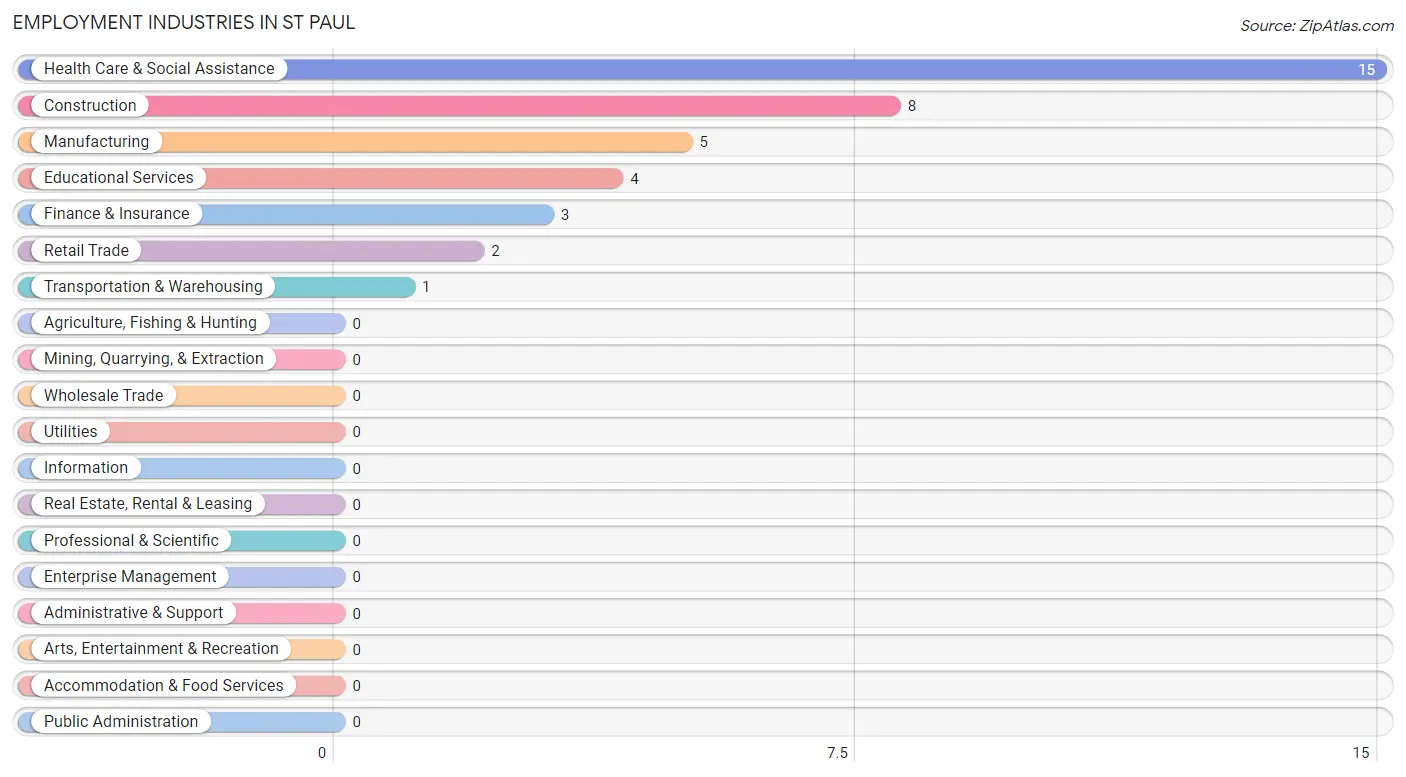
Employment Industries in St Paul
The major employment industries in St Paul include Health Care & Social Assistance (15 | 36.6%), Construction (8 | 19.5%), Manufacturing (5 | 12.2%), Educational Services (4 | 9.8%), and Finance & Insurance (3 | 7.3%).
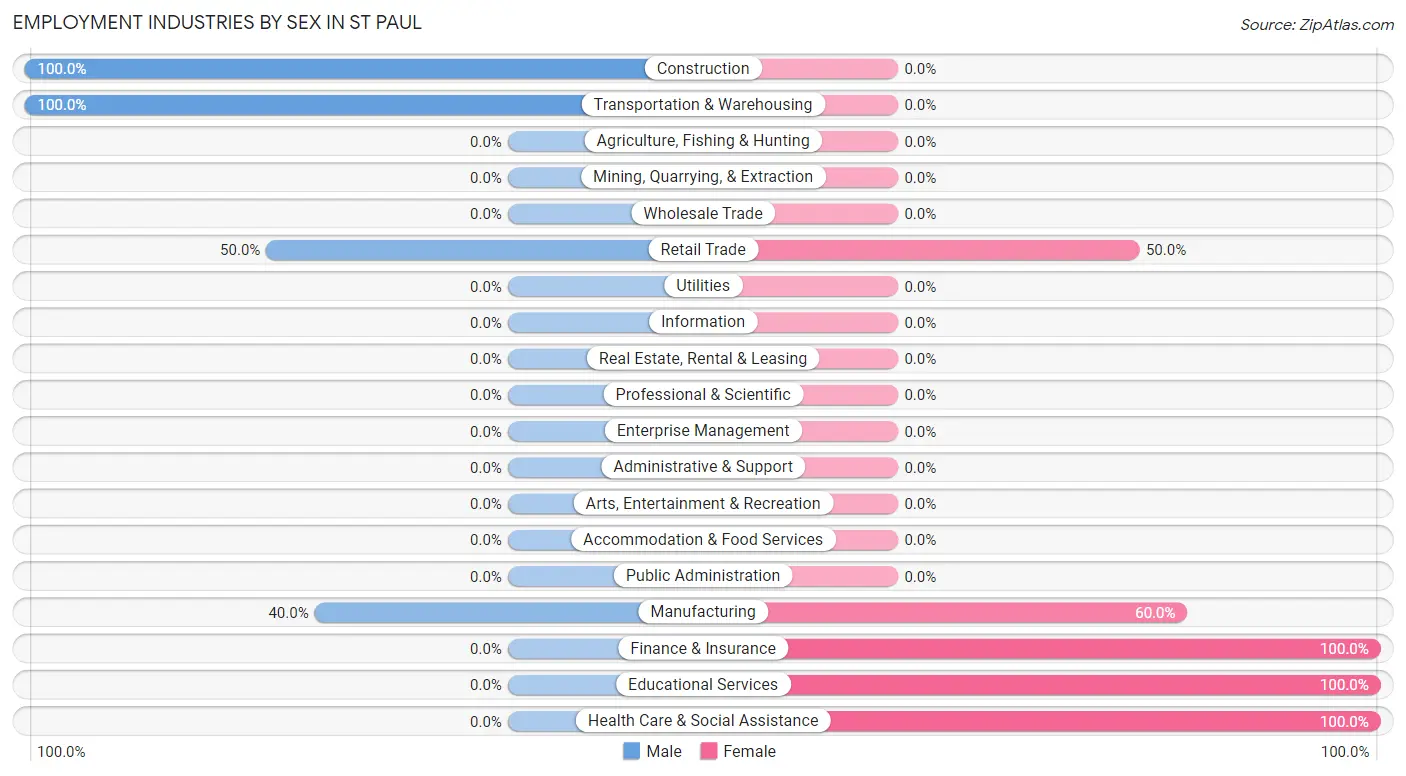
Employment Industries by Sex in St Paul
The St Paul industries that see more men than women are Construction (100.0%), Transportation & Warehousing (100.0%), and Retail Trade (50.0%), whereas the industries that tend to have a higher number of women are Finance & Insurance (100.0%), Educational Services (100.0%), and Health Care & Social Assistance (100.0%).
| Industry | Male | Female |
| Agriculture, Fishing & Hunting | 0 (0.0%) | 0 (0.0%) |
| Mining, Quarrying, & Extraction | 0 (0.0%) | 0 (0.0%) |
| Construction | 8 (100.0%) | 0 (0.0%) |
| Manufacturing | 2 (40.0%) | 3 (60.0%) |
| Wholesale Trade | 0 (0.0%) | 0 (0.0%) |
| Retail Trade | 1 (50.0%) | 1 (50.0%) |
| Transportation & Warehousing | 1 (100.0%) | 0 (0.0%) |
| Utilities | 0 (0.0%) | 0 (0.0%) |
| Information | 0 (0.0%) | 0 (0.0%) |
| Finance & Insurance | 0 (0.0%) | 3 (100.0%) |
| Real Estate, Rental & Leasing | 0 (0.0%) | 0 (0.0%) |
| Professional & Scientific | 0 (0.0%) | 0 (0.0%) |
| Enterprise Management | 0 (0.0%) | 0 (0.0%) |
| Administrative & Support | 0 (0.0%) | 0 (0.0%) |
| Educational Services | 0 (0.0%) | 4 (100.0%) |
| Health Care & Social Assistance | 0 (0.0%) | 15 (100.0%) |
| Arts, Entertainment & Recreation | 0 (0.0%) | 0 (0.0%) |
| Accommodation & Food Services | 0 (0.0%) | 0 (0.0%) |
| Public Administration | 0 (0.0%) | 0 (0.0%) |
| Total | 14 (34.2%) | 27 (65.8%) |
Education in St Paul
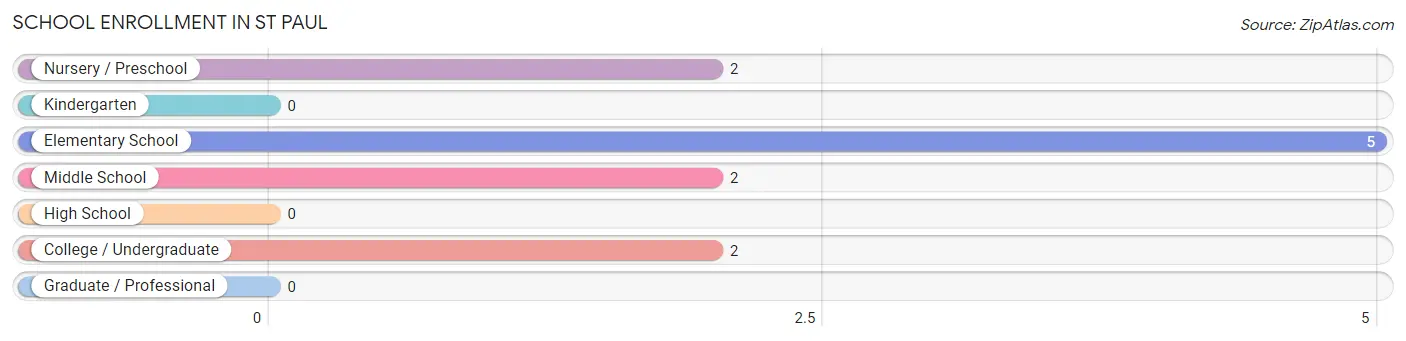
School Enrollment in St Paul
The most common levels of schooling among the 11 students in St Paul are elementary school (5 | 45.5%), nursery / preschool (2 | 18.2%), and middle school (2 | 18.2%).
| School Level | # Students | % Students |
| Nursery / Preschool | 2 | 18.2% |
| Kindergarten | 0 | 0.0% |
| Elementary School | 5 | 45.5% |
| Middle School | 2 | 18.2% |
| High School | 0 | 0.0% |
| College / Undergraduate | 2 | 18.2% |
| Graduate / Professional | 0 | 0.0% |
| Total | 11 | 100.0% |
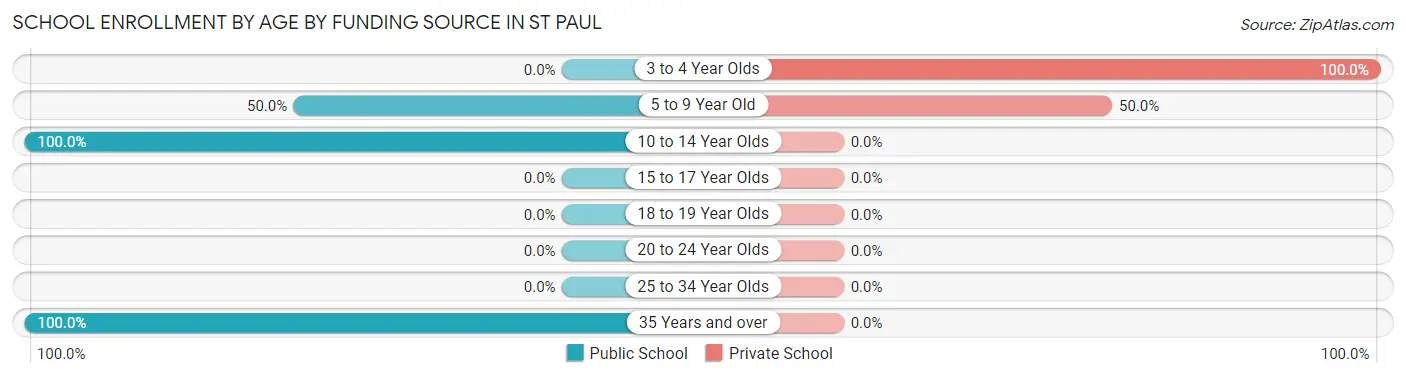
School Enrollment by Age by Funding Source in St Paul
Out of a total of 11 students who are enrolled in schools in St Paul, 4 (36.4%) attend a private institution, while the remaining 7 (63.6%) are enrolled in public schools. The age group of 3 to 4 year olds has the highest likelihood of being enrolled in private schools, with 2 (100.0% in the age bracket) enrolled. Conversely, the age group of 10 to 14 year olds has the lowest likelihood of being enrolled in a private school, with 3 (100.0% in the age bracket) attending a public institution.
| Age Bracket | Public School | Private School |
| 3 to 4 Year Olds | 0 (0.0%) | 2 (100.0%) |
| 5 to 9 Year Old | 2 (50.0%) | 2 (50.0%) |
| 10 to 14 Year Olds | 3 (100.0%) | 0 (0.0%) |
| 15 to 17 Year Olds | 0 (0.0%) | 0 (0.0%) |
| 18 to 19 Year Olds | 0 (0.0%) | 0 (0.0%) |
| 20 to 24 Year Olds | 0 (0.0%) | 0 (0.0%) |
| 25 to 34 Year Olds | 0 (0.0%) | 0 (0.0%) |
| 35 Years and over | 2 (100.0%) | 0 (0.0%) |
| Total | 7 (63.6%) | 4 (36.4%) |
Educational Attainment by Field of Study in St Paul
Education (4 | 36.4%), science & technology (3 | 27.3%), liberal arts & history (2 | 18.2%), bio, nature & agricultural (1 | 9.1%), and communications (1 | 9.1%) are the most common fields of study among 11 individuals in St Paul who have obtained a bachelor's degree or higher.
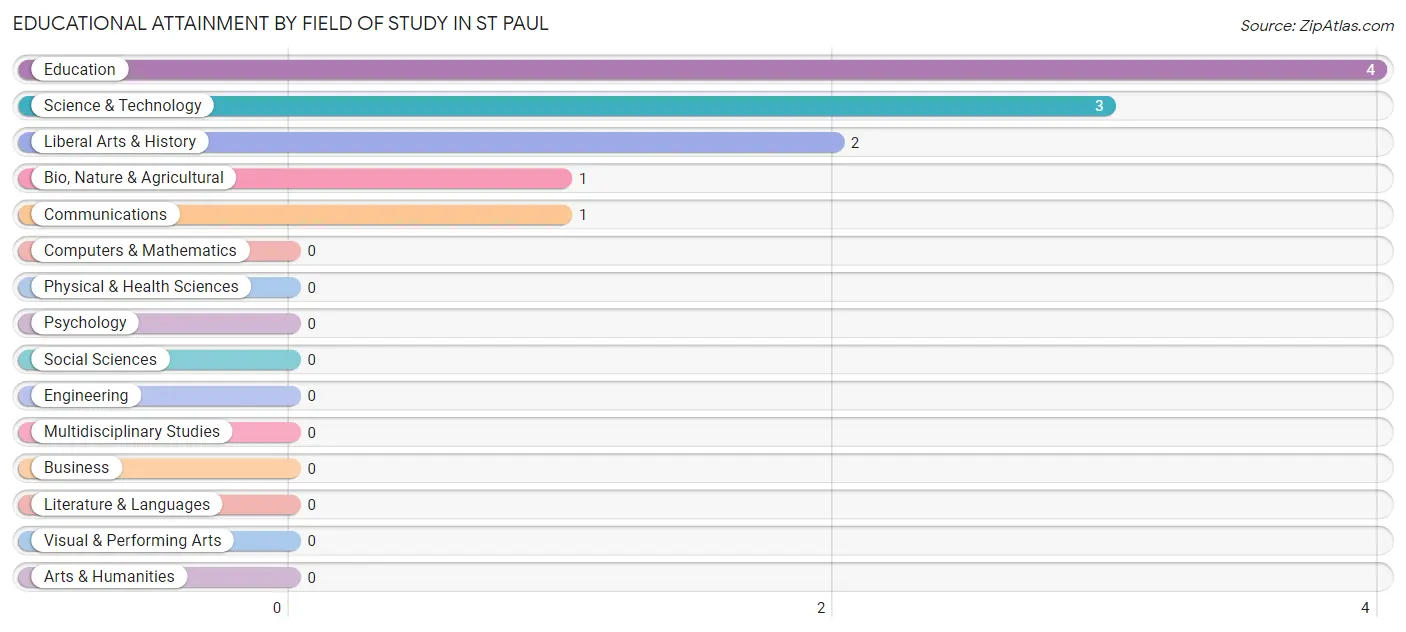
| Field of Study | # Graduates | % Graduates |
| Computers & Mathematics | 0 | 0.0% |
| Bio, Nature & Agricultural | 1 | 9.1% |
| Physical & Health Sciences | 0 | 0.0% |
| Psychology | 0 | 0.0% |
| Social Sciences | 0 | 0.0% |
| Engineering | 0 | 0.0% |
| Multidisciplinary Studies | 0 | 0.0% |
| Science & Technology | 3 | 27.3% |
| Business | 0 | 0.0% |
| Education | 4 | 36.4% |
| Literature & Languages | 0 | 0.0% |
| Liberal Arts & History | 2 | 18.2% |
| Visual & Performing Arts | 0 | 0.0% |
| Communications | 1 | 9.1% |
| Arts & Humanities | 0 | 0.0% |
| Total | 11 | 100.0% |
Transportation & Commute in St Paul
Vehicle Availability by Sex in St Paul
The most prevalent vehicle ownership categories in St Paul are males with 3 vehicles (8, accounting for 57.1%) and females with 3 vehicles (9, making up 29.6%).
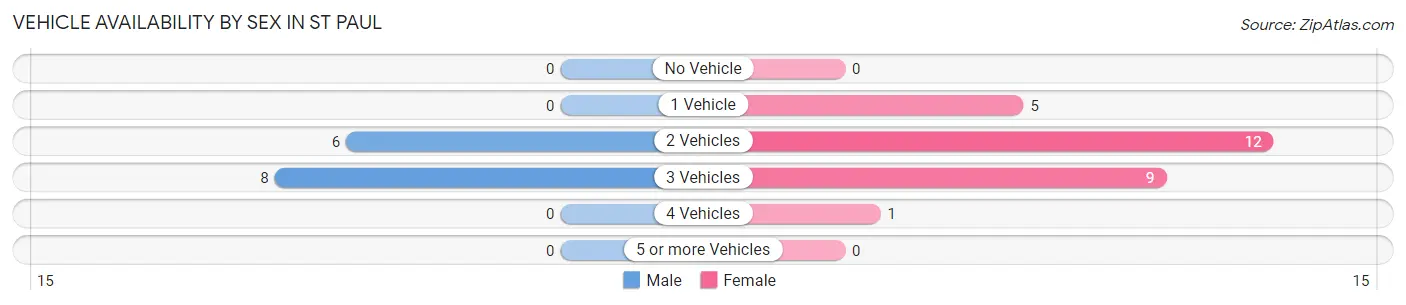
| Vehicles Available | Male | Female |
| No Vehicle | 0 (0.0%) | 0 (0.0%) |
| 1 Vehicle | 0 (0.0%) | 5 (18.5%) |
| 2 Vehicles | 6 (42.9%) | 12 (44.4%) |
| 3 Vehicles | 8 (57.1%) | 9 (33.3%) |
| 4 Vehicles | 0 (0.0%) | 1 (3.7%) |
| 5 or more Vehicles | 0 (0.0%) | 0 (0.0%) |
| Total | 14 (100.0%) | 27 (100.0%) |
Commute Time in St Paul
The most frequently occuring commute durations in St Paul are 30 to 34 minutes (10 commuters, 25.0%), 15 to 19 minutes (6 commuters, 15.0%), and 25 to 29 minutes (6 commuters, 15.0%).
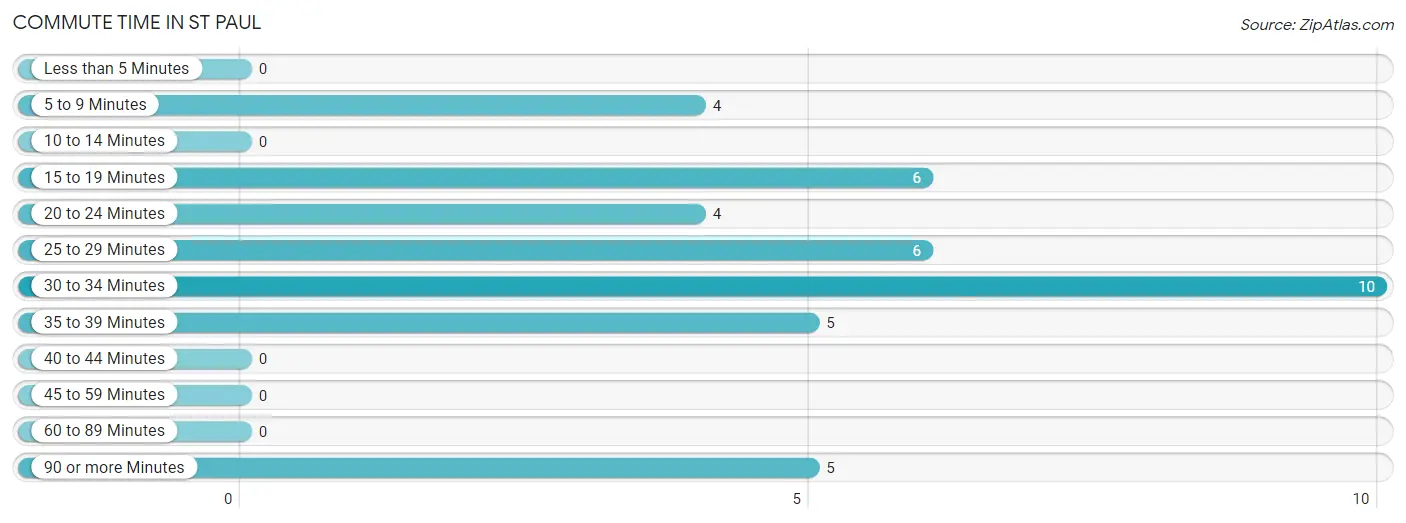
| Commute Time | # Commuters | % Commuters |
| Less than 5 Minutes | 0 | 0.0% |
| 5 to 9 Minutes | 4 | 10.0% |
| 10 to 14 Minutes | 0 | 0.0% |
| 15 to 19 Minutes | 6 | 15.0% |
| 20 to 24 Minutes | 4 | 10.0% |
| 25 to 29 Minutes | 6 | 15.0% |
| 30 to 34 Minutes | 10 | 25.0% |
| 35 to 39 Minutes | 5 | 12.5% |
| 40 to 44 Minutes | 0 | 0.0% |
| 45 to 59 Minutes | 0 | 0.0% |
| 60 to 89 Minutes | 0 | 0.0% |
| 90 or more Minutes | 5 | 12.5% |
Commute Time by Sex in St Paul
The most common commute times in St Paul are 15 to 19 minutes (6 commuters, 42.9%) for males and 30 to 34 minutes (9 commuters, 34.6%) for females.
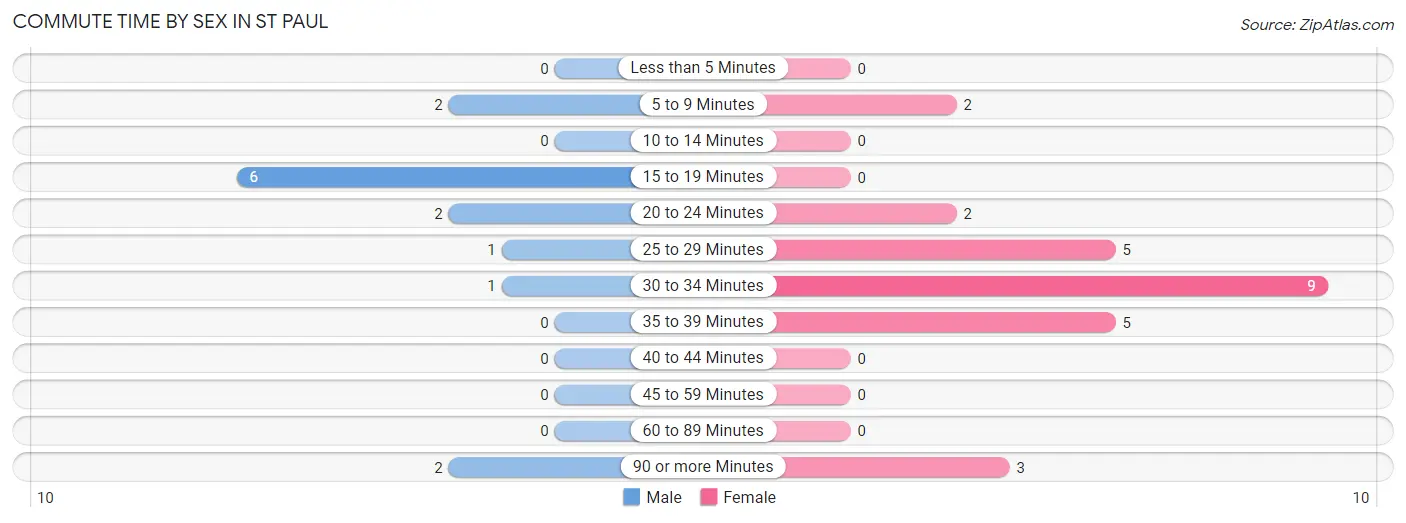
| Commute Time | Male | Female |
| Less than 5 Minutes | 0 (0.0%) | 0 (0.0%) |
| 5 to 9 Minutes | 2 (14.3%) | 2 (7.7%) |
| 10 to 14 Minutes | 0 (0.0%) | 0 (0.0%) |
| 15 to 19 Minutes | 6 (42.9%) | 0 (0.0%) |
| 20 to 24 Minutes | 2 (14.3%) | 2 (7.7%) |
| 25 to 29 Minutes | 1 (7.1%) | 5 (19.2%) |
| 30 to 34 Minutes | 1 (7.1%) | 9 (34.6%) |
| 35 to 39 Minutes | 0 (0.0%) | 5 (19.2%) |
| 40 to 44 Minutes | 0 (0.0%) | 0 (0.0%) |
| 45 to 59 Minutes | 0 (0.0%) | 0 (0.0%) |
| 60 to 89 Minutes | 0 (0.0%) | 0 (0.0%) |
| 90 or more Minutes | 2 (14.3%) | 3 (11.5%) |
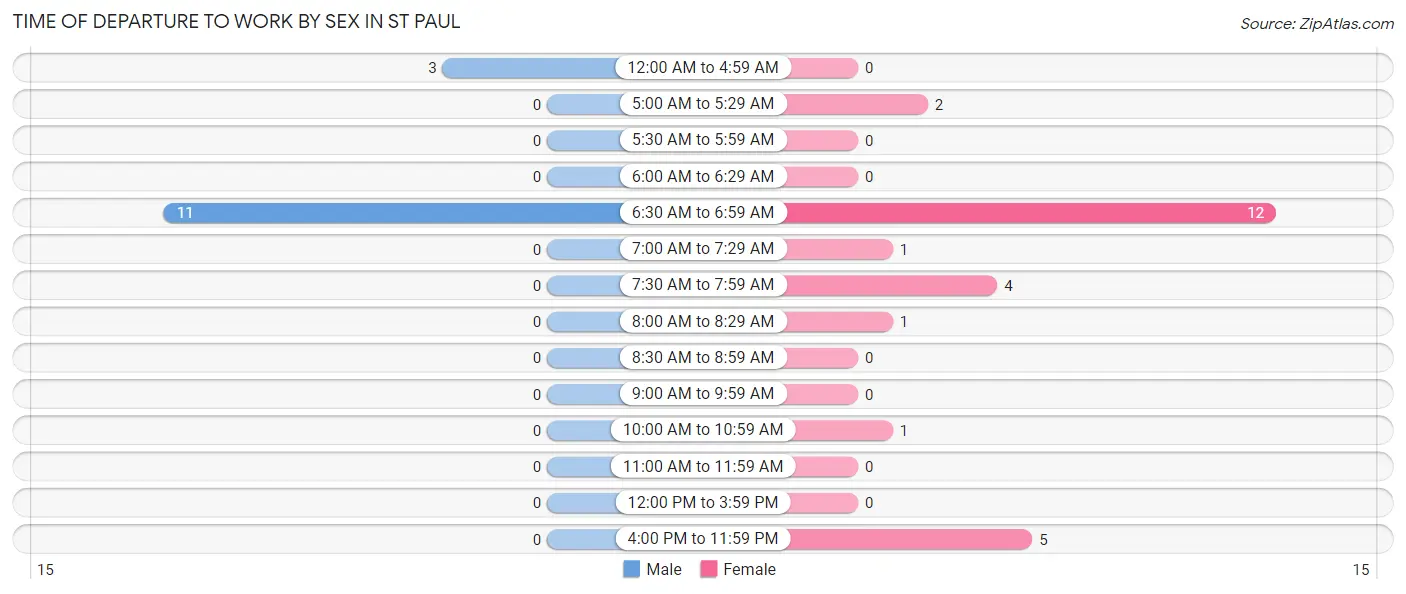
Time of Departure to Work by Sex in St Paul
The most frequent times of departure to work in St Paul are 6:30 AM to 6:59 AM (11, 78.6%) for males and 6:30 AM to 6:59 AM (12, 46.2%) for females.
| Time of Departure | Male | Female |
| 12:00 AM to 4:59 AM | 3 (21.4%) | 0 (0.0%) |
| 5:00 AM to 5:29 AM | 0 (0.0%) | 2 (7.7%) |
| 5:30 AM to 5:59 AM | 0 (0.0%) | 0 (0.0%) |
| 6:00 AM to 6:29 AM | 0 (0.0%) | 0 (0.0%) |
| 6:30 AM to 6:59 AM | 11 (78.6%) | 12 (46.2%) |
| 7:00 AM to 7:29 AM | 0 (0.0%) | 1 (3.8%) |
| 7:30 AM to 7:59 AM | 0 (0.0%) | 4 (15.4%) |
| 8:00 AM to 8:29 AM | 0 (0.0%) | 1 (3.8%) |
| 8:30 AM to 8:59 AM | 0 (0.0%) | 0 (0.0%) |
| 9:00 AM to 9:59 AM | 0 (0.0%) | 0 (0.0%) |
| 10:00 AM to 10:59 AM | 0 (0.0%) | 1 (3.8%) |
| 11:00 AM to 11:59 AM | 0 (0.0%) | 0 (0.0%) |
| 12:00 PM to 3:59 PM | 0 (0.0%) | 0 (0.0%) |
| 4:00 PM to 11:59 PM | 0 (0.0%) | 5 (19.2%) |
| Total | 14 (100.0%) | 26 (100.0%) |
Housing Occupancy in St Paul
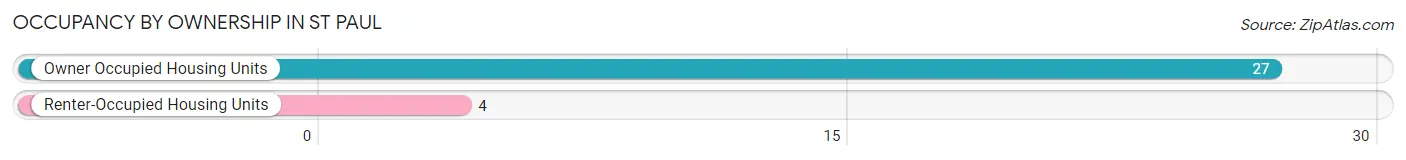
Occupancy by Ownership in St Paul
Of the total 31 dwellings in St Paul, owner-occupied units account for 27 (87.1%), while renter-occupied units make up 4 (12.9%).
| Occupancy | # Housing Units | % Housing Units |
| Owner Occupied Housing Units | 27 | 87.1% |
| Renter-Occupied Housing Units | 4 | 12.9% |
| Total Occupied Housing Units | 31 | 100.0% |
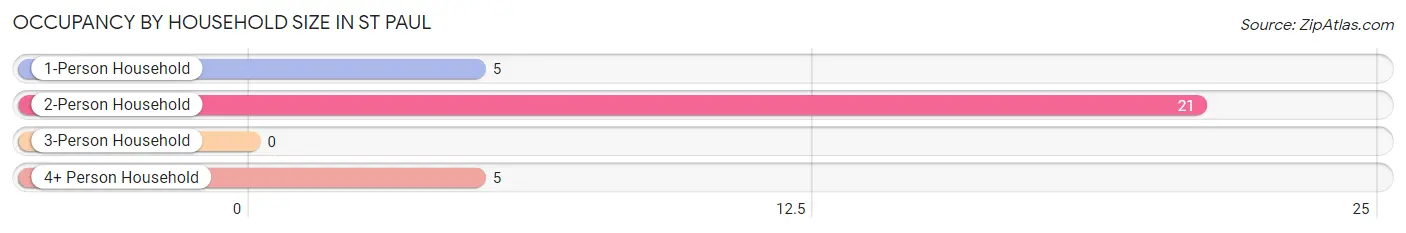
Occupancy by Household Size in St Paul
| Household Size | # Housing Units | % Housing Units |
| 1-Person Household | 5 | 16.1% |
| 2-Person Household | 21 | 67.7% |
| 3-Person Household | 0 | 0.0% |
| 4+ Person Household | 5 | 16.1% |
| Total Housing Units | 31 | 100.0% |
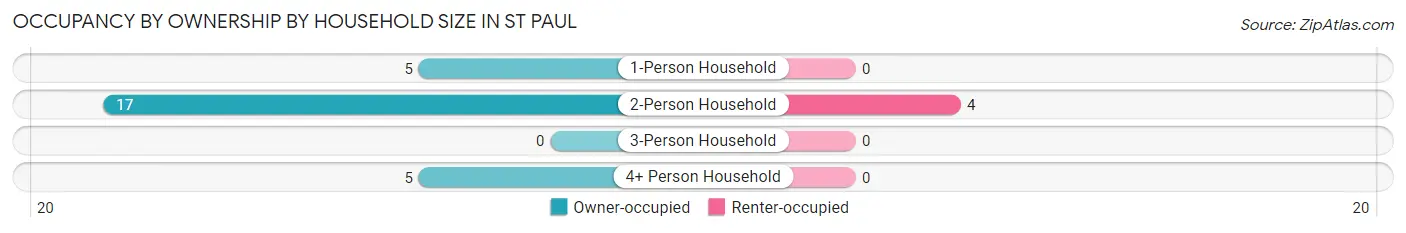
Occupancy by Ownership by Household Size in St Paul
| Household Size | Owner-occupied | Renter-occupied |
| 1-Person Household | 5 (100.0%) | 0 (0.0%) |
| 2-Person Household | 17 (80.9%) | 4 (19.1%) |
| 3-Person Household | 0 (0.0%) | 0 (0.0%) |
| 4+ Person Household | 5 (100.0%) | 0 (0.0%) |
| Total Housing Units | 27 (87.1%) | 4 (12.9%) |
Occupancy by Educational Attainment in St Paul
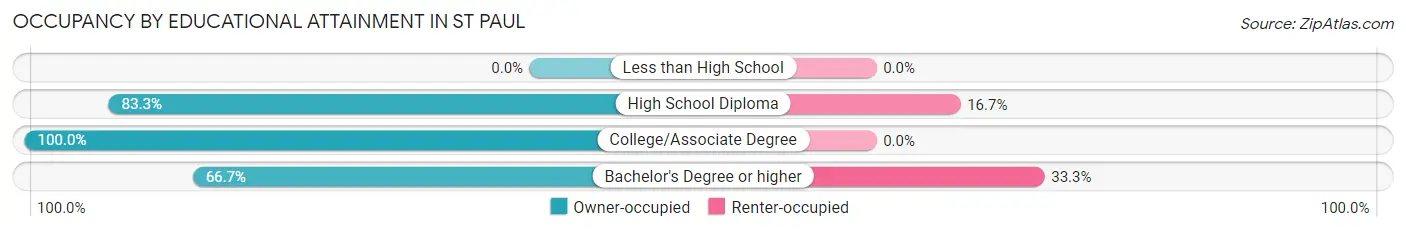
| Household Size | Owner-occupied | Renter-occupied |
| Less than High School | 0 (0.0%) | 0 (0.0%) |
| High School Diploma | 5 (83.3%) | 1 (16.7%) |
| College/Associate Degree | 16 (100.0%) | 0 (0.0%) |
| Bachelor's Degree or higher | 6 (66.7%) | 3 (33.3%) |
Occupancy by Age of Householder in St Paul
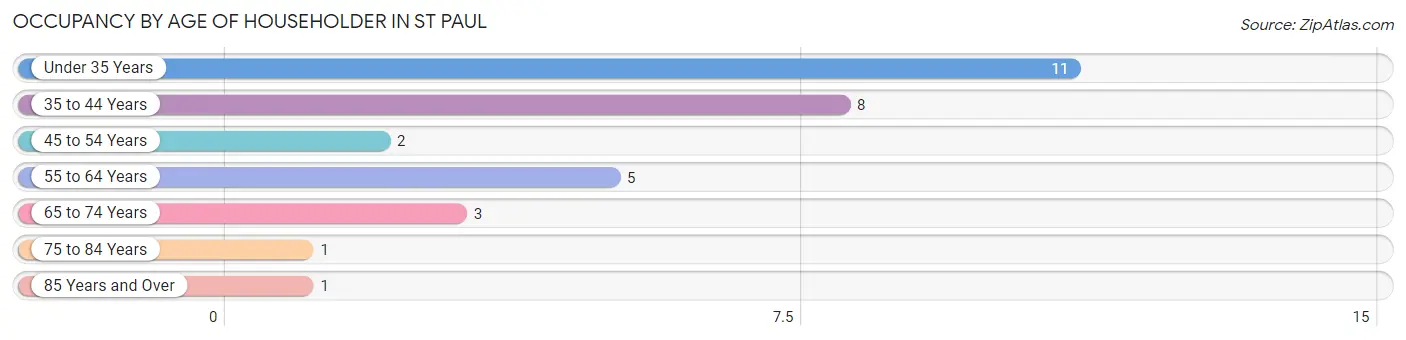
| Age Bracket | # Households | % Households |
| Under 35 Years | 11 | 35.5% |
| 35 to 44 Years | 8 | 25.8% |
| 45 to 54 Years | 2 | 6.5% |
| 55 to 64 Years | 5 | 16.1% |
| 65 to 74 Years | 3 | 9.7% |
| 75 to 84 Years | 1 | 3.2% |
| 85 Years and Over | 1 | 3.2% |
| Total | 31 | 100.0% |
Housing Finances in St Paul
Median Income by Occupancy in St Paul
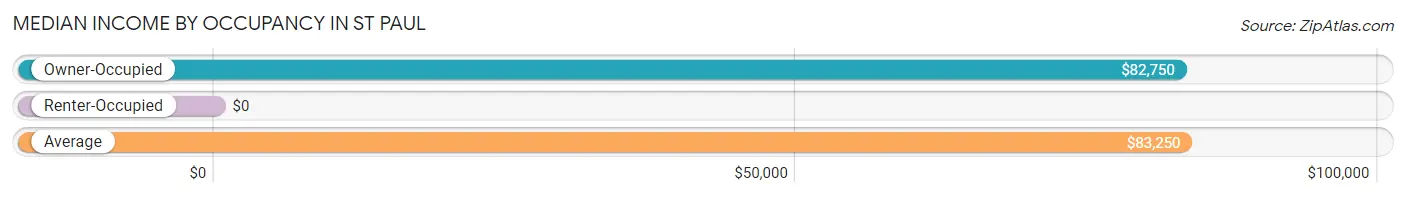
| Occupancy Type | # Households | Median Income |
| Owner-Occupied | 27 (87.1%) | $82,750 |
| Renter-Occupied | 4 (12.9%) | $0 |
| Average | 31 (100.0%) | $83,250 |
Occupancy by Householder Income Bracket in St Paul
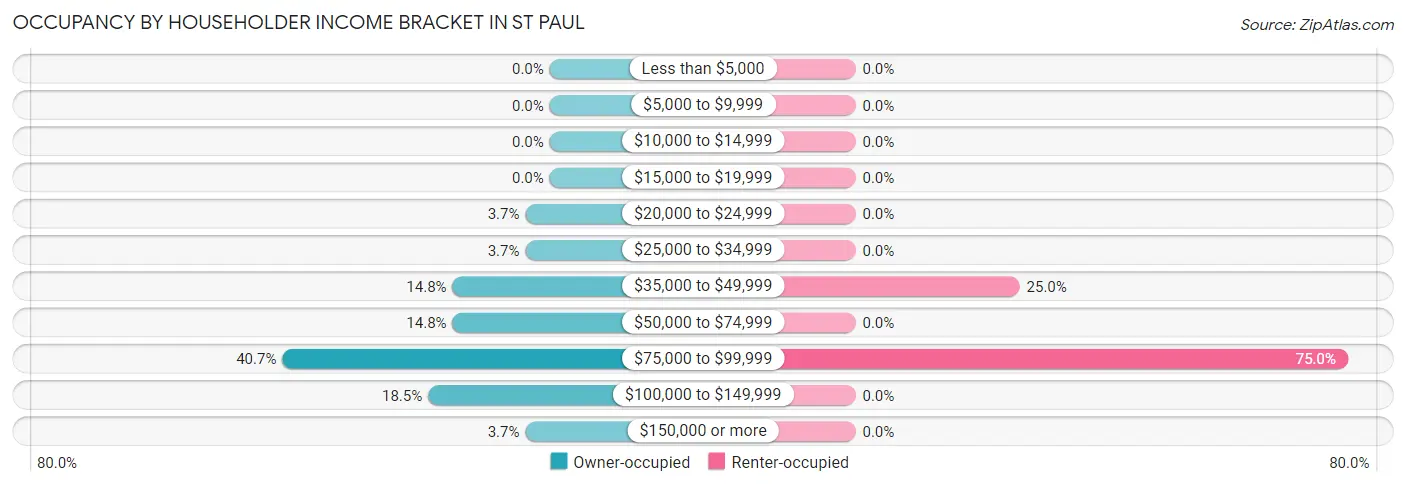
| Income Bracket | Owner-occupied | Renter-occupied |
| Less than $5,000 | 0 (0.0%) | 0 (0.0%) |
| $5,000 to $9,999 | 0 (0.0%) | 0 (0.0%) |
| $10,000 to $14,999 | 0 (0.0%) | 0 (0.0%) |
| $15,000 to $19,999 | 0 (0.0%) | 0 (0.0%) |
| $20,000 to $24,999 | 1 (3.7%) | 0 (0.0%) |
| $25,000 to $34,999 | 1 (3.7%) | 0 (0.0%) |
| $35,000 to $49,999 | 4 (14.8%) | 1 (25.0%) |
| $50,000 to $74,999 | 4 (14.8%) | 0 (0.0%) |
| $75,000 to $99,999 | 11 (40.7%) | 3 (75.0%) |
| $100,000 to $149,999 | 5 (18.5%) | 0 (0.0%) |
| $150,000 or more | 1 (3.7%) | 0 (0.0%) |
| Total | 27 (100.0%) | 4 (100.0%) |
Monthly Housing Cost Tiers in St Paul
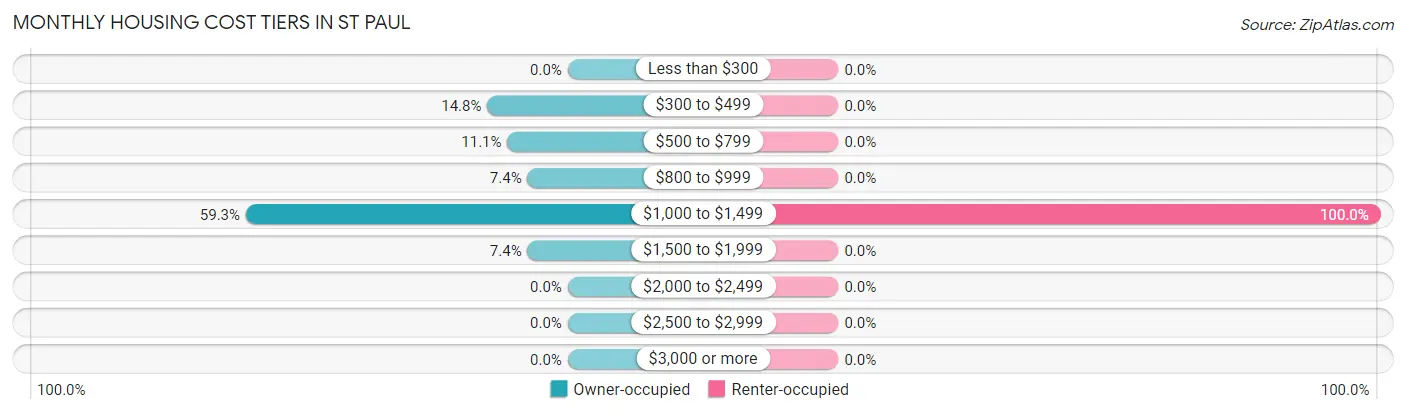
| Monthly Cost | Owner-occupied | Renter-occupied |
| Less than $300 | 0 (0.0%) | 0 (0.0%) |
| $300 to $499 | 4 (14.8%) | 0 (0.0%) |
| $500 to $799 | 3 (11.1%) | 0 (0.0%) |
| $800 to $999 | 2 (7.4%) | 0 (0.0%) |
| $1,000 to $1,499 | 16 (59.3%) | 4 (100.0%) |
| $1,500 to $1,999 | 2 (7.4%) | 0 (0.0%) |
| $2,000 to $2,499 | 0 (0.0%) | 0 (0.0%) |
| $2,500 to $2,999 | 0 (0.0%) | 0 (0.0%) |
| $3,000 or more | 0 (0.0%) | 0 (0.0%) |
| Total | 27 (100.0%) | 4 (100.0%) |
Physical Housing Characteristics in St Paul
Housing Structures in St Paul
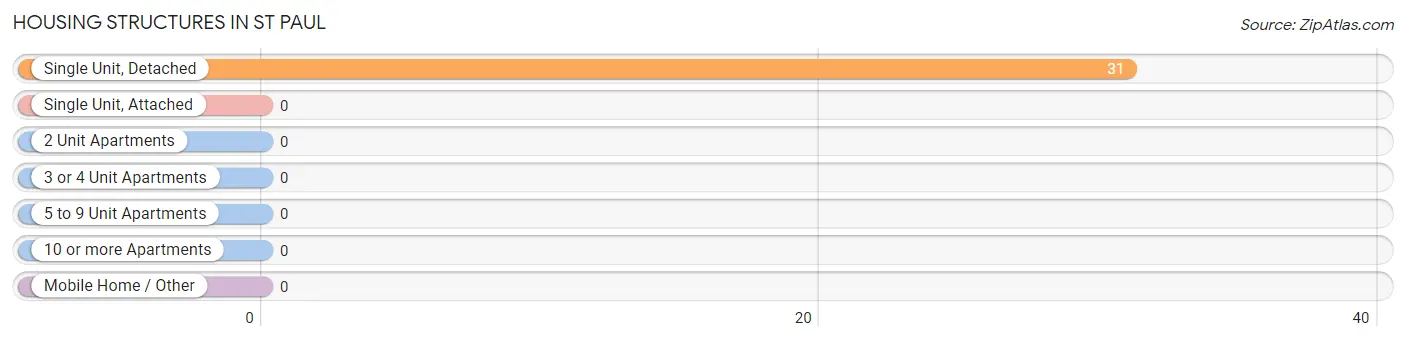
| Structure Type | # Housing Units | % Housing Units |
| Single Unit, Detached | 31 | 100.0% |
| Single Unit, Attached | 0 | 0.0% |
| 2 Unit Apartments | 0 | 0.0% |
| 3 or 4 Unit Apartments | 0 | 0.0% |
| 5 to 9 Unit Apartments | 0 | 0.0% |
| 10 or more Apartments | 0 | 0.0% |
| Mobile Home / Other | 0 | 0.0% |
| Total | 31 | 100.0% |
Housing Structures by Occupancy in St Paul
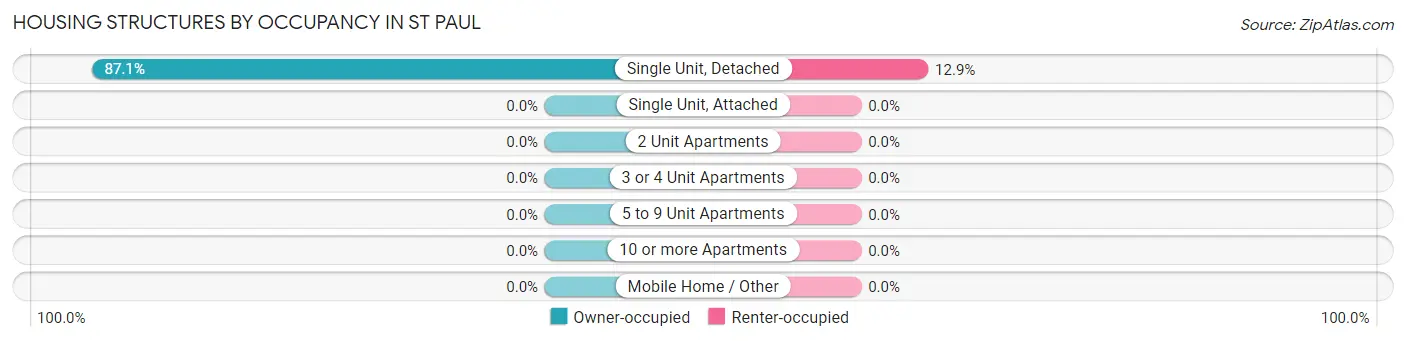
| Structure Type | Owner-occupied | Renter-occupied |
| Single Unit, Detached | 27 (87.1%) | 4 (12.9%) |
| Single Unit, Attached | 0 (0.0%) | 0 (0.0%) |
| 2 Unit Apartments | 0 (0.0%) | 0 (0.0%) |
| 3 or 4 Unit Apartments | 0 (0.0%) | 0 (0.0%) |
| 5 to 9 Unit Apartments | 0 (0.0%) | 0 (0.0%) |
| 10 or more Apartments | 0 (0.0%) | 0 (0.0%) |
| Mobile Home / Other | 0 (0.0%) | 0 (0.0%) |
| Total | 27 (87.1%) | 4 (12.9%) |
Housing Structures by Number of Rooms in St Paul
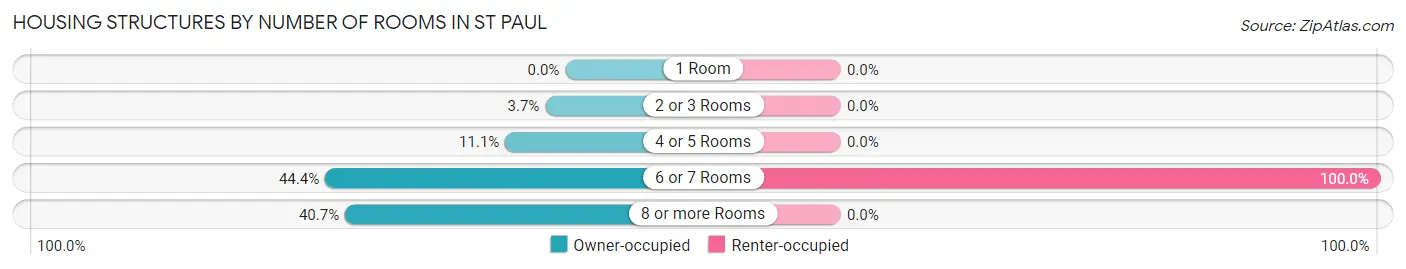
| Number of Rooms | Owner-occupied | Renter-occupied |
| 1 Room | 0 (0.0%) | 0 (0.0%) |
| 2 or 3 Rooms | 1 (3.7%) | 0 (0.0%) |
| 4 or 5 Rooms | 3 (11.1%) | 0 (0.0%) |
| 6 or 7 Rooms | 12 (44.4%) | 4 (100.0%) |
| 8 or more Rooms | 11 (40.7%) | 0 (0.0%) |
| Total | 27 (100.0%) | 4 (100.0%) |
Housing Structure by Heating Type in St Paul
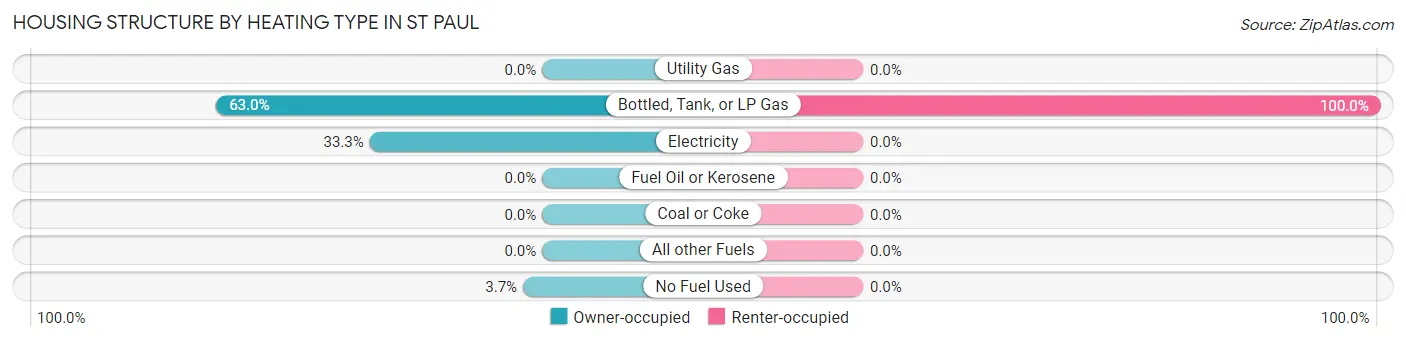
| Heating Type | Owner-occupied | Renter-occupied |
| Utility Gas | 0 (0.0%) | 0 (0.0%) |
| Bottled, Tank, or LP Gas | 17 (63.0%) | 4 (100.0%) |
| Electricity | 9 (33.3%) | 0 (0.0%) |
| Fuel Oil or Kerosene | 0 (0.0%) | 0 (0.0%) |
| Coal or Coke | 0 (0.0%) | 0 (0.0%) |
| All other Fuels | 0 (0.0%) | 0 (0.0%) |
| No Fuel Used | 1 (3.7%) | 0 (0.0%) |
| Total | 27 (100.0%) | 4 (100.0%) |
Household Vehicle Usage in St Paul
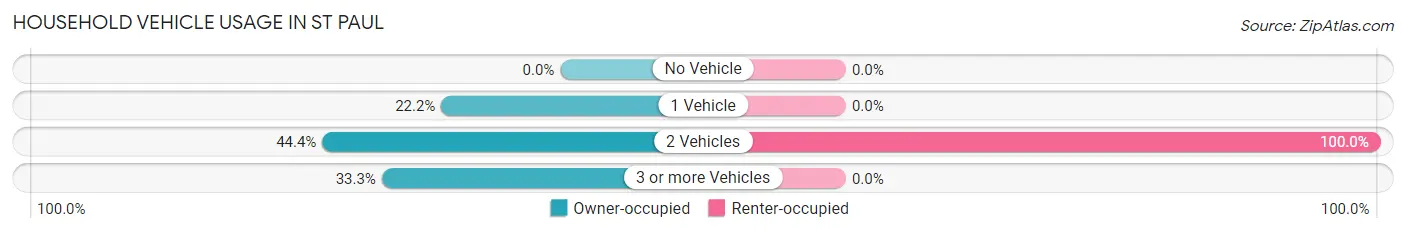
| Vehicles per Household | Owner-occupied | Renter-occupied |
| No Vehicle | 0 (0.0%) | 0 (0.0%) |
| 1 Vehicle | 6 (22.2%) | 0 (0.0%) |
| 2 Vehicles | 12 (44.4%) | 4 (100.0%) |
| 3 or more Vehicles | 9 (33.3%) | 0 (0.0%) |
| Total | 27 (100.0%) | 4 (100.0%) |
Real Estate & Mortgages in St Paul
Real Estate and Mortgage Overview in St Paul
| Characteristic | Without Mortgage | With Mortgage |
| Housing Units | 7 | 20 |
| Median Property Value | $225,000 | $146,900 |
| Median Household Income | $61,250 | $0 |
| Monthly Housing Costs | $483 | $0 |
| Real Estate Taxes | $1,583 | $0 |
Property Value by Mortgage Status in St Paul
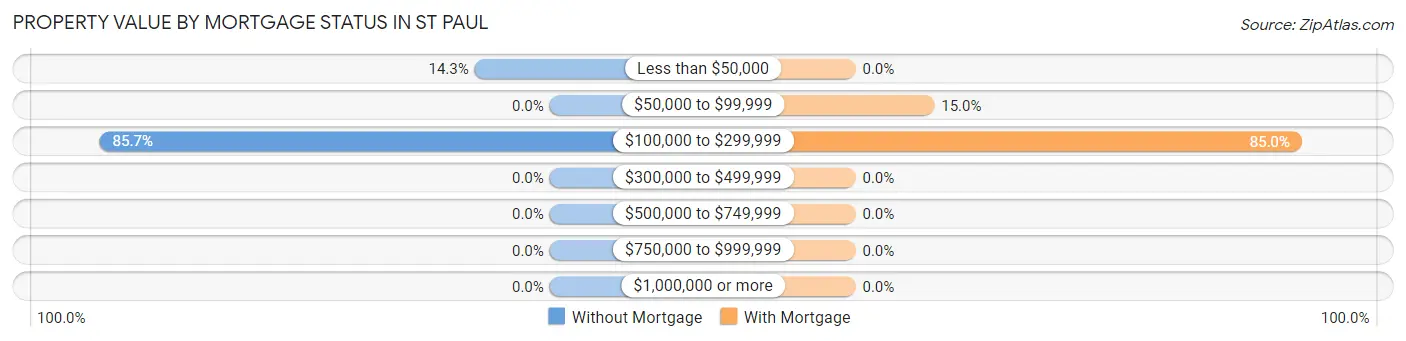
| Property Value | Without Mortgage | With Mortgage |
| Less than $50,000 | 1 (14.3%) | 0 (0.0%) |
| $50,000 to $99,999 | 0 (0.0%) | 3 (15.0%) |
| $100,000 to $299,999 | 6 (85.7%) | 17 (85.0%) |
| $300,000 to $499,999 | 0 (0.0%) | 0 (0.0%) |
| $500,000 to $749,999 | 0 (0.0%) | 0 (0.0%) |
| $750,000 to $999,999 | 0 (0.0%) | 0 (0.0%) |
| $1,000,000 or more | 0 (0.0%) | 0 (0.0%) |
| Total | 7 (100.0%) | 20 (100.0%) |
Household Income by Mortgage Status in St Paul
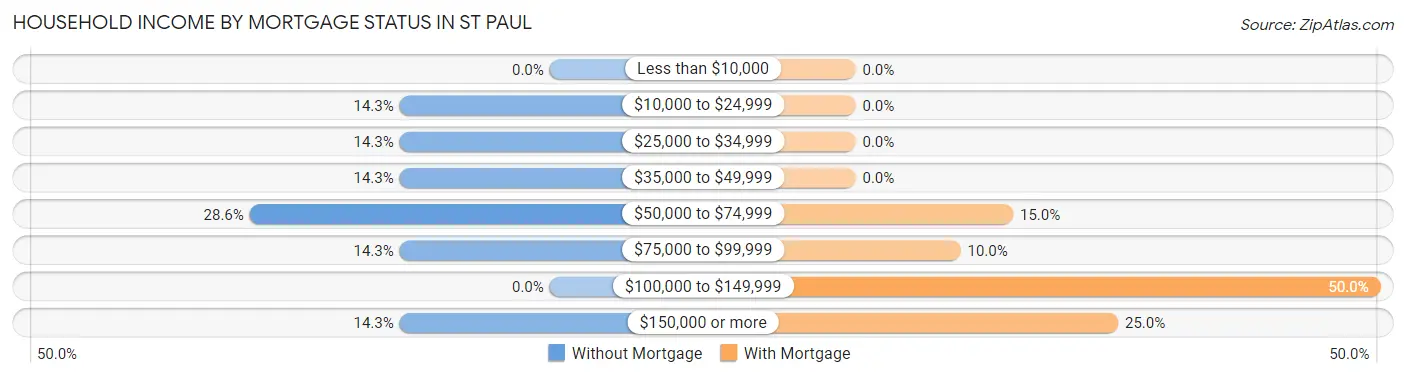
| Household Income | Without Mortgage | With Mortgage |
| Less than $10,000 | 0 (0.0%) | 0 (0.0%) |
| $10,000 to $24,999 | 1 (14.3%) | 0 (0.0%) |
| $25,000 to $34,999 | 1 (14.3%) | 0 (0.0%) |
| $35,000 to $49,999 | 1 (14.3%) | 0 (0.0%) |
| $50,000 to $74,999 | 2 (28.6%) | 3 (15.0%) |
| $75,000 to $99,999 | 1 (14.3%) | 2 (10.0%) |
| $100,000 to $149,999 | 0 (0.0%) | 10 (50.0%) |
| $150,000 or more | 1 (14.3%) | 5 (25.0%) |
| Total | 7 (100.0%) | 20 (100.0%) |
Property Value to Household Income Ratio in St Paul
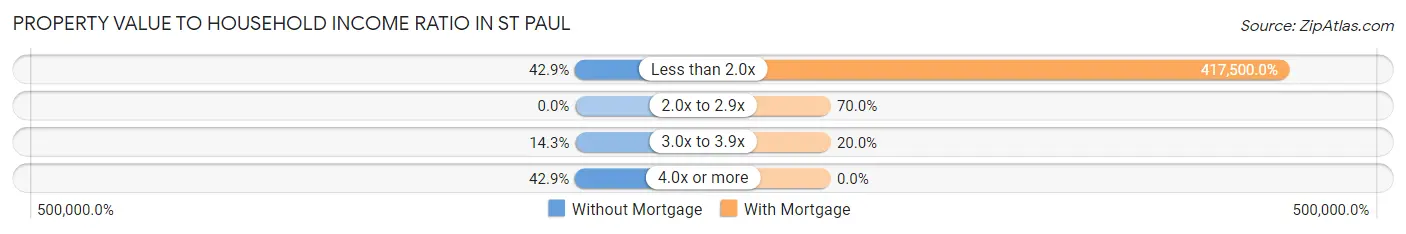
| Value-to-Income Ratio | Without Mortgage | With Mortgage |
| Less than 2.0x | 3 (42.9%) | 83,500 (417,500.0%) |
| 2.0x to 2.9x | 0 (0.0%) | 14 (70.0%) |
| 3.0x to 3.9x | 1 (14.3%) | 4 (20.0%) |
| 4.0x or more | 3 (42.9%) | 0 (0.0%) |
| Total | 7 (100.0%) | 20 (100.0%) |
Real Estate Taxes by Mortgage Status in St Paul
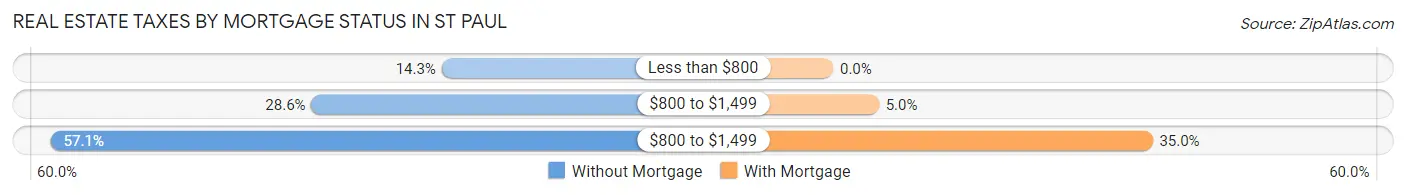
| Property Taxes | Without Mortgage | With Mortgage |
| Less than $800 | 1 (14.3%) | 0 (0.0%) |
| $800 to $1,499 | 2 (28.6%) | 1 (5.0%) |
| $800 to $1,499 | 4 (57.1%) | 7 (35.0%) |
| Total | 7 (100.0%) | 20 (100.0%) |
Health & Disability in St Paul
Health Insurance Coverage by Age in St Paul
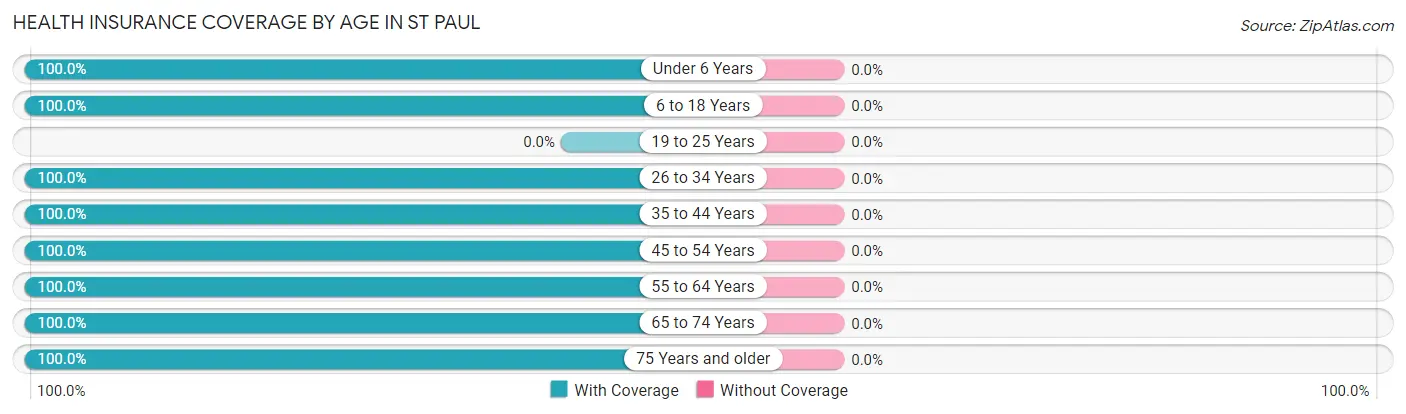
| Age Bracket | With Coverage | Without Coverage |
| Under 6 Years | 5 (100.0%) | 0 (0.0%) |
| 6 to 18 Years | 7 (100.0%) | 0 (0.0%) |
| 19 to 25 Years | 0 (0.0%) | 0 (0.0%) |
| 26 to 34 Years | 22 (100.0%) | 0 (0.0%) |
| 35 to 44 Years | 10 (100.0%) | 0 (0.0%) |
| 45 to 54 Years | 4 (100.0%) | 0 (0.0%) |
| 55 to 64 Years | 8 (100.0%) | 0 (0.0%) |
| 65 to 74 Years | 6 (100.0%) | 0 (0.0%) |
| 75 Years and older | 3 (100.0%) | 0 (0.0%) |
| Total | 65 (100.0%) | 0 (0.0%) |
Health Insurance Coverage by Citizenship Status in St Paul
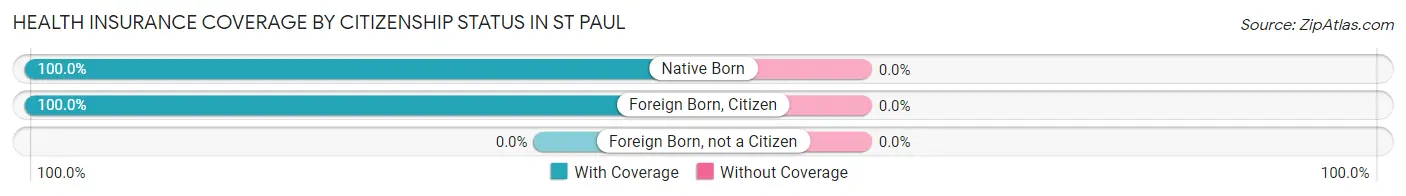
| Citizenship Status | With Coverage | Without Coverage |
| Native Born | 5 (100.0%) | 0 (0.0%) |
| Foreign Born, Citizen | 7 (100.0%) | 0 (0.0%) |
| Foreign Born, not a Citizen | 0 (0.0%) | 0 (0.0%) |
Health Insurance Coverage by Household Income in St Paul
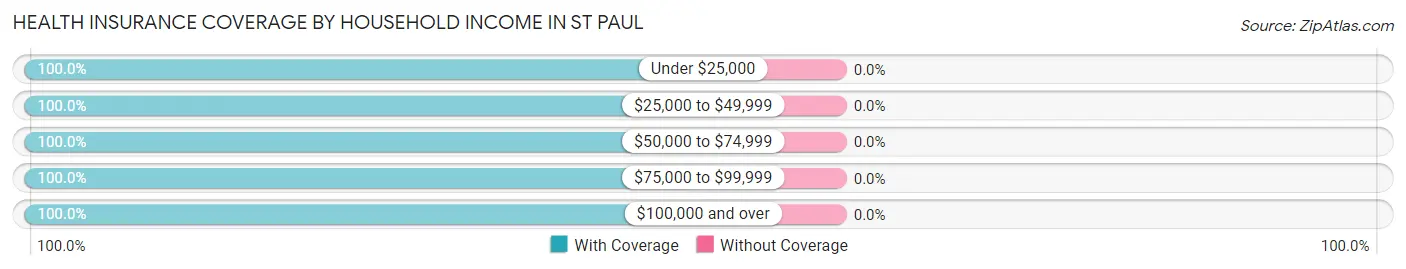
| Household Income | With Coverage | Without Coverage |
| Under $25,000 | 2 (100.0%) | 0 (0.0%) |
| $25,000 to $49,999 | 9 (100.0%) | 0 (0.0%) |
| $50,000 to $74,999 | 5 (100.0%) | 0 (0.0%) |
| $75,000 to $99,999 | 32 (100.0%) | 0 (0.0%) |
| $100,000 and over | 17 (100.0%) | 0 (0.0%) |
Public vs Private Health Insurance Coverage by Age in St Paul
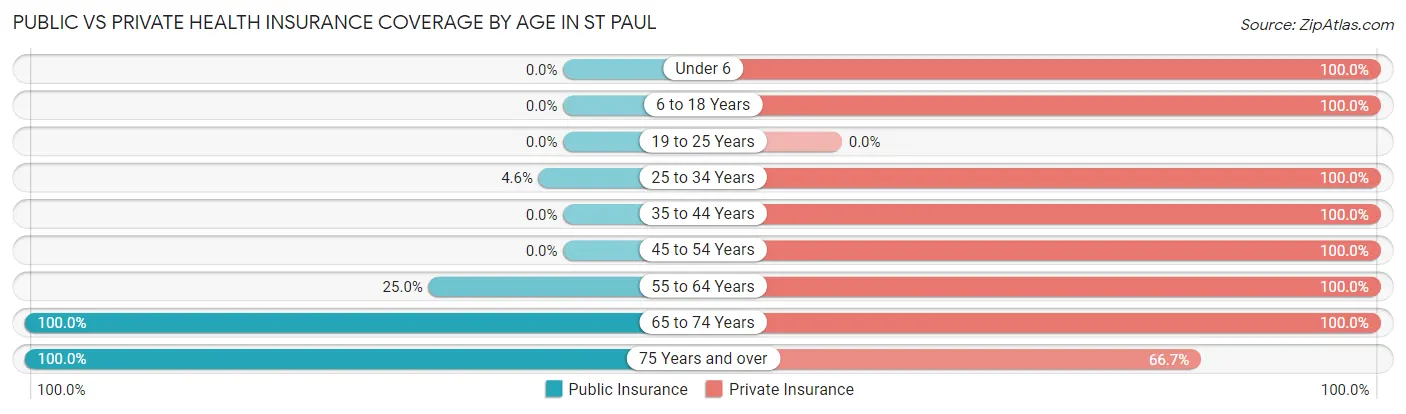
| Age Bracket | Public Insurance | Private Insurance |
| Under 6 | 0 (0.0%) | 5 (100.0%) |
| 6 to 18 Years | 0 (0.0%) | 7 (100.0%) |
| 19 to 25 Years | 0 (0.0%) | 0 (0.0%) |
| 25 to 34 Years | 1 (4.5%) | 22 (100.0%) |
| 35 to 44 Years | 0 (0.0%) | 10 (100.0%) |
| 45 to 54 Years | 0 (0.0%) | 4 (100.0%) |
| 55 to 64 Years | 2 (25.0%) | 8 (100.0%) |
| 65 to 74 Years | 6 (100.0%) | 6 (100.0%) |
| 75 Years and over | 3 (100.0%) | 2 (66.7%) |
| Total | 12 (18.5%) | 64 (98.5%) |
Disability Status by Sex by Age in St Paul
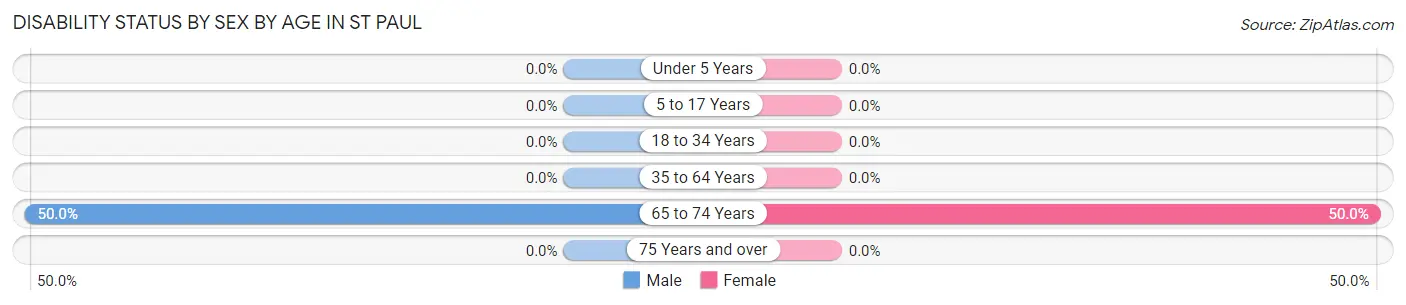
| Age Bracket | Male | Female |
| Under 5 Years | 0 (0.0%) | 0 (0.0%) |
| 5 to 17 Years | 0 (0.0%) | 0 (0.0%) |
| 18 to 34 Years | 0 (0.0%) | 0 (0.0%) |
| 35 to 64 Years | 0 (0.0%) | 0 (0.0%) |
| 65 to 74 Years | 2 (50.0%) | 1 (50.0%) |
| 75 Years and over | 0 (0.0%) | 0 (0.0%) |
Disability Class by Sex by Age in St Paul
Disability Class: Hearing Difficulty
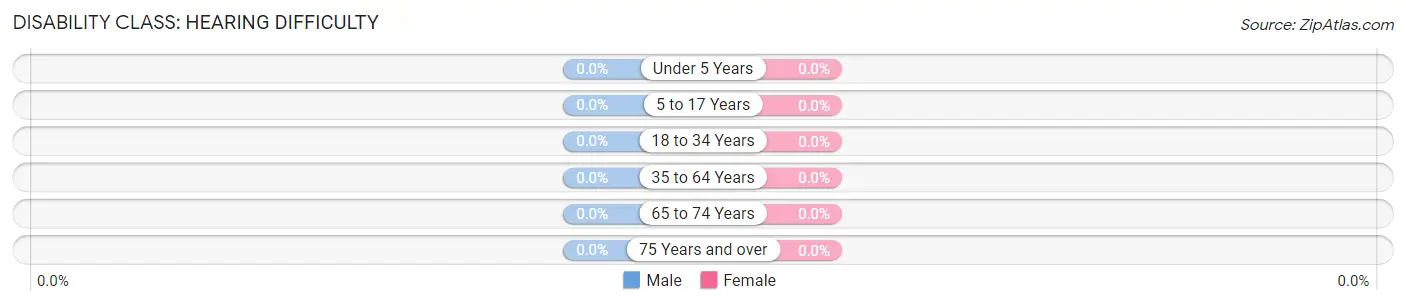
| Age Bracket | Male | Female |
| Under 5 Years | 0 (0.0%) | 0 (0.0%) |
| 5 to 17 Years | 0 (0.0%) | 0 (0.0%) |
| 18 to 34 Years | 0 (0.0%) | 0 (0.0%) |
| 35 to 64 Years | 0 (0.0%) | 0 (0.0%) |
| 65 to 74 Years | 0 (0.0%) | 0 (0.0%) |
| 75 Years and over | 0 (0.0%) | 0 (0.0%) |
Disability Class: Vision Difficulty
| Age Bracket | Male | Female |
| Under 5 Years | 0 (0.0%) | 0 (0.0%) |
| 5 to 17 Years | 0 (0.0%) | 0 (0.0%) |
| 18 to 34 Years | 0 (0.0%) | 0 (0.0%) |
| 35 to 64 Years | 0 (0.0%) | 0 (0.0%) |
| 65 to 74 Years | 0 (0.0%) | 0 (0.0%) |
| 75 Years and over | 0 (0.0%) | 0 (0.0%) |
Disability Class: Cognitive Difficulty
| Age Bracket | Male | Female |
| 5 to 17 Years | 0 (0.0%) | 0 (0.0%) |
| 18 to 34 Years | 0 (0.0%) | 0 (0.0%) |
| 35 to 64 Years | 0 (0.0%) | 0 (0.0%) |
| 65 to 74 Years | 2 (50.0%) | 1 (50.0%) |
| 75 Years and over | 0 (0.0%) | 0 (0.0%) |
Disability Class: Ambulatory Difficulty
| Age Bracket | Male | Female |
| 5 to 17 Years | 0 (0.0%) | 0 (0.0%) |
| 18 to 34 Years | 0 (0.0%) | 0 (0.0%) |
| 35 to 64 Years | 0 (0.0%) | 0 (0.0%) |
| 65 to 74 Years | 2 (50.0%) | 1 (50.0%) |
| 75 Years and over | 0 (0.0%) | 0 (0.0%) |
Disability Class: Self-Care Difficulty
| Age Bracket | Male | Female |
| 5 to 17 Years | 0 (0.0%) | 0 (0.0%) |
| 18 to 34 Years | 0 (0.0%) | 0 (0.0%) |
| 35 to 64 Years | 0 (0.0%) | 0 (0.0%) |
| 65 to 74 Years | 0 (0.0%) | 0 (0.0%) |
| 75 Years and over | 0 (0.0%) | 0 (0.0%) |
Technology Access in St Paul
Computing Device Access in St Paul
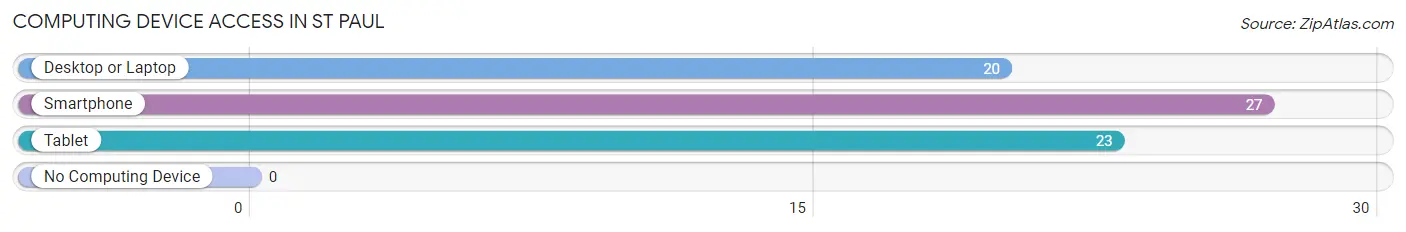
| Device Type | # Households | % Households |
| Desktop or Laptop | 20 | 64.5% |
| Smartphone | 27 | 87.1% |
| Tablet | 23 | 74.2% |
| No Computing Device | 0 | 0.0% |
| Total | 31 | 100.0% |
Internet Access in St Paul
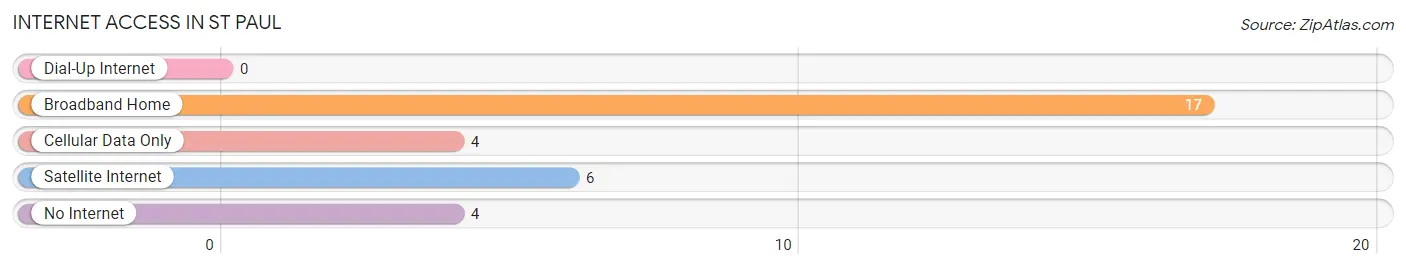
| Internet Type | # Households | % Households |
| Dial-Up Internet | 0 | 0.0% |
| Broadband Home | 17 | 54.8% |
| Cellular Data Only | 4 | 12.9% |
| Satellite Internet | 6 | 19.4% |
| No Internet | 4 | 12.9% |
| Total | 31 | 100.0% |
St Paul Summary
St. Paul is a small city located in the state of Iowa in the United States. It is located in the southeastern corner of the state, in the county of Dubuque. The city has a population of approximately 1,500 people, and is part of the Dubuque Metropolitan Statistical Area.
History
St. Paul was founded in 1845 by a group of German immigrants who had come to the area in search of a better life. The city was named after the city of St. Paul, Minnesota, which was founded by the same group of immigrants. The city was originally a farming community, and the first settlers built a church and a school. The city was incorporated in 1856, and the first mayor was elected in 1857.
In the late 19th century, St. Paul began to grow and develop. The city was connected to the rest of the state by the Dubuque and Sioux City Railroad in 1881, and the city's first newspaper, the St. Paul Herald, was established in 1883. The city also became a center for manufacturing, with several factories being built in the area.
Geography
St. Paul is located in the southeastern corner of Iowa, in the county of Dubuque. The city is situated on the banks of the Mississippi River, and is surrounded by rolling hills and farmland. The city has a total area of 1.3 square miles, all of which is land.
The climate in St. Paul is typical of the Midwest, with hot summers and cold winters. The average temperature in the summer is around 75 degrees Fahrenheit, and the average temperature in the winter is around 25 degrees Fahrenheit.
Economy
The economy of St. Paul is largely based on agriculture and manufacturing. The city is home to several large farms, and the surrounding area is known for its production of corn, soybeans, and other crops. The city is also home to several manufacturing companies, including a paper mill, a furniture factory, and a plastics factory.
The city also has a thriving tourism industry, with several attractions in the area, including the National Mississippi River Museum and Aquarium, the Dubuque County Historical Society, and the Dubuque Arboretum and Botanical Gardens.
Demographics
As of the 2010 census, the population of St. Paul was 1,500 people. The racial makeup of the city was 97.3% White, 0.7% African American, 0.3% Native American, 0.3% Asian, and 1.3% from other races. The median household income was $41,250, and the median family income was $50,000.
St. Paul is a small city with a rich history and a vibrant economy. The city is home to a diverse population, and is a great place to live and work.
Common Questions
What is Per Capita Income in St Paul?
Per Capita income in St Paul is $38,998.
What is the Median Family Income in St Paul?
Median Family Income in St Paul is $83,750.
What is the Median Household income in St Paul?
Median Household Income in St Paul is $83,250.
What is Income or Wage Gap in St Paul?
Income or Wage Gap in St Paul is 21.4%.
Women in St Paul earn 78.6 cents for every dollar earned by a man.
What is Inequality or Gini Index in St Paul?
Inequality or Gini Index in St Paul is 0.23.
What is the Total Population of St Paul?
Total Population of St Paul is 65.
What is the Total Male Population of St Paul?
Total Male Population of St Paul is 27.
What is the Total Female Population of St Paul?
Total Female Population of St Paul is 38.
What is the Ratio of Males per 100 Females in St Paul?
There are 71.05 Males per 100 Females in St Paul.
What is the Ratio of Females per 100 Males in St Paul?
There are 140.74 Females per 100 Males in St Paul.
What is the Median Population Age in St Paul?
Median Population Age in St Paul is 32.7 Years.
What is the Average Family Size in St Paul
Average Family Size in St Paul is 2.4 People.
What is the Average Household Size in St Paul
Average Household Size in St Paul is 2.1 People.
How Large is the Labor Force in St Paul?
There are 41 People in the Labor Forcein in St Paul.
What is the Percentage of People in the Labor Force in St Paul?
77.4% of People are in the Labor Force in St Paul.