East Peru, IA Map & Demographics
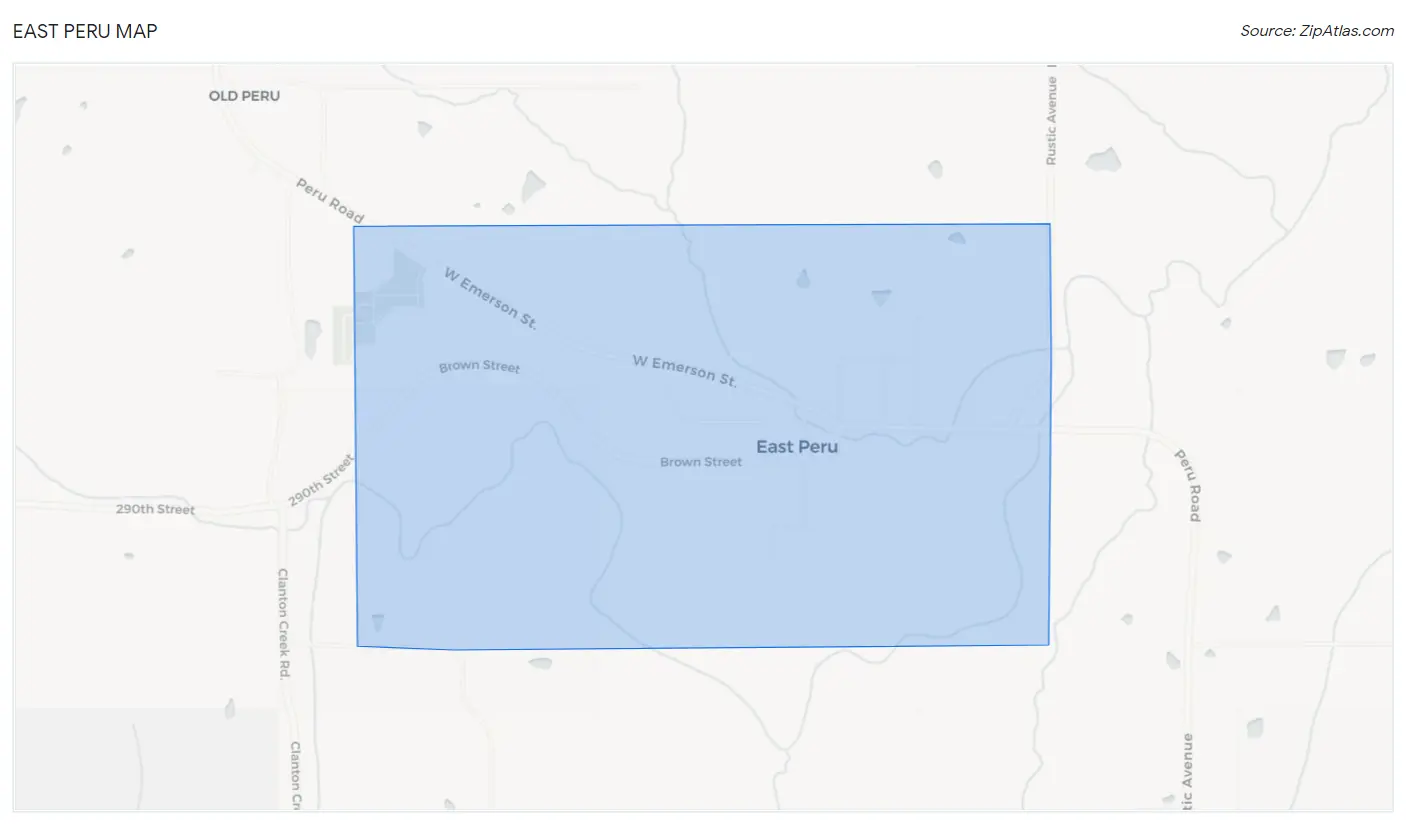
East Peru Map
East Peru Overview
$24,119
PER CAPITA INCOME
$83,750
AVG FAMILY INCOME
$66,875
AVG HOUSEHOLD INCOME
0.32
INEQUALITY / GINI INDEX
183
TOTAL POPULATION
88
MALE POPULATION
95
FEMALE POPULATION
92.63
MALES / 100 FEMALES
107.95
FEMALES / 100 MALES
26.9
MEDIAN AGE
3.8
AVG FAMILY SIZE
3.3
AVG HOUSEHOLD SIZE
91
LABOR FORCE [ PEOPLE ]
70.5%
PERCENT IN LABOR FORCE
2.2%
UNEMPLOYMENT RATE
East Peru Area Codes
Income in East Peru
Income Overview in East Peru
Per Capita Income in East Peru is $24,119, while median incomes of families and households are $83,750 and $66,875 respectively.
| Characteristic | Number | Measure |
| Per Capita Income | 183 | $24,119 |
| Median Family Income | 46 | $83,750 |
| Mean Family Income | 46 | $83,348 |
| Median Household Income | 55 | $66,875 |
| Mean Household Income | 55 | $80,371 |
| Income Deficit | 46 | $0 |
| Wage / Income Gap (%) | 183 | 0.00% |
| Wage / Income Gap ($) | 183 | 100.00¢ per $1 |
| Gini / Inequality Index | 183 | 0.32 |
Earnings by Sex in East Peru
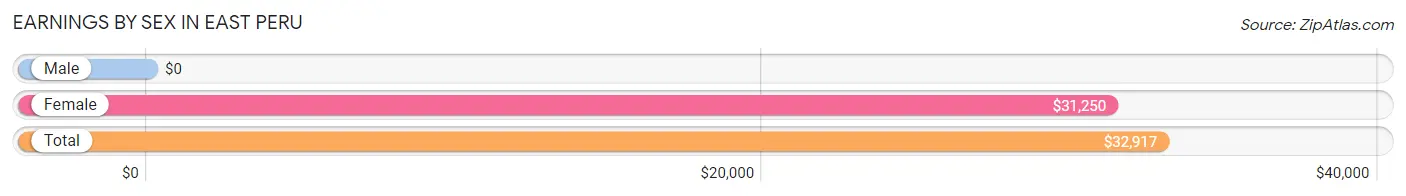
| Sex | Number | Average Earnings |
| Male | 45 (48.4%) | $0 |
| Female | 48 (51.6%) | $31,250 |
| Total | 93 (100.0%) | $32,917 |
Earnings by Sex by Income Bracket in East Peru
The most common earnings brackets in East Peru are $55,000 to $64,999 for men (14 | 31.1%) and $75,000 to $99,999 for women (11 | 22.9%).
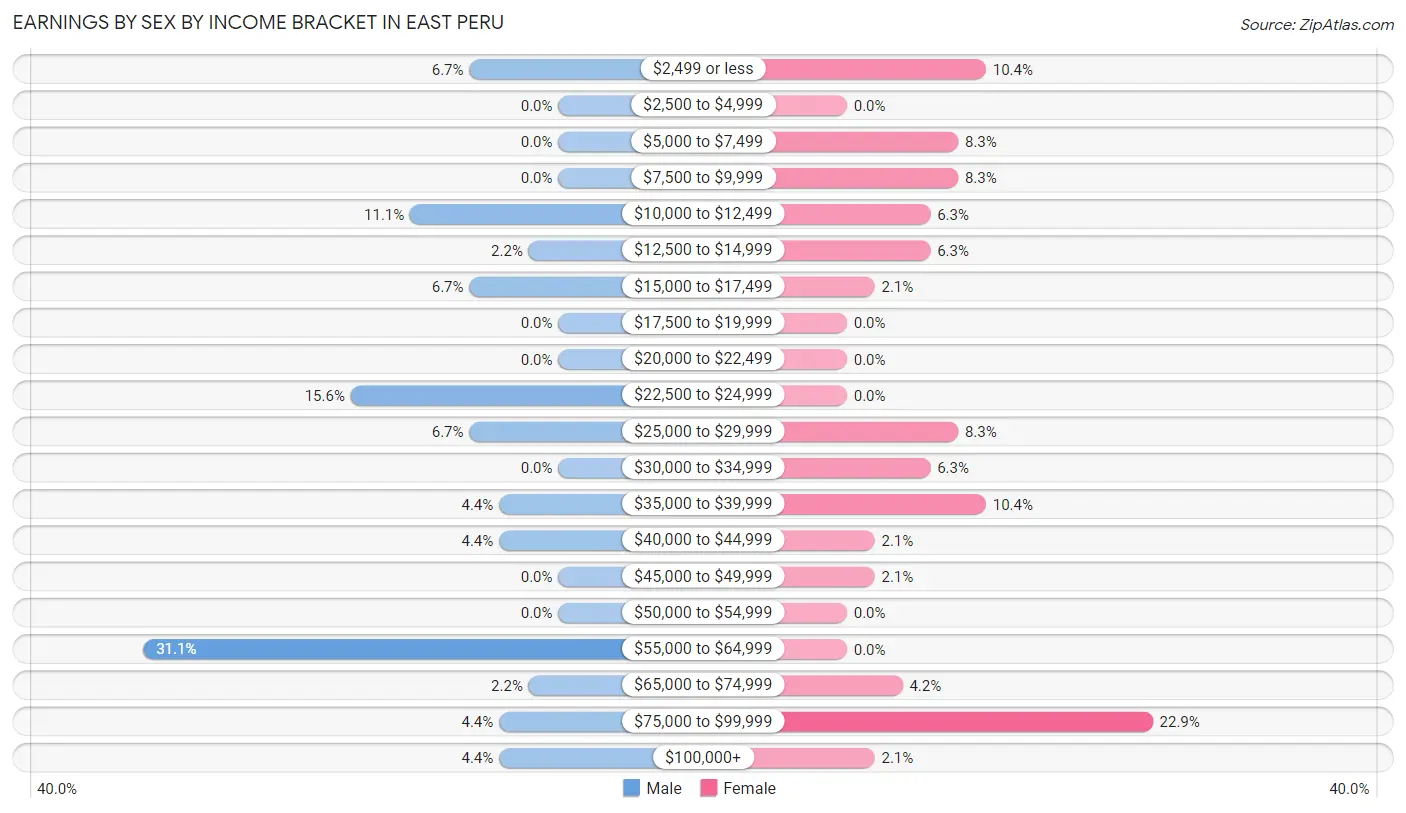
| Income | Male | Female |
| $2,499 or less | 3 (6.7%) | 5 (10.4%) |
| $2,500 to $4,999 | 0 (0.0%) | 0 (0.0%) |
| $5,000 to $7,499 | 0 (0.0%) | 4 (8.3%) |
| $7,500 to $9,999 | 0 (0.0%) | 4 (8.3%) |
| $10,000 to $12,499 | 5 (11.1%) | 3 (6.2%) |
| $12,500 to $14,999 | 1 (2.2%) | 3 (6.2%) |
| $15,000 to $17,499 | 3 (6.7%) | 1 (2.1%) |
| $17,500 to $19,999 | 0 (0.0%) | 0 (0.0%) |
| $20,000 to $22,499 | 0 (0.0%) | 0 (0.0%) |
| $22,500 to $24,999 | 7 (15.6%) | 0 (0.0%) |
| $25,000 to $29,999 | 3 (6.7%) | 4 (8.3%) |
| $30,000 to $34,999 | 0 (0.0%) | 3 (6.2%) |
| $35,000 to $39,999 | 2 (4.4%) | 5 (10.4%) |
| $40,000 to $44,999 | 2 (4.4%) | 1 (2.1%) |
| $45,000 to $49,999 | 0 (0.0%) | 1 (2.1%) |
| $50,000 to $54,999 | 0 (0.0%) | 0 (0.0%) |
| $55,000 to $64,999 | 14 (31.1%) | 0 (0.0%) |
| $65,000 to $74,999 | 1 (2.2%) | 2 (4.2%) |
| $75,000 to $99,999 | 2 (4.4%) | 11 (22.9%) |
| $100,000+ | 2 (4.4%) | 1 (2.1%) |
| Total | 45 (100.0%) | 48 (100.0%) |
Earnings by Sex by Educational Attainment in East Peru
Average earnings in East Peru are $44,375 for men and $37,750 for women, a difference of 14.9%. Men with an educational attainment of high school diploma enjoy the highest average annual earnings of $61,250, while those with college or associate's degree education earn the least with $15,417. Women with an educational attainment of college or associate's degree earn the most with the average annual earnings of $85,417, while those with less than high school education have the smallest earnings of $30,000.
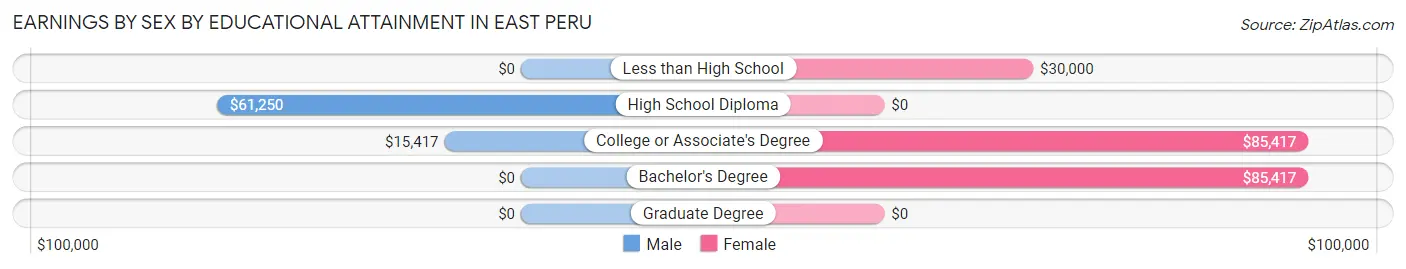
| Educational Attainment | Male Income | Female Income |
| Less than High School | - | - |
| High School Diploma | $61,250 | $0 |
| College or Associate's Degree | $15,417 | $85,417 |
| Bachelor's Degree | - | - |
| Graduate Degree | - | - |
| Total | $44,375 | $37,750 |
Family Income in East Peru
Family Income Brackets in East Peru
According to the East Peru family income data, there are 16 families falling into the $100,000 to $149,999 income range, which is the most common income bracket and makes up 34.8% of all families.
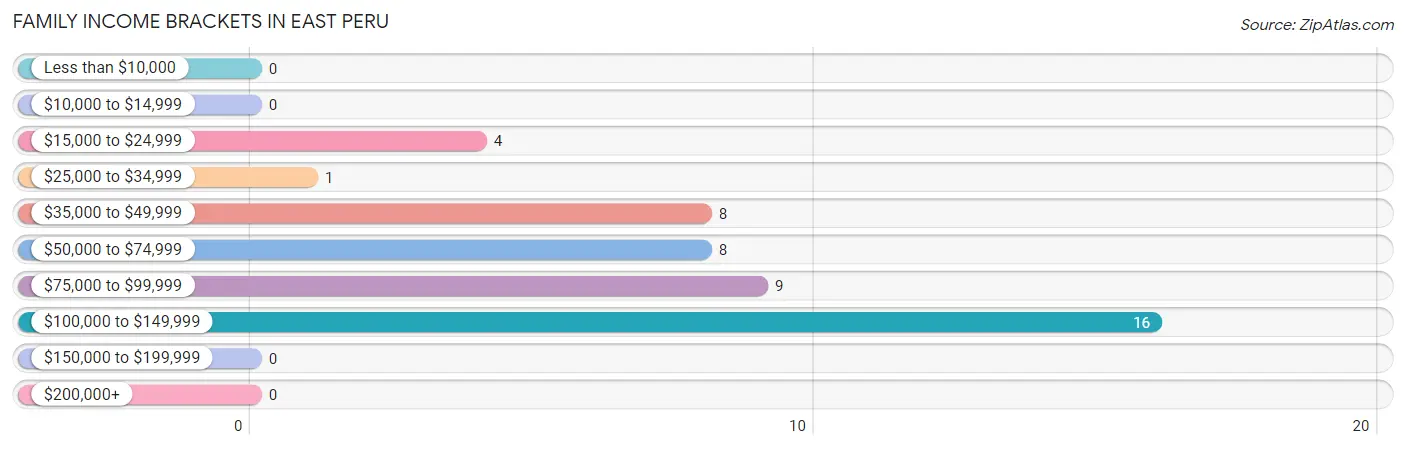
| Income Bracket | # Families | % Families |
| Less than $10,000 | 0 | 0.0% |
| $10,000 to $14,999 | 0 | 0.0% |
| $15,000 to $24,999 | 4 | 8.7% |
| $25,000 to $34,999 | 1 | 2.2% |
| $35,000 to $49,999 | 8 | 17.4% |
| $50,000 to $74,999 | 8 | 17.4% |
| $75,000 to $99,999 | 9 | 19.6% |
| $100,000 to $149,999 | 16 | 34.8% |
| $150,000 to $199,999 | 0 | 0.0% |
| $200,000+ | 0 | 0.0% |
Family Income by Famaliy Size in East Peru
5-person families (7 | 15.2%) account for the highest median family income in East Peru with $84,375 per family, while 2-person families (22 | 47.8%) have the highest median income of $35,000 per family member.
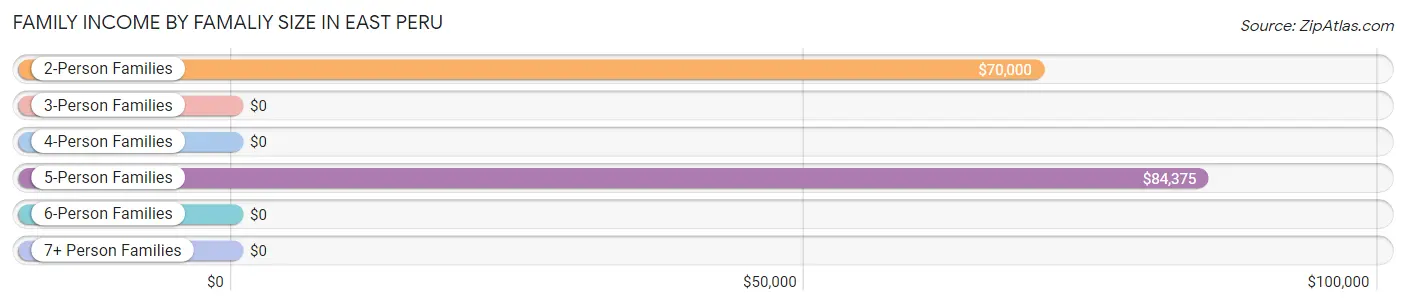
| Income Bracket | # Families | Median Income |
| 2-Person Families | 22 (47.8%) | $70,000 |
| 3-Person Families | 0 (0.0%) | $0 |
| 4-Person Families | 9 (19.6%) | $0 |
| 5-Person Families | 7 (15.2%) | $84,375 |
| 6-Person Families | 8 (17.4%) | $0 |
| 7+ Person Families | 0 (0.0%) | $0 |
| Total | 46 (100.0%) | $83,750 |
Family Income by Number of Earners in East Peru
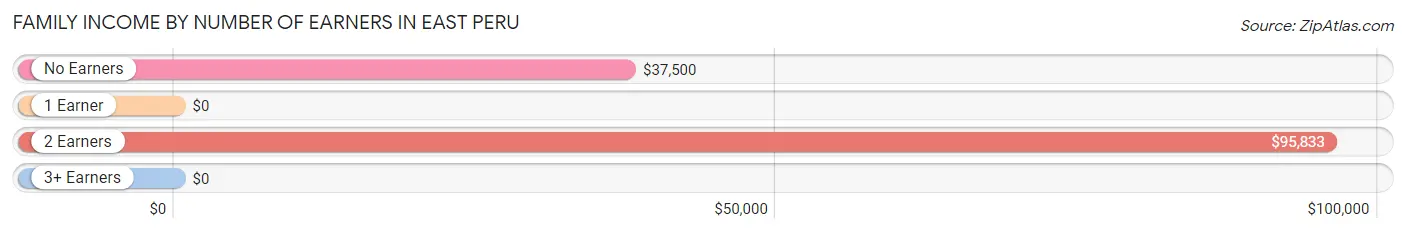
| Number of Earners | # Families | Median Income |
| No Earners | 4 (8.7%) | $37,500 |
| 1 Earner | 8 (17.4%) | $0 |
| 2 Earners | 30 (65.2%) | $95,833 |
| 3+ Earners | 4 (8.7%) | $0 |
| Total | 46 (100.0%) | $83,750 |
Household Income in East Peru
Household Income Brackets in East Peru
With 16 households falling in the category, the $100,000 to $149,999 income range is the most frequent in East Peru, accounting for 29.1% of all households.
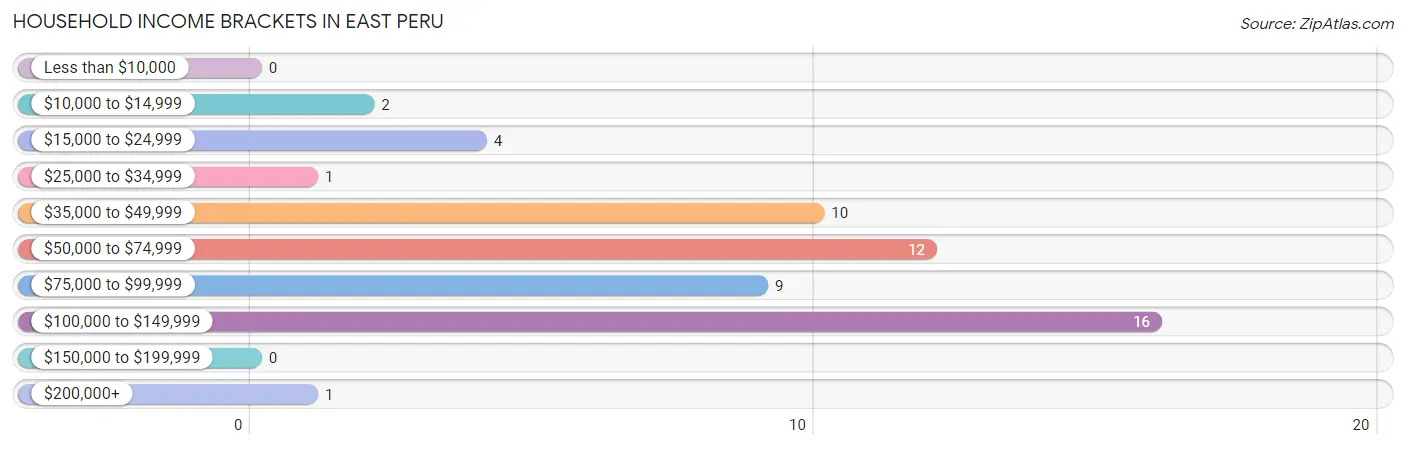
| Income Bracket | # Households | % Households |
| Less than $10,000 | 0 | 0.0% |
| $10,000 to $14,999 | 2 | 3.6% |
| $15,000 to $24,999 | 4 | 7.3% |
| $25,000 to $34,999 | 1 | 1.8% |
| $35,000 to $49,999 | 10 | 18.2% |
| $50,000 to $74,999 | 12 | 21.8% |
| $75,000 to $99,999 | 9 | 16.4% |
| $100,000 to $149,999 | 16 | 29.1% |
| $150,000 to $199,999 | 0 | 0.0% |
| $200,000+ | 1 | 1.8% |
Household Income by Householder Age in East Peru
The median household income in East Peru is $66,875, with the highest median household income of $90,000 found in the 25 to 44 years age bracket for the primary householder. A total of 30 households (54.5%) fall into this category.
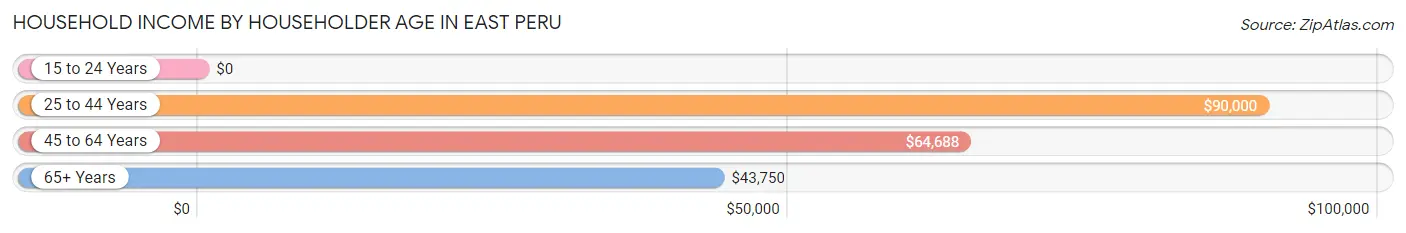
| Income Bracket | # Households | Median Income |
| 15 to 24 Years | 0 (0.0%) | $0 |
| 25 to 44 Years | 30 (54.5%) | $90,000 |
| 45 to 64 Years | 17 (30.9%) | $64,688 |
| 65+ Years | 8 (14.5%) | $43,750 |
| Total | 55 (100.0%) | $66,875 |
Poverty in East Peru
Income Below Poverty by Sex and Age in East Peru
With 5.7% poverty level for males and 19.0% for females among the residents of East Peru, 25 to 34 year old males and under 5 year old females are the most vulnerable to poverty, with 4 males (100.0%) and 9 females (100.0%) in their respective age groups living below the poverty level.
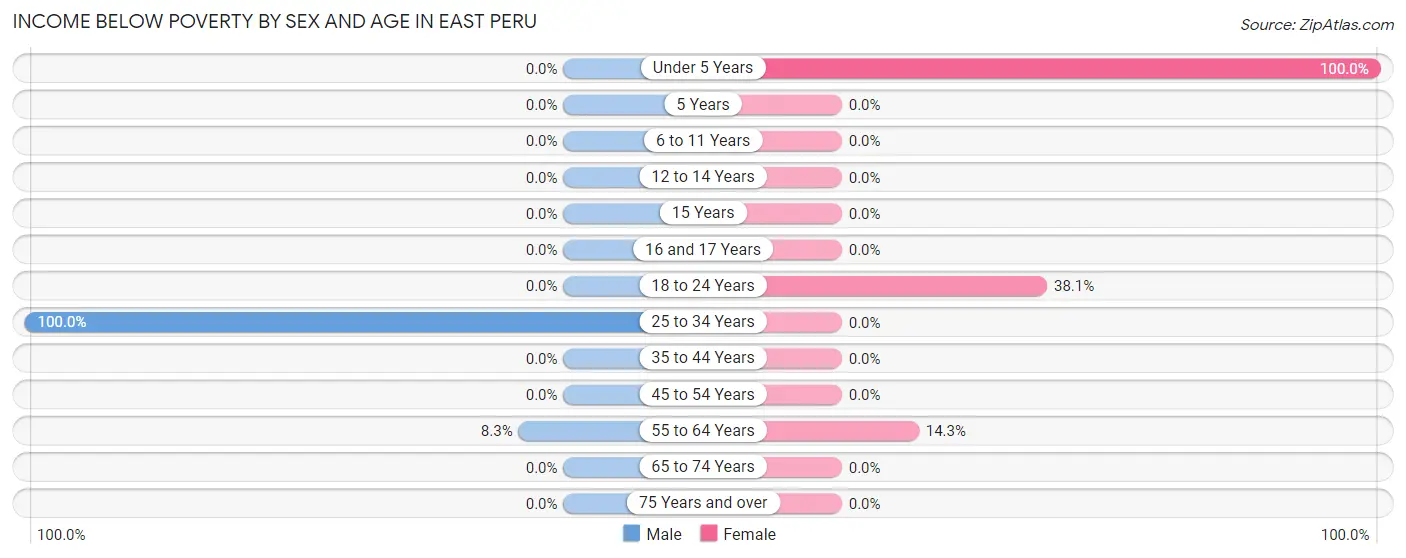
| Age Bracket | Male | Female |
| Under 5 Years | 0 (0.0%) | 9 (100.0%) |
| 5 Years | 0 (0.0%) | 0 (0.0%) |
| 6 to 11 Years | 0 (0.0%) | 0 (0.0%) |
| 12 to 14 Years | 0 (0.0%) | 0 (0.0%) |
| 15 Years | 0 (0.0%) | 0 (0.0%) |
| 16 and 17 Years | 0 (0.0%) | 0 (0.0%) |
| 18 to 24 Years | 0 (0.0%) | 8 (38.1%) |
| 25 to 34 Years | 4 (100.0%) | 0 (0.0%) |
| 35 to 44 Years | 0 (0.0%) | 0 (0.0%) |
| 45 to 54 Years | 0 (0.0%) | 0 (0.0%) |
| 55 to 64 Years | 1 (8.3%) | 1 (14.3%) |
| 65 to 74 Years | 0 (0.0%) | 0 (0.0%) |
| 75 Years and over | 0 (0.0%) | 0 (0.0%) |
| Total | 5 (5.7%) | 18 (19.0%) |
Income Above Poverty by Sex and Age in East Peru
According to the poverty statistics in East Peru, males aged under 5 years and females aged 6 to 11 years are the age groups that are most secure financially, with 100.0% of males and 100.0% of females in these age groups living above the poverty line.
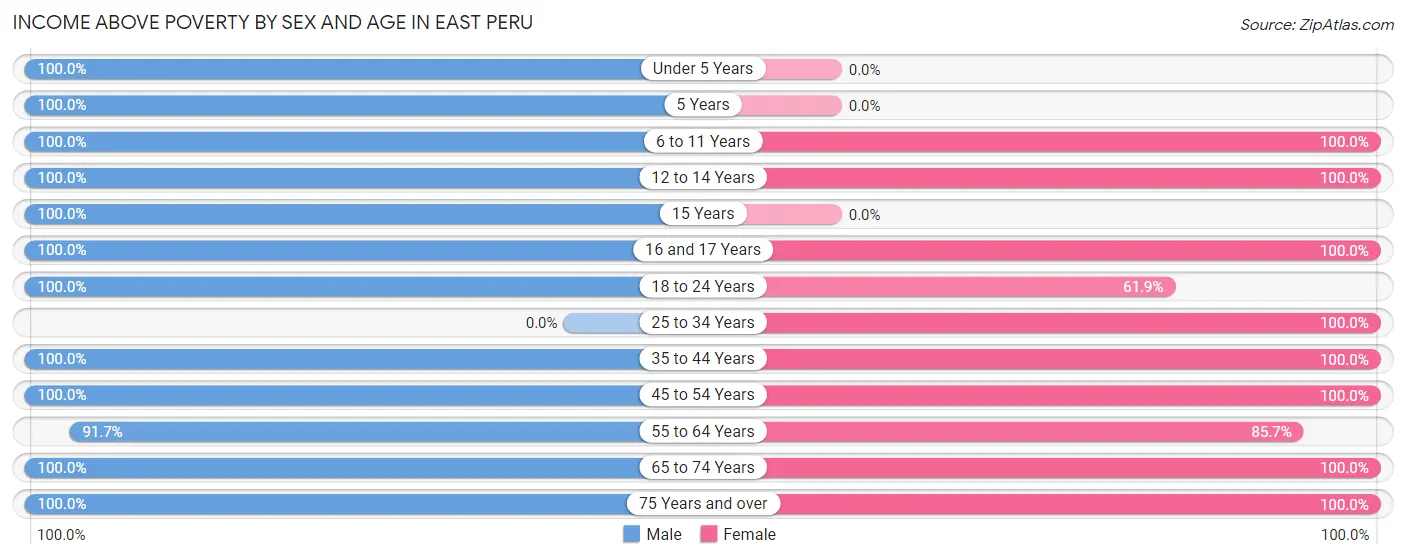
| Age Bracket | Male | Female |
| Under 5 Years | 18 (100.0%) | 0 (0.0%) |
| 5 Years | 2 (100.0%) | 0 (0.0%) |
| 6 to 11 Years | 6 (100.0%) | 10 (100.0%) |
| 12 to 14 Years | 5 (100.0%) | 3 (100.0%) |
| 15 Years | 1 (100.0%) | 0 (0.0%) |
| 16 and 17 Years | 1 (100.0%) | 2 (100.0%) |
| 18 to 24 Years | 5 (100.0%) | 13 (61.9%) |
| 25 to 34 Years | 0 (0.0%) | 16 (100.0%) |
| 35 to 44 Years | 21 (100.0%) | 11 (100.0%) |
| 45 to 54 Years | 6 (100.0%) | 8 (100.0%) |
| 55 to 64 Years | 11 (91.7%) | 6 (85.7%) |
| 65 to 74 Years | 3 (100.0%) | 6 (100.0%) |
| 75 Years and over | 4 (100.0%) | 2 (100.0%) |
| Total | 83 (94.3%) | 77 (81.0%) |
Income Below Poverty Among Married-Couple Families in East Peru
The poverty statistics for married-couple families in East Peru show that 10.8% or 4 of the total 37 families live below the poverty line. Families with 1 or 2 children have the highest poverty rate of 50.0%, comprising of 4 families. On the other hand, families with no children have the lowest poverty rate of 0.0%, which includes 0 families.
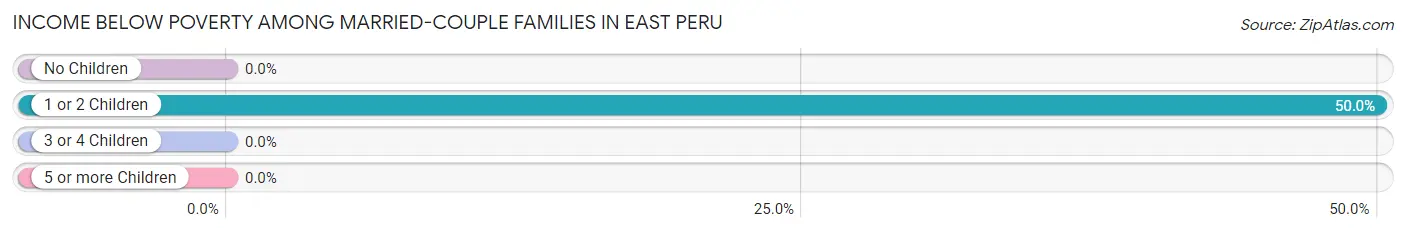
| Children | Above Poverty | Below Poverty |
| No Children | 16 (100.0%) | 0 (0.0%) |
| 1 or 2 Children | 4 (50.0%) | 4 (50.0%) |
| 3 or 4 Children | 13 (100.0%) | 0 (0.0%) |
| 5 or more Children | 0 (0.0%) | 0 (0.0%) |
| Total | 33 (89.2%) | 4 (10.8%) |
Income Below Poverty Among Single-Parent Households in East Peru
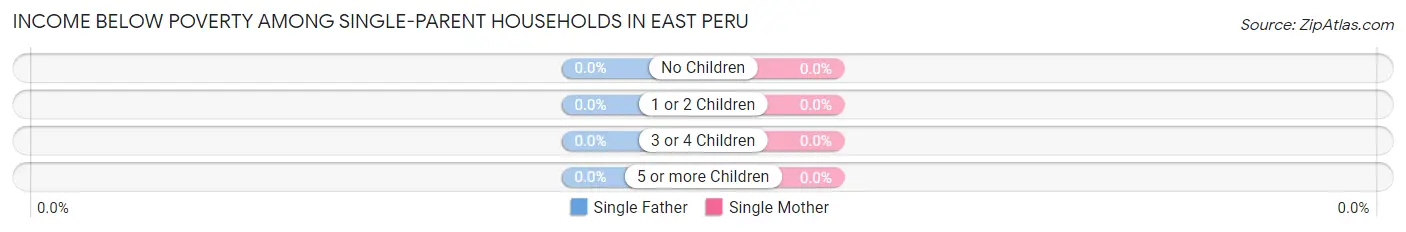
| Children | Single Father | Single Mother |
| No Children | 0 (0.0%) | 0 (0.0%) |
| 1 or 2 Children | 0 (0.0%) | 0 (0.0%) |
| 3 or 4 Children | 0 (0.0%) | 0 (0.0%) |
| 5 or more Children | 0 (0.0%) | 0 (0.0%) |
| Total | 0 (0.0%) | 0 (0.0%) |
Income Below Poverty Among Married-Couple vs Single-Parent Households in East Peru
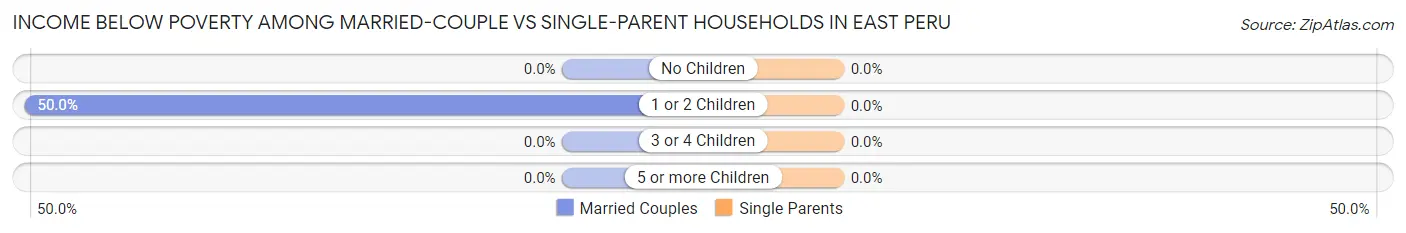
| Children | Married-Couple Families | Single-Parent Households |
| No Children | 0 (0.0%) | 0 (0.0%) |
| 1 or 2 Children | 4 (50.0%) | 0 (0.0%) |
| 3 or 4 Children | 0 (0.0%) | 0 (0.0%) |
| 5 or more Children | 0 (0.0%) | 0 (0.0%) |
| Total | 4 (10.8%) | 0 (0.0%) |
Race in East Peru
The most populous races in East Peru are White / Caucasian (180 | 98.4%), Hispanic or Latino (3 | 1.6%), and Some other Race (3 | 1.6%).
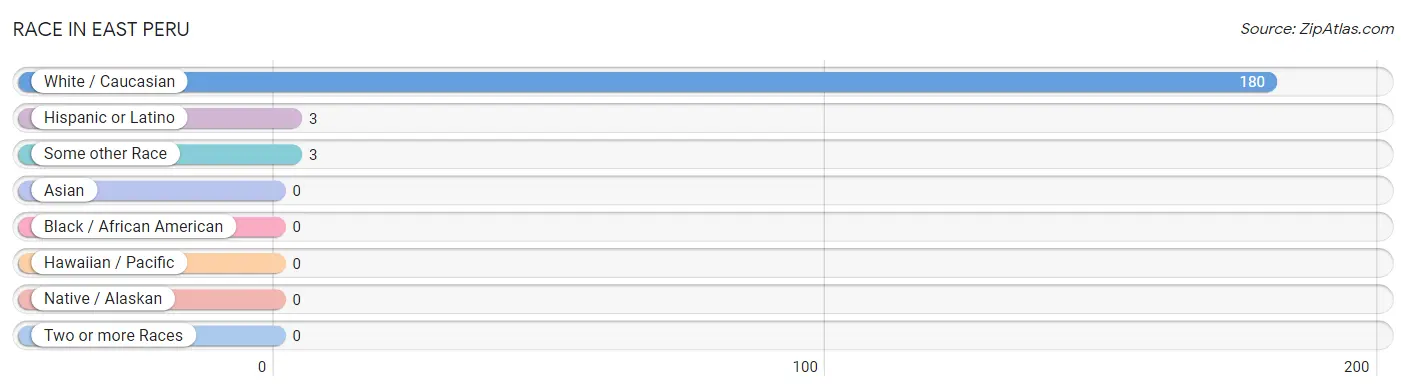
| Race | # Population | % Population |
| Asian | 0 | 0.0% |
| Black / African American | 0 | 0.0% |
| Hawaiian / Pacific | 0 | 0.0% |
| Hispanic or Latino | 3 | 1.6% |
| Native / Alaskan | 0 | 0.0% |
| White / Caucasian | 180 | 98.4% |
| Two or more Races | 0 | 0.0% |
| Some other Race | 3 | 1.6% |
| Total | 183 | 100.0% |
Ancestry in East Peru
The most populous ancestries reported in East Peru are German (36 | 19.7%), Irish (29 | 15.9%), English (24 | 13.1%), French (19 | 10.4%), and American (10 | 5.5%), together accounting for 64.5% of all East Peru residents.
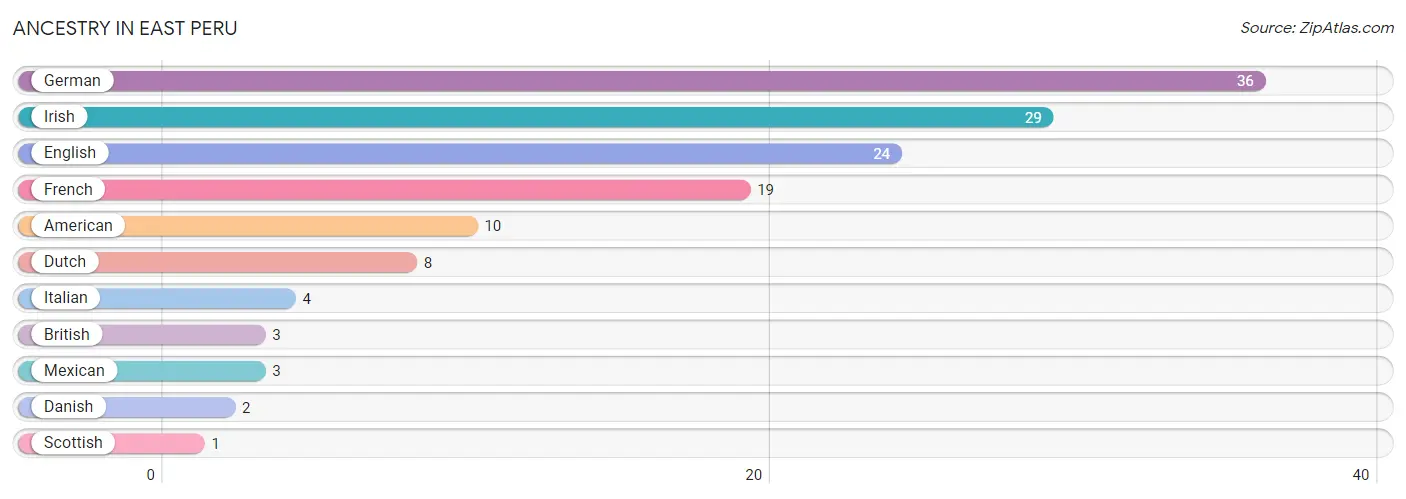
| Ancestry | # Population | % Population |
| American | 10 | 5.5% |
| British | 3 | 1.6% |
| Danish | 2 | 1.1% |
| Dutch | 8 | 4.4% |
| English | 24 | 13.1% |
| French | 19 | 10.4% |
| German | 36 | 19.7% |
| Irish | 29 | 15.9% |
| Italian | 4 | 2.2% |
| Mexican | 3 | 1.6% |
| Scottish | 1 | 0.5% | View All 11 Rows |
Immigrants in East Peru

| Immigration Origin | # Population | % Population | View All 0 Rows |
Sex and Age in East Peru
Sex and Age in East Peru
The most populous age groups in East Peru are Under 5 Years (18 | 20.4%) for men and 20 to 24 Years (15 | 15.8%) for women.
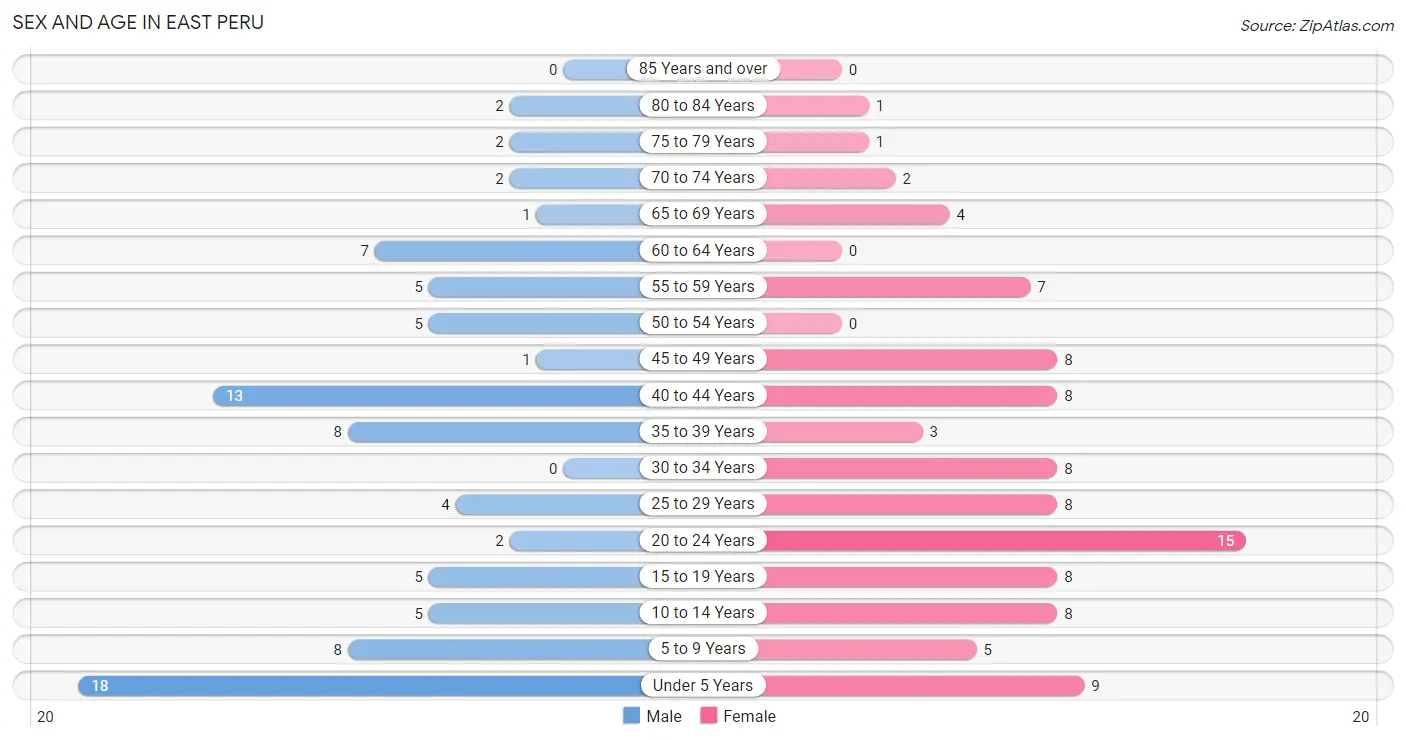
| Age Bracket | Male | Female |
| Under 5 Years | 18 (20.4%) | 9 (9.5%) |
| 5 to 9 Years | 8 (9.1%) | 5 (5.3%) |
| 10 to 14 Years | 5 (5.7%) | 8 (8.4%) |
| 15 to 19 Years | 5 (5.7%) | 8 (8.4%) |
| 20 to 24 Years | 2 (2.3%) | 15 (15.8%) |
| 25 to 29 Years | 4 (4.5%) | 8 (8.4%) |
| 30 to 34 Years | 0 (0.0%) | 8 (8.4%) |
| 35 to 39 Years | 8 (9.1%) | 3 (3.2%) |
| 40 to 44 Years | 13 (14.8%) | 8 (8.4%) |
| 45 to 49 Years | 1 (1.1%) | 8 (8.4%) |
| 50 to 54 Years | 5 (5.7%) | 0 (0.0%) |
| 55 to 59 Years | 5 (5.7%) | 7 (7.4%) |
| 60 to 64 Years | 7 (8.0%) | 0 (0.0%) |
| 65 to 69 Years | 1 (1.1%) | 4 (4.2%) |
| 70 to 74 Years | 2 (2.3%) | 2 (2.1%) |
| 75 to 79 Years | 2 (2.3%) | 1 (1.1%) |
| 80 to 84 Years | 2 (2.3%) | 1 (1.1%) |
| 85 Years and over | 0 (0.0%) | 0 (0.0%) |
| Total | 88 (100.0%) | 95 (100.0%) |
Families and Households in East Peru
Median Family Size in East Peru
The median family size in East Peru is 3.78 persons per family, with married-couple families (37 | 80.4%) accounting for the largest median family size of 3.81 persons per family. On the other hand, single female/mother families (5 | 10.9%) represent the smallest median family size with 3.60 persons per family.
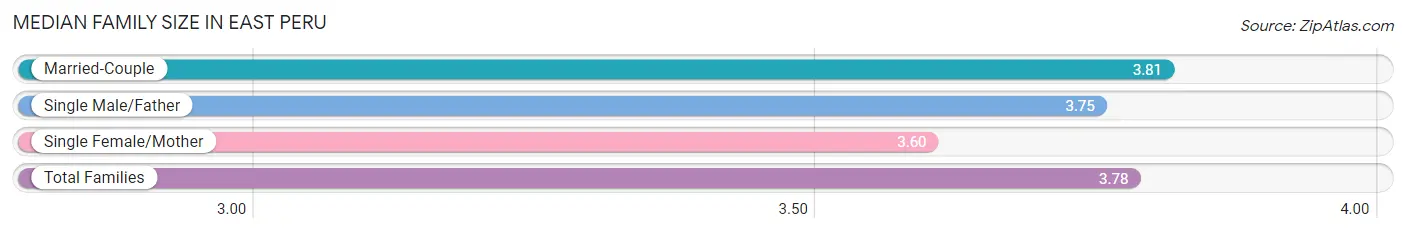
| Family Type | # Families | Family Size |
| Married-Couple | 37 (80.4%) | 3.81 |
| Single Male/Father | 4 (8.7%) | 3.75 |
| Single Female/Mother | 5 (10.9%) | 3.60 |
| Total Families | 46 (100.0%) | 3.78 |
Median Household Size in East Peru
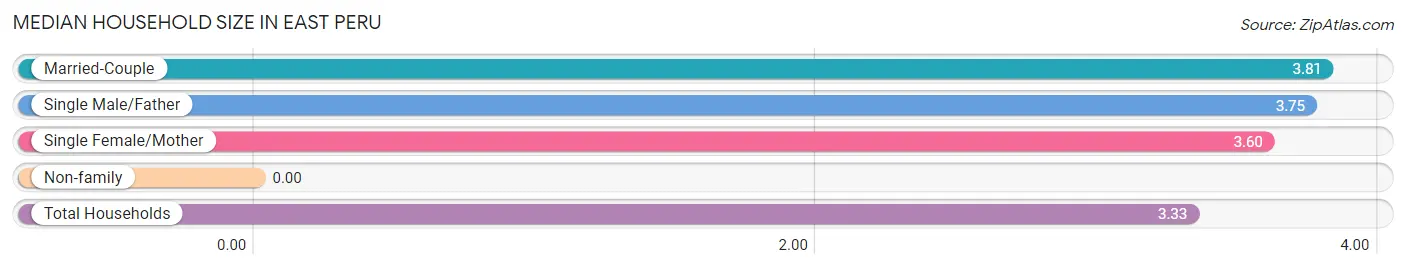
| Household Type | # Households | Household Size |
| Married-Couple | 37 (67.3%) | 3.81 |
| Single Male/Father | 4 (7.3%) | 3.75 |
| Single Female/Mother | 5 (9.1%) | 3.60 |
| Non-family | 9 (16.4%) | - |
| Total Households | 55 (100.0%) | 3.33 |
Household Size by Marriage Status in East Peru
Out of a total of 55 households in East Peru, 46 (83.6%) are family households, while 9 (16.4%) are nonfamily households. The most numerous type of family households are 2-person households, comprising 22, and the most common type of nonfamily households are 1-person households, comprising 9.
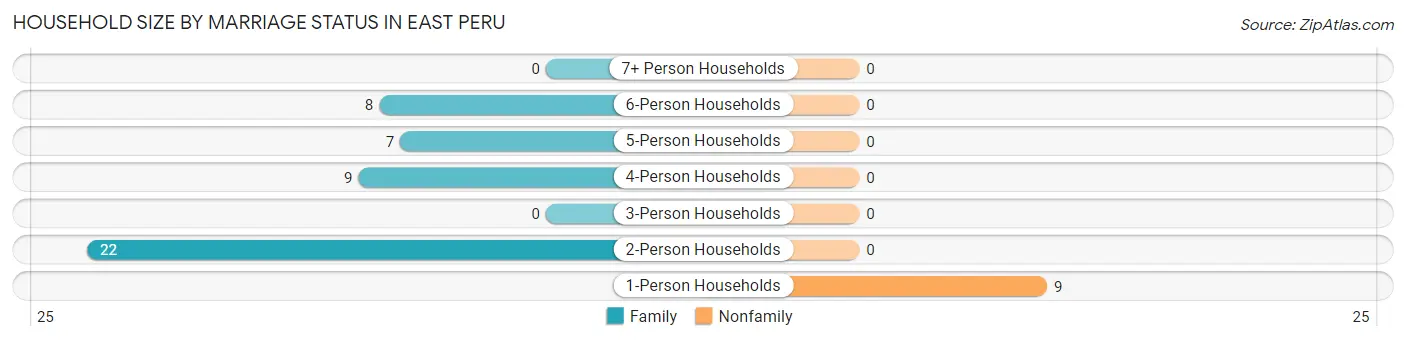
| Household Size | Family Households | Nonfamily Households |
| 1-Person Households | - | 9 (16.4%) |
| 2-Person Households | 22 (40.0%) | 0 (0.0%) |
| 3-Person Households | 0 (0.0%) | 0 (0.0%) |
| 4-Person Households | 9 (16.4%) | 0 (0.0%) |
| 5-Person Households | 7 (12.7%) | 0 (0.0%) |
| 6-Person Households | 8 (14.5%) | 0 (0.0%) |
| 7+ Person Households | 0 (0.0%) | 0 (0.0%) |
| Total | 46 (83.6%) | 9 (16.4%) |
Female Fertility in East Peru
Fertility by Age in East Peru
Average fertility rate in East Peru is 138.0 births per 1,000 women. Women in the age bracket of 20 to 34 years have the highest fertility rate with 258.0 births per 1,000 women. Women in the age bracket of 20 to 34 years acount for 100.0% of all women with births.
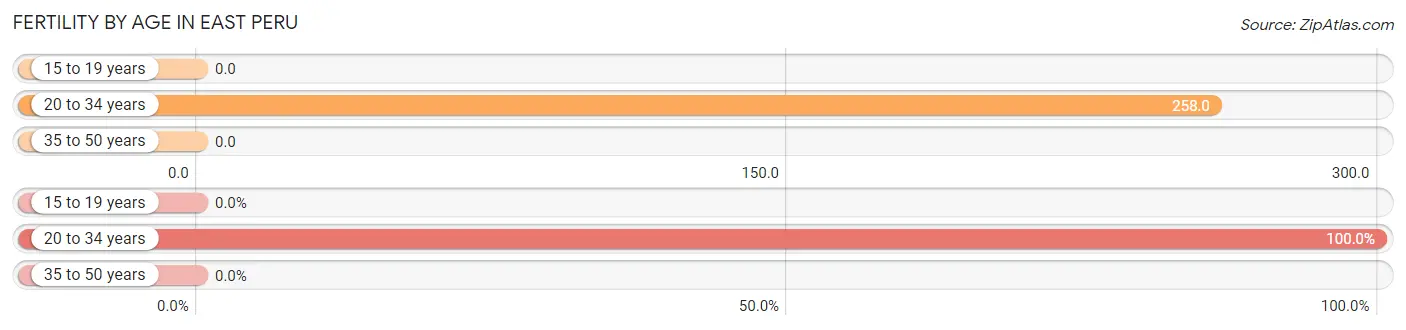
| Age Bracket | Women with Births | Births / 1,000 Women |
| 15 to 19 years | 0 (0.0%) | 0.0 |
| 20 to 34 years | 8 (100.0%) | 258.0 |
| 35 to 50 years | 0 (0.0%) | 0.0 |
| Total | 8 (100.0%) | 138.0 |
Fertility by Age by Marriage Status in East Peru
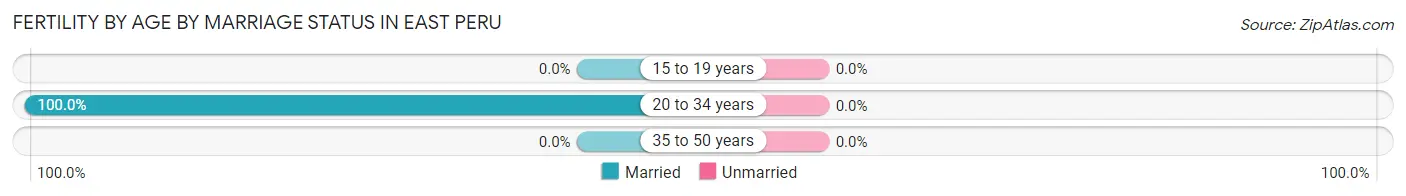
| Age Bracket | Married | Unmarried |
| 15 to 19 years | 0 (0.0%) | 0 (0.0%) |
| 20 to 34 years | 8 (100.0%) | 0 (0.0%) |
| 35 to 50 years | 0 (0.0%) | 0 (0.0%) |
| Total | 8 (100.0%) | 0 (0.0%) |
Fertility by Education in East Peru
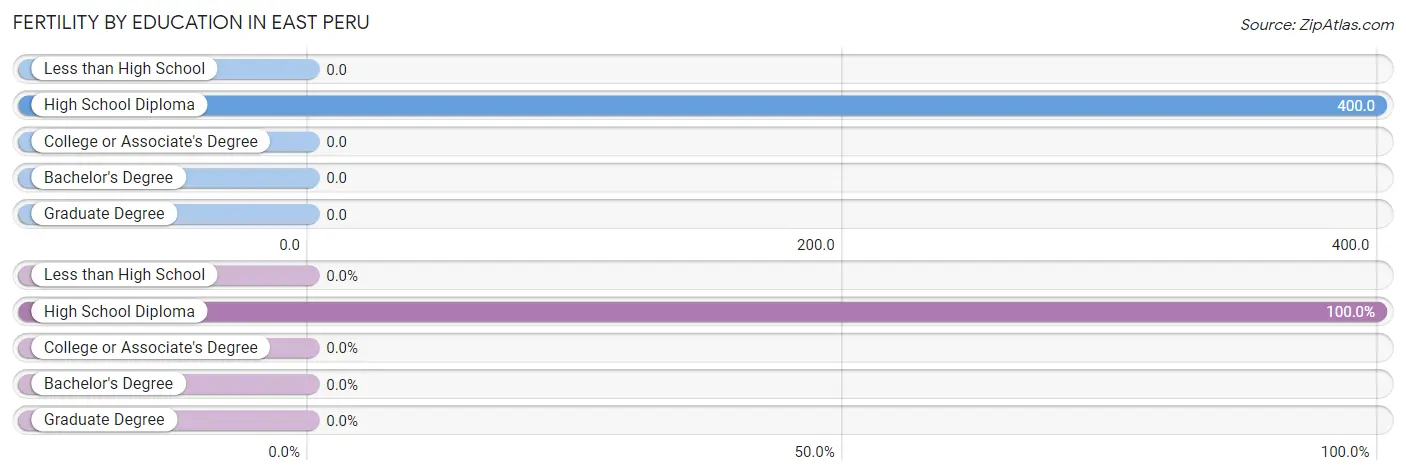
| Educational Attainment | Women with Births | Births / 1,000 Women |
| Less than High School | 0 (0.0%) | 0.0 |
| High School Diploma | 8 (100.0%) | 400.0 |
| College or Associate's Degree | 0 (0.0%) | 0.0 |
| Bachelor's Degree | 0 (0.0%) | 0.0 |
| Graduate Degree | 0 (0.0%) | 0.0 |
| Total | 8 (100.0%) | 138.0 |
Fertility by Education by Marriage Status in East Peru
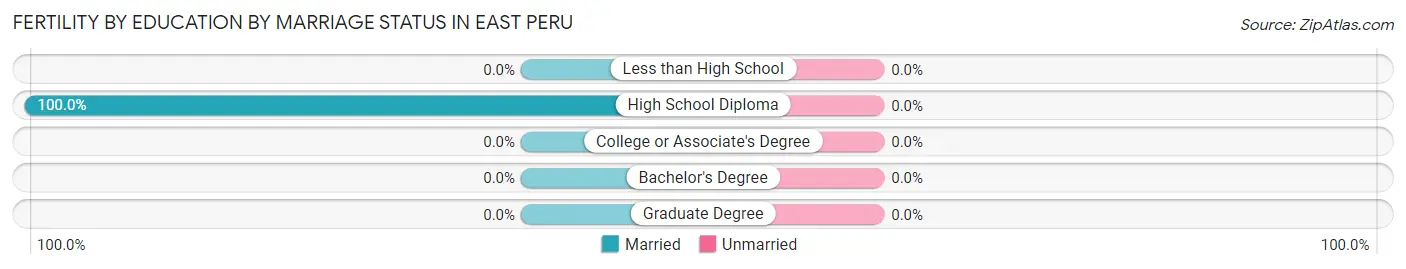
| Educational Attainment | Married | Unmarried |
| Less than High School | 0 (0.0%) | 0 (0.0%) |
| High School Diploma | 8 (100.0%) | 0 (0.0%) |
| College or Associate's Degree | 0 (0.0%) | 0 (0.0%) |
| Bachelor's Degree | 0 (0.0%) | 0 (0.0%) |
| Graduate Degree | 0 (0.0%) | 0 (0.0%) |
| Total | 8 (100.0%) | 0 (0.0%) |
Employment Characteristics in East Peru
Employment by Class of Employer in East Peru
Among the 89 employed individuals in East Peru, private company employees (64 | 71.9%), local government employees (10 | 11.2%), and self-employed (incorporated) (6 | 6.7%) make up the most common classes of employment.
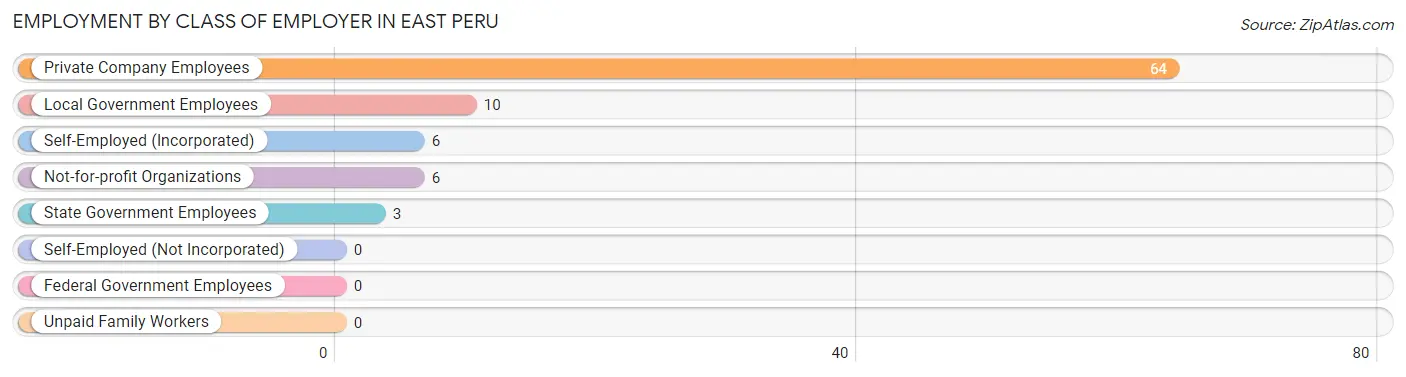
| Employer Class | # Employees | % Employees |
| Private Company Employees | 64 | 71.9% |
| Self-Employed (Incorporated) | 6 | 6.7% |
| Self-Employed (Not Incorporated) | 0 | 0.0% |
| Not-for-profit Organizations | 6 | 6.7% |
| Local Government Employees | 10 | 11.2% |
| State Government Employees | 3 | 3.4% |
| Federal Government Employees | 0 | 0.0% |
| Unpaid Family Workers | 0 | 0.0% |
| Total | 89 | 100.0% |
Employment Status by Age in East Peru
According to the labor force statistics for East Peru, out of the total population over 16 years of age (129), 70.5% or 91 individuals are in the labor force, with 2.2% or 2 of them unemployed. The age group with the highest labor force participation rate is 30 to 34 years, with 100.0% or 8 individuals in the labor force. Within the labor force, the 20 to 24 years age range has the highest percentage of unemployed individuals, with 22.2% or 2 of them being unemployed.
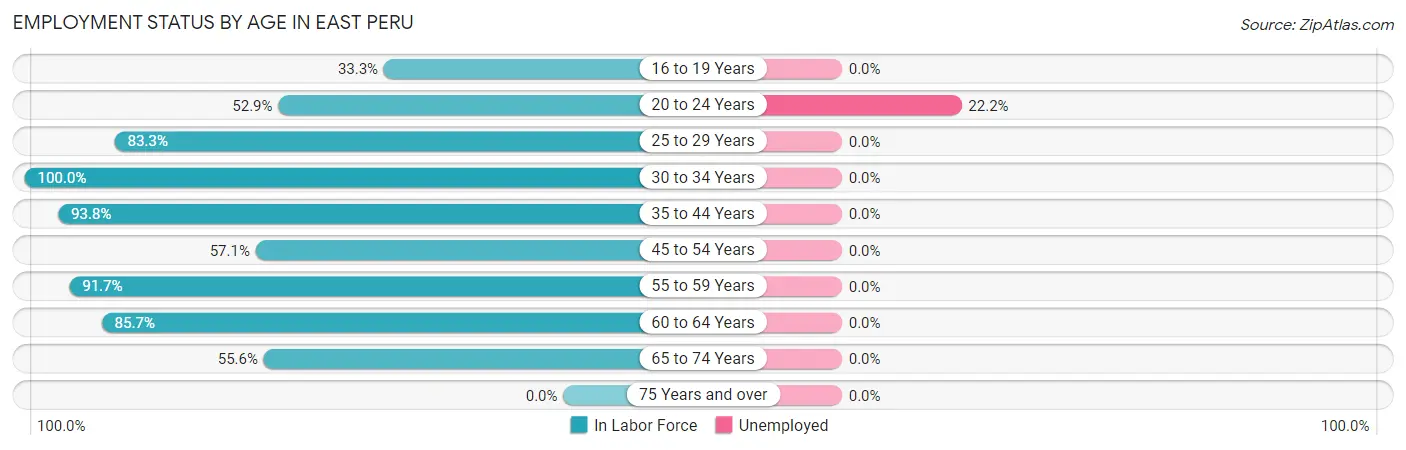
| Age Bracket | In Labor Force | Unemployed |
| 16 to 19 Years | 4 (33.3%) | 0 (0.0%) |
| 20 to 24 Years | 9 (52.9%) | 2 (22.2%) |
| 25 to 29 Years | 10 (83.3%) | 0 (0.0%) |
| 30 to 34 Years | 8 (100.0%) | 0 (0.0%) |
| 35 to 44 Years | 30 (93.8%) | 0 (0.0%) |
| 45 to 54 Years | 8 (57.1%) | 0 (0.0%) |
| 55 to 59 Years | 11 (91.7%) | 0 (0.0%) |
| 60 to 64 Years | 6 (85.7%) | 0 (0.0%) |
| 65 to 74 Years | 5 (55.6%) | 0 (0.0%) |
| 75 Years and over | 0 (0.0%) | 0 (0.0%) |
| Total | 91 (70.5%) | 2 (2.2%) |
Employment Status by Educational Attainment in East Peru
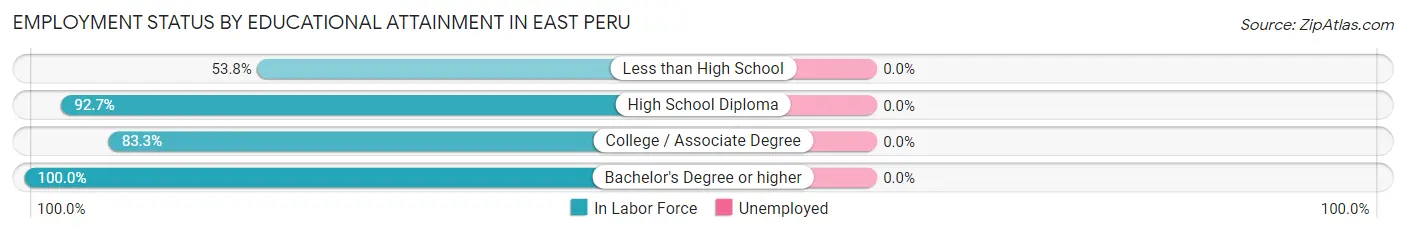
| Educational Attainment | In Labor Force | Unemployed |
| Less than High School | 7 (53.8%) | 0 (0.0%) |
| High School Diploma | 38 (92.7%) | 0 (0.0%) |
| College / Associate Degree | 15 (83.3%) | 0 (0.0%) |
| Bachelor's Degree or higher | 13 (100.0%) | 0 (0.0%) |
| Total | 73 (85.9%) | 0 (0.0%) |
Employment Occupations by Sex in East Peru
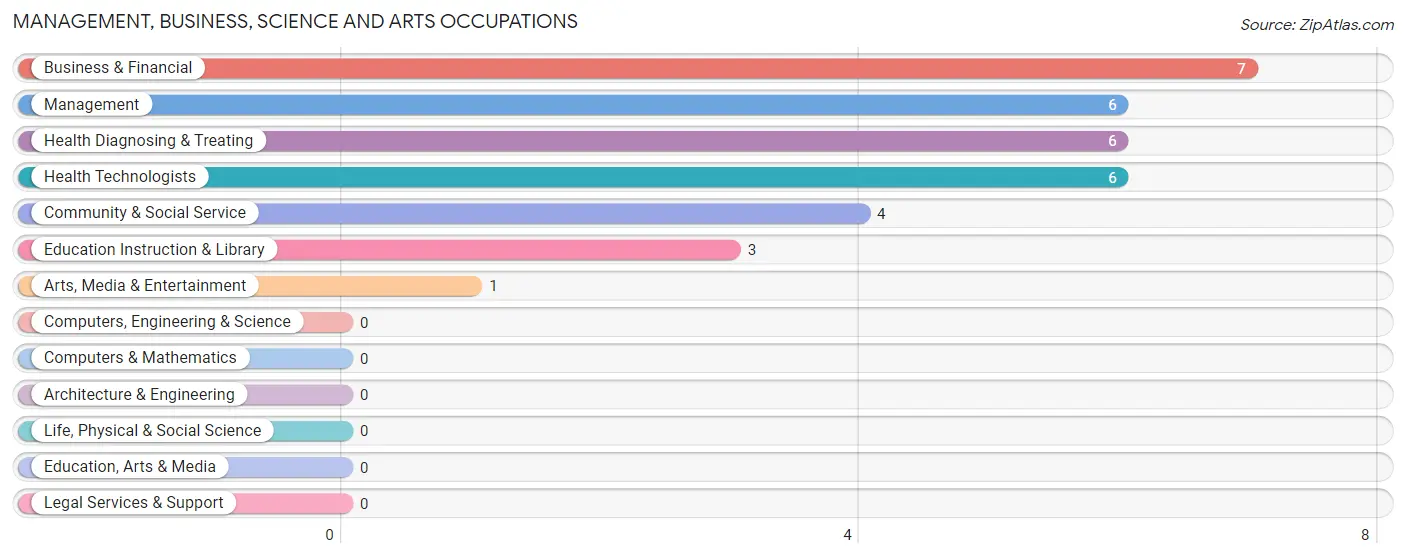
Management, Business, Science and Arts Occupations
The most common Management, Business, Science and Arts occupations in East Peru are Business & Financial (7 | 7.9%), Management (6 | 6.7%), Health Diagnosing & Treating (6 | 6.7%), Health Technologists (6 | 6.7%), and Community & Social Service (4 | 4.5%).
Management, Business, Science and Arts Occupations by Sex
Within the Management, Business, Science and Arts occupations in East Peru, the most male-oriented occupations are Management (33.3%), and Business & Financial (14.3%), while the most female-oriented occupations are Community & Social Service (100.0%), Education Instruction & Library (100.0%), and Arts, Media & Entertainment (100.0%).
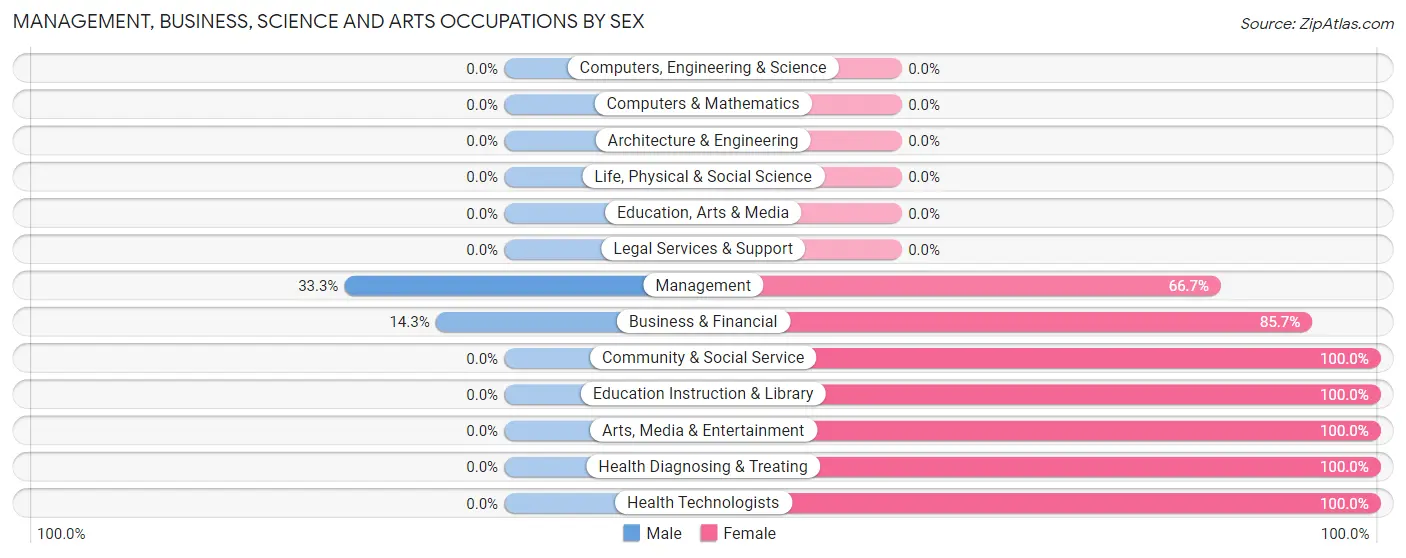
| Occupation | Male | Female |
| Management | 2 (33.3%) | 4 (66.7%) |
| Business & Financial | 1 (14.3%) | 6 (85.7%) |
| Computers, Engineering & Science | 0 (0.0%) | 0 (0.0%) |
| Computers & Mathematics | 0 (0.0%) | 0 (0.0%) |
| Architecture & Engineering | 0 (0.0%) | 0 (0.0%) |
| Life, Physical & Social Science | 0 (0.0%) | 0 (0.0%) |
| Community & Social Service | 0 (0.0%) | 4 (100.0%) |
| Education, Arts & Media | 0 (0.0%) | 0 (0.0%) |
| Legal Services & Support | 0 (0.0%) | 0 (0.0%) |
| Education Instruction & Library | 0 (0.0%) | 3 (100.0%) |
| Arts, Media & Entertainment | 0 (0.0%) | 1 (100.0%) |
| Health Diagnosing & Treating | 0 (0.0%) | 6 (100.0%) |
| Health Technologists | 0 (0.0%) | 6 (100.0%) |
| Total (Category) | 3 (13.0%) | 20 (87.0%) |
| Total (Overall) | 43 (48.3%) | 46 (51.7%) |
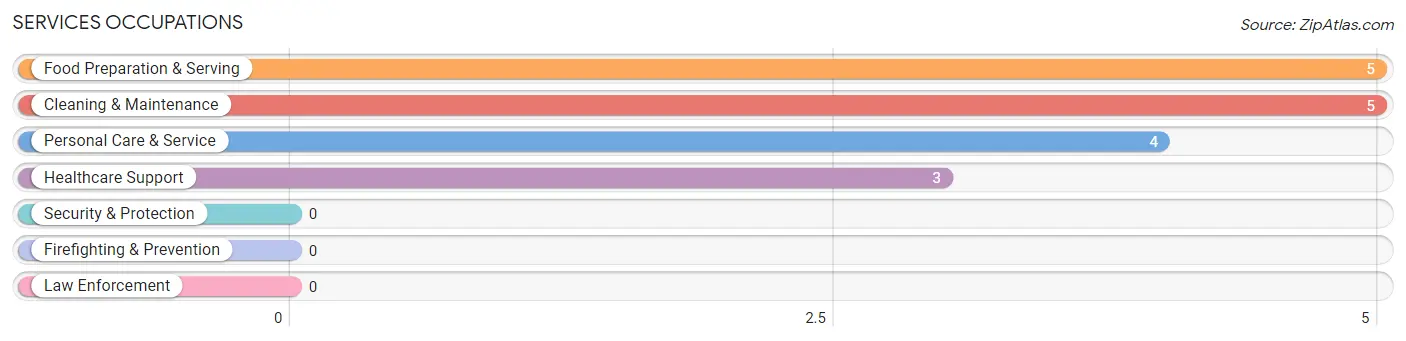
Services Occupations
The most common Services occupations in East Peru are Food Preparation & Serving (5 | 5.6%), Cleaning & Maintenance (5 | 5.6%), Personal Care & Service (4 | 4.5%), and Healthcare Support (3 | 3.4%).
Services Occupations by Sex
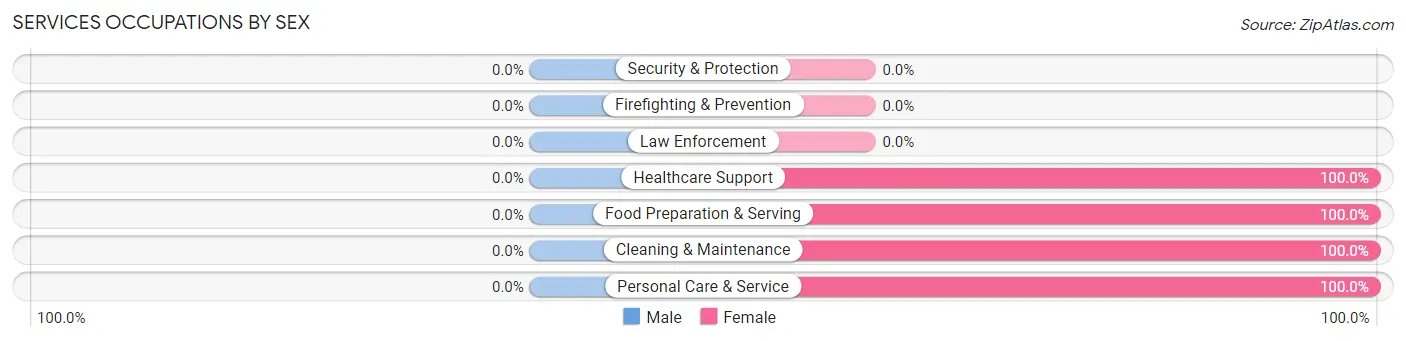
| Occupation | Male | Female |
| Healthcare Support | 0 (0.0%) | 3 (100.0%) |
| Security & Protection | 0 (0.0%) | 0 (0.0%) |
| Firefighting & Prevention | 0 (0.0%) | 0 (0.0%) |
| Law Enforcement | 0 (0.0%) | 0 (0.0%) |
| Food Preparation & Serving | 0 (0.0%) | 5 (100.0%) |
| Cleaning & Maintenance | 0 (0.0%) | 5 (100.0%) |
| Personal Care & Service | 0 (0.0%) | 4 (100.0%) |
| Total (Category) | 0 (0.0%) | 17 (100.0%) |
| Total (Overall) | 43 (48.3%) | 46 (51.7%) |
Sales and Office Occupations
The most common Sales and Office occupations in East Peru are Sales & Related (11 | 12.4%), and Office & Administration (3 | 3.4%).

Sales and Office Occupations by Sex

| Occupation | Male | Female |
| Sales & Related | 7 (63.6%) | 4 (36.4%) |
| Office & Administration | 1 (33.3%) | 2 (66.7%) |
| Total (Category) | 8 (57.1%) | 6 (42.9%) |
| Total (Overall) | 43 (48.3%) | 46 (51.7%) |
Natural Resources, Construction and Maintenance Occupations
The most common Natural Resources, Construction and Maintenance occupations in East Peru are Construction & Extraction (11 | 12.4%), and Installation, Maintenance & Repair (5 | 5.6%).

Natural Resources, Construction and Maintenance Occupations by Sex

| Occupation | Male | Female |
| Farming, Fishing & Forestry | 0 (0.0%) | 0 (0.0%) |
| Construction & Extraction | 10 (90.9%) | 1 (9.1%) |
| Installation, Maintenance & Repair | 5 (100.0%) | 0 (0.0%) |
| Total (Category) | 15 (93.8%) | 1 (6.2%) |
| Total (Overall) | 43 (48.3%) | 46 (51.7%) |
Production, Transportation and Moving Occupations
The most common Production, Transportation and Moving occupations in East Peru are Material Moving (10 | 11.2%), Transportation (7 | 7.9%), and Production (2 | 2.2%).
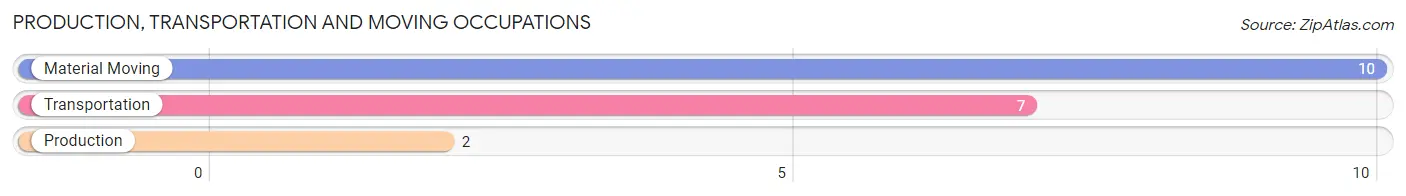
Production, Transportation and Moving Occupations by Sex
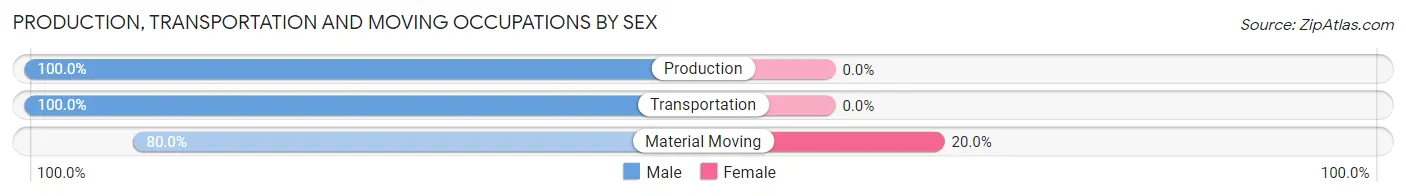
| Occupation | Male | Female |
| Production | 2 (100.0%) | 0 (0.0%) |
| Transportation | 7 (100.0%) | 0 (0.0%) |
| Material Moving | 8 (80.0%) | 2 (20.0%) |
| Total (Category) | 17 (89.5%) | 2 (10.5%) |
| Total (Overall) | 43 (48.3%) | 46 (51.7%) |
Employment Industries by Sex in East Peru
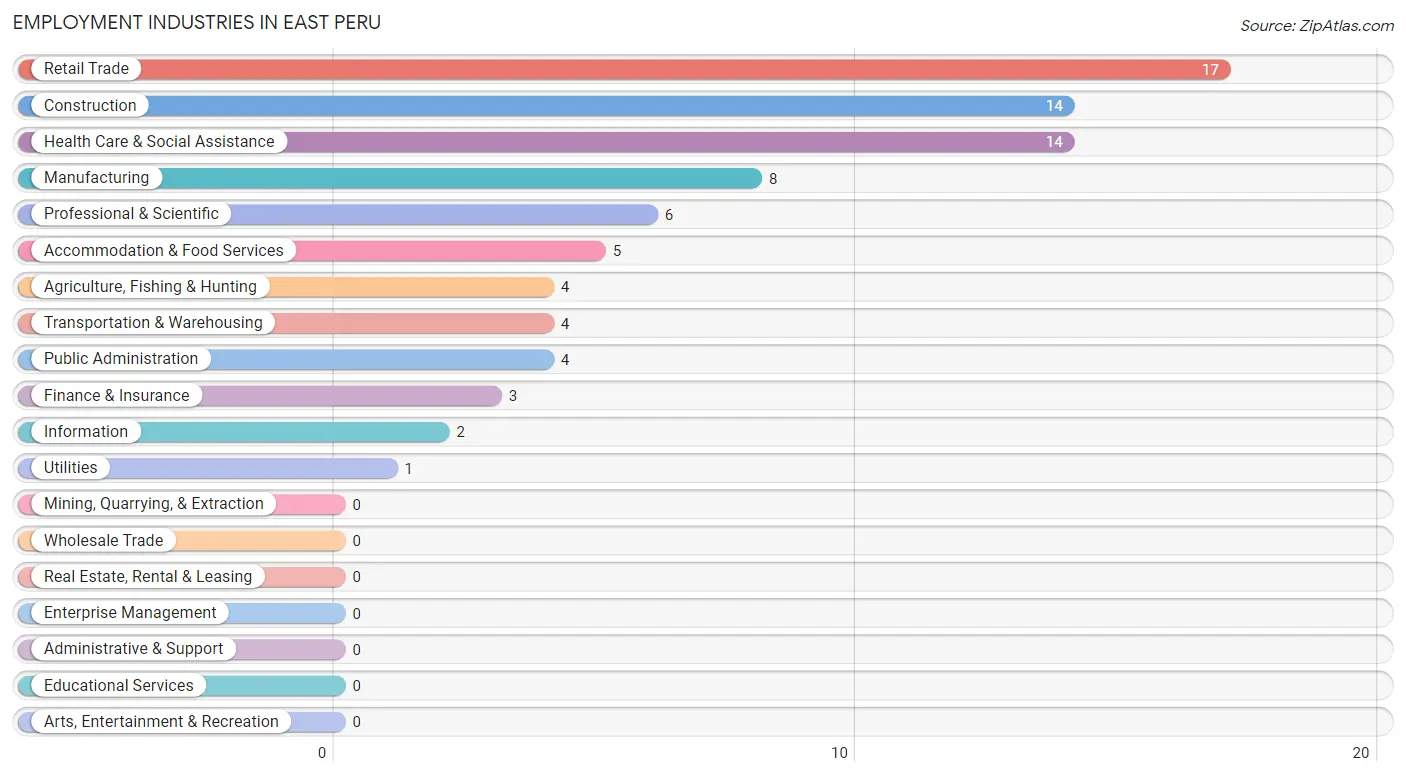
Employment Industries in East Peru
The major employment industries in East Peru include Retail Trade (17 | 19.1%), Construction (14 | 15.7%), Health Care & Social Assistance (14 | 15.7%), Manufacturing (8 | 9.0%), and Professional & Scientific (6 | 6.7%).
Employment Industries by Sex in East Peru
The East Peru industries that see more men than women are Manufacturing (100.0%), Utilities (100.0%), and Construction (92.9%), whereas the industries that tend to have a higher number of women are Information (100.0%), Professional & Scientific (100.0%), and Accommodation & Food Services (100.0%).
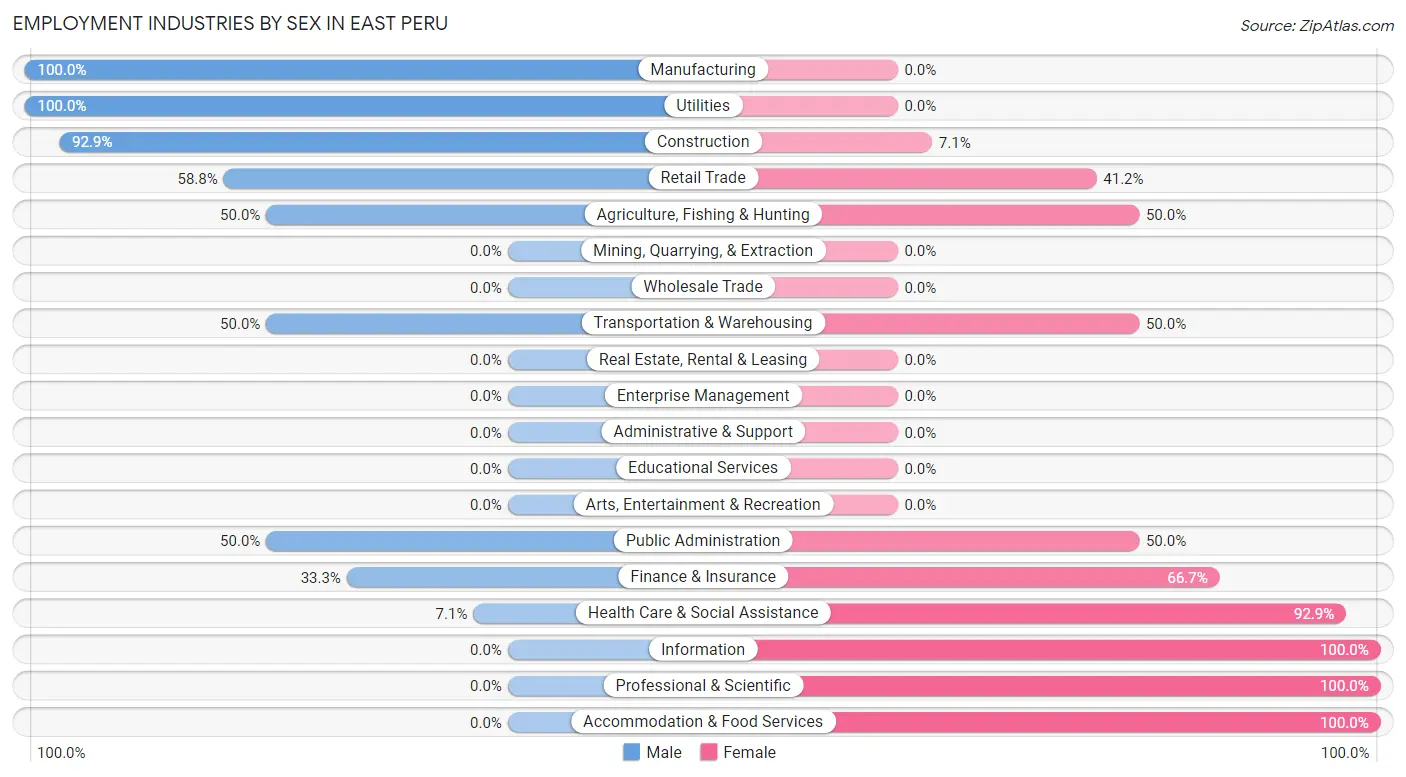
| Industry | Male | Female |
| Agriculture, Fishing & Hunting | 2 (50.0%) | 2 (50.0%) |
| Mining, Quarrying, & Extraction | 0 (0.0%) | 0 (0.0%) |
| Construction | 13 (92.9%) | 1 (7.1%) |
| Manufacturing | 8 (100.0%) | 0 (0.0%) |
| Wholesale Trade | 0 (0.0%) | 0 (0.0%) |
| Retail Trade | 10 (58.8%) | 7 (41.2%) |
| Transportation & Warehousing | 2 (50.0%) | 2 (50.0%) |
| Utilities | 1 (100.0%) | 0 (0.0%) |
| Information | 0 (0.0%) | 2 (100.0%) |
| Finance & Insurance | 1 (33.3%) | 2 (66.7%) |
| Real Estate, Rental & Leasing | 0 (0.0%) | 0 (0.0%) |
| Professional & Scientific | 0 (0.0%) | 6 (100.0%) |
| Enterprise Management | 0 (0.0%) | 0 (0.0%) |
| Administrative & Support | 0 (0.0%) | 0 (0.0%) |
| Educational Services | 0 (0.0%) | 0 (0.0%) |
| Health Care & Social Assistance | 1 (7.1%) | 13 (92.9%) |
| Arts, Entertainment & Recreation | 0 (0.0%) | 0 (0.0%) |
| Accommodation & Food Services | 0 (0.0%) | 5 (100.0%) |
| Public Administration | 2 (50.0%) | 2 (50.0%) |
| Total | 43 (48.3%) | 46 (51.7%) |
Education in East Peru
School Enrollment in East Peru
The most common levels of schooling among the 51 students in East Peru are middle school (12 | 23.5%), high school (11 | 21.6%), and elementary school (9 | 17.6%).
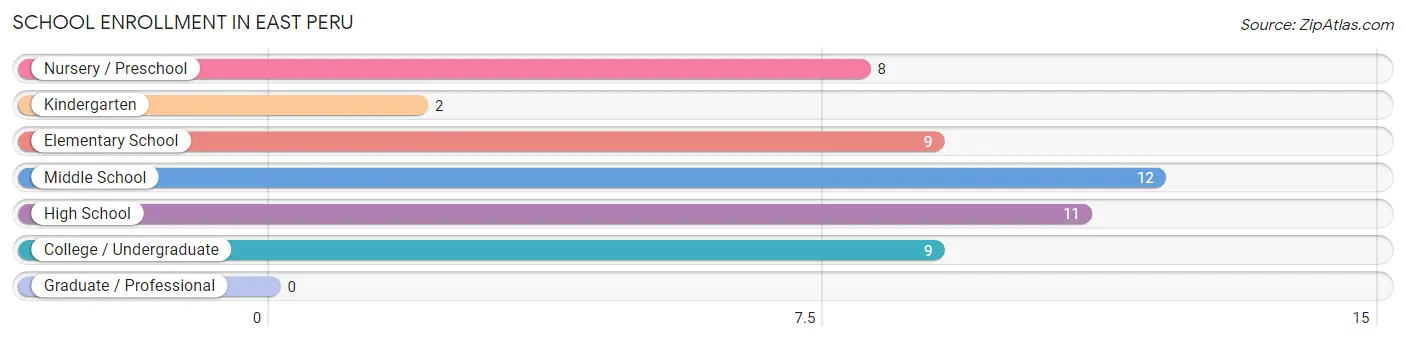
| School Level | # Students | % Students |
| Nursery / Preschool | 8 | 15.7% |
| Kindergarten | 2 | 3.9% |
| Elementary School | 9 | 17.6% |
| Middle School | 12 | 23.5% |
| High School | 11 | 21.6% |
| College / Undergraduate | 9 | 17.6% |
| Graduate / Professional | 0 | 0.0% |
| Total | 51 | 100.0% |
School Enrollment by Age by Funding Source in East Peru
Out of a total of 51 students who are enrolled in schools in East Peru, 17 (33.3%) attend a private institution, while the remaining 34 (66.7%) are enrolled in public schools. The age group of 18 to 19 year olds has the highest likelihood of being enrolled in private schools, with 6 (100.0% in the age bracket) enrolled. Conversely, the age group of 3 to 4 year olds has the lowest likelihood of being enrolled in a private school, with 6 (100.0% in the age bracket) attending a public institution.
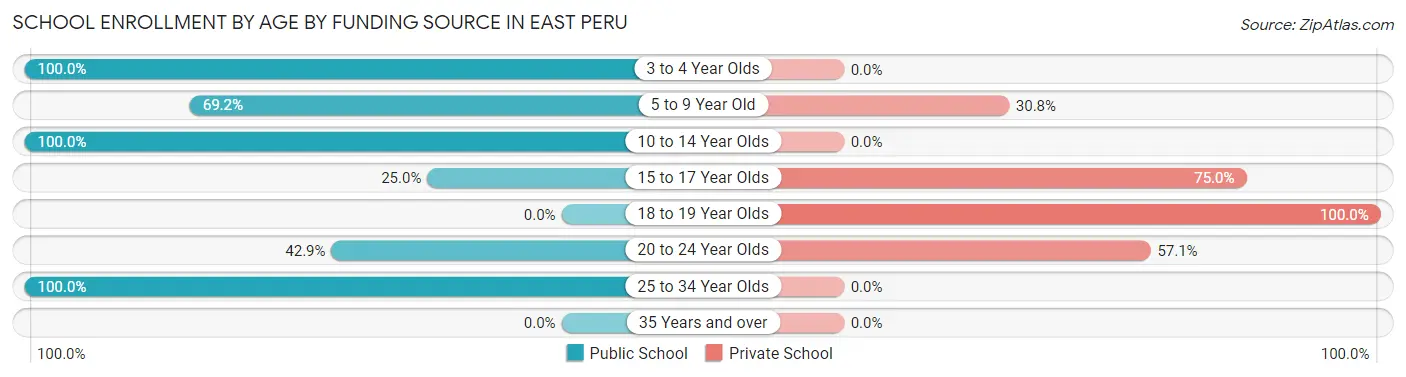
| Age Bracket | Public School | Private School |
| 3 to 4 Year Olds | 6 (100.0%) | 0 (0.0%) |
| 5 to 9 Year Old | 9 (69.2%) | 4 (30.8%) |
| 10 to 14 Year Olds | 13 (100.0%) | 0 (0.0%) |
| 15 to 17 Year Olds | 1 (25.0%) | 3 (75.0%) |
| 18 to 19 Year Olds | 0 (0.0%) | 6 (100.0%) |
| 20 to 24 Year Olds | 3 (42.9%) | 4 (57.1%) |
| 25 to 34 Year Olds | 2 (100.0%) | 0 (0.0%) |
| 35 Years and over | 0 (0.0%) | 0 (0.0%) |
| Total | 34 (66.7%) | 17 (33.3%) |
Educational Attainment by Field of Study in East Peru
Bio, nature & agricultural (4 | 26.7%), business (4 | 26.7%), communications (3 | 20.0%), science & technology (2 | 13.3%), and education (2 | 13.3%) are the most common fields of study among 15 individuals in East Peru who have obtained a bachelor's degree or higher.
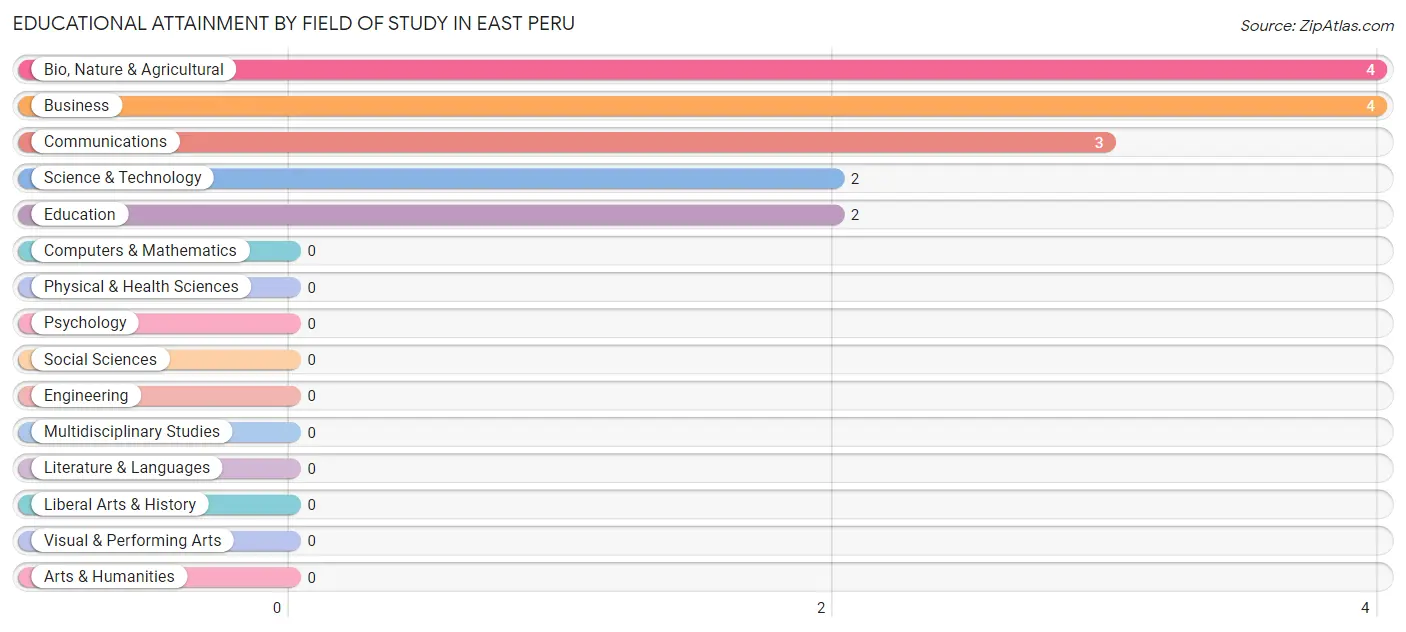
| Field of Study | # Graduates | % Graduates |
| Computers & Mathematics | 0 | 0.0% |
| Bio, Nature & Agricultural | 4 | 26.7% |
| Physical & Health Sciences | 0 | 0.0% |
| Psychology | 0 | 0.0% |
| Social Sciences | 0 | 0.0% |
| Engineering | 0 | 0.0% |
| Multidisciplinary Studies | 0 | 0.0% |
| Science & Technology | 2 | 13.3% |
| Business | 4 | 26.7% |
| Education | 2 | 13.3% |
| Literature & Languages | 0 | 0.0% |
| Liberal Arts & History | 0 | 0.0% |
| Visual & Performing Arts | 0 | 0.0% |
| Communications | 3 | 20.0% |
| Arts & Humanities | 0 | 0.0% |
| Total | 15 | 100.0% |
Transportation & Commute in East Peru
Vehicle Availability by Sex in East Peru
The most prevalent vehicle ownership categories in East Peru are males with 2 vehicles (21, accounting for 48.8%) and females with 2 vehicles (20, making up 45.7%).
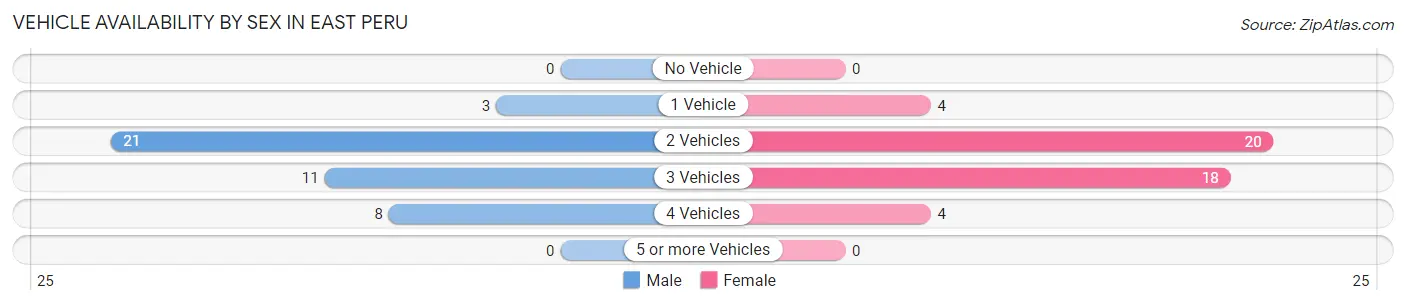
| Vehicles Available | Male | Female |
| No Vehicle | 0 (0.0%) | 0 (0.0%) |
| 1 Vehicle | 3 (7.0%) | 4 (8.7%) |
| 2 Vehicles | 21 (48.8%) | 20 (43.5%) |
| 3 Vehicles | 11 (25.6%) | 18 (39.1%) |
| 4 Vehicles | 8 (18.6%) | 4 (8.7%) |
| 5 or more Vehicles | 0 (0.0%) | 0 (0.0%) |
| Total | 43 (100.0%) | 46 (100.0%) |
Commute Time in East Peru
The most frequently occuring commute durations in East Peru are 15 to 19 minutes (37 commuters, 47.4%), 20 to 24 minutes (13 commuters, 16.7%), and 30 to 34 minutes (9 commuters, 11.5%).
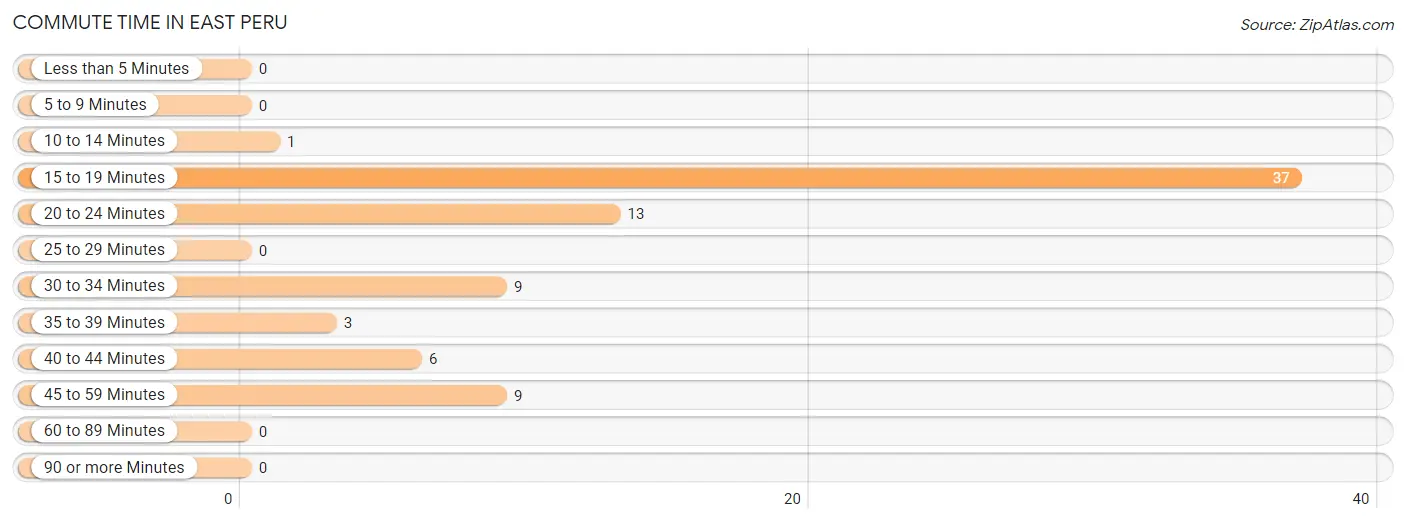
| Commute Time | # Commuters | % Commuters |
| Less than 5 Minutes | 0 | 0.0% |
| 5 to 9 Minutes | 0 | 0.0% |
| 10 to 14 Minutes | 1 | 1.3% |
| 15 to 19 Minutes | 37 | 47.4% |
| 20 to 24 Minutes | 13 | 16.7% |
| 25 to 29 Minutes | 0 | 0.0% |
| 30 to 34 Minutes | 9 | 11.5% |
| 35 to 39 Minutes | 3 | 3.8% |
| 40 to 44 Minutes | 6 | 7.7% |
| 45 to 59 Minutes | 9 | 11.5% |
| 60 to 89 Minutes | 0 | 0.0% |
| 90 or more Minutes | 0 | 0.0% |
Commute Time by Sex in East Peru
The most common commute times in East Peru are 15 to 19 minutes (17 commuters, 48.6%) for males and 15 to 19 minutes (20 commuters, 46.5%) for females.
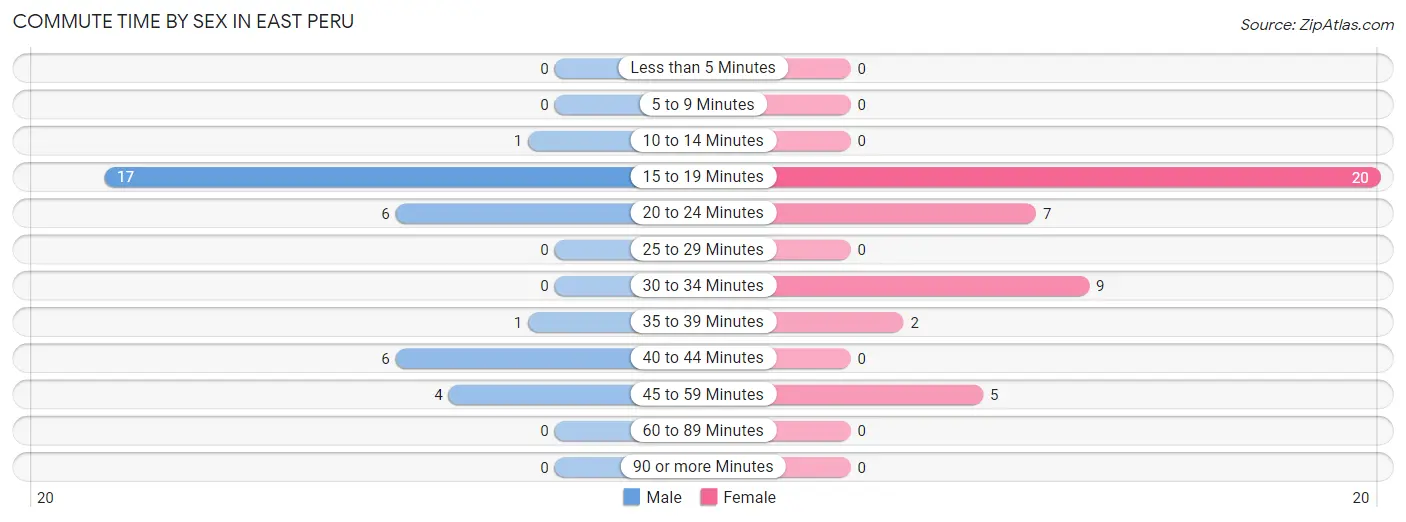
| Commute Time | Male | Female |
| Less than 5 Minutes | 0 (0.0%) | 0 (0.0%) |
| 5 to 9 Minutes | 0 (0.0%) | 0 (0.0%) |
| 10 to 14 Minutes | 1 (2.9%) | 0 (0.0%) |
| 15 to 19 Minutes | 17 (48.6%) | 20 (46.5%) |
| 20 to 24 Minutes | 6 (17.1%) | 7 (16.3%) |
| 25 to 29 Minutes | 0 (0.0%) | 0 (0.0%) |
| 30 to 34 Minutes | 0 (0.0%) | 9 (20.9%) |
| 35 to 39 Minutes | 1 (2.9%) | 2 (4.6%) |
| 40 to 44 Minutes | 6 (17.1%) | 0 (0.0%) |
| 45 to 59 Minutes | 4 (11.4%) | 5 (11.6%) |
| 60 to 89 Minutes | 0 (0.0%) | 0 (0.0%) |
| 90 or more Minutes | 0 (0.0%) | 0 (0.0%) |
Time of Departure to Work by Sex in East Peru
The most frequent times of departure to work in East Peru are 7:00 AM to 7:29 AM (19, 54.3%) for males and 7:00 AM to 7:29 AM (10, 23.3%) for females.
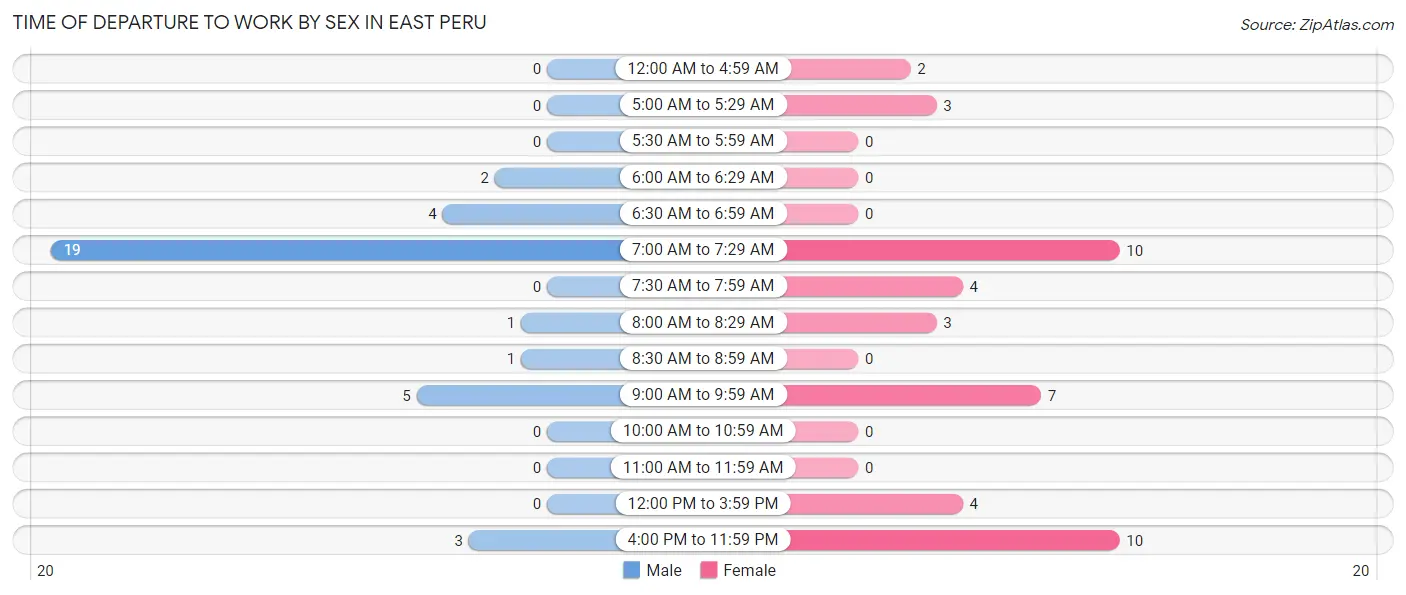
| Time of Departure | Male | Female |
| 12:00 AM to 4:59 AM | 0 (0.0%) | 2 (4.6%) |
| 5:00 AM to 5:29 AM | 0 (0.0%) | 3 (7.0%) |
| 5:30 AM to 5:59 AM | 0 (0.0%) | 0 (0.0%) |
| 6:00 AM to 6:29 AM | 2 (5.7%) | 0 (0.0%) |
| 6:30 AM to 6:59 AM | 4 (11.4%) | 0 (0.0%) |
| 7:00 AM to 7:29 AM | 19 (54.3%) | 10 (23.3%) |
| 7:30 AM to 7:59 AM | 0 (0.0%) | 4 (9.3%) |
| 8:00 AM to 8:29 AM | 1 (2.9%) | 3 (7.0%) |
| 8:30 AM to 8:59 AM | 1 (2.9%) | 0 (0.0%) |
| 9:00 AM to 9:59 AM | 5 (14.3%) | 7 (16.3%) |
| 10:00 AM to 10:59 AM | 0 (0.0%) | 0 (0.0%) |
| 11:00 AM to 11:59 AM | 0 (0.0%) | 0 (0.0%) |
| 12:00 PM to 3:59 PM | 0 (0.0%) | 4 (9.3%) |
| 4:00 PM to 11:59 PM | 3 (8.6%) | 10 (23.3%) |
| Total | 35 (100.0%) | 43 (100.0%) |
Housing Occupancy in East Peru
Occupancy by Ownership in East Peru
Of the total 55 dwellings in East Peru, owner-occupied units account for 46 (83.6%), while renter-occupied units make up 9 (16.4%).
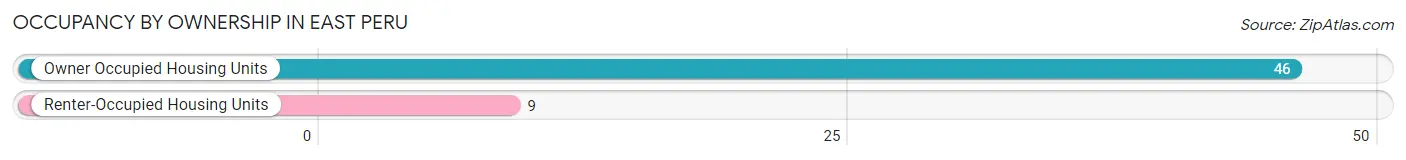
| Occupancy | # Housing Units | % Housing Units |
| Owner Occupied Housing Units | 46 | 83.6% |
| Renter-Occupied Housing Units | 9 | 16.4% |
| Total Occupied Housing Units | 55 | 100.0% |
Occupancy by Household Size in East Peru
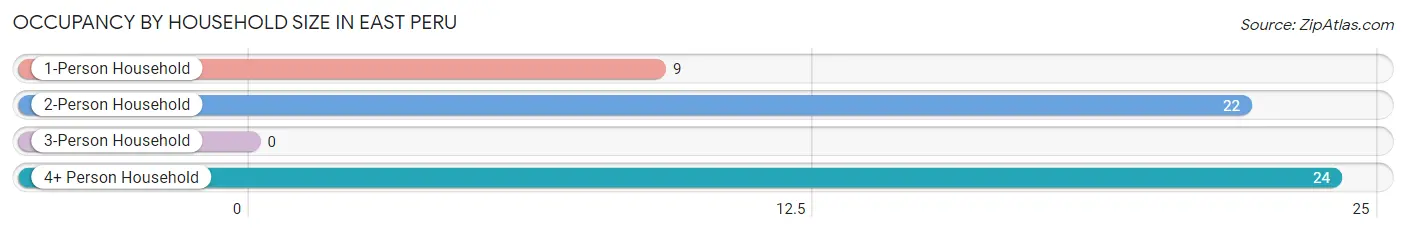
| Household Size | # Housing Units | % Housing Units |
| 1-Person Household | 9 | 16.4% |
| 2-Person Household | 22 | 40.0% |
| 3-Person Household | 0 | 0.0% |
| 4+ Person Household | 24 | 43.6% |
| Total Housing Units | 55 | 100.0% |
Occupancy by Ownership by Household Size in East Peru
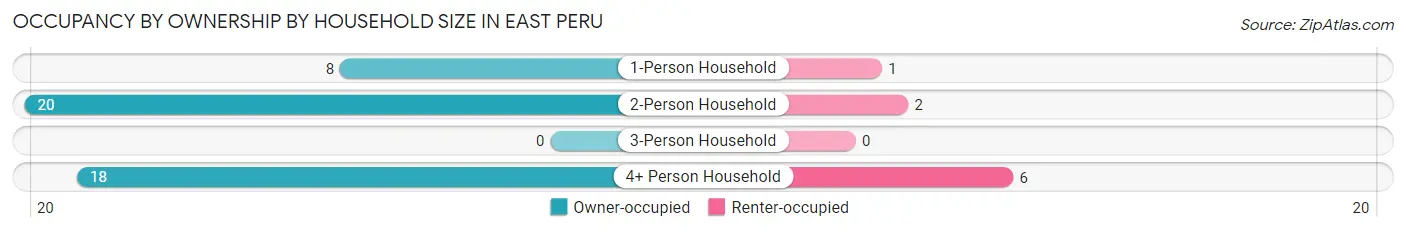
| Household Size | Owner-occupied | Renter-occupied |
| 1-Person Household | 8 (88.9%) | 1 (11.1%) |
| 2-Person Household | 20 (90.9%) | 2 (9.1%) |
| 3-Person Household | 0 (0.0%) | 0 (0.0%) |
| 4+ Person Household | 18 (75.0%) | 6 (25.0%) |
| Total Housing Units | 46 (83.6%) | 9 (16.4%) |
Occupancy by Educational Attainment in East Peru
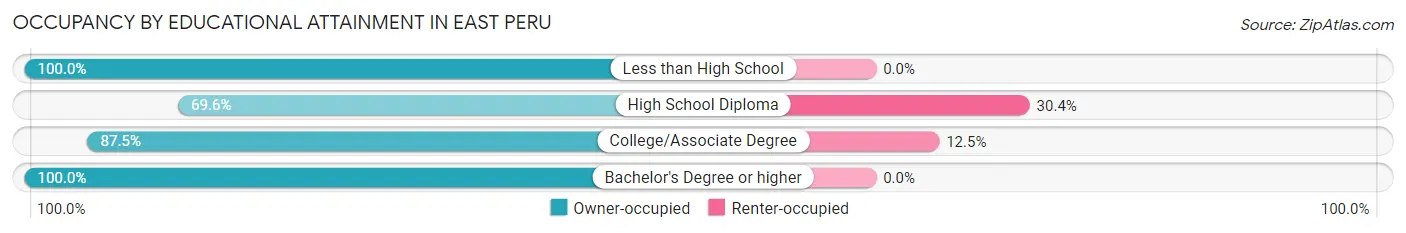
| Household Size | Owner-occupied | Renter-occupied |
| Less than High School | 5 (100.0%) | 0 (0.0%) |
| High School Diploma | 16 (69.6%) | 7 (30.4%) |
| College/Associate Degree | 14 (87.5%) | 2 (12.5%) |
| Bachelor's Degree or higher | 11 (100.0%) | 0 (0.0%) |
Occupancy by Age of Householder in East Peru
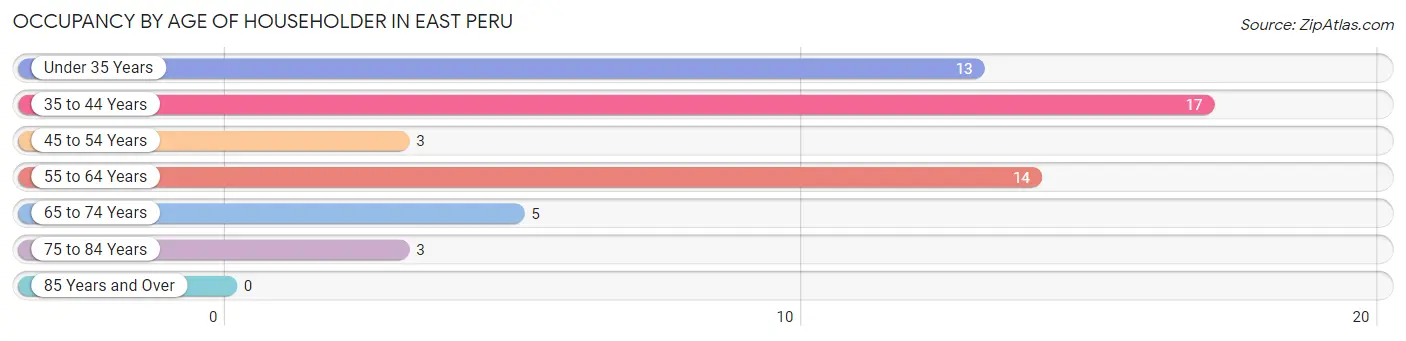
| Age Bracket | # Households | % Households |
| Under 35 Years | 13 | 23.6% |
| 35 to 44 Years | 17 | 30.9% |
| 45 to 54 Years | 3 | 5.4% |
| 55 to 64 Years | 14 | 25.5% |
| 65 to 74 Years | 5 | 9.1% |
| 75 to 84 Years | 3 | 5.4% |
| 85 Years and Over | 0 | 0.0% |
| Total | 55 | 100.0% |
Housing Finances in East Peru
Median Income by Occupancy in East Peru
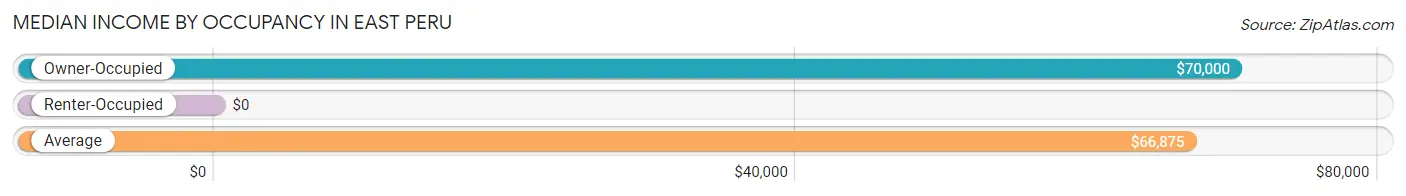
| Occupancy Type | # Households | Median Income |
| Owner-Occupied | 46 (83.6%) | $70,000 |
| Renter-Occupied | 9 (16.4%) | $0 |
| Average | 55 (100.0%) | $66,875 |
Occupancy by Householder Income Bracket in East Peru
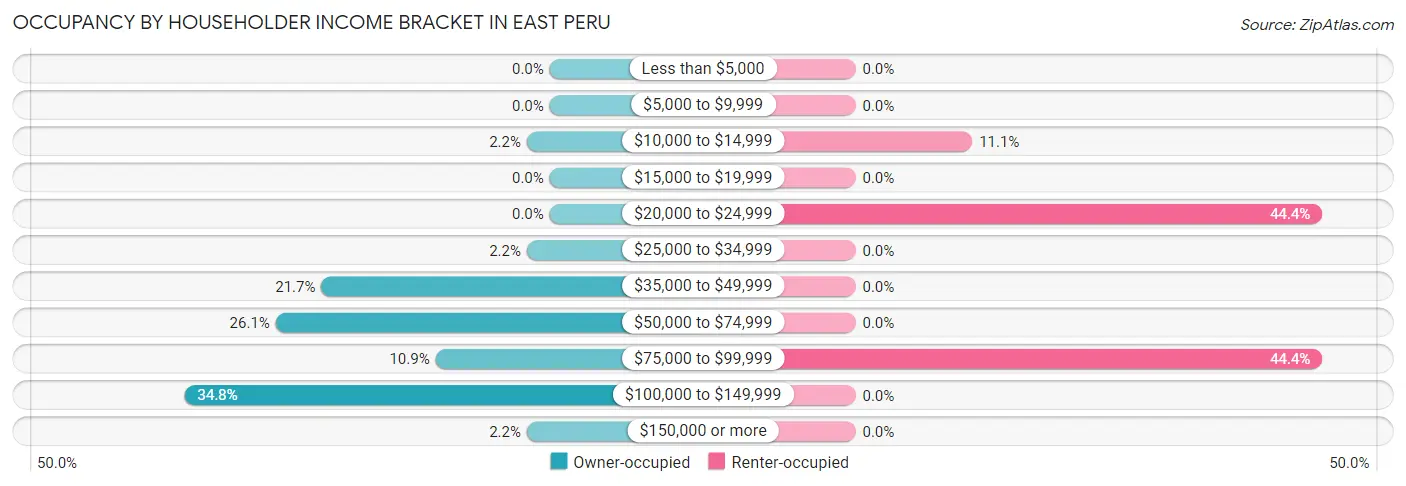
| Income Bracket | Owner-occupied | Renter-occupied |
| Less than $5,000 | 0 (0.0%) | 0 (0.0%) |
| $5,000 to $9,999 | 0 (0.0%) | 0 (0.0%) |
| $10,000 to $14,999 | 1 (2.2%) | 1 (11.1%) |
| $15,000 to $19,999 | 0 (0.0%) | 0 (0.0%) |
| $20,000 to $24,999 | 0 (0.0%) | 4 (44.4%) |
| $25,000 to $34,999 | 1 (2.2%) | 0 (0.0%) |
| $35,000 to $49,999 | 10 (21.7%) | 0 (0.0%) |
| $50,000 to $74,999 | 12 (26.1%) | 0 (0.0%) |
| $75,000 to $99,999 | 5 (10.9%) | 4 (44.4%) |
| $100,000 to $149,999 | 16 (34.8%) | 0 (0.0%) |
| $150,000 or more | 1 (2.2%) | 0 (0.0%) |
| Total | 46 (100.0%) | 9 (100.0%) |
Monthly Housing Cost Tiers in East Peru
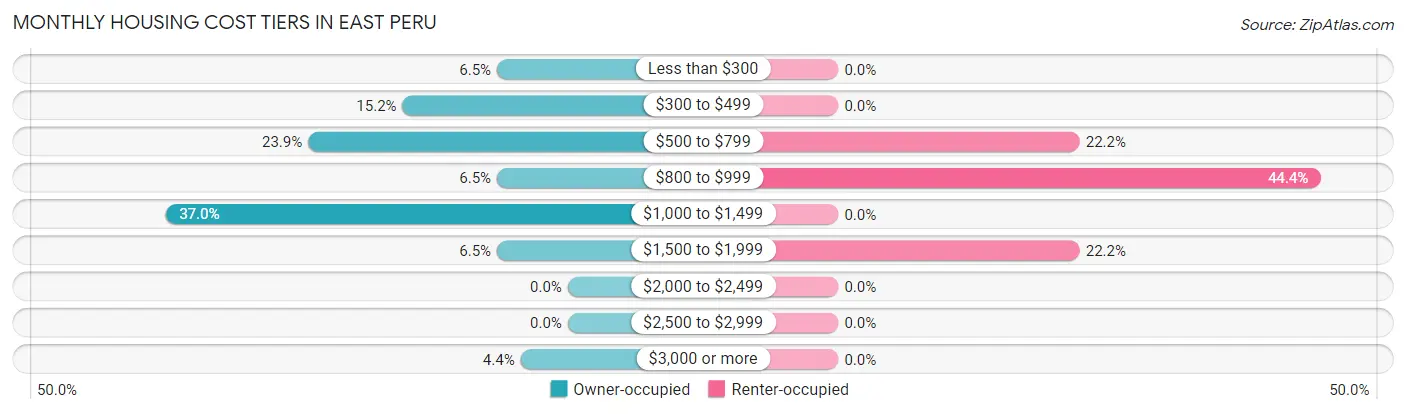
| Monthly Cost | Owner-occupied | Renter-occupied |
| Less than $300 | 3 (6.5%) | 0 (0.0%) |
| $300 to $499 | 7 (15.2%) | 0 (0.0%) |
| $500 to $799 | 11 (23.9%) | 2 (22.2%) |
| $800 to $999 | 3 (6.5%) | 4 (44.4%) |
| $1,000 to $1,499 | 17 (37.0%) | 0 (0.0%) |
| $1,500 to $1,999 | 3 (6.5%) | 2 (22.2%) |
| $2,000 to $2,499 | 0 (0.0%) | 0 (0.0%) |
| $2,500 to $2,999 | 0 (0.0%) | 0 (0.0%) |
| $3,000 or more | 2 (4.3%) | 0 (0.0%) |
| Total | 46 (100.0%) | 9 (100.0%) |
Physical Housing Characteristics in East Peru
Housing Structures in East Peru
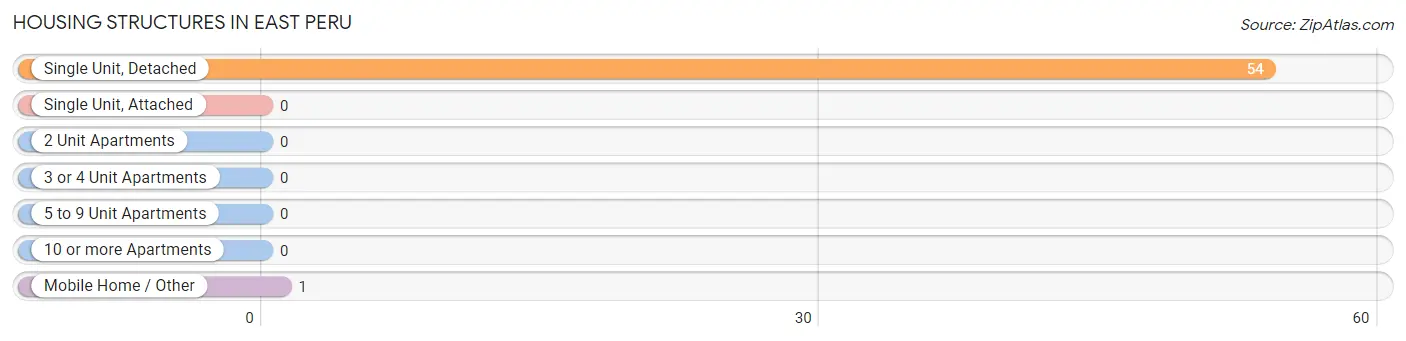
| Structure Type | # Housing Units | % Housing Units |
| Single Unit, Detached | 54 | 98.2% |
| Single Unit, Attached | 0 | 0.0% |
| 2 Unit Apartments | 0 | 0.0% |
| 3 or 4 Unit Apartments | 0 | 0.0% |
| 5 to 9 Unit Apartments | 0 | 0.0% |
| 10 or more Apartments | 0 | 0.0% |
| Mobile Home / Other | 1 | 1.8% |
| Total | 55 | 100.0% |
Housing Structures by Occupancy in East Peru
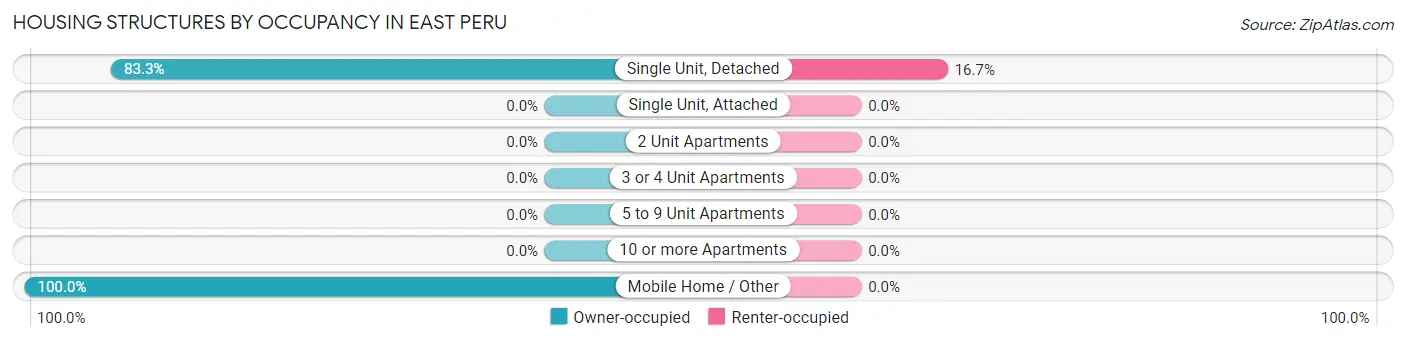
| Structure Type | Owner-occupied | Renter-occupied |
| Single Unit, Detached | 45 (83.3%) | 9 (16.7%) |
| Single Unit, Attached | 0 (0.0%) | 0 (0.0%) |
| 2 Unit Apartments | 0 (0.0%) | 0 (0.0%) |
| 3 or 4 Unit Apartments | 0 (0.0%) | 0 (0.0%) |
| 5 to 9 Unit Apartments | 0 (0.0%) | 0 (0.0%) |
| 10 or more Apartments | 0 (0.0%) | 0 (0.0%) |
| Mobile Home / Other | 1 (100.0%) | 0 (0.0%) |
| Total | 46 (83.6%) | 9 (16.4%) |
Housing Structures by Number of Rooms in East Peru
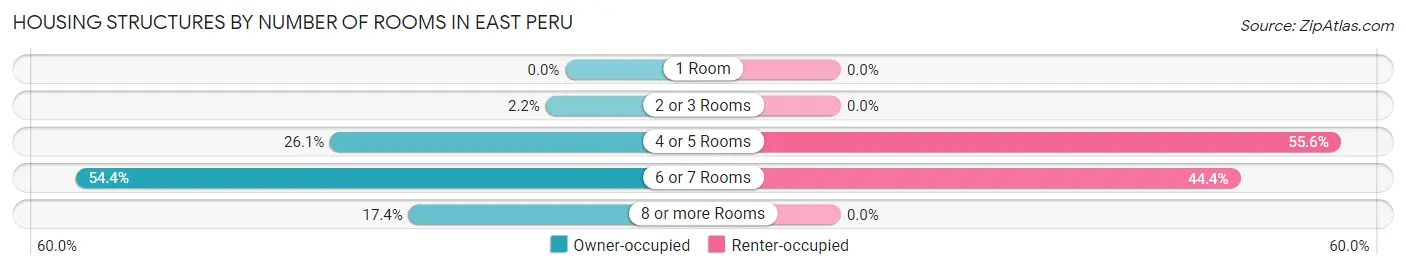
| Number of Rooms | Owner-occupied | Renter-occupied |
| 1 Room | 0 (0.0%) | 0 (0.0%) |
| 2 or 3 Rooms | 1 (2.2%) | 0 (0.0%) |
| 4 or 5 Rooms | 12 (26.1%) | 5 (55.6%) |
| 6 or 7 Rooms | 25 (54.3%) | 4 (44.4%) |
| 8 or more Rooms | 8 (17.4%) | 0 (0.0%) |
| Total | 46 (100.0%) | 9 (100.0%) |
Housing Structure by Heating Type in East Peru
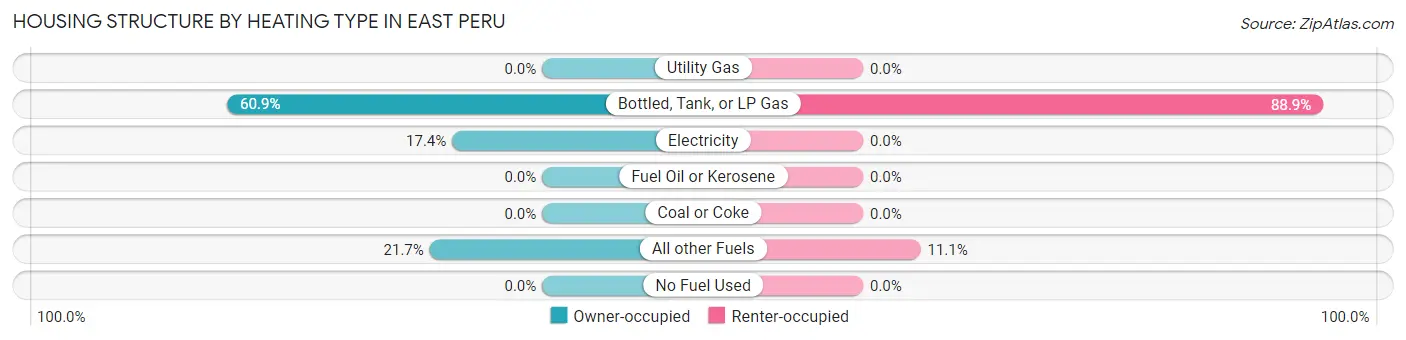
| Heating Type | Owner-occupied | Renter-occupied |
| Utility Gas | 0 (0.0%) | 0 (0.0%) |
| Bottled, Tank, or LP Gas | 28 (60.9%) | 8 (88.9%) |
| Electricity | 8 (17.4%) | 0 (0.0%) |
| Fuel Oil or Kerosene | 0 (0.0%) | 0 (0.0%) |
| Coal or Coke | 0 (0.0%) | 0 (0.0%) |
| All other Fuels | 10 (21.7%) | 1 (11.1%) |
| No Fuel Used | 0 (0.0%) | 0 (0.0%) |
| Total | 46 (100.0%) | 9 (100.0%) |
Household Vehicle Usage in East Peru
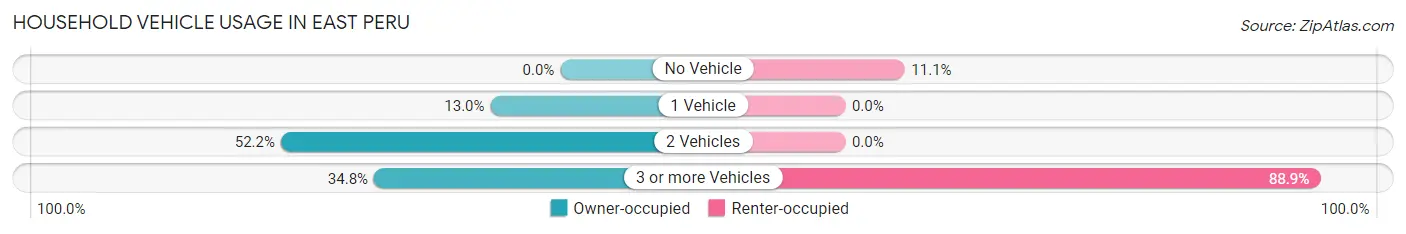
| Vehicles per Household | Owner-occupied | Renter-occupied |
| No Vehicle | 0 (0.0%) | 1 (11.1%) |
| 1 Vehicle | 6 (13.0%) | 0 (0.0%) |
| 2 Vehicles | 24 (52.2%) | 0 (0.0%) |
| 3 or more Vehicles | 16 (34.8%) | 8 (88.9%) |
| Total | 46 (100.0%) | 9 (100.0%) |
Real Estate & Mortgages in East Peru
Real Estate and Mortgage Overview in East Peru
| Characteristic | Without Mortgage | With Mortgage |
| Housing Units | 23 | 23 |
| Median Property Value | $47,000 | $0 |
| Median Household Income | $63,438 | $1 |
| Monthly Housing Costs | $525 | $2 |
| Real Estate Taxes | $617 | $0 |
Property Value by Mortgage Status in East Peru
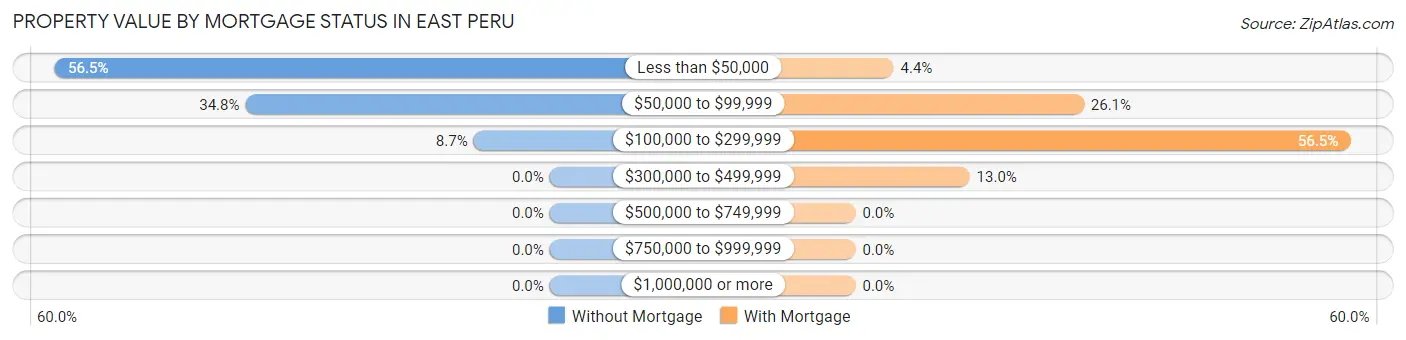
| Property Value | Without Mortgage | With Mortgage |
| Less than $50,000 | 13 (56.5%) | 1 (4.3%) |
| $50,000 to $99,999 | 8 (34.8%) | 6 (26.1%) |
| $100,000 to $299,999 | 2 (8.7%) | 13 (56.5%) |
| $300,000 to $499,999 | 0 (0.0%) | 3 (13.0%) |
| $500,000 to $749,999 | 0 (0.0%) | 0 (0.0%) |
| $750,000 to $999,999 | 0 (0.0%) | 0 (0.0%) |
| $1,000,000 or more | 0 (0.0%) | 0 (0.0%) |
| Total | 23 (100.0%) | 23 (100.0%) |
Household Income by Mortgage Status in East Peru
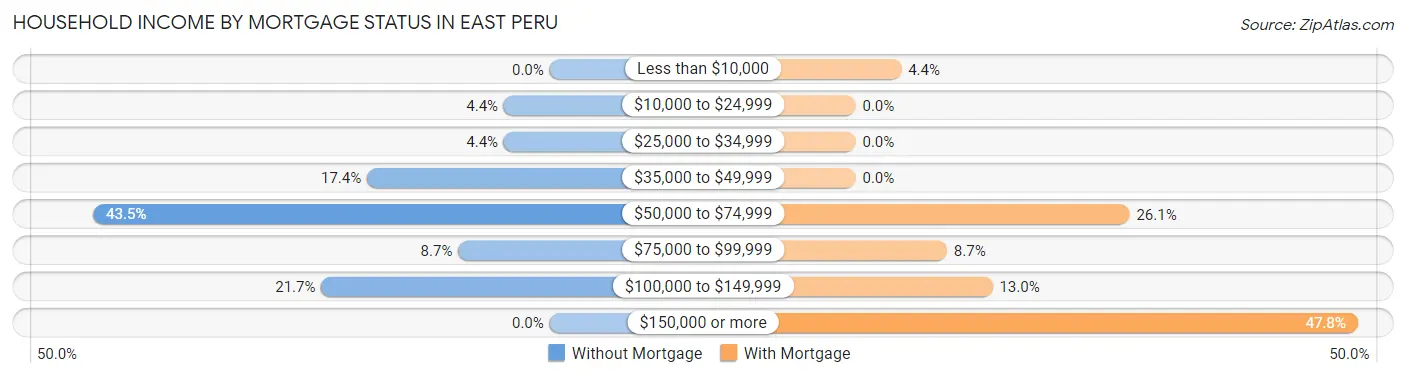
| Household Income | Without Mortgage | With Mortgage |
| Less than $10,000 | 0 (0.0%) | 1 (4.3%) |
| $10,000 to $24,999 | 1 (4.3%) | 0 (0.0%) |
| $25,000 to $34,999 | 1 (4.3%) | 0 (0.0%) |
| $35,000 to $49,999 | 4 (17.4%) | 0 (0.0%) |
| $50,000 to $74,999 | 10 (43.5%) | 6 (26.1%) |
| $75,000 to $99,999 | 2 (8.7%) | 2 (8.7%) |
| $100,000 to $149,999 | 5 (21.7%) | 3 (13.0%) |
| $150,000 or more | 0 (0.0%) | 11 (47.8%) |
| Total | 23 (100.0%) | 23 (100.0%) |
Property Value to Household Income Ratio in East Peru
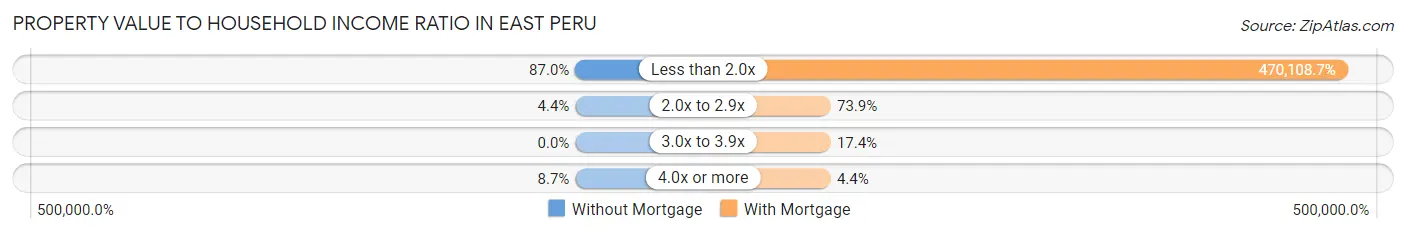
| Value-to-Income Ratio | Without Mortgage | With Mortgage |
| Less than 2.0x | 20 (87.0%) | 108,125 (470,108.7%) |
| 2.0x to 2.9x | 1 (4.3%) | 17 (73.9%) |
| 3.0x to 3.9x | 0 (0.0%) | 4 (17.4%) |
| 4.0x or more | 2 (8.7%) | 1 (4.3%) |
| Total | 23 (100.0%) | 23 (100.0%) |
Real Estate Taxes by Mortgage Status in East Peru
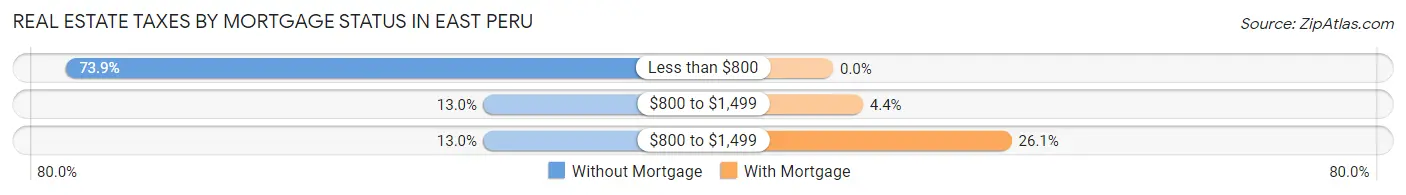
| Property Taxes | Without Mortgage | With Mortgage |
| Less than $800 | 17 (73.9%) | 0 (0.0%) |
| $800 to $1,499 | 3 (13.0%) | 1 (4.3%) |
| $800 to $1,499 | 3 (13.0%) | 6 (26.1%) |
| Total | 23 (100.0%) | 23 (100.0%) |
Health & Disability in East Peru
Health Insurance Coverage by Age in East Peru
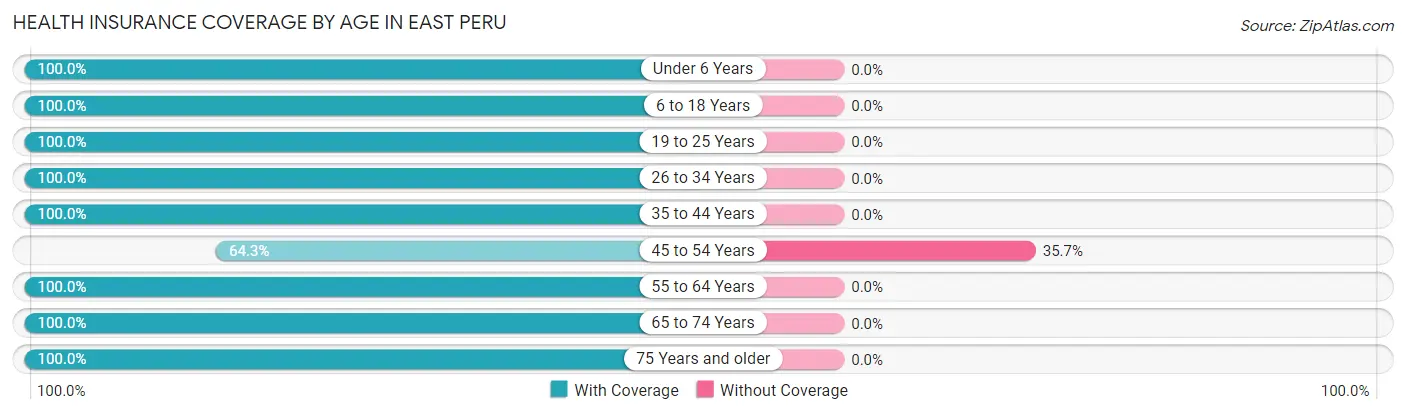
| Age Bracket | With Coverage | Without Coverage |
| Under 6 Years | 29 (100.0%) | 0 (0.0%) |
| 6 to 18 Years | 34 (100.0%) | 0 (0.0%) |
| 19 to 25 Years | 25 (100.0%) | 0 (0.0%) |
| 26 to 34 Years | 15 (100.0%) | 0 (0.0%) |
| 35 to 44 Years | 32 (100.0%) | 0 (0.0%) |
| 45 to 54 Years | 9 (64.3%) | 5 (35.7%) |
| 55 to 64 Years | 19 (100.0%) | 0 (0.0%) |
| 65 to 74 Years | 9 (100.0%) | 0 (0.0%) |
| 75 Years and older | 6 (100.0%) | 0 (0.0%) |
| Total | 178 (97.3%) | 5 (2.7%) |
Health Insurance Coverage by Citizenship Status in East Peru

| Citizenship Status | With Coverage | Without Coverage |
| Native Born | 29 (100.0%) | 0 (0.0%) |
| Foreign Born, Citizen | 34 (100.0%) | 0 (0.0%) |
| Foreign Born, not a Citizen | 25 (100.0%) | 0 (0.0%) |
Health Insurance Coverage by Household Income in East Peru
| Household Income | With Coverage | Without Coverage |
| Under $25,000 | 23 (100.0%) | 0 (0.0%) |
| $25,000 to $49,999 | 29 (100.0%) | 0 (0.0%) |
| $50,000 to $74,999 | 38 (100.0%) | 0 (0.0%) |
| $75,000 to $99,999 | 28 (100.0%) | 0 (0.0%) |
| $100,000 and over | 60 (92.3%) | 5 (7.7%) |
Public vs Private Health Insurance Coverage by Age in East Peru
| Age Bracket | Public Insurance | Private Insurance |
| Under 6 | 9 (31.0%) | 20 (69.0%) |
| 6 to 18 Years | 19 (55.9%) | 17 (50.0%) |
| 19 to 25 Years | 19 (76.0%) | 9 (36.0%) |
| 25 to 34 Years | 4 (26.7%) | 11 (73.3%) |
| 35 to 44 Years | 9 (28.1%) | 23 (71.9%) |
| 45 to 54 Years | 6 (42.9%) | 3 (21.4%) |
| 55 to 64 Years | 2 (10.5%) | 18 (94.7%) |
| 65 to 74 Years | 9 (100.0%) | 6 (66.7%) |
| 75 Years and over | 6 (100.0%) | 3 (50.0%) |
| Total | 83 (45.4%) | 110 (60.1%) |
Disability Status by Sex by Age in East Peru
| Age Bracket | Male | Female |
| Under 5 Years | 0 (0.0%) | 0 (0.0%) |
| 5 to 17 Years | 0 (0.0%) | 2 (13.3%) |
| 18 to 34 Years | 0 (0.0%) | 2 (5.4%) |
| 35 to 64 Years | 4 (10.3%) | 5 (19.2%) |
| 65 to 74 Years | 0 (0.0%) | 3 (50.0%) |
| 75 Years and over | 4 (100.0%) | 0 (0.0%) |
Disability Class by Sex by Age in East Peru
Disability Class: Hearing Difficulty
| Age Bracket | Male | Female |
| Under 5 Years | 0 (0.0%) | 0 (0.0%) |
| 5 to 17 Years | 0 (0.0%) | 0 (0.0%) |
| 18 to 34 Years | 0 (0.0%) | 0 (0.0%) |
| 35 to 64 Years | 0 (0.0%) | 0 (0.0%) |
| 65 to 74 Years | 0 (0.0%) | 0 (0.0%) |
| 75 Years and over | 2 (50.0%) | 0 (0.0%) |
Disability Class: Vision Difficulty
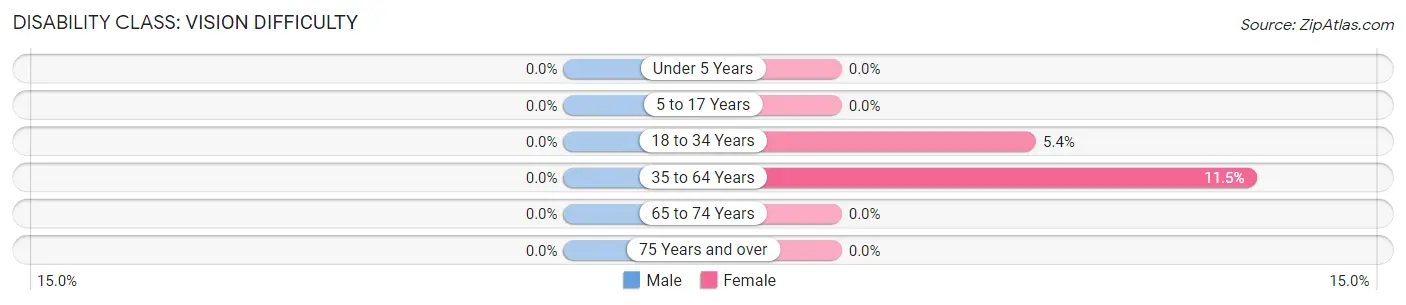
| Age Bracket | Male | Female |
| Under 5 Years | 0 (0.0%) | 0 (0.0%) |
| 5 to 17 Years | 0 (0.0%) | 0 (0.0%) |
| 18 to 34 Years | 0 (0.0%) | 2 (5.4%) |
| 35 to 64 Years | 0 (0.0%) | 3 (11.5%) |
| 65 to 74 Years | 0 (0.0%) | 0 (0.0%) |
| 75 Years and over | 0 (0.0%) | 0 (0.0%) |
Disability Class: Cognitive Difficulty
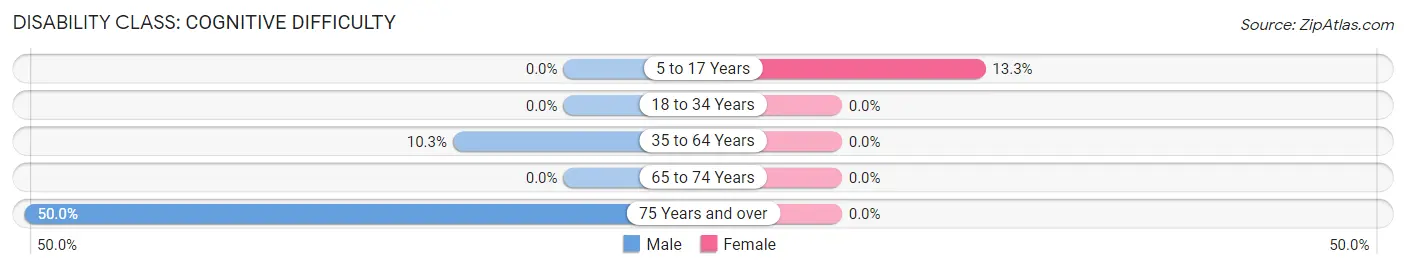
| Age Bracket | Male | Female |
| 5 to 17 Years | 0 (0.0%) | 2 (13.3%) |
| 18 to 34 Years | 0 (0.0%) | 0 (0.0%) |
| 35 to 64 Years | 4 (10.3%) | 0 (0.0%) |
| 65 to 74 Years | 0 (0.0%) | 0 (0.0%) |
| 75 Years and over | 2 (50.0%) | 0 (0.0%) |
Disability Class: Ambulatory Difficulty
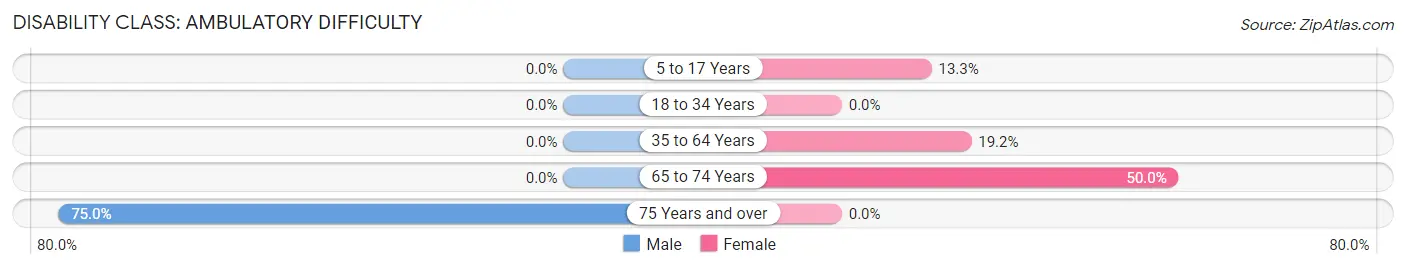
| Age Bracket | Male | Female |
| 5 to 17 Years | 0 (0.0%) | 2 (13.3%) |
| 18 to 34 Years | 0 (0.0%) | 0 (0.0%) |
| 35 to 64 Years | 0 (0.0%) | 5 (19.2%) |
| 65 to 74 Years | 0 (0.0%) | 3 (50.0%) |
| 75 Years and over | 3 (75.0%) | 0 (0.0%) |
Disability Class: Self-Care Difficulty
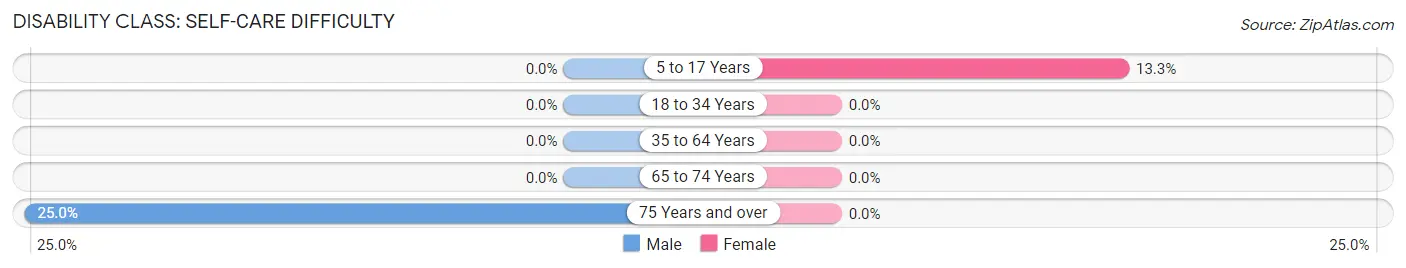
| Age Bracket | Male | Female |
| 5 to 17 Years | 0 (0.0%) | 2 (13.3%) |
| 18 to 34 Years | 0 (0.0%) | 0 (0.0%) |
| 35 to 64 Years | 0 (0.0%) | 0 (0.0%) |
| 65 to 74 Years | 0 (0.0%) | 0 (0.0%) |
| 75 Years and over | 1 (25.0%) | 0 (0.0%) |
Technology Access in East Peru
Computing Device Access in East Peru
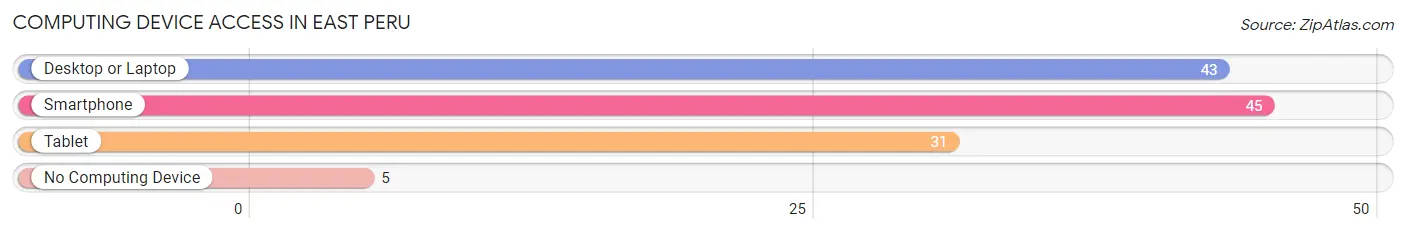
| Device Type | # Households | % Households |
| Desktop or Laptop | 43 | 78.2% |
| Smartphone | 45 | 81.8% |
| Tablet | 31 | 56.4% |
| No Computing Device | 5 | 9.1% |
| Total | 55 | 100.0% |
Internet Access in East Peru
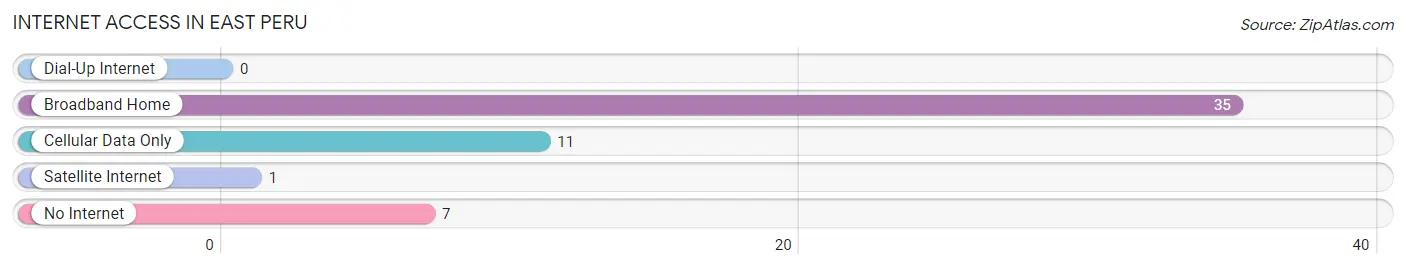
| Internet Type | # Households | % Households |
| Dial-Up Internet | 0 | 0.0% |
| Broadband Home | 35 | 63.6% |
| Cellular Data Only | 11 | 20.0% |
| Satellite Internet | 1 | 1.8% |
| No Internet | 7 | 12.7% |
| Total | 55 | 100.0% |
East Peru Summary
History
East Peru, Iowa is a small town located in the southeastern corner of the state. It is situated in the rolling hills of the Loess Hills region, and is part of the larger Sioux City metropolitan area. The town was founded in 1856 by a group of settlers from the East Coast, who were looking for a place to settle and start a new life. The town was originally called East Peru, after the nearby Peru Township, and was incorporated in 1872.
East Peru has a rich history, and has been home to many different cultures over the years. The town was originally settled by a mix of German, Irish, and English immigrants, and later saw an influx of Scandinavian and Dutch settlers. The town was also home to a large Native American population, and was the site of a major battle between the Sioux and the US Army in 1876.
East Peru has also been home to a number of notable figures, including the first female mayor of Iowa, Mary Ann Hildreth, who served from 1891 to 1895. The town was also the birthplace of the famous American author and poet, Carl Sandburg, who was born in East Peru in 1878.
Geography
East Peru is located in the southeastern corner of Iowa, in the Loess Hills region. The town is situated on the banks of the Big Sioux River, and is surrounded by rolling hills and farmland. The town is located about 25 miles south of Sioux City, and is part of the larger Sioux City metropolitan area.
The town has a total area of 1.2 square miles, all of which is land. The town is located at an elevation of 1,072 feet above sea level. The climate in East Peru is classified as humid continental, with hot summers and cold winters.
Economy
East Peru is a small town with a population of just over 1,000 people. The town’s economy is largely based on agriculture, with corn, soybeans, and hay being the main crops. The town also has a small manufacturing sector, with a few small businesses located in the area.
The town is also home to a number of small businesses, including a grocery store, a hardware store, a pharmacy, and a few restaurants. The town also has a few small retail stores, including a clothing store and a gift shop.
Demographics
As of the 2010 census, the population of East Peru was 1,072. The racial makeup of the town was 97.3% White, 0.7% African American, 0.3% Native American, 0.2% Asian, 0.1% Pacific Islander, and 1.4% from other races. Hispanic or Latino of any race were 1.7% of the population.
The median household income in East Peru was $41,250, and the median family income was $45,625. The per capita income for the town was $19,945. About 8.3% of families and 10.2% of the population were below the poverty line, including 14.3% of those under age 18 and 6.3% of those age 65 or over.
Common Questions
What is Per Capita Income in East Peru?
Per Capita income in East Peru is $24,119.
What is the Median Family Income in East Peru?
Median Family Income in East Peru is $83,750.
What is the Median Household income in East Peru?
Median Household Income in East Peru is $66,875.
What is Inequality or Gini Index in East Peru?
Inequality or Gini Index in East Peru is 0.32.
What is the Total Population of East Peru?
Total Population of East Peru is 183.
What is the Total Male Population of East Peru?
Total Male Population of East Peru is 88.
What is the Total Female Population of East Peru?
Total Female Population of East Peru is 95.
What is the Ratio of Males per 100 Females in East Peru?
There are 92.63 Males per 100 Females in East Peru.
What is the Ratio of Females per 100 Males in East Peru?
There are 107.95 Females per 100 Males in East Peru.
What is the Median Population Age in East Peru?
Median Population Age in East Peru is 26.9 Years.
What is the Average Family Size in East Peru
Average Family Size in East Peru is 3.8 People.
What is the Average Household Size in East Peru
Average Household Size in East Peru is 3.3 People.
How Large is the Labor Force in East Peru?
There are 91 People in the Labor Forcein in East Peru.
What is the Percentage of People in the Labor Force in East Peru?
70.5% of People are in the Labor Force in East Peru.
What is the Unemployment Rate in East Peru?
Unemployment Rate in East Peru is 2.2%.