Zip Codes with the Highest Percentage of Households Without a Vehicle in Dubuque, IA
RELATED REPORTS & OPTIONS
Households without a Cars
Dubuque
Compare Zip Codes
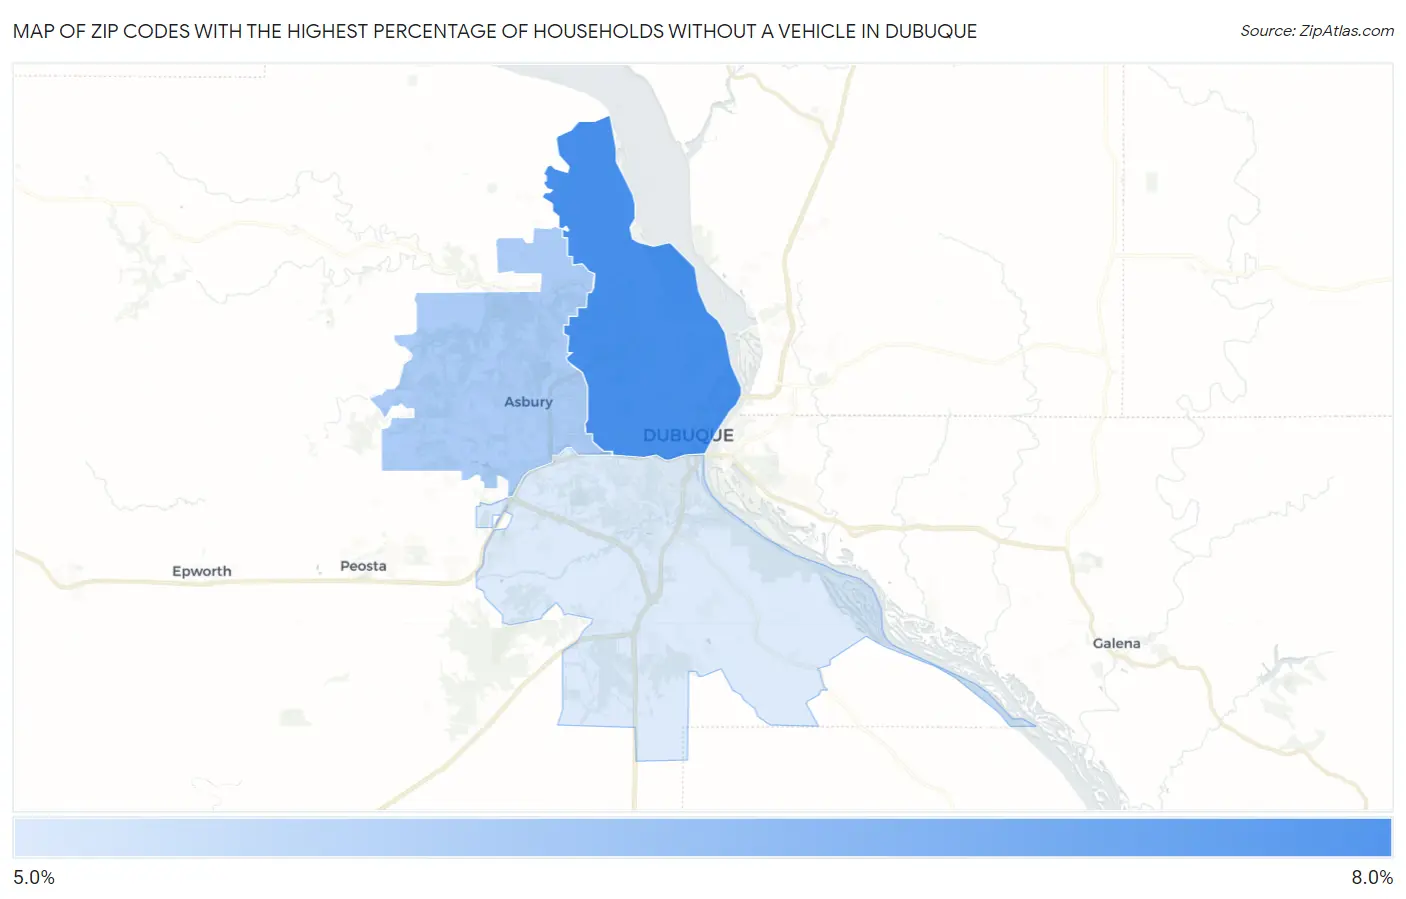
Map of Zip Codes with the Highest Percentage of Households Without a Vehicle in Dubuque
5.8%
7.0%
Zip Codes with the Highest Percentage of Households Without a Vehicle in Dubuque, IA
| Zip Code | Housholds Without a Car | vs State | vs National | |
| 1. | 52001 | 7.0% | 5.6%(+1.40)#139 | 8.3%(-1.30)#8,526 |
| 2. | 52002 | 6.2% | 5.6%(+0.600)#172 | 8.3%(-2.10)#10,037 |
| 3. | 52003 | 5.8% | 5.6%(+0.200)#198 | 8.3%(-2.50)#10,947 |
1
Common Questions
What are the Top Zip Codes with the Highest Percentage of Households Without a Vehicle in Dubuque, IA?
Top Zip Codes with the Highest Percentage of Households Without a Vehicle in Dubuque, IA are:
What zip code has the Highest Percentage of Households Without a Vehicle in Dubuque, IA?
52001 has the Highest Percentage of Households Without a Vehicle in Dubuque, IA with 7.0%.
What is the Percentage of Households Without a Vehicle in Dubuque, IA?
Percentage of Households Without a Vehicle in Dubuque is 7.4%.
What is the Percentage of Households Without a Vehicle in Iowa?
Percentage of Households Without a Vehicle in Iowa is 5.6%.
What is the Percentage of Households Without a Vehicle in the United States?
Percentage of Households Without a Vehicle in the United States is 8.3%.