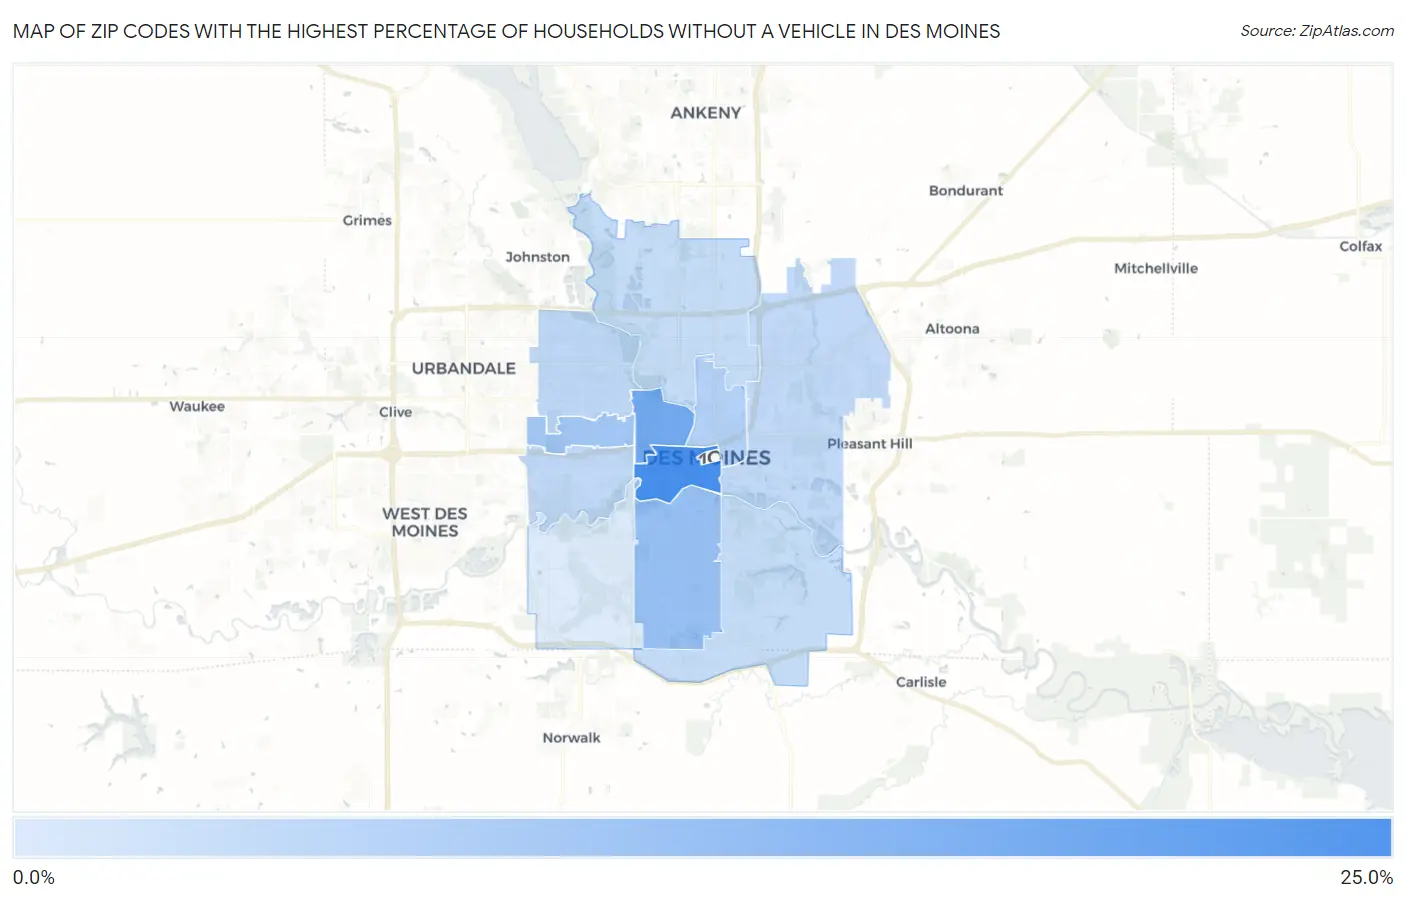
Zip Codes with the Highest Percentage of Households Without a Vehicle in Des Moines, IA
RELATED REPORTS & OPTIONS
Households without a Cars
Des Moines
Compare Zip Codes
Map of Zip Codes with the Highest Percentage of Households Without a Vehicle in Des Moines
3.2%
21.1%
Zip Codes with the Highest Percentage of Households Without a Vehicle in Des Moines, IA
| Zip Code | Housholds Without a Car | vs State | vs National | |
| 1. | 50309 | 21.1% | 5.6%(+15.5)#8 | 8.3%(+12.8)#1,382 |
| 2. | 50314 | 15.7% | 5.6%(+10.1)#16 | 8.3%(+7.40)#2,218 |
| 3. | 50315 | 11.0% | 5.6%(+5.40)#41 | 8.3%(+2.70)#4,128 |
| 4. | 50311 | 9.8% | 5.6%(+4.20)#56 | 8.3%(+1.50)#5,032 |
| 5. | 50316 | 7.9% | 5.6%(+2.30)#101 | 8.3%(-0.400)#7,115 |
| 6. | 50310 | 6.5% | 5.6%(+0.900)#158 | 8.3%(-1.80)#9,382 |
| 7. | 50312 | 6.4% | 5.6%(+0.800)#163 | 8.3%(-1.90)#9,628 |
| 8. | 50317 | 6.2% | 5.6%(+0.600)#171 | 8.3%(-2.10)#9,986 |
| 9. | 50320 | 5.8% | 5.6%(+0.200)#196 | 8.3%(-2.50)#10,917 |
| 10. | 50313 | 5.8% | 5.6%(+0.200)#197 | 8.3%(-2.50)#10,930 |
| 11. | 50321 | 3.2% | 5.6%(-2.40)#394 | 8.3%(-5.10)#18,428 |
1
Common Questions
What are the Top 10 Zip Codes with the Highest Percentage of Households Without a Vehicle in Des Moines, IA?
Top 10 Zip Codes with the Highest Percentage of Households Without a Vehicle in Des Moines, IA are:
What zip code has the Highest Percentage of Households Without a Vehicle in Des Moines, IA?
50309 has the Highest Percentage of Households Without a Vehicle in Des Moines, IA with 21.1%.
What is the Percentage of Households Without a Vehicle in Des Moines, IA?
Percentage of Households Without a Vehicle in Des Moines is 9.1%.
What is the Percentage of Households Without a Vehicle in Iowa?
Percentage of Households Without a Vehicle in Iowa is 5.6%.
What is the Percentage of Households Without a Vehicle in the United States?
Percentage of Households Without a Vehicle in the United States is 8.3%.