Akron, IA Map & Demographics
Akron Map
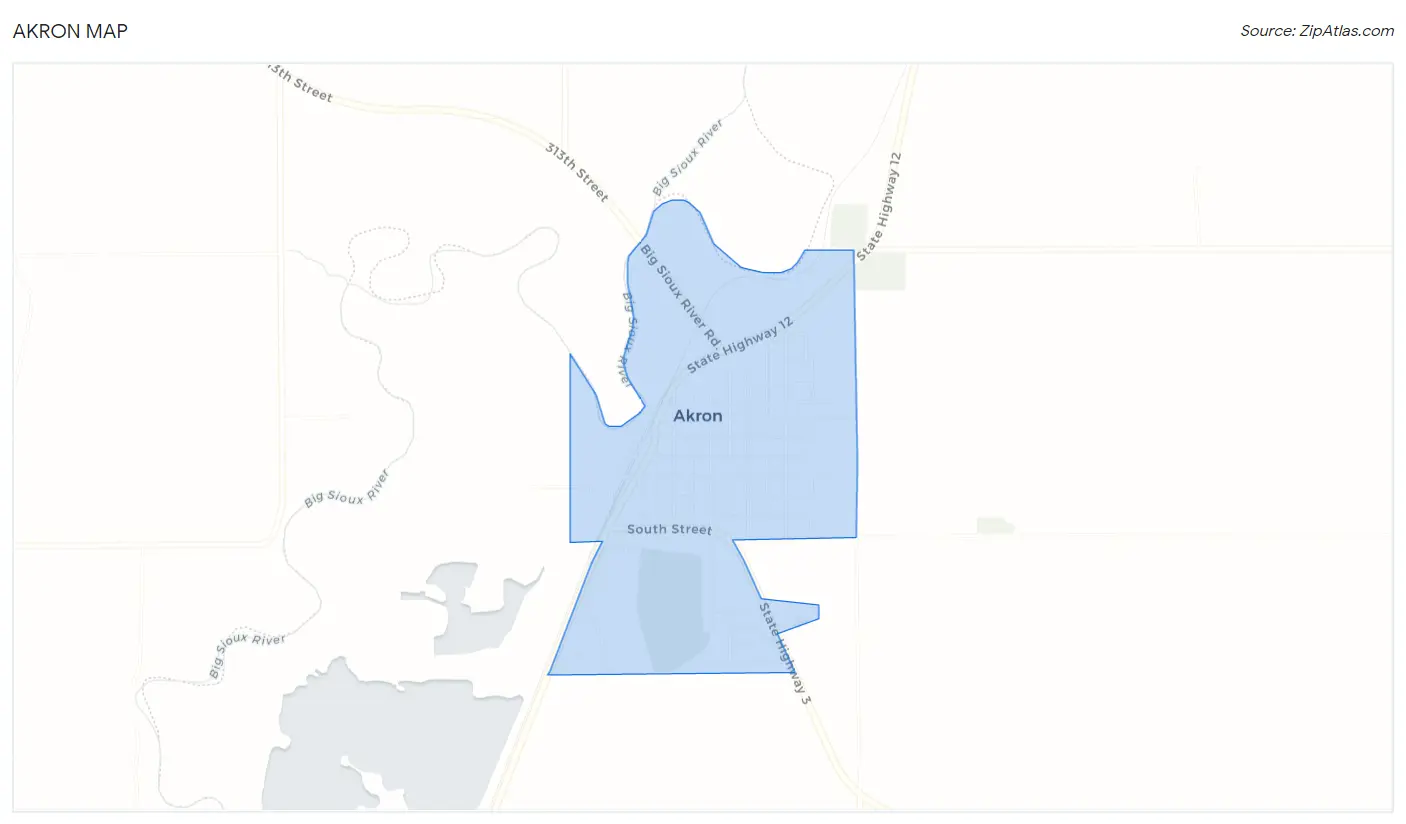
Akron Overview
$31,208
PER CAPITA INCOME
$74,750
AVG FAMILY INCOME
$60,833
AVG HOUSEHOLD INCOME
29.0%
WAGE / INCOME GAP [ % ]
71.0¢/ $1
WAGE / INCOME GAP [ $ ]
0.41
INEQUALITY / GINI INDEX
1,580
TOTAL POPULATION
722
MALE POPULATION
858
FEMALE POPULATION
84.15
MALES / 100 FEMALES
118.84
FEMALES / 100 MALES
41.9
MEDIAN AGE
2.9
AVG FAMILY SIZE
2.2
AVG HOUSEHOLD SIZE
788
LABOR FORCE [ PEOPLE ]
62.4%
PERCENT IN LABOR FORCE
0.9%
UNEMPLOYMENT RATE
Akron Zip Codes
Akron Area Codes
Income in Akron
Income Overview in Akron
Per Capita Income in Akron is $31,208, while median incomes of families and households are $74,750 and $60,833 respectively.
| Characteristic | Number | Measure |
| Per Capita Income | 1,580 | $31,208 |
| Median Family Income | 408 | $74,750 |
| Mean Family Income | 408 | $86,586 |
| Median Household Income | 692 | $60,833 |
| Mean Household Income | 692 | $70,758 |
| Income Deficit | 408 | $0 |
| Wage / Income Gap (%) | 1,580 | 29.00% |
| Wage / Income Gap ($) | 1,580 | 71.00¢ per $1 |
| Gini / Inequality Index | 1,580 | 0.41 |
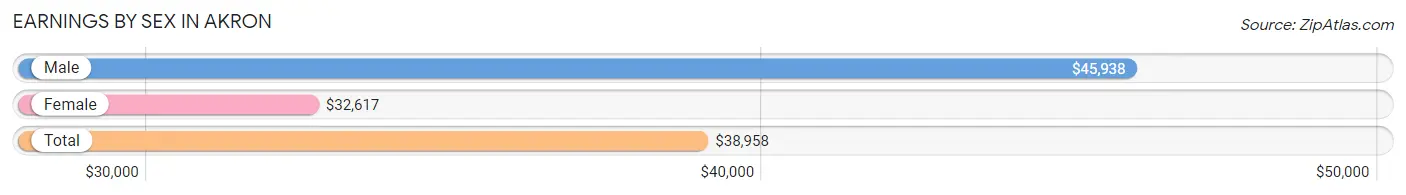
Earnings by Sex in Akron
Average Earnings in Akron are $38,958, $45,938 for men and $32,617 for women, a difference of 29.0%.
| Sex | Number | Average Earnings |
| Male | 437 (53.0%) | $45,938 |
| Female | 387 (47.0%) | $32,617 |
| Total | 824 (100.0%) | $38,958 |
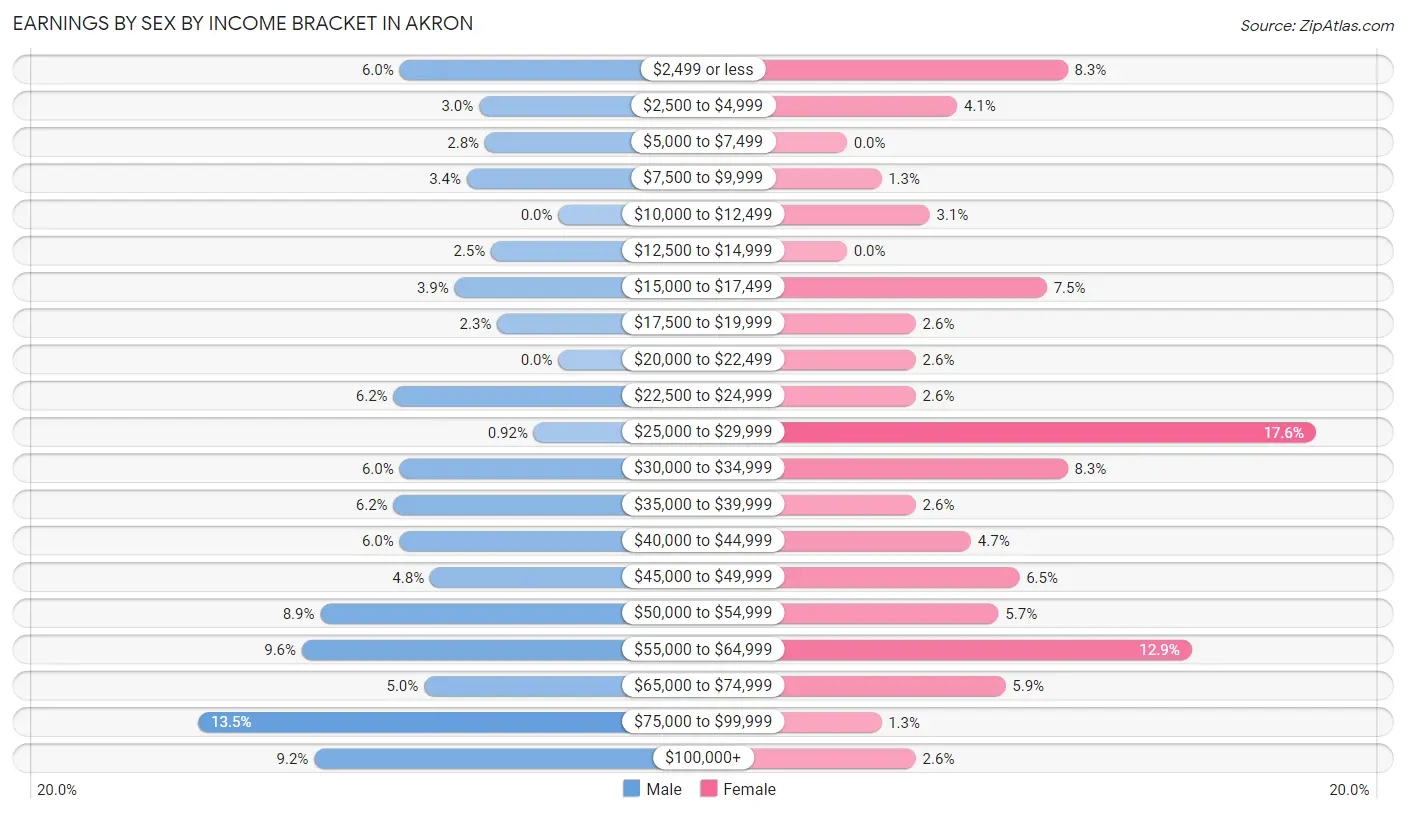
Earnings by Sex by Income Bracket in Akron
The most common earnings brackets in Akron are $75,000 to $99,999 for men (59 | 13.5%) and $25,000 to $29,999 for women (68 | 17.6%).
| Income | Male | Female |
| $2,499 or less | 26 (5.9%) | 32 (8.3%) |
| $2,500 to $4,999 | 13 (3.0%) | 16 (4.1%) |
| $5,000 to $7,499 | 12 (2.8%) | 0 (0.0%) |
| $7,500 to $9,999 | 15 (3.4%) | 5 (1.3%) |
| $10,000 to $12,499 | 0 (0.0%) | 12 (3.1%) |
| $12,500 to $14,999 | 11 (2.5%) | 0 (0.0%) |
| $15,000 to $17,499 | 17 (3.9%) | 29 (7.5%) |
| $17,500 to $19,999 | 10 (2.3%) | 10 (2.6%) |
| $20,000 to $22,499 | 0 (0.0%) | 10 (2.6%) |
| $22,500 to $24,999 | 27 (6.2%) | 10 (2.6%) |
| $25,000 to $29,999 | 4 (0.9%) | 68 (17.6%) |
| $30,000 to $34,999 | 26 (5.9%) | 32 (8.3%) |
| $35,000 to $39,999 | 27 (6.2%) | 10 (2.6%) |
| $40,000 to $44,999 | 26 (5.9%) | 18 (4.6%) |
| $45,000 to $49,999 | 21 (4.8%) | 25 (6.5%) |
| $50,000 to $54,999 | 39 (8.9%) | 22 (5.7%) |
| $55,000 to $64,999 | 42 (9.6%) | 50 (12.9%) |
| $65,000 to $74,999 | 22 (5.0%) | 23 (5.9%) |
| $75,000 to $99,999 | 59 (13.5%) | 5 (1.3%) |
| $100,000+ | 40 (9.1%) | 10 (2.6%) |
| Total | 437 (100.0%) | 387 (100.0%) |
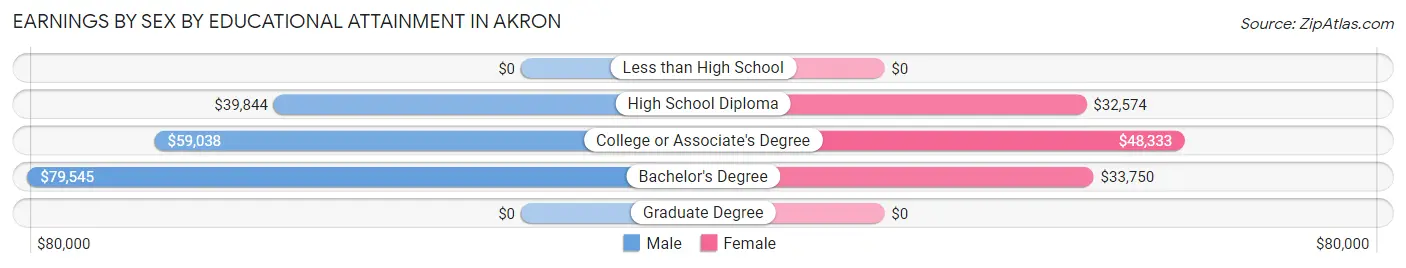
Earnings by Sex by Educational Attainment in Akron
Average earnings in Akron are $53,009 for men and $34,961 for women, a difference of 34.1%. Men with an educational attainment of bachelor's degree enjoy the highest average annual earnings of $79,545, while those with high school diploma education earn the least with $39,844. Women with an educational attainment of college or associate's degree earn the most with the average annual earnings of $48,333, while those with high school diploma education have the smallest earnings of $32,574.
| Educational Attainment | Male Income | Female Income |
| Less than High School | - | - |
| High School Diploma | $39,844 | $32,574 |
| College or Associate's Degree | $59,038 | $48,333 |
| Bachelor's Degree | $79,545 | $33,750 |
| Graduate Degree | - | - |
| Total | $53,009 | $34,961 |
Family Income in Akron
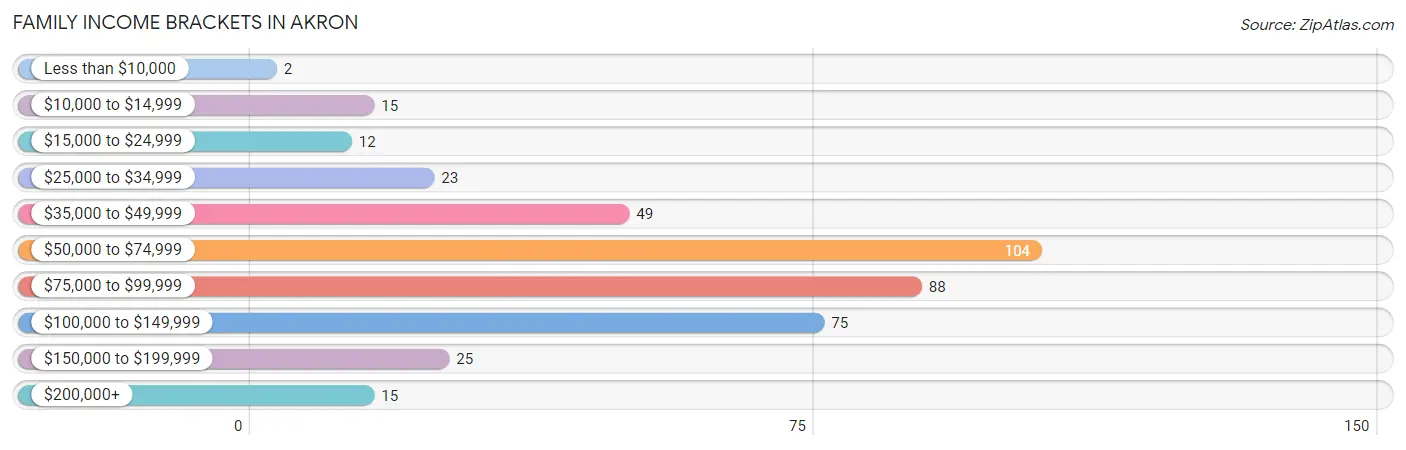
Family Income Brackets in Akron
According to the Akron family income data, there are 104 families falling into the $50,000 to $74,999 income range, which is the most common income bracket and makes up 25.5% of all families. Conversely, the less than $10,000 income bracket is the least frequent group with only 2 families (0.5%) belonging to this category.
| Income Bracket | # Families | % Families |
| Less than $10,000 | 2 | 0.5% |
| $10,000 to $14,999 | 15 | 3.7% |
| $15,000 to $24,999 | 12 | 2.9% |
| $25,000 to $34,999 | 23 | 5.6% |
| $35,000 to $49,999 | 49 | 12.0% |
| $50,000 to $74,999 | 104 | 25.5% |
| $75,000 to $99,999 | 88 | 21.6% |
| $100,000 to $149,999 | 75 | 18.4% |
| $150,000 to $199,999 | 25 | 6.1% |
| $200,000+ | 15 | 3.7% |
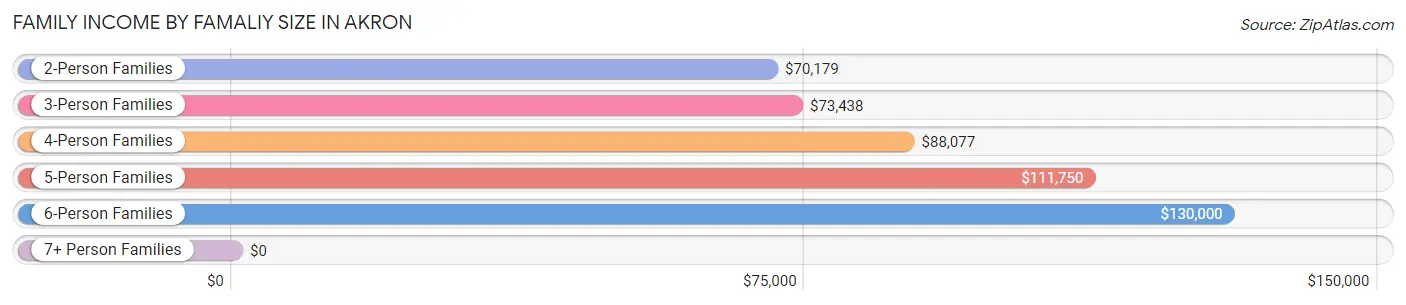
Family Income by Famaliy Size in Akron
6-person families (8 | 2.0%) account for the highest median family income in Akron with $130,000 per family, while 2-person families (227 | 55.6%) have the highest median income of $35,090 per family member.
| Income Bracket | # Families | Median Income |
| 2-Person Families | 227 (55.6%) | $70,179 |
| 3-Person Families | 86 (21.1%) | $73,438 |
| 4-Person Families | 56 (13.7%) | $88,077 |
| 5-Person Families | 31 (7.6%) | $111,750 |
| 6-Person Families | 8 (2.0%) | $130,000 |
| 7+ Person Families | 0 (0.0%) | $0 |
| Total | 408 (100.0%) | $74,750 |
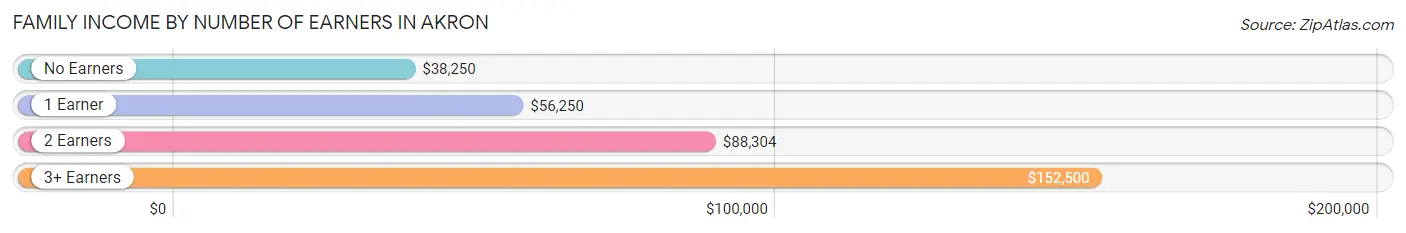
Family Income by Number of Earners in Akron
The median family income in Akron is $74,750, with families comprising 3+ earners (38) having the highest median family income of $152,500, while families with no earners (63) have the lowest median family income of $38,250, accounting for 9.3% and 15.4% of families, respectively.
| Number of Earners | # Families | Median Income |
| No Earners | 63 (15.4%) | $38,250 |
| 1 Earner | 141 (34.6%) | $56,250 |
| 2 Earners | 166 (40.7%) | $88,304 |
| 3+ Earners | 38 (9.3%) | $152,500 |
| Total | 408 (100.0%) | $74,750 |
Household Income in Akron
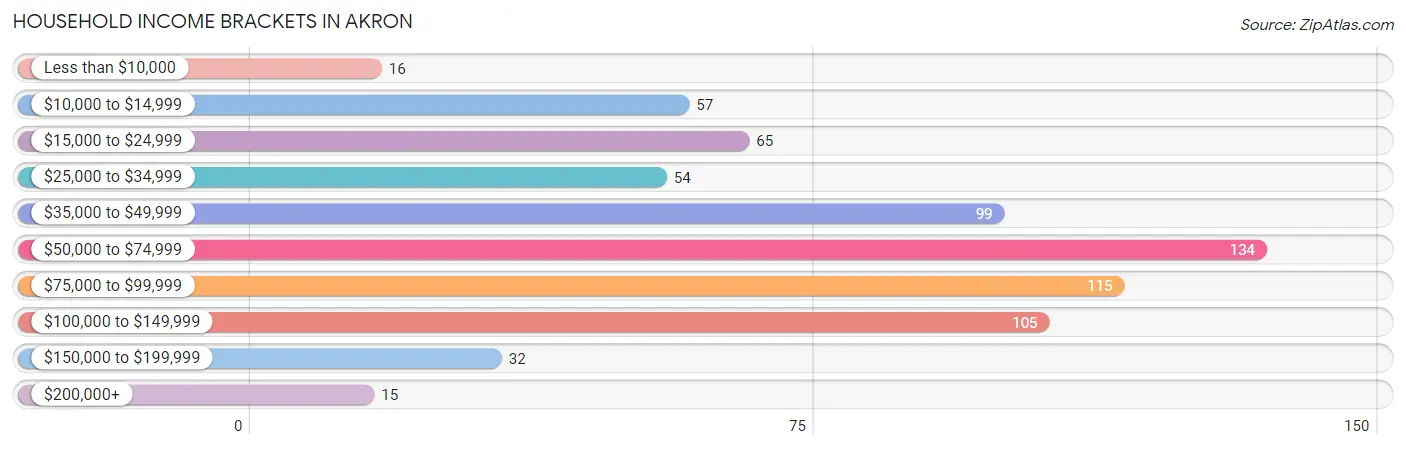
Household Income Brackets in Akron
With 134 households falling in the category, the $50,000 to $74,999 income range is the most frequent in Akron, accounting for 19.4% of all households. In contrast, only 15 households (2.2%) fall into the $200,000+ income bracket, making it the least populous group.
| Income Bracket | # Households | % Households |
| Less than $10,000 | 16 | 2.3% |
| $10,000 to $14,999 | 57 | 8.2% |
| $15,000 to $24,999 | 65 | 9.4% |
| $25,000 to $34,999 | 54 | 7.8% |
| $35,000 to $49,999 | 99 | 14.3% |
| $50,000 to $74,999 | 134 | 19.4% |
| $75,000 to $99,999 | 115 | 16.6% |
| $100,000 to $149,999 | 105 | 15.2% |
| $150,000 to $199,999 | 32 | 4.6% |
| $200,000+ | 15 | 2.2% |
Household Income by Householder Age in Akron
The median household income in Akron is $60,833, with the highest median household income of $81,563 found in the 45 to 64 years age bracket for the primary householder. A total of 234 households (33.8%) fall into this category. Meanwhile, the 65+ years age bracket for the primary householder has the lowest median household income of $38,672, with 267 households (38.6%) in this group.
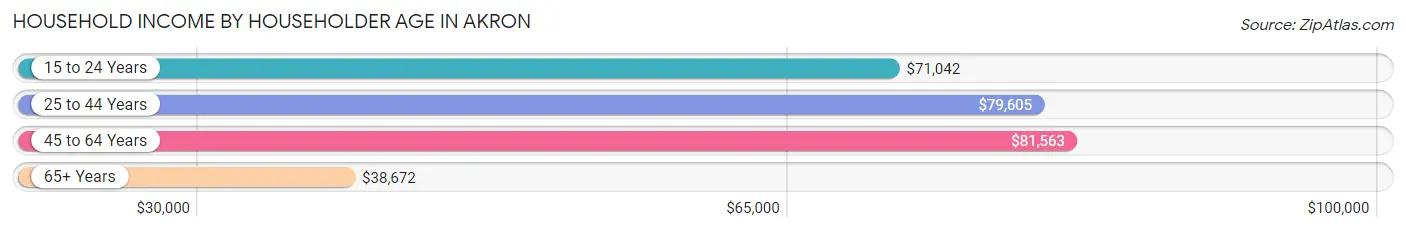
| Income Bracket | # Households | Median Income |
| 15 to 24 Years | 27 (3.9%) | $71,042 |
| 25 to 44 Years | 164 (23.7%) | $79,605 |
| 45 to 64 Years | 234 (33.8%) | $81,563 |
| 65+ Years | 267 (38.6%) | $38,672 |
| Total | 692 (100.0%) | $60,833 |
Poverty in Akron
Income Below Poverty by Sex and Age in Akron
With 10.1% poverty level for males and 10.9% for females among the residents of Akron, 12 to 14 year old males and 15 year old females are the most vulnerable to poverty, with 7 males (35.0%) and 12 females (57.1%) in their respective age groups living below the poverty level.
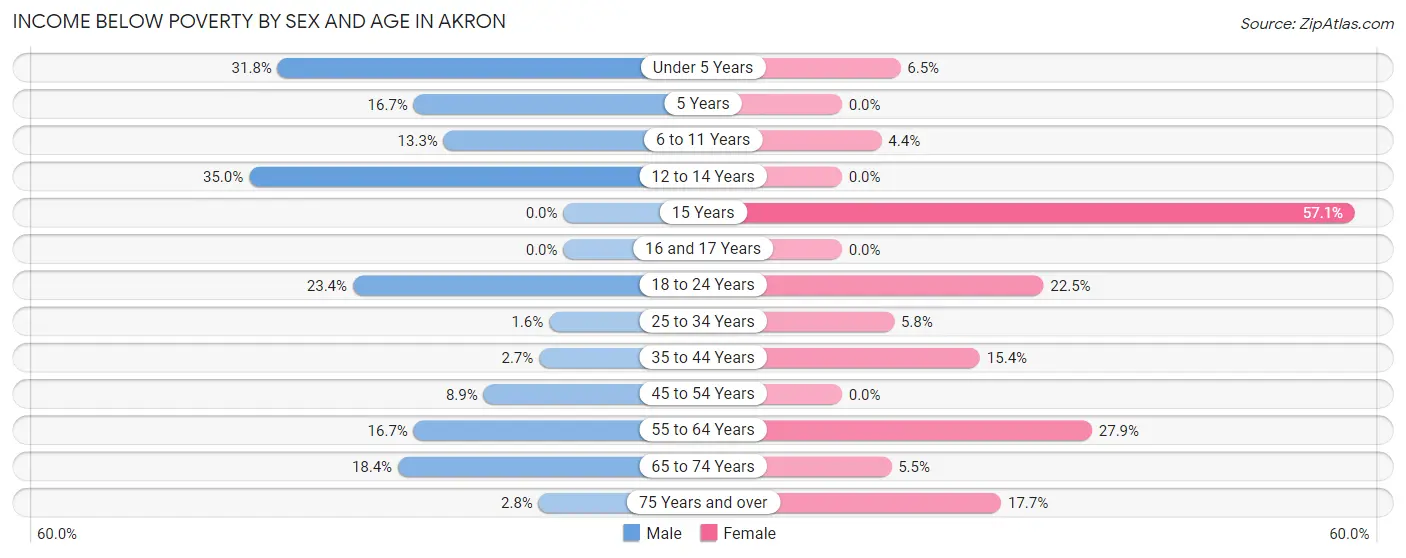
| Age Bracket | Male | Female |
| Under 5 Years | 7 (31.8%) | 3 (6.5%) |
| 5 Years | 3 (16.7%) | 0 (0.0%) |
| 6 to 11 Years | 8 (13.3%) | 3 (4.4%) |
| 12 to 14 Years | 7 (35.0%) | 0 (0.0%) |
| 15 Years | 0 (0.0%) | 12 (57.1%) |
| 16 and 17 Years | 0 (0.0%) | 0 (0.0%) |
| 18 to 24 Years | 15 (23.4%) | 11 (22.5%) |
| 25 to 34 Years | 2 (1.6%) | 5 (5.8%) |
| 35 to 44 Years | 2 (2.7%) | 8 (15.4%) |
| 45 to 54 Years | 8 (8.9%) | 0 (0.0%) |
| 55 to 64 Years | 10 (16.7%) | 22 (27.9%) |
| 65 to 74 Years | 7 (18.4%) | 6 (5.5%) |
| 75 Years and over | 3 (2.8%) | 22 (17.7%) |
| Total | 72 (10.1%) | 92 (10.9%) |
Income Above Poverty by Sex and Age in Akron
According to the poverty statistics in Akron, males aged 15 years and females aged 5 years are the age groups that are most secure financially, with 100.0% of males and 100.0% of females in these age groups living above the poverty line.
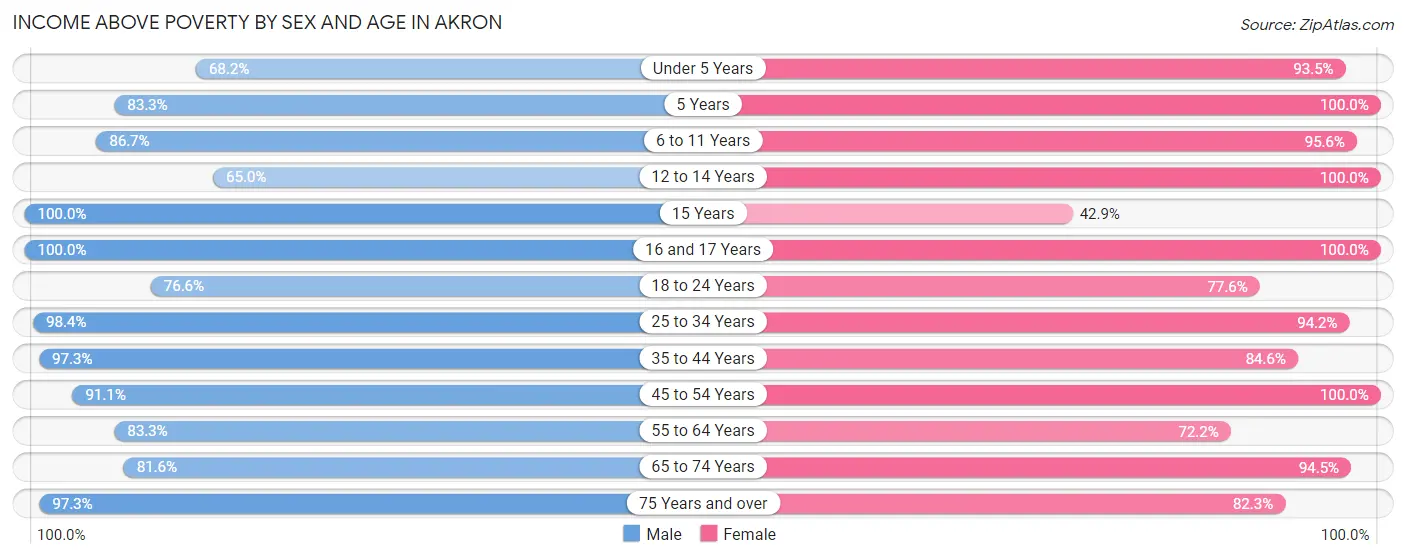
| Age Bracket | Male | Female |
| Under 5 Years | 15 (68.2%) | 43 (93.5%) |
| 5 Years | 15 (83.3%) | 15 (100.0%) |
| 6 to 11 Years | 52 (86.7%) | 65 (95.6%) |
| 12 to 14 Years | 13 (65.0%) | 42 (100.0%) |
| 15 Years | 5 (100.0%) | 9 (42.9%) |
| 16 and 17 Years | 30 (100.0%) | 25 (100.0%) |
| 18 to 24 Years | 49 (76.6%) | 38 (77.5%) |
| 25 to 34 Years | 124 (98.4%) | 81 (94.2%) |
| 35 to 44 Years | 72 (97.3%) | 44 (84.6%) |
| 45 to 54 Years | 82 (91.1%) | 125 (100.0%) |
| 55 to 64 Years | 50 (83.3%) | 57 (72.2%) |
| 65 to 74 Years | 31 (81.6%) | 103 (94.5%) |
| 75 Years and over | 106 (97.3%) | 102 (82.3%) |
| Total | 644 (89.9%) | 749 (89.1%) |
Income Below Poverty Among Married-Couple Families in Akron
The poverty statistics for married-couple families in Akron show that 1.4% or 4 of the total 292 families live below the poverty line. Families with 1 or 2 children have the highest poverty rate of 3.6%, comprising of 4 families. On the other hand, families with no children have the lowest poverty rate of 0.0%, which includes 0 families.
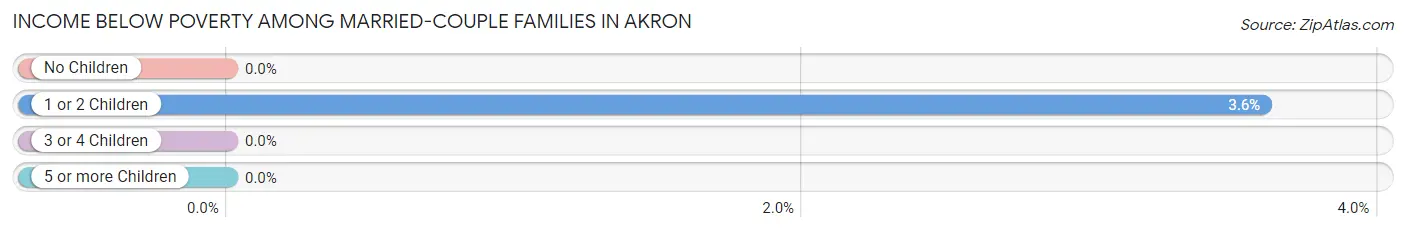
| Children | Above Poverty | Below Poverty |
| No Children | 157 (100.0%) | 0 (0.0%) |
| 1 or 2 Children | 107 (96.4%) | 4 (3.6%) |
| 3 or 4 Children | 24 (100.0%) | 0 (0.0%) |
| 5 or more Children | 0 (0.0%) | 0 (0.0%) |
| Total | 288 (98.6%) | 4 (1.4%) |
Income Below Poverty Among Single-Parent Households in Akron
According to the poverty data in Akron, 7.1% or 2 single-father households and 26.1% or 23 single-mother households are living below the poverty line. Among single-father households, those with 3 or 4 children have the highest poverty rate, with 2 households (100.0%) experiencing poverty. Likewise, among single-mother households, those with 3 or 4 children have the highest poverty rate, with 4 households (100.0%) falling below the poverty line.
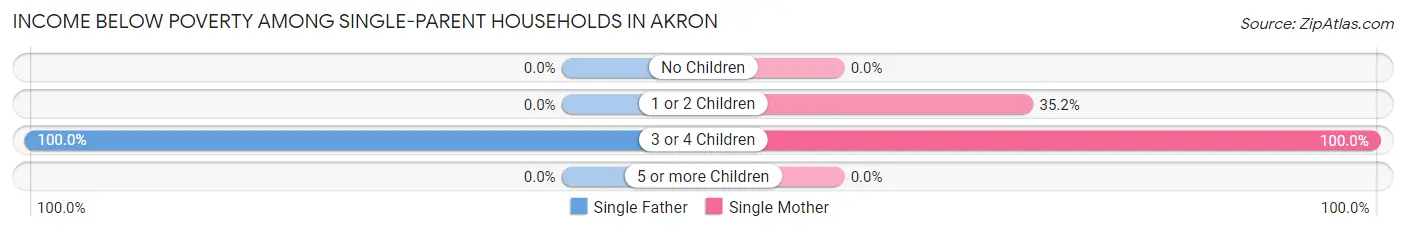
| Children | Single Father | Single Mother |
| No Children | 0 (0.0%) | 0 (0.0%) |
| 1 or 2 Children | 0 (0.0%) | 19 (35.2%) |
| 3 or 4 Children | 2 (100.0%) | 4 (100.0%) |
| 5 or more Children | 0 (0.0%) | 0 (0.0%) |
| Total | 2 (7.1%) | 23 (26.1%) |
Income Below Poverty Among Married-Couple vs Single-Parent Households in Akron
The poverty data for Akron shows that 4 of the married-couple family households (1.4%) and 25 of the single-parent households (21.5%) are living below the poverty level. Within the married-couple family households, those with 1 or 2 children have the highest poverty rate, with 4 households (3.6%) falling below the poverty line. Among the single-parent households, those with 3 or 4 children have the highest poverty rate, with 6 household (100.0%) living below poverty.
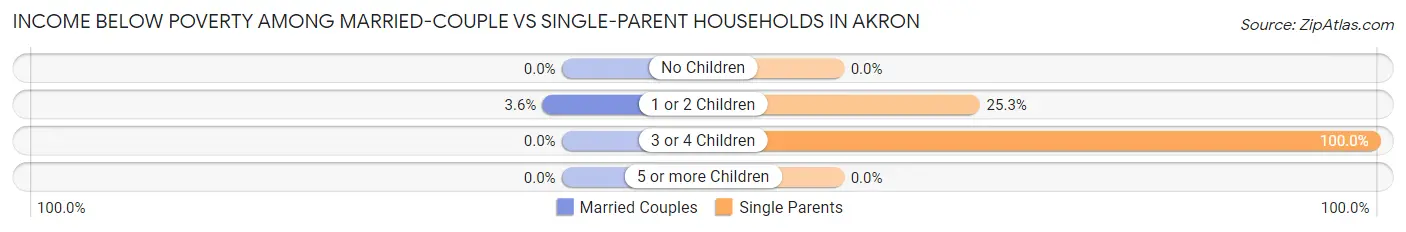
| Children | Married-Couple Families | Single-Parent Households |
| No Children | 0 (0.0%) | 0 (0.0%) |
| 1 or 2 Children | 4 (3.6%) | 19 (25.3%) |
| 3 or 4 Children | 0 (0.0%) | 6 (100.0%) |
| 5 or more Children | 0 (0.0%) | 0 (0.0%) |
| Total | 4 (1.4%) | 25 (21.5%) |
Race in Akron
The most populous races in Akron are White / Caucasian (1,502 | 95.1%), Native / Alaskan (46 | 2.9%), and Hispanic or Latino (44 | 2.8%).
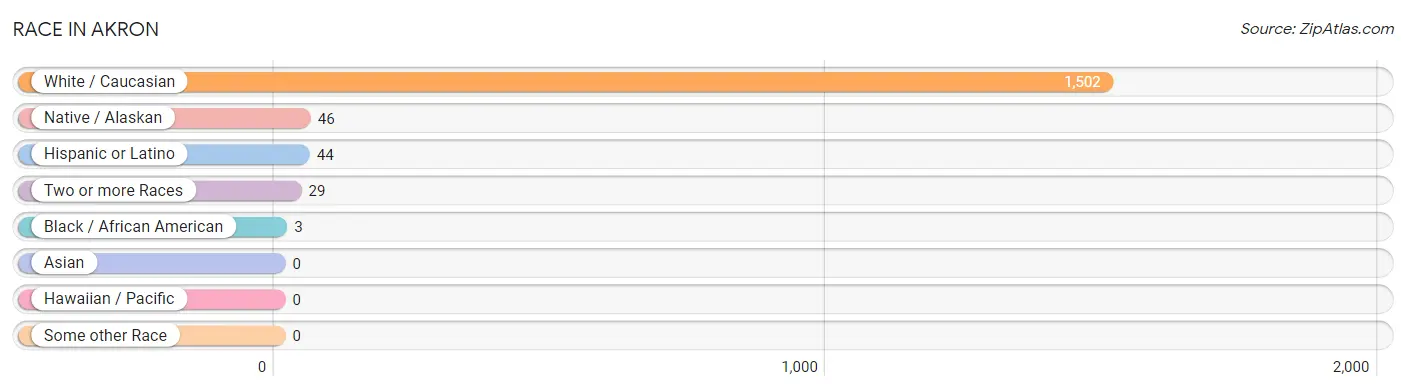
| Race | # Population | % Population |
| Asian | 0 | 0.0% |
| Black / African American | 3 | 0.2% |
| Hawaiian / Pacific | 0 | 0.0% |
| Hispanic or Latino | 44 | 2.8% |
| Native / Alaskan | 46 | 2.9% |
| White / Caucasian | 1,502 | 95.1% |
| Two or more Races | 29 | 1.8% |
| Some other Race | 0 | 0.0% |
| Total | 1,580 | 100.0% |
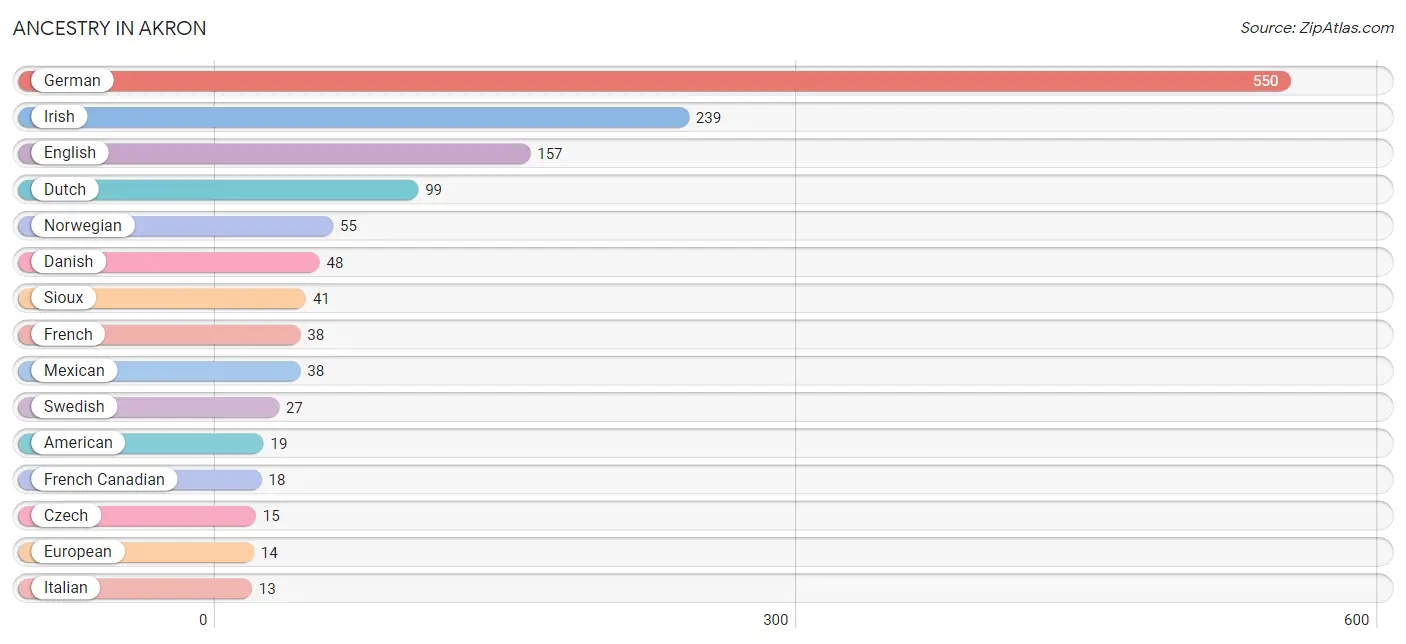
Ancestry in Akron
The most populous ancestries reported in Akron are German (550 | 34.8%), Irish (239 | 15.1%), English (157 | 9.9%), Dutch (99 | 6.3%), and Norwegian (55 | 3.5%), together accounting for 69.6% of all Akron residents.
| Ancestry | # Population | % Population |
| American | 19 | 1.2% |
| Arab | 4 | 0.3% |
| British | 2 | 0.1% |
| Canadian | 2 | 0.1% |
| Czech | 15 | 0.9% |
| Danish | 48 | 3.0% |
| Dutch | 99 | 6.3% |
| English | 157 | 9.9% |
| European | 14 | 0.9% |
| French | 38 | 2.4% |
| French Canadian | 18 | 1.1% |
| German | 550 | 34.8% |
| Hungarian | 7 | 0.4% |
| Irish | 239 | 15.1% |
| Italian | 13 | 0.8% |
| Lebanese | 4 | 0.3% |
| Lithuanian | 3 | 0.2% |
| Luxembourger | 13 | 0.8% |
| Mexican | 38 | 2.4% |
| Norwegian | 55 | 3.5% |
| Polish | 9 | 0.6% |
| Portuguese | 3 | 0.2% |
| Romanian | 4 | 0.3% |
| Scandinavian | 10 | 0.6% |
| Scotch-Irish | 3 | 0.2% |
| Scottish | 10 | 0.6% |
| Sioux | 41 | 2.6% |
| Spanish | 6 | 0.4% |
| Swedish | 27 | 1.7% |
| Swiss | 3 | 0.2% |
| Ukrainian | 2 | 0.1% |
| Welsh | 10 | 0.6% | View All 32 Rows |
Immigrants in Akron
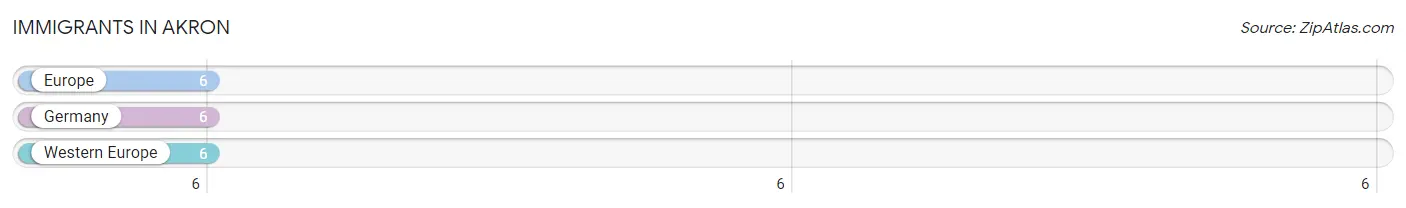
The most numerous immigrant groups reported in Akron came from Europe (6 | 0.4%), Germany (6 | 0.4%), and Western Europe (6 | 0.4%), together accounting for 1.1% of all Akron residents.
| Immigration Origin | # Population | % Population |
| Europe | 6 | 0.4% |
| Germany | 6 | 0.4% |
| Western Europe | 6 | 0.4% | View All 3 Rows |
Sex and Age in Akron
Sex and Age in Akron
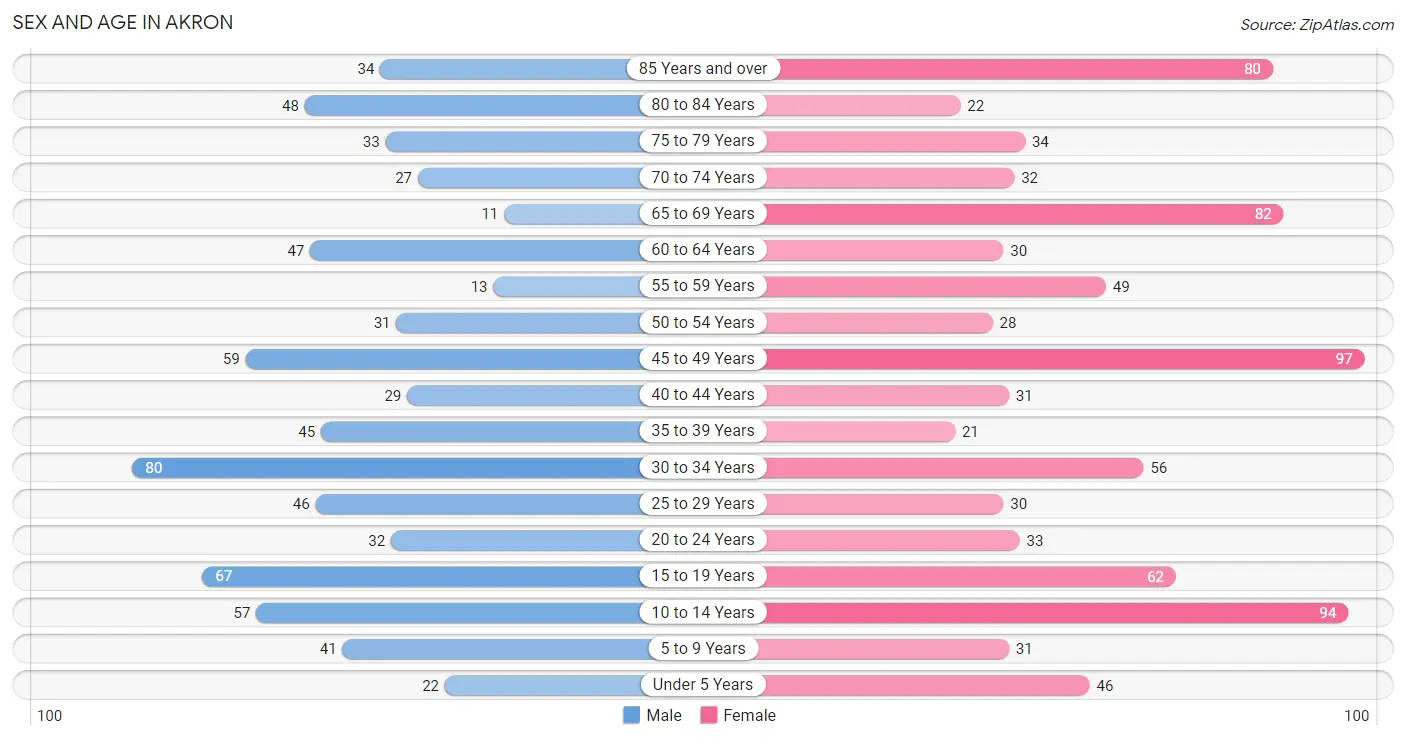
The most populous age groups in Akron are 30 to 34 Years (80 | 11.1%) for men and 45 to 49 Years (97 | 11.3%) for women.
| Age Bracket | Male | Female |
| Under 5 Years | 22 (3.0%) | 46 (5.4%) |
| 5 to 9 Years | 41 (5.7%) | 31 (3.6%) |
| 10 to 14 Years | 57 (7.9%) | 94 (11.0%) |
| 15 to 19 Years | 67 (9.3%) | 62 (7.2%) |
| 20 to 24 Years | 32 (4.4%) | 33 (3.8%) |
| 25 to 29 Years | 46 (6.4%) | 30 (3.5%) |
| 30 to 34 Years | 80 (11.1%) | 56 (6.5%) |
| 35 to 39 Years | 45 (6.2%) | 21 (2.5%) |
| 40 to 44 Years | 29 (4.0%) | 31 (3.6%) |
| 45 to 49 Years | 59 (8.2%) | 97 (11.3%) |
| 50 to 54 Years | 31 (4.3%) | 28 (3.3%) |
| 55 to 59 Years | 13 (1.8%) | 49 (5.7%) |
| 60 to 64 Years | 47 (6.5%) | 30 (3.5%) |
| 65 to 69 Years | 11 (1.5%) | 82 (9.6%) |
| 70 to 74 Years | 27 (3.7%) | 32 (3.7%) |
| 75 to 79 Years | 33 (4.6%) | 34 (4.0%) |
| 80 to 84 Years | 48 (6.7%) | 22 (2.6%) |
| 85 Years and over | 34 (4.7%) | 80 (9.3%) |
| Total | 722 (100.0%) | 858 (100.0%) |
Families and Households in Akron
Median Family Size in Akron
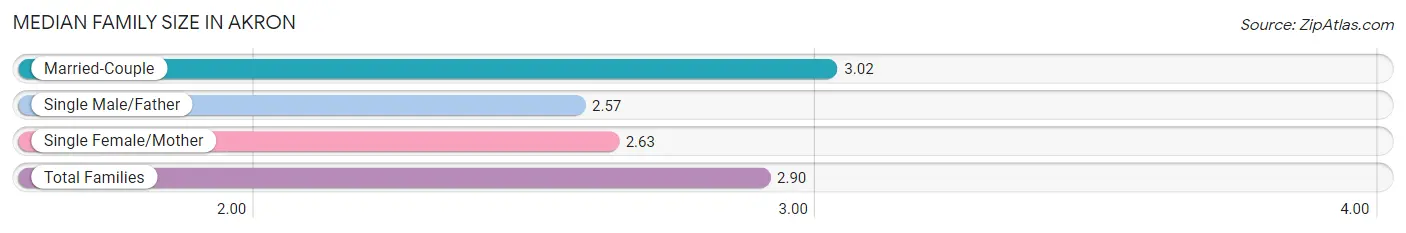
The median family size in Akron is 2.90 persons per family, with married-couple families (292 | 71.6%) accounting for the largest median family size of 3.02 persons per family. On the other hand, single male/father families (28 | 6.9%) represent the smallest median family size with 2.57 persons per family.
| Family Type | # Families | Family Size |
| Married-Couple | 292 (71.6%) | 3.02 |
| Single Male/Father | 28 (6.9%) | 2.57 |
| Single Female/Mother | 88 (21.6%) | 2.63 |
| Total Families | 408 (100.0%) | 2.90 |
Median Household Size in Akron
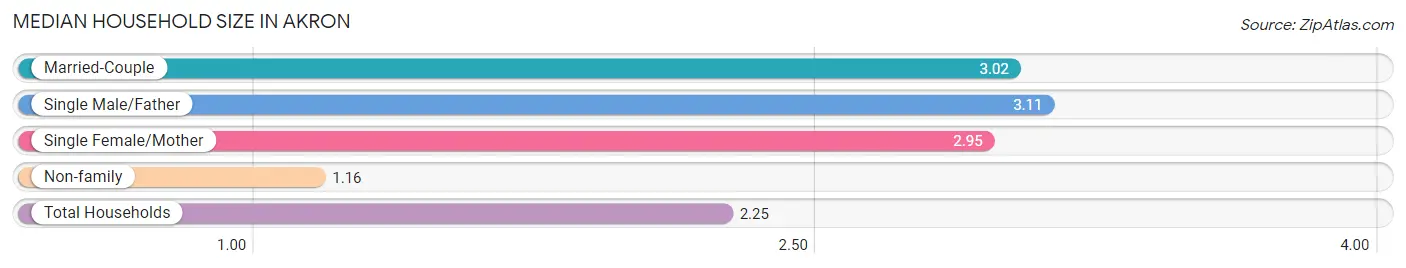
The median household size in Akron is 2.25 persons per household, with single male/father households (28 | 4.1%) accounting for the largest median household size of 3.11 persons per household. non-family households (284 | 41.0%) represent the smallest median household size with 1.16 persons per household.
| Household Type | # Households | Household Size |
| Married-Couple | 292 (42.2%) | 3.02 |
| Single Male/Father | 28 (4.1%) | 3.11 |
| Single Female/Mother | 88 (12.7%) | 2.95 |
| Non-family | 284 (41.0%) | 1.16 |
| Total Households | 692 (100.0%) | 2.25 |
Household Size by Marriage Status in Akron
Out of a total of 692 households in Akron, 408 (59.0%) are family households, while 284 (41.0%) are nonfamily households. The most numerous type of family households are 2-person households, comprising 206, and the most common type of nonfamily households are 1-person households, comprising 248.
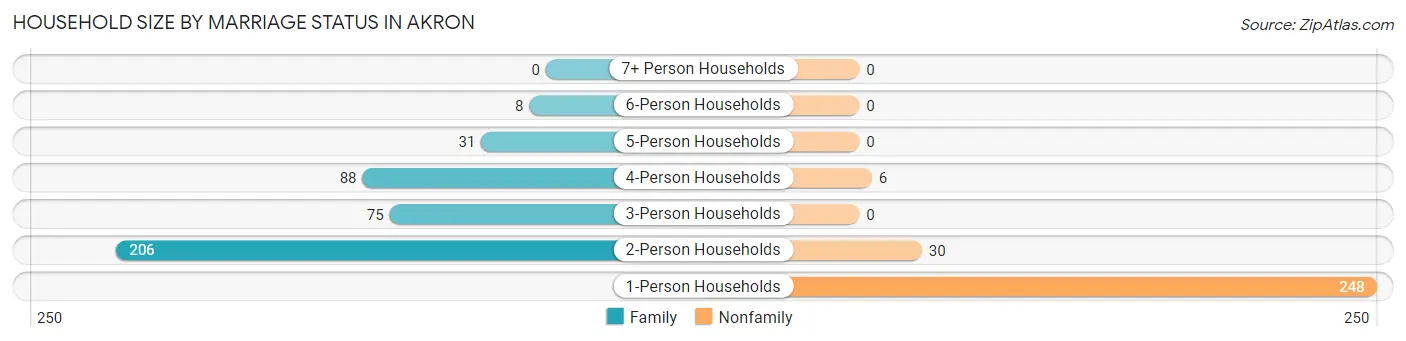
| Household Size | Family Households | Nonfamily Households |
| 1-Person Households | - | 248 (35.8%) |
| 2-Person Households | 206 (29.8%) | 30 (4.3%) |
| 3-Person Households | 75 (10.8%) | 0 (0.0%) |
| 4-Person Households | 88 (12.7%) | 6 (0.9%) |
| 5-Person Households | 31 (4.5%) | 0 (0.0%) |
| 6-Person Households | 8 (1.2%) | 0 (0.0%) |
| 7+ Person Households | 0 (0.0%) | 0 (0.0%) |
| Total | 408 (59.0%) | 284 (41.0%) |
Female Fertility in Akron
Fertility by Age in Akron
Average fertility rate in Akron is 15.0 births per 1,000 women. Women in the age bracket of 15 to 19 years have the highest fertility rate with 81.0 births per 1,000 women. Women in the age bracket of 15 to 19 years acount for 100.0% of all women with births.
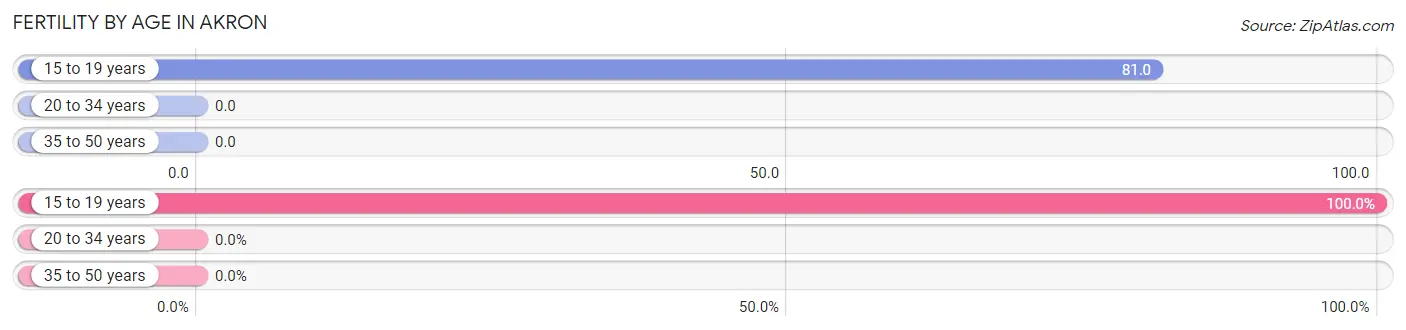
| Age Bracket | Women with Births | Births / 1,000 Women |
| 15 to 19 years | 5 (100.0%) | 81.0 |
| 20 to 34 years | 0 (0.0%) | 0.0 |
| 35 to 50 years | 0 (0.0%) | 0.0 |
| Total | 5 (100.0%) | 15.0 |
Fertility by Age by Marriage Status in Akron
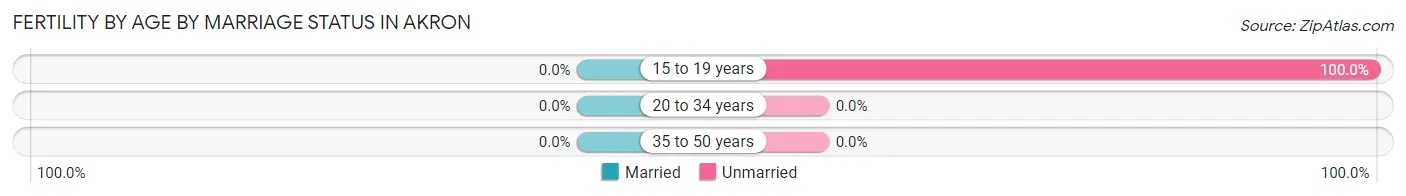
| Age Bracket | Married | Unmarried |
| 15 to 19 years | 0 (0.0%) | 5 (100.0%) |
| 20 to 34 years | 0 (0.0%) | 0 (0.0%) |
| 35 to 50 years | 0 (0.0%) | 0 (0.0%) |
| Total | 0 (0.0%) | 5 (100.0%) |
Fertility by Education in Akron
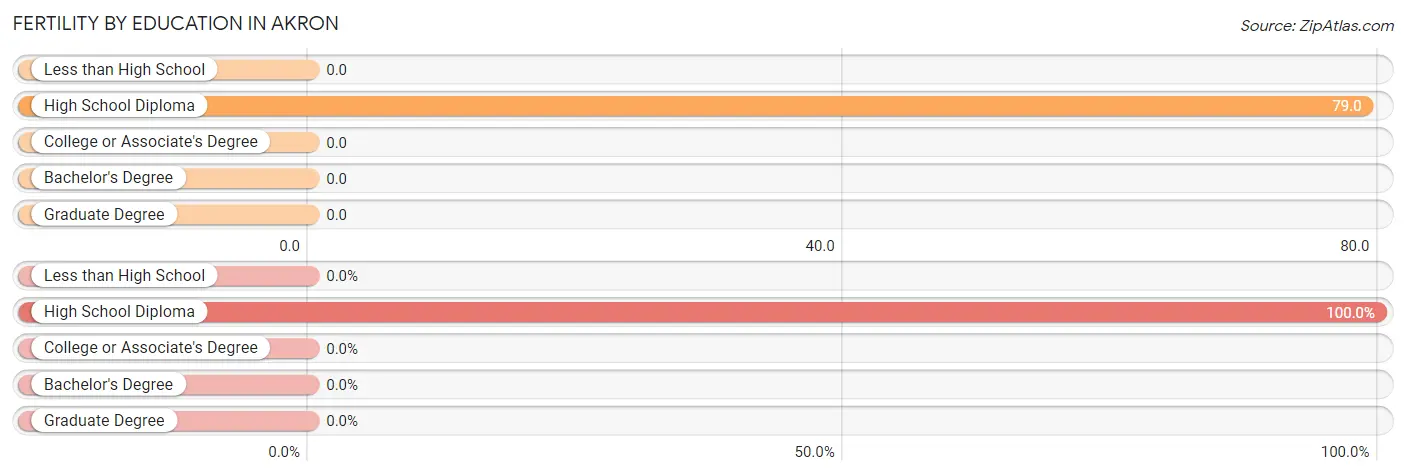
| Educational Attainment | Women with Births | Births / 1,000 Women |
| Less than High School | 0 (0.0%) | 0.0 |
| High School Diploma | 5 (100.0%) | 79.0 |
| College or Associate's Degree | 0 (0.0%) | 0.0 |
| Bachelor's Degree | 0 (0.0%) | 0.0 |
| Graduate Degree | 0 (0.0%) | 0.0 |
| Total | 5 (100.0%) | 15.0 |
Fertility by Education by Marriage Status in Akron
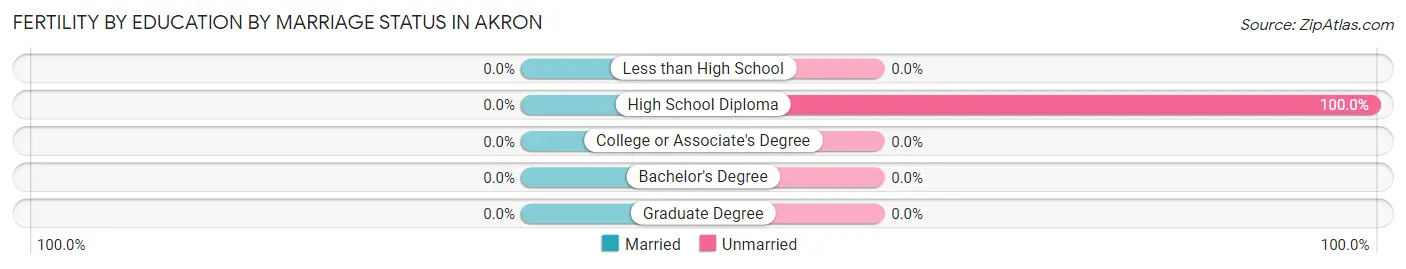
| Educational Attainment | Married | Unmarried |
| Less than High School | 0 (0.0%) | 0 (0.0%) |
| High School Diploma | 0 (0.0%) | 5 (100.0%) |
| College or Associate's Degree | 0 (0.0%) | 0 (0.0%) |
| Bachelor's Degree | 0 (0.0%) | 0 (0.0%) |
| Graduate Degree | 0 (0.0%) | 0 (0.0%) |
| Total | 0 (0.0%) | 5 (100.0%) |
Employment Characteristics in Akron
Employment by Class of Employer in Akron
Among the 781 employed individuals in Akron, private company employees (580 | 74.3%), not-for-profit organizations (75 | 9.6%), and self-employed (incorporated) (39 | 5.0%) make up the most common classes of employment.
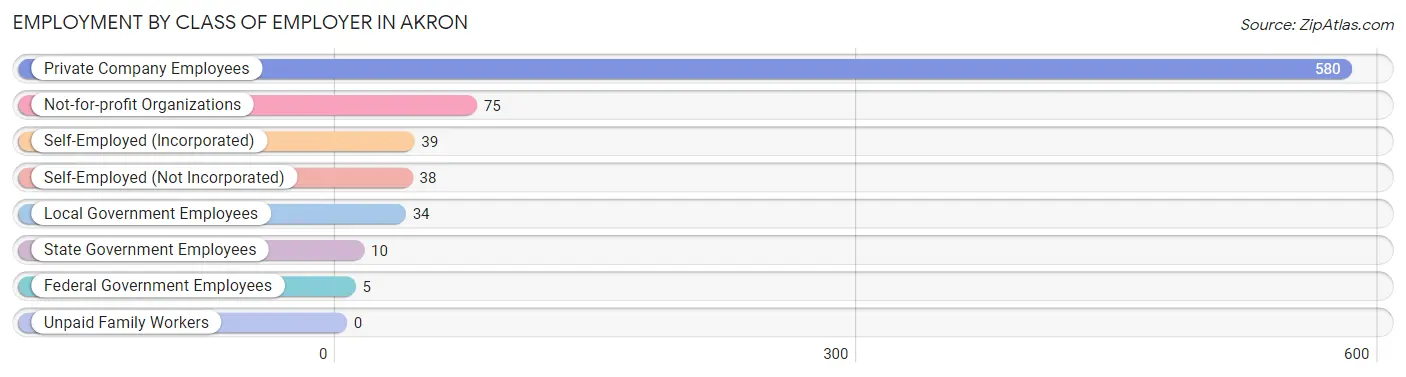
| Employer Class | # Employees | % Employees |
| Private Company Employees | 580 | 74.3% |
| Self-Employed (Incorporated) | 39 | 5.0% |
| Self-Employed (Not Incorporated) | 38 | 4.9% |
| Not-for-profit Organizations | 75 | 9.6% |
| Local Government Employees | 34 | 4.3% |
| State Government Employees | 10 | 1.3% |
| Federal Government Employees | 5 | 0.6% |
| Unpaid Family Workers | 0 | 0.0% |
| Total | 781 | 100.0% |
Employment Status by Age in Akron
According to the labor force statistics for Akron, out of the total population over 16 years of age (1,263), 62.4% or 788 individuals are in the labor force, with 0.9% or 7 of them unemployed. The age group with the highest labor force participation rate is 20 to 24 years, with 100.0% or 65 individuals in the labor force. Within the labor force, the 30 to 34 years age range has the highest percentage of unemployed individuals, with 3.3% or 4 of them being unemployed.
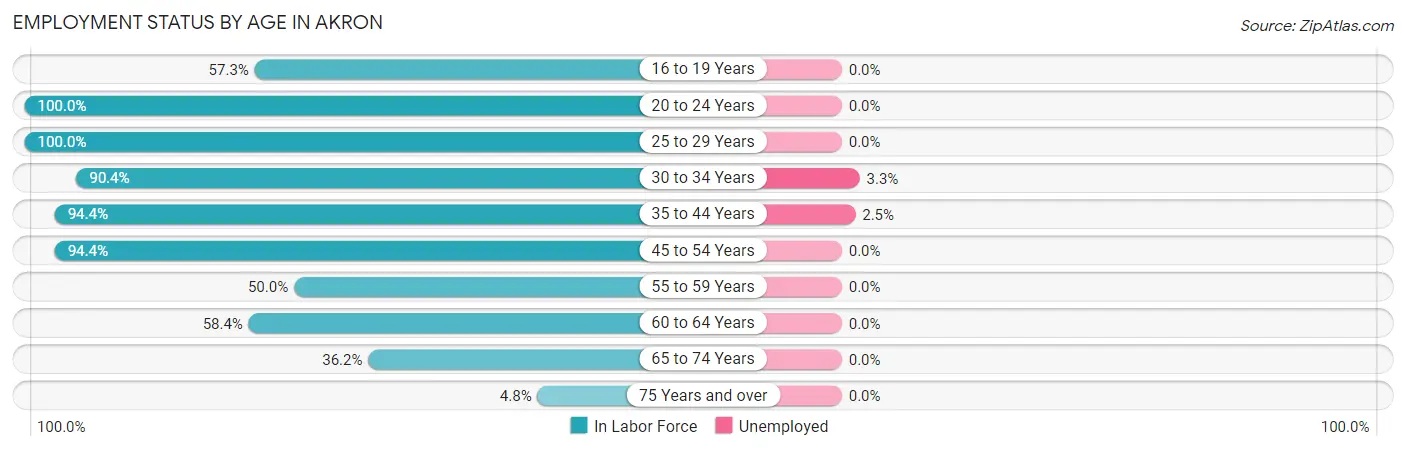
| Age Bracket | In Labor Force | Unemployed |
| 16 to 19 Years | 59 (57.3%) | 0 (0.0%) |
| 20 to 24 Years | 65 (100.0%) | 0 (0.0%) |
| 25 to 29 Years | 76 (100.0%) | 0 (0.0%) |
| 30 to 34 Years | 123 (90.4%) | 4 (3.3%) |
| 35 to 44 Years | 119 (94.4%) | 3 (2.5%) |
| 45 to 54 Years | 203 (94.4%) | 0 (0.0%) |
| 55 to 59 Years | 31 (50.0%) | 0 (0.0%) |
| 60 to 64 Years | 45 (58.4%) | 0 (0.0%) |
| 65 to 74 Years | 55 (36.2%) | 0 (0.0%) |
| 75 Years and over | 12 (4.8%) | 0 (0.0%) |
| Total | 788 (62.4%) | 7 (0.9%) |
Employment Status by Educational Attainment in Akron
According to labor force statistics for Akron, 86.3% of individuals (597) out of the total population between 25 and 64 years of age (692) are in the labor force, with 1.2% or 7 of them being unemployed. The group with the highest labor force participation rate are those with the educational attainment of bachelor's degree or higher, with 95.2% or 120 individuals in the labor force. Within the labor force, individuals with high school diploma education have the highest percentage of unemployment, with 1.7% or 4 of them being unemployed.
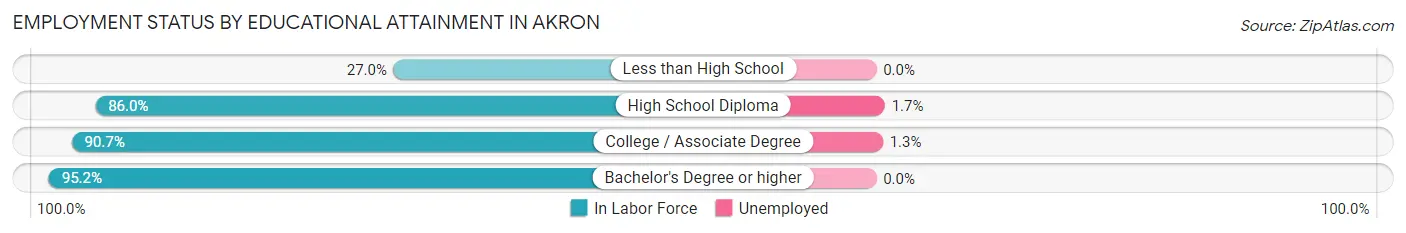
| Educational Attainment | In Labor Force | Unemployed |
| Less than High School | 10 (27.0%) | 0 (0.0%) |
| High School Diploma | 234 (86.0%) | 5 (1.7%) |
| College / Associate Degree | 233 (90.7%) | 3 (1.3%) |
| Bachelor's Degree or higher | 120 (95.2%) | 0 (0.0%) |
| Total | 597 (86.3%) | 8 (1.2%) |
Employment Occupations by Sex in Akron
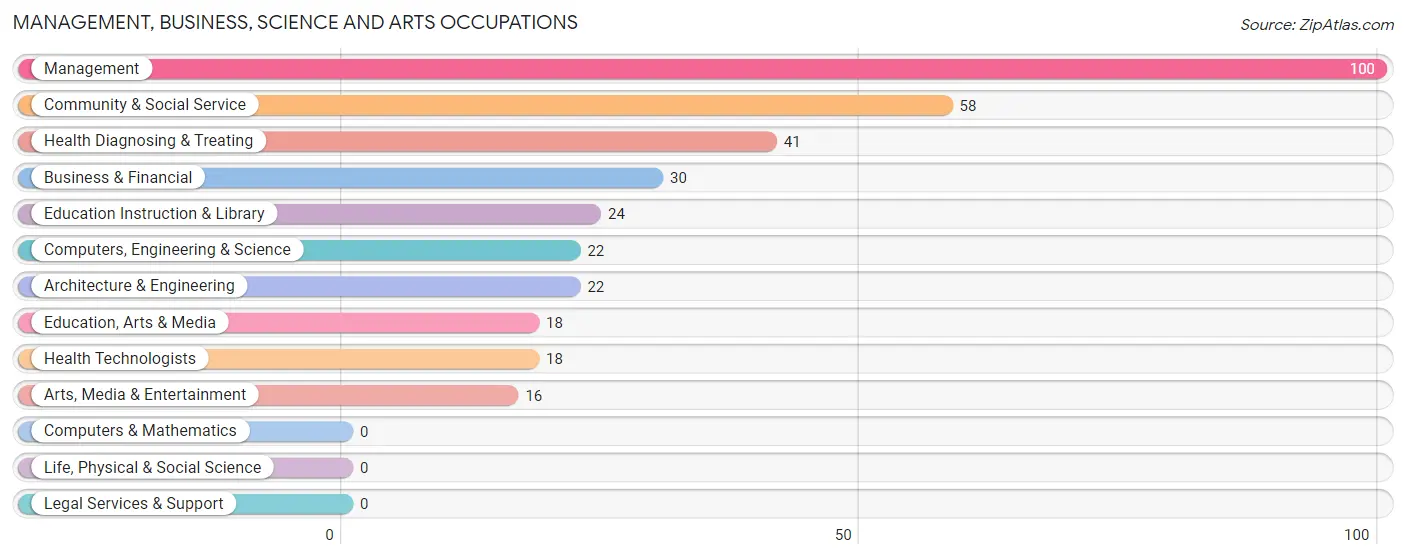
Management, Business, Science and Arts Occupations
The most common Management, Business, Science and Arts occupations in Akron are Management (100 | 12.8%), Community & Social Service (58 | 7.4%), Health Diagnosing & Treating (41 | 5.2%), Business & Financial (30 | 3.8%), and Education Instruction & Library (24 | 3.1%).
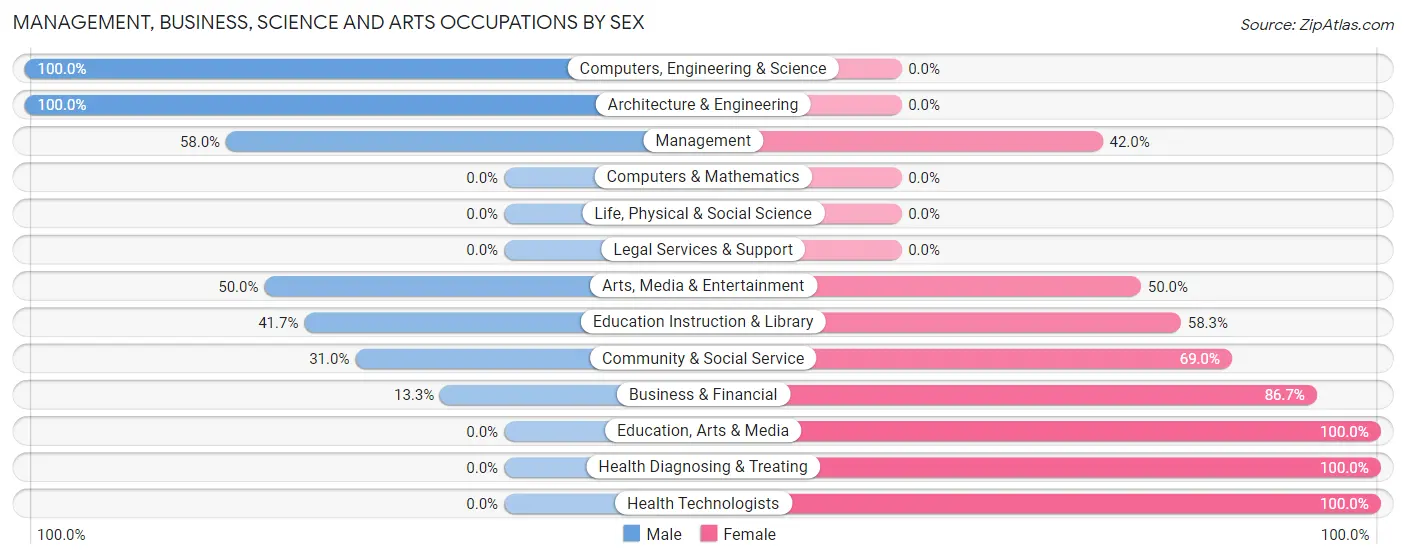
Management, Business, Science and Arts Occupations by Sex
Within the Management, Business, Science and Arts occupations in Akron, the most male-oriented occupations are Computers, Engineering & Science (100.0%), Architecture & Engineering (100.0%), and Management (58.0%), while the most female-oriented occupations are Education, Arts & Media (100.0%), Health Diagnosing & Treating (100.0%), and Health Technologists (100.0%).
| Occupation | Male | Female |
| Management | 58 (58.0%) | 42 (42.0%) |
| Business & Financial | 4 (13.3%) | 26 (86.7%) |
| Computers, Engineering & Science | 22 (100.0%) | 0 (0.0%) |
| Computers & Mathematics | 0 (0.0%) | 0 (0.0%) |
| Architecture & Engineering | 22 (100.0%) | 0 (0.0%) |
| Life, Physical & Social Science | 0 (0.0%) | 0 (0.0%) |
| Community & Social Service | 18 (31.0%) | 40 (69.0%) |
| Education, Arts & Media | 0 (0.0%) | 18 (100.0%) |
| Legal Services & Support | 0 (0.0%) | 0 (0.0%) |
| Education Instruction & Library | 10 (41.7%) | 14 (58.3%) |
| Arts, Media & Entertainment | 8 (50.0%) | 8 (50.0%) |
| Health Diagnosing & Treating | 0 (0.0%) | 41 (100.0%) |
| Health Technologists | 0 (0.0%) | 18 (100.0%) |
| Total (Category) | 102 (40.6%) | 149 (59.4%) |
| Total (Overall) | 415 (53.1%) | 366 (46.9%) |
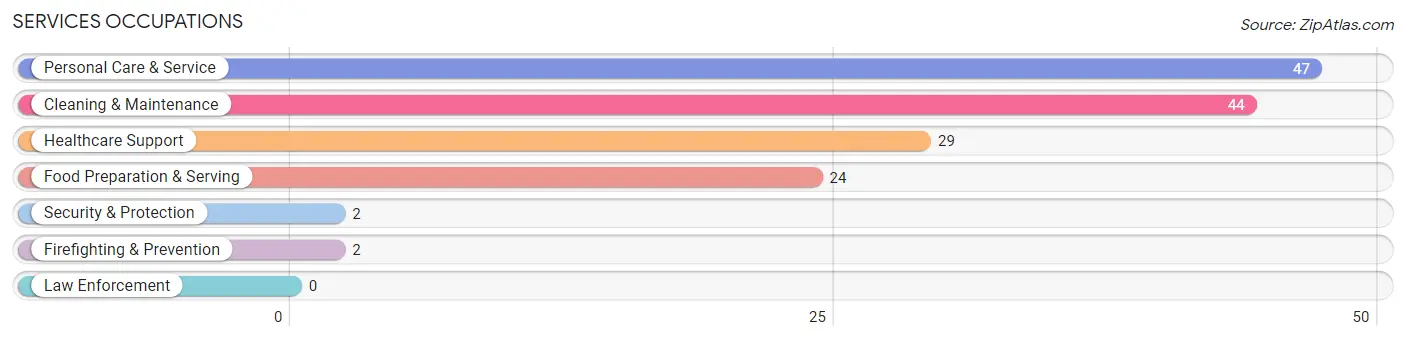
Services Occupations
The most common Services occupations in Akron are Personal Care & Service (47 | 6.0%), Cleaning & Maintenance (44 | 5.6%), Healthcare Support (29 | 3.7%), Food Preparation & Serving (24 | 3.1%), and Security & Protection (2 | 0.3%).
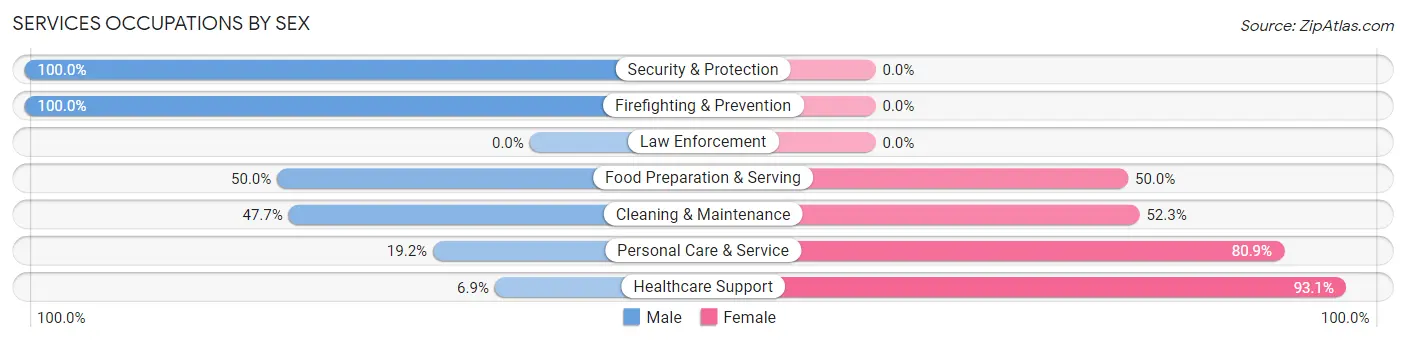
Services Occupations by Sex
Within the Services occupations in Akron, the most male-oriented occupations are Security & Protection (100.0%), Firefighting & Prevention (100.0%), and Food Preparation & Serving (50.0%), while the most female-oriented occupations are Healthcare Support (93.1%), Personal Care & Service (80.8%), and Cleaning & Maintenance (52.3%).
| Occupation | Male | Female |
| Healthcare Support | 2 (6.9%) | 27 (93.1%) |
| Security & Protection | 2 (100.0%) | 0 (0.0%) |
| Firefighting & Prevention | 2 (100.0%) | 0 (0.0%) |
| Law Enforcement | 0 (0.0%) | 0 (0.0%) |
| Food Preparation & Serving | 12 (50.0%) | 12 (50.0%) |
| Cleaning & Maintenance | 21 (47.7%) | 23 (52.3%) |
| Personal Care & Service | 9 (19.2%) | 38 (80.8%) |
| Total (Category) | 46 (31.5%) | 100 (68.5%) |
| Total (Overall) | 415 (53.1%) | 366 (46.9%) |
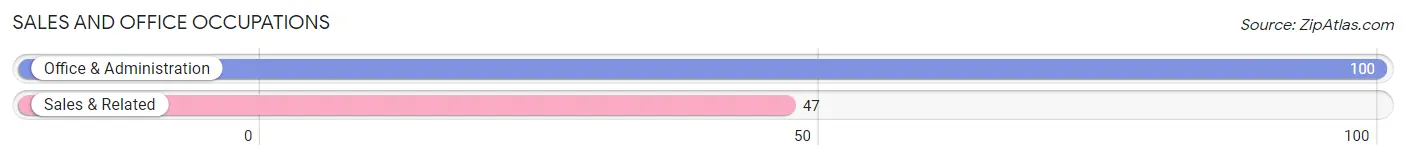
Sales and Office Occupations
The most common Sales and Office occupations in Akron are Office & Administration (100 | 12.8%), and Sales & Related (47 | 6.0%).
Sales and Office Occupations by Sex
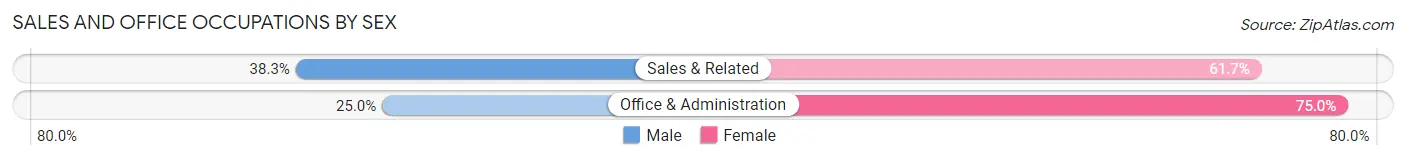
| Occupation | Male | Female |
| Sales & Related | 18 (38.3%) | 29 (61.7%) |
| Office & Administration | 25 (25.0%) | 75 (75.0%) |
| Total (Category) | 43 (29.2%) | 104 (70.8%) |
| Total (Overall) | 415 (53.1%) | 366 (46.9%) |
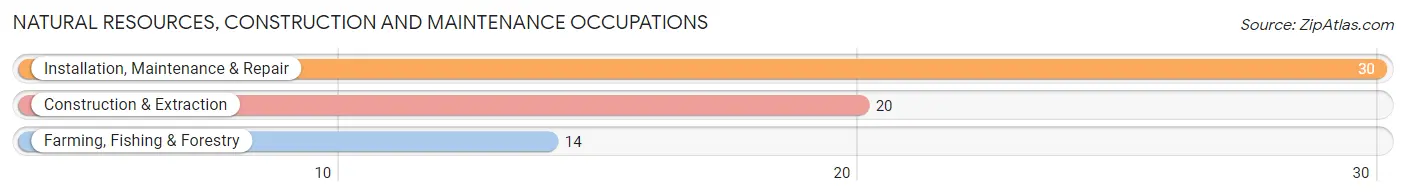
Natural Resources, Construction and Maintenance Occupations
The most common Natural Resources, Construction and Maintenance occupations in Akron are Installation, Maintenance & Repair (30 | 3.8%), Construction & Extraction (20 | 2.6%), and Farming, Fishing & Forestry (14 | 1.8%).
Natural Resources, Construction and Maintenance Occupations by Sex
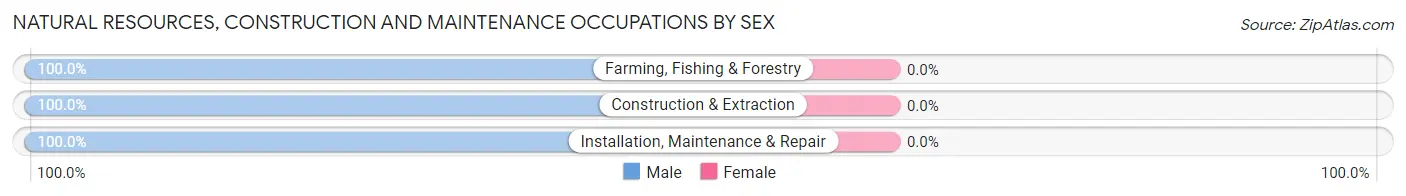
| Occupation | Male | Female |
| Farming, Fishing & Forestry | 14 (100.0%) | 0 (0.0%) |
| Construction & Extraction | 20 (100.0%) | 0 (0.0%) |
| Installation, Maintenance & Repair | 30 (100.0%) | 0 (0.0%) |
| Total (Category) | 64 (100.0%) | 0 (0.0%) |
| Total (Overall) | 415 (53.1%) | 366 (46.9%) |
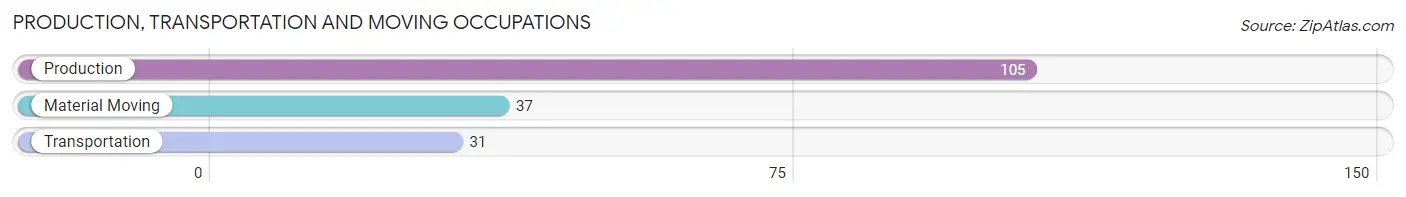
Production, Transportation and Moving Occupations
The most common Production, Transportation and Moving occupations in Akron are Production (105 | 13.4%), Material Moving (37 | 4.7%), and Transportation (31 | 4.0%).
Production, Transportation and Moving Occupations by Sex
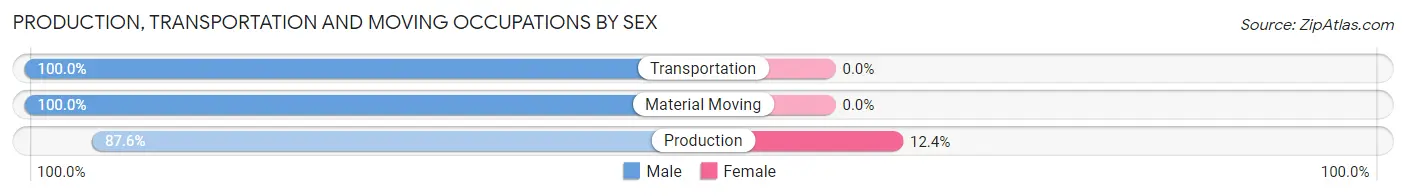
| Occupation | Male | Female |
| Production | 92 (87.6%) | 13 (12.4%) |
| Transportation | 31 (100.0%) | 0 (0.0%) |
| Material Moving | 37 (100.0%) | 0 (0.0%) |
| Total (Category) | 160 (92.5%) | 13 (7.5%) |
| Total (Overall) | 415 (53.1%) | 366 (46.9%) |
Employment Industries by Sex in Akron
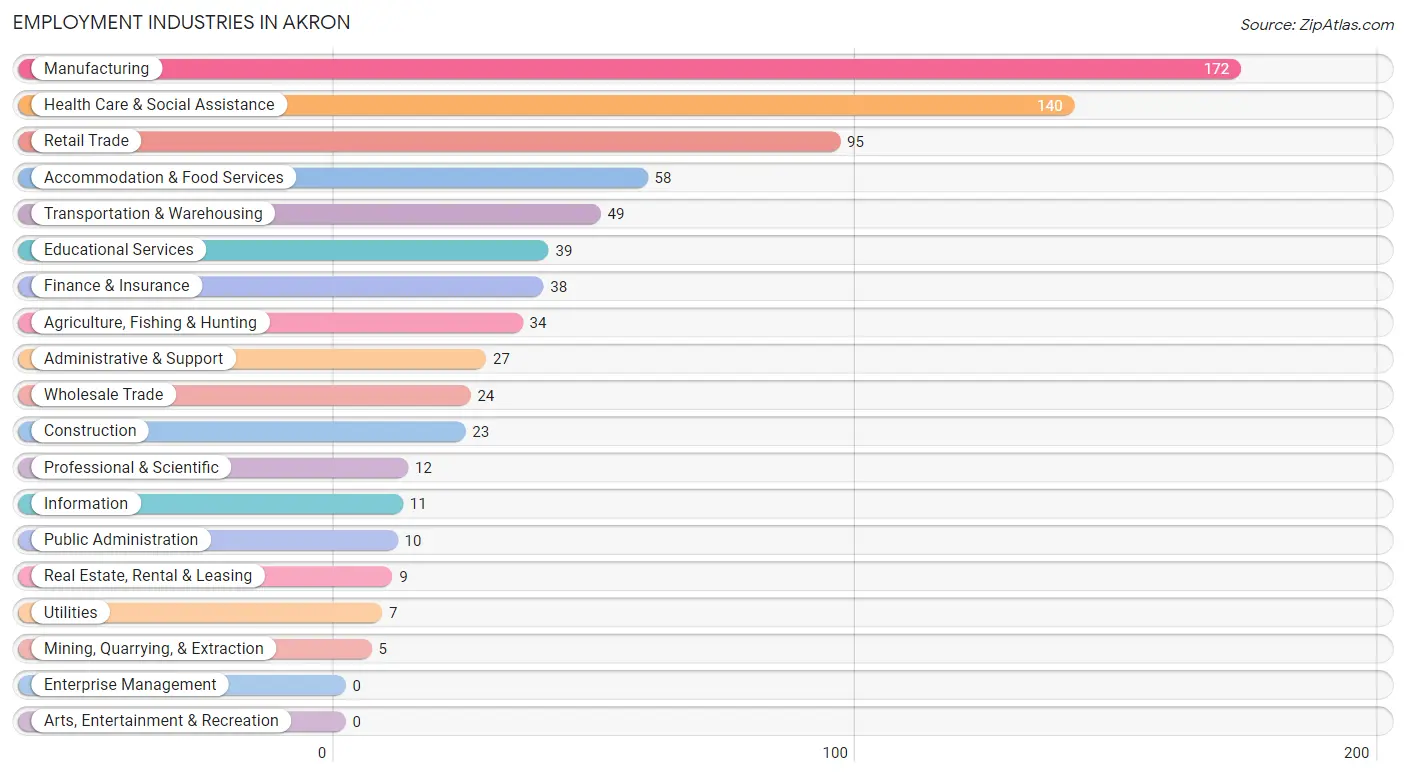
Employment Industries in Akron
The major employment industries in Akron include Manufacturing (172 | 22.0%), Health Care & Social Assistance (140 | 17.9%), Retail Trade (95 | 12.2%), Accommodation & Food Services (58 | 7.4%), and Transportation & Warehousing (49 | 6.3%).
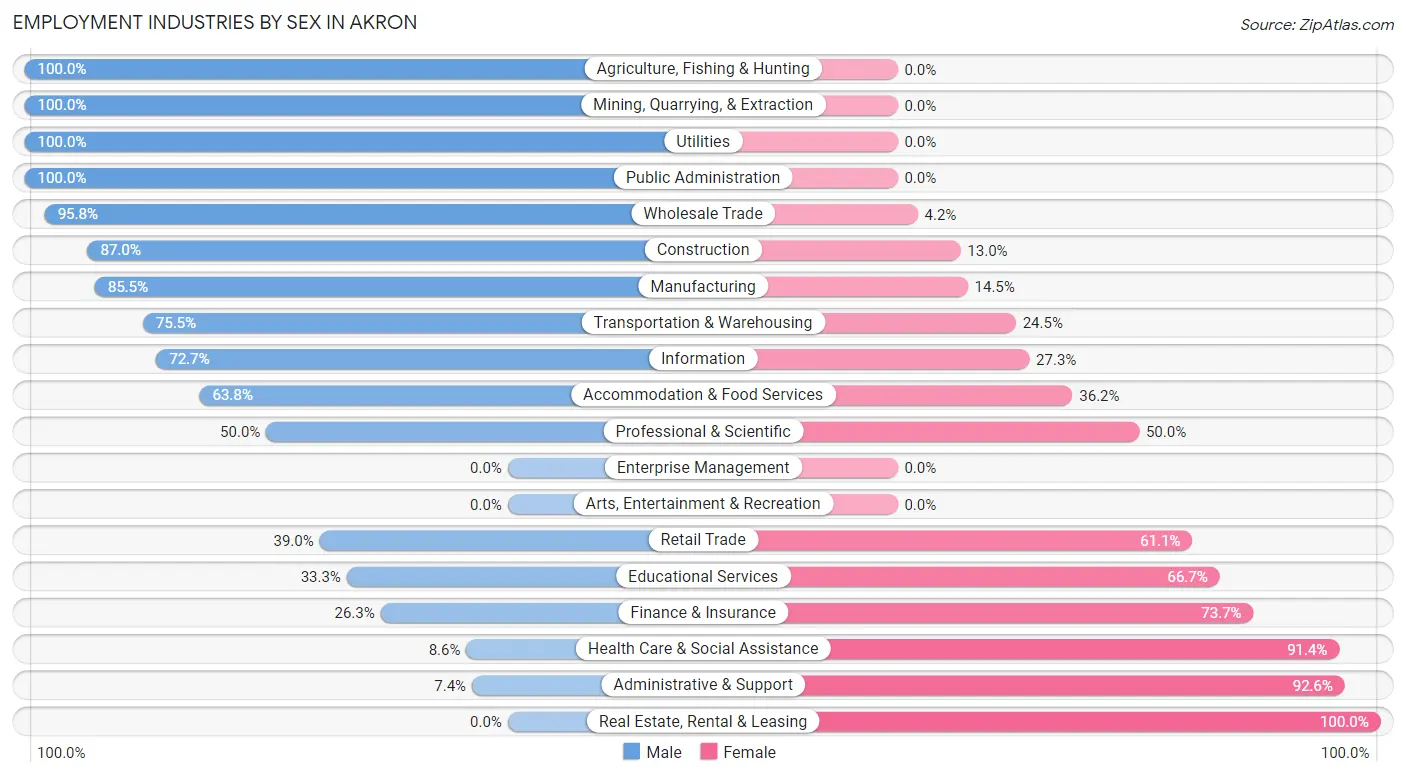
Employment Industries by Sex in Akron
The Akron industries that see more men than women are Agriculture, Fishing & Hunting (100.0%), Mining, Quarrying, & Extraction (100.0%), and Utilities (100.0%), whereas the industries that tend to have a higher number of women are Real Estate, Rental & Leasing (100.0%), Administrative & Support (92.6%), and Health Care & Social Assistance (91.4%).
| Industry | Male | Female |
| Agriculture, Fishing & Hunting | 34 (100.0%) | 0 (0.0%) |
| Mining, Quarrying, & Extraction | 5 (100.0%) | 0 (0.0%) |
| Construction | 20 (87.0%) | 3 (13.0%) |
| Manufacturing | 147 (85.5%) | 25 (14.5%) |
| Wholesale Trade | 23 (95.8%) | 1 (4.2%) |
| Retail Trade | 37 (39.0%) | 58 (61.1%) |
| Transportation & Warehousing | 37 (75.5%) | 12 (24.5%) |
| Utilities | 7 (100.0%) | 0 (0.0%) |
| Information | 8 (72.7%) | 3 (27.3%) |
| Finance & Insurance | 10 (26.3%) | 28 (73.7%) |
| Real Estate, Rental & Leasing | 0 (0.0%) | 9 (100.0%) |
| Professional & Scientific | 6 (50.0%) | 6 (50.0%) |
| Enterprise Management | 0 (0.0%) | 0 (0.0%) |
| Administrative & Support | 2 (7.4%) | 25 (92.6%) |
| Educational Services | 13 (33.3%) | 26 (66.7%) |
| Health Care & Social Assistance | 12 (8.6%) | 128 (91.4%) |
| Arts, Entertainment & Recreation | 0 (0.0%) | 0 (0.0%) |
| Accommodation & Food Services | 37 (63.8%) | 21 (36.2%) |
| Public Administration | 10 (100.0%) | 0 (0.0%) |
| Total | 415 (53.1%) | 366 (46.9%) |
Education in Akron
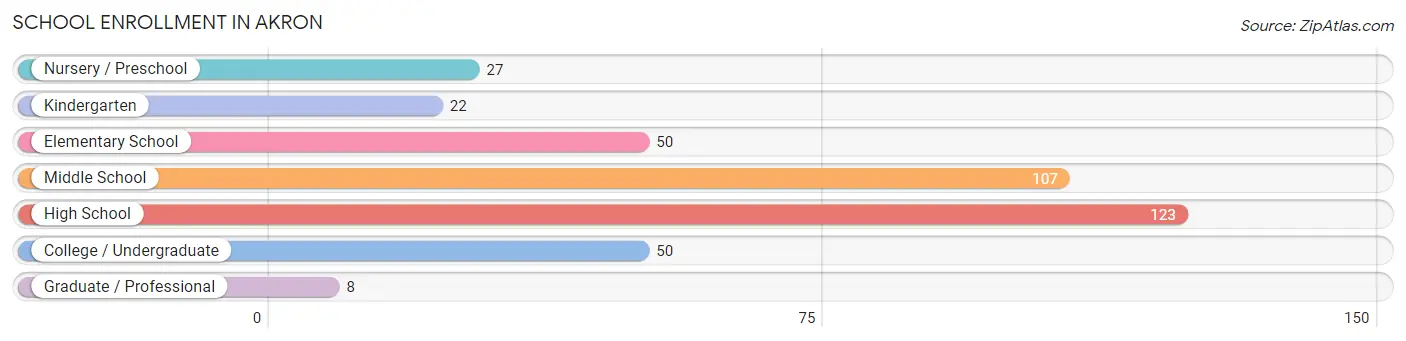
School Enrollment in Akron
The most common levels of schooling among the 387 students in Akron are high school (123 | 31.8%), middle school (107 | 27.7%), and elementary school (50 | 12.9%).
| School Level | # Students | % Students |
| Nursery / Preschool | 27 | 7.0% |
| Kindergarten | 22 | 5.7% |
| Elementary School | 50 | 12.9% |
| Middle School | 107 | 27.7% |
| High School | 123 | 31.8% |
| College / Undergraduate | 50 | 12.9% |
| Graduate / Professional | 8 | 2.1% |
| Total | 387 | 100.0% |
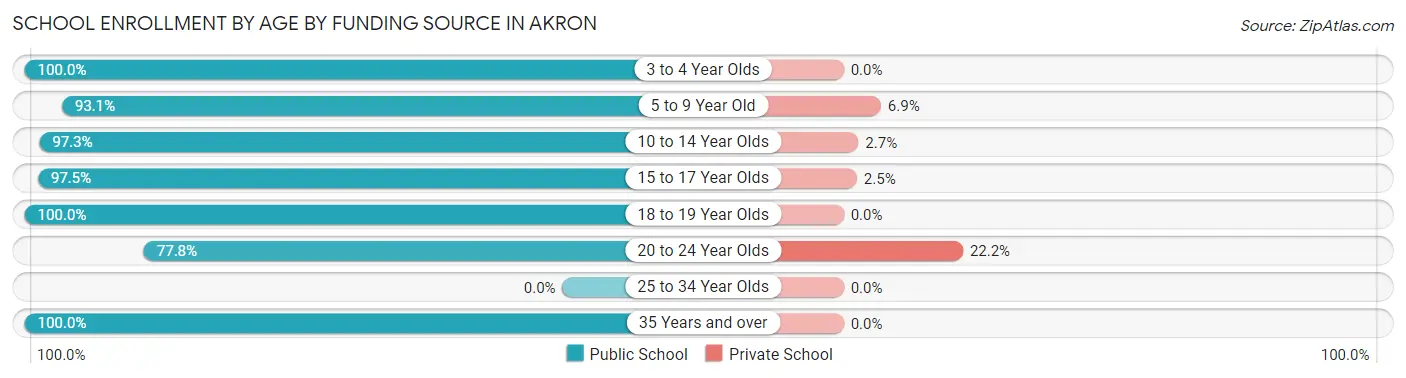
School Enrollment by Age by Funding Source in Akron
Out of a total of 387 students who are enrolled in schools in Akron, 19 (4.9%) attend a private institution, while the remaining 368 (95.1%) are enrolled in public schools. The age group of 20 to 24 year olds has the highest likelihood of being enrolled in private schools, with 8 (22.2% in the age bracket) enrolled. Conversely, the age group of 3 to 4 year olds has the lowest likelihood of being enrolled in a private school, with 10 (100.0% in the age bracket) attending a public institution.
| Age Bracket | Public School | Private School |
| 3 to 4 Year Olds | 10 (100.0%) | 0 (0.0%) |
| 5 to 9 Year Old | 67 (93.1%) | 5 (6.9%) |
| 10 to 14 Year Olds | 142 (97.3%) | 4 (2.7%) |
| 15 to 17 Year Olds | 79 (97.5%) | 2 (2.5%) |
| 18 to 19 Year Olds | 24 (100.0%) | 0 (0.0%) |
| 20 to 24 Year Olds | 28 (77.8%) | 8 (22.2%) |
| 25 to 34 Year Olds | 0 (0.0%) | 0 (0.0%) |
| 35 Years and over | 18 (100.0%) | 0 (0.0%) |
| Total | 368 (95.1%) | 19 (4.9%) |
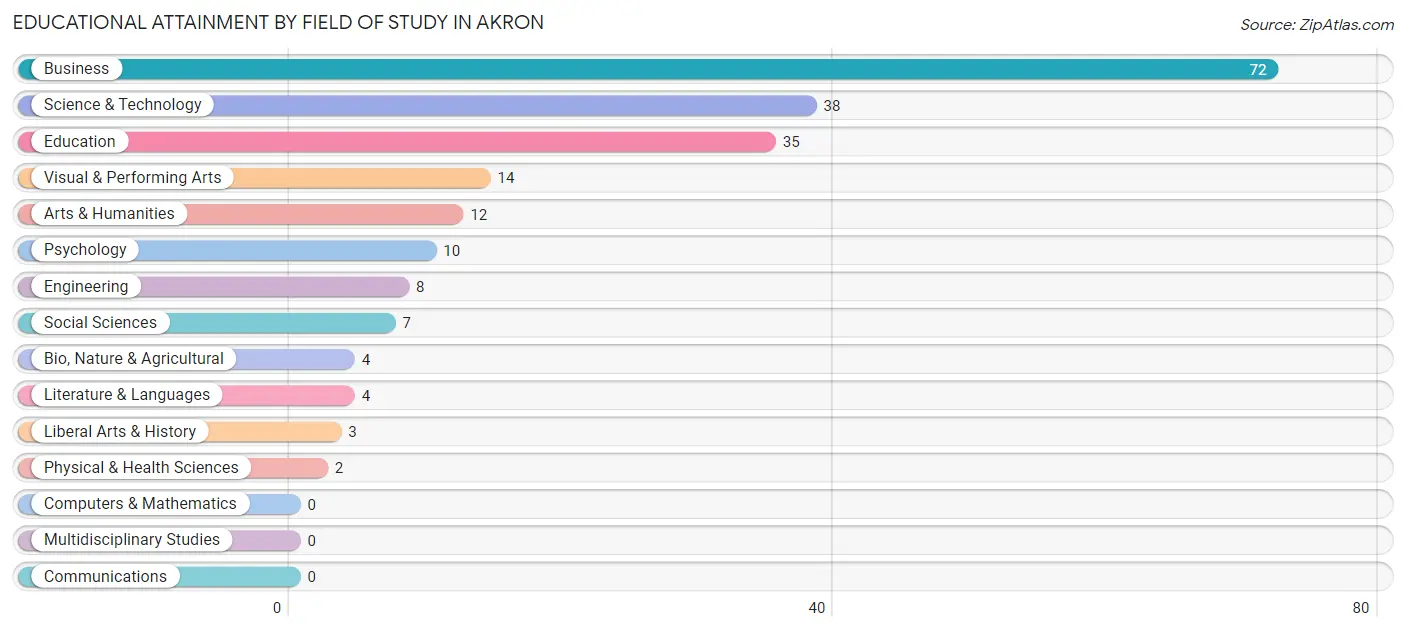
Educational Attainment by Field of Study in Akron
Business (72 | 34.4%), science & technology (38 | 18.2%), education (35 | 16.8%), visual & performing arts (14 | 6.7%), and arts & humanities (12 | 5.7%) are the most common fields of study among 209 individuals in Akron who have obtained a bachelor's degree or higher.
| Field of Study | # Graduates | % Graduates |
| Computers & Mathematics | 0 | 0.0% |
| Bio, Nature & Agricultural | 4 | 1.9% |
| Physical & Health Sciences | 2 | 1.0% |
| Psychology | 10 | 4.8% |
| Social Sciences | 7 | 3.4% |
| Engineering | 8 | 3.8% |
| Multidisciplinary Studies | 0 | 0.0% |
| Science & Technology | 38 | 18.2% |
| Business | 72 | 34.4% |
| Education | 35 | 16.8% |
| Literature & Languages | 4 | 1.9% |
| Liberal Arts & History | 3 | 1.4% |
| Visual & Performing Arts | 14 | 6.7% |
| Communications | 0 | 0.0% |
| Arts & Humanities | 12 | 5.7% |
| Total | 209 | 100.0% |
Transportation & Commute in Akron
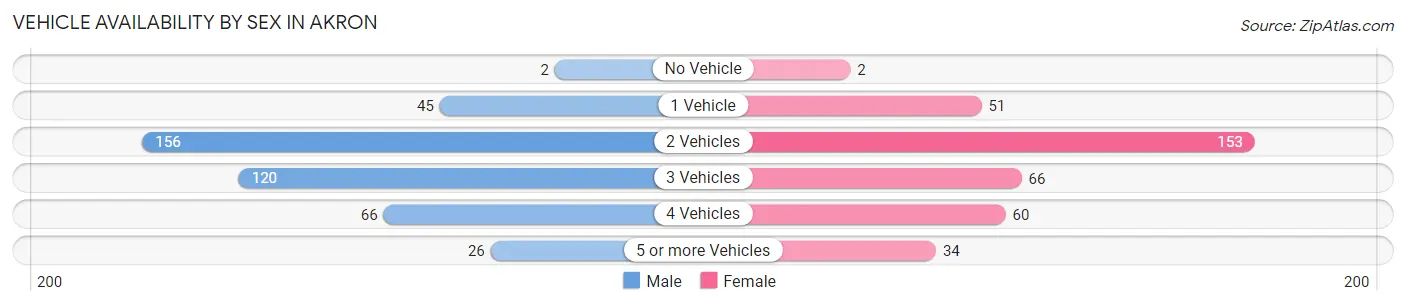
Vehicle Availability by Sex in Akron
The most prevalent vehicle ownership categories in Akron are males with 2 vehicles (156, accounting for 37.6%) and females with 2 vehicles (153, making up 42.6%).
| Vehicles Available | Male | Female |
| No Vehicle | 2 (0.5%) | 2 (0.5%) |
| 1 Vehicle | 45 (10.8%) | 51 (13.9%) |
| 2 Vehicles | 156 (37.6%) | 153 (41.8%) |
| 3 Vehicles | 120 (28.9%) | 66 (18.0%) |
| 4 Vehicles | 66 (15.9%) | 60 (16.4%) |
| 5 or more Vehicles | 26 (6.3%) | 34 (9.3%) |
| Total | 415 (100.0%) | 366 (100.0%) |
Commute Time in Akron
The most frequently occuring commute durations in Akron are less than 5 minutes (184 commuters, 25.6%), 45 to 59 minutes (89 commuters, 12.4%), and 30 to 34 minutes (87 commuters, 12.1%).
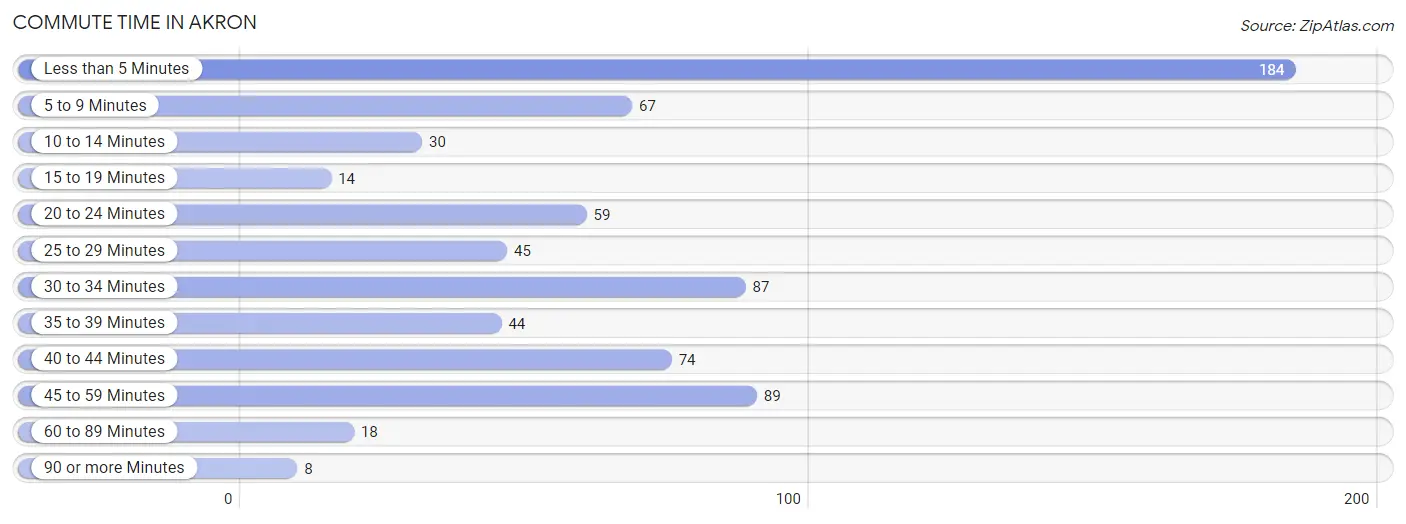
| Commute Time | # Commuters | % Commuters |
| Less than 5 Minutes | 184 | 25.6% |
| 5 to 9 Minutes | 67 | 9.3% |
| 10 to 14 Minutes | 30 | 4.2% |
| 15 to 19 Minutes | 14 | 1.9% |
| 20 to 24 Minutes | 59 | 8.2% |
| 25 to 29 Minutes | 45 | 6.3% |
| 30 to 34 Minutes | 87 | 12.1% |
| 35 to 39 Minutes | 44 | 6.1% |
| 40 to 44 Minutes | 74 | 10.3% |
| 45 to 59 Minutes | 89 | 12.4% |
| 60 to 89 Minutes | 18 | 2.5% |
| 90 or more Minutes | 8 | 1.1% |
Commute Time by Sex in Akron
The most common commute times in Akron are less than 5 minutes (86 commuters, 22.1%) for males and less than 5 minutes (98 commuters, 29.8%) for females.
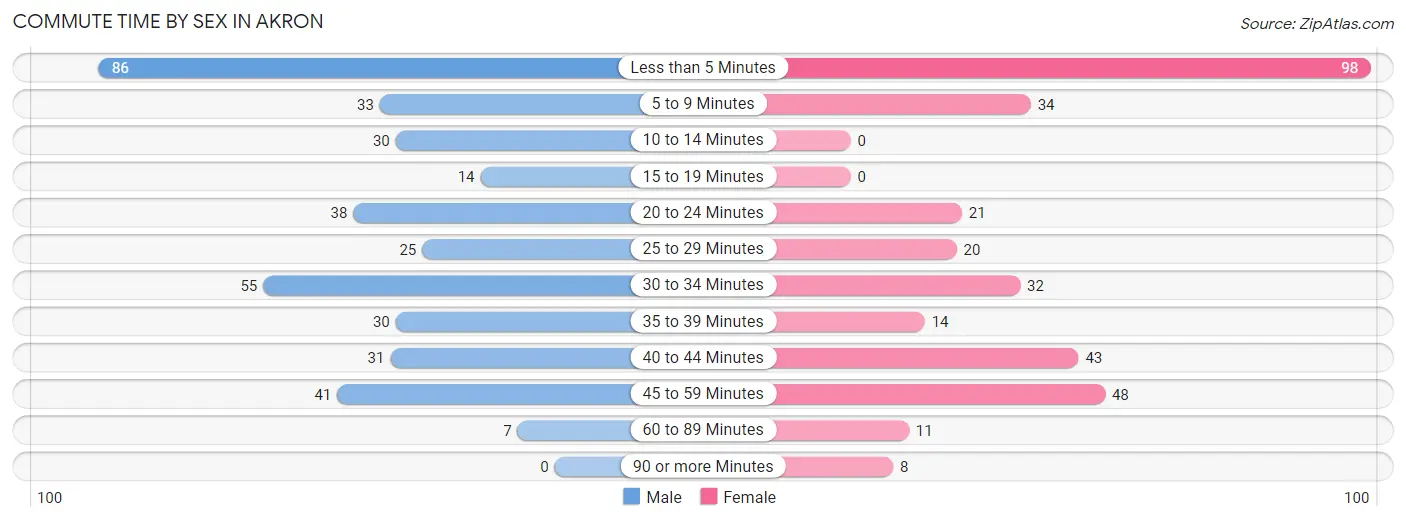
| Commute Time | Male | Female |
| Less than 5 Minutes | 86 (22.1%) | 98 (29.8%) |
| 5 to 9 Minutes | 33 (8.5%) | 34 (10.3%) |
| 10 to 14 Minutes | 30 (7.7%) | 0 (0.0%) |
| 15 to 19 Minutes | 14 (3.6%) | 0 (0.0%) |
| 20 to 24 Minutes | 38 (9.7%) | 21 (6.4%) |
| 25 to 29 Minutes | 25 (6.4%) | 20 (6.1%) |
| 30 to 34 Minutes | 55 (14.1%) | 32 (9.7%) |
| 35 to 39 Minutes | 30 (7.7%) | 14 (4.3%) |
| 40 to 44 Minutes | 31 (8.0%) | 43 (13.1%) |
| 45 to 59 Minutes | 41 (10.5%) | 48 (14.6%) |
| 60 to 89 Minutes | 7 (1.8%) | 11 (3.3%) |
| 90 or more Minutes | 0 (0.0%) | 8 (2.4%) |
Time of Departure to Work by Sex in Akron
The most frequent times of departure to work in Akron are 12:00 AM to 4:59 AM (76, 19.5%) for males and 7:00 AM to 7:29 AM (79, 24.0%) for females.
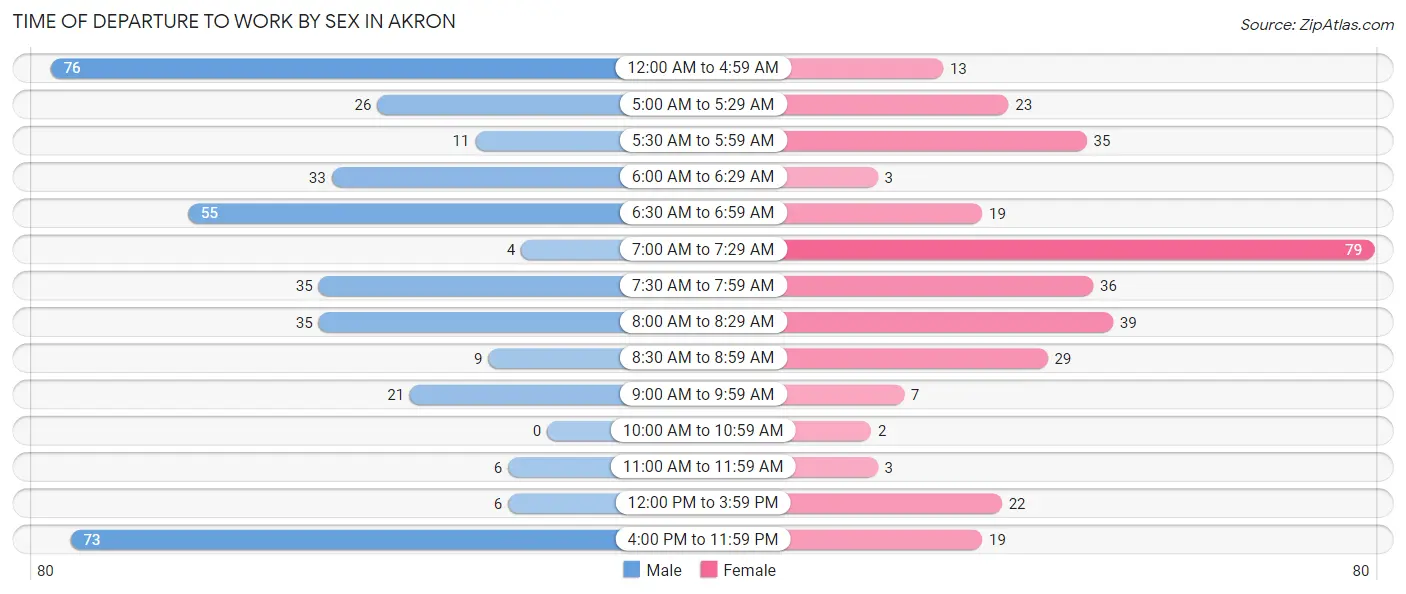
| Time of Departure | Male | Female |
| 12:00 AM to 4:59 AM | 76 (19.5%) | 13 (4.0%) |
| 5:00 AM to 5:29 AM | 26 (6.7%) | 23 (7.0%) |
| 5:30 AM to 5:59 AM | 11 (2.8%) | 35 (10.6%) |
| 6:00 AM to 6:29 AM | 33 (8.5%) | 3 (0.9%) |
| 6:30 AM to 6:59 AM | 55 (14.1%) | 19 (5.8%) |
| 7:00 AM to 7:29 AM | 4 (1.0%) | 79 (24.0%) |
| 7:30 AM to 7:59 AM | 35 (9.0%) | 36 (10.9%) |
| 8:00 AM to 8:29 AM | 35 (9.0%) | 39 (11.8%) |
| 8:30 AM to 8:59 AM | 9 (2.3%) | 29 (8.8%) |
| 9:00 AM to 9:59 AM | 21 (5.4%) | 7 (2.1%) |
| 10:00 AM to 10:59 AM | 0 (0.0%) | 2 (0.6%) |
| 11:00 AM to 11:59 AM | 6 (1.5%) | 3 (0.9%) |
| 12:00 PM to 3:59 PM | 6 (1.5%) | 22 (6.7%) |
| 4:00 PM to 11:59 PM | 73 (18.7%) | 19 (5.8%) |
| Total | 390 (100.0%) | 329 (100.0%) |
Housing Occupancy in Akron
Occupancy by Ownership in Akron
Of the total 692 dwellings in Akron, owner-occupied units account for 491 (71.0%), while renter-occupied units make up 201 (29.0%).
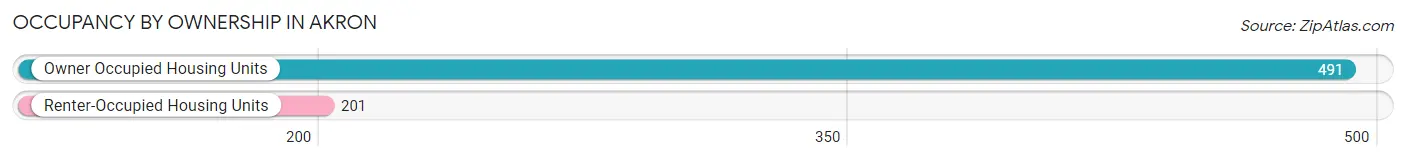
| Occupancy | # Housing Units | % Housing Units |
| Owner Occupied Housing Units | 491 | 71.0% |
| Renter-Occupied Housing Units | 201 | 29.0% |
| Total Occupied Housing Units | 692 | 100.0% |
Occupancy by Household Size in Akron
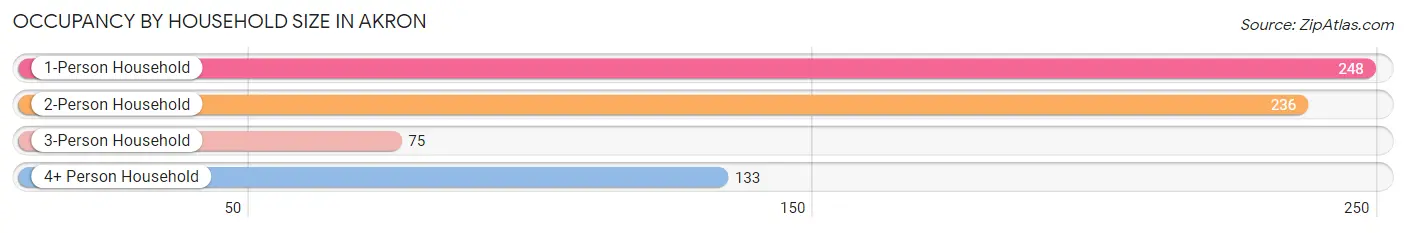
| Household Size | # Housing Units | % Housing Units |
| 1-Person Household | 248 | 35.8% |
| 2-Person Household | 236 | 34.1% |
| 3-Person Household | 75 | 10.8% |
| 4+ Person Household | 133 | 19.2% |
| Total Housing Units | 692 | 100.0% |
Occupancy by Ownership by Household Size in Akron
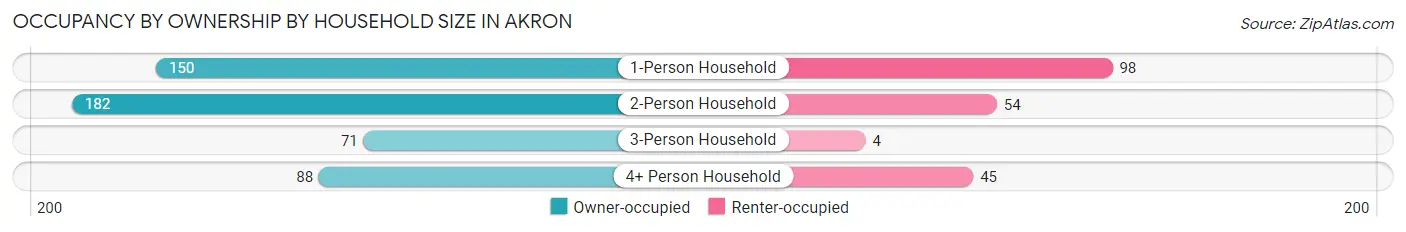
| Household Size | Owner-occupied | Renter-occupied |
| 1-Person Household | 150 (60.5%) | 98 (39.5%) |
| 2-Person Household | 182 (77.1%) | 54 (22.9%) |
| 3-Person Household | 71 (94.7%) | 4 (5.3%) |
| 4+ Person Household | 88 (66.2%) | 45 (33.8%) |
| Total Housing Units | 491 (71.0%) | 201 (29.0%) |
Occupancy by Educational Attainment in Akron
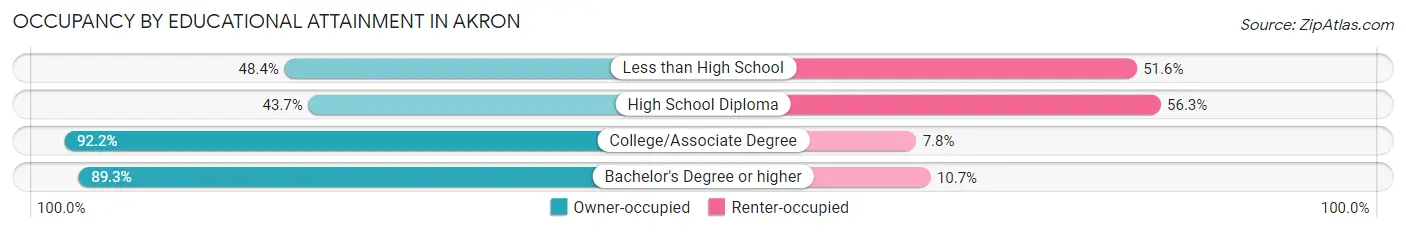
| Household Size | Owner-occupied | Renter-occupied |
| Less than High School | 31 (48.4%) | 33 (51.6%) |
| High School Diploma | 104 (43.7%) | 134 (56.3%) |
| College/Associate Degree | 247 (92.2%) | 21 (7.8%) |
| Bachelor's Degree or higher | 109 (89.3%) | 13 (10.7%) |
Occupancy by Age of Householder in Akron
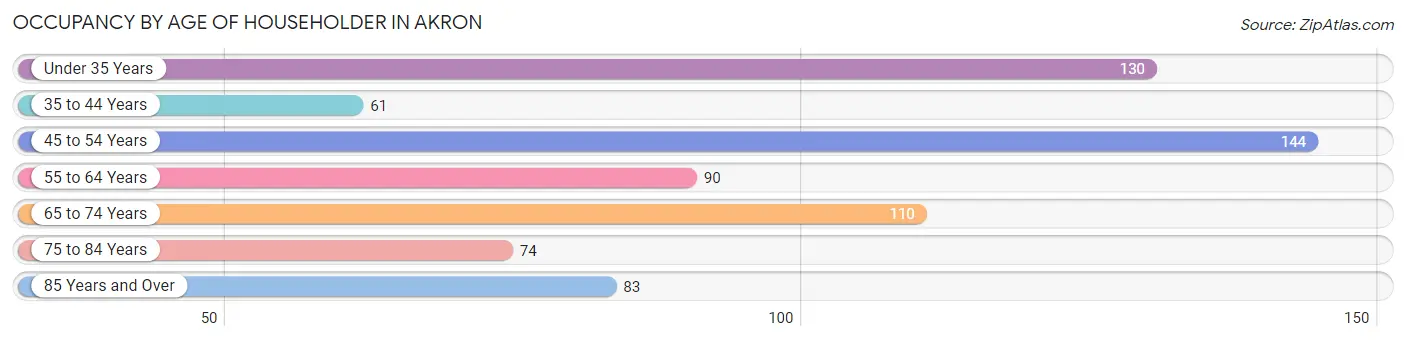
| Age Bracket | # Households | % Households |
| Under 35 Years | 130 | 18.8% |
| 35 to 44 Years | 61 | 8.8% |
| 45 to 54 Years | 144 | 20.8% |
| 55 to 64 Years | 90 | 13.0% |
| 65 to 74 Years | 110 | 15.9% |
| 75 to 84 Years | 74 | 10.7% |
| 85 Years and Over | 83 | 12.0% |
| Total | 692 | 100.0% |
Housing Finances in Akron
Median Income by Occupancy in Akron
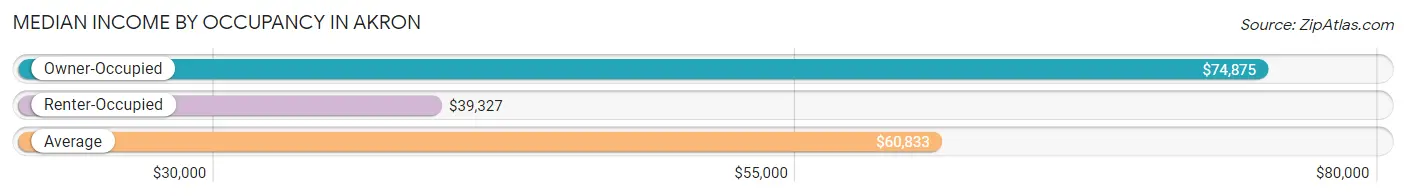
| Occupancy Type | # Households | Median Income |
| Owner-Occupied | 491 (71.0%) | $74,875 |
| Renter-Occupied | 201 (29.0%) | $39,327 |
| Average | 692 (100.0%) | $60,833 |
Occupancy by Householder Income Bracket in Akron
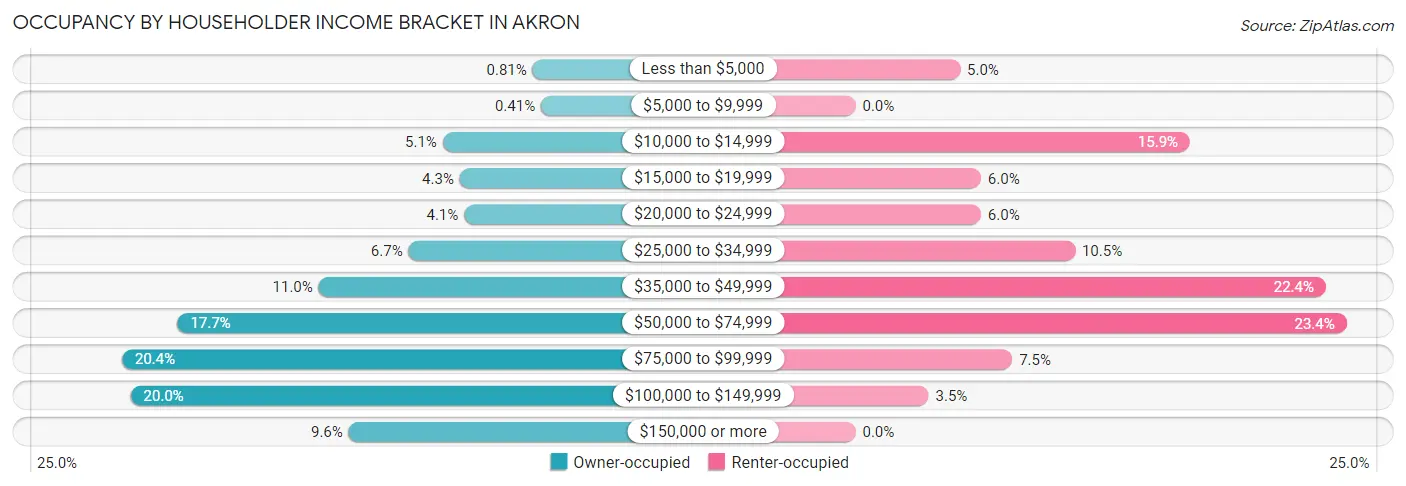
| Income Bracket | Owner-occupied | Renter-occupied |
| Less than $5,000 | 4 (0.8%) | 10 (5.0%) |
| $5,000 to $9,999 | 2 (0.4%) | 0 (0.0%) |
| $10,000 to $14,999 | 25 (5.1%) | 32 (15.9%) |
| $15,000 to $19,999 | 21 (4.3%) | 12 (6.0%) |
| $20,000 to $24,999 | 20 (4.1%) | 12 (6.0%) |
| $25,000 to $34,999 | 33 (6.7%) | 21 (10.4%) |
| $35,000 to $49,999 | 54 (11.0%) | 45 (22.4%) |
| $50,000 to $74,999 | 87 (17.7%) | 47 (23.4%) |
| $75,000 to $99,999 | 100 (20.4%) | 15 (7.5%) |
| $100,000 to $149,999 | 98 (20.0%) | 7 (3.5%) |
| $150,000 or more | 47 (9.6%) | 0 (0.0%) |
| Total | 491 (100.0%) | 201 (100.0%) |
Monthly Housing Cost Tiers in Akron
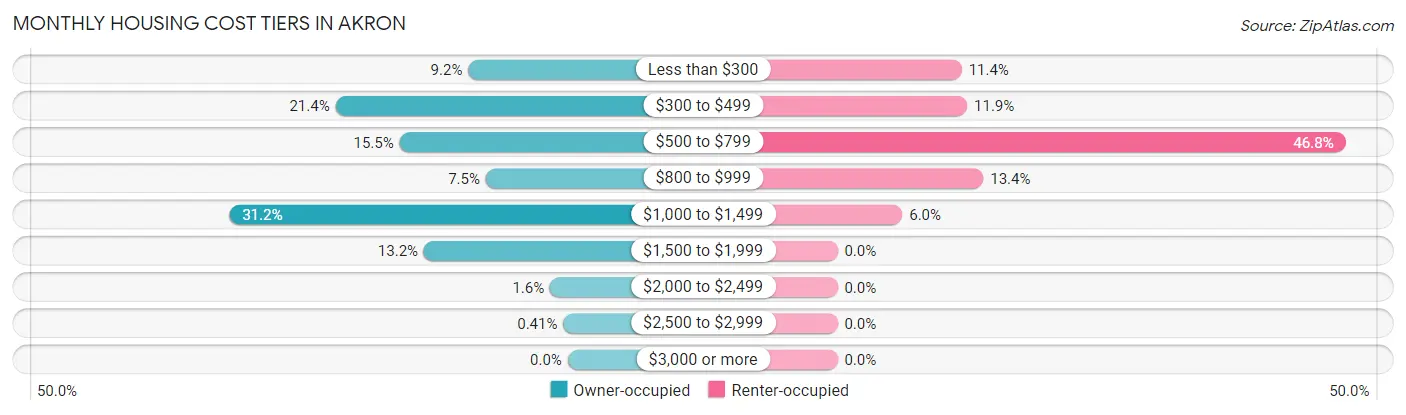
| Monthly Cost | Owner-occupied | Renter-occupied |
| Less than $300 | 45 (9.2%) | 23 (11.4%) |
| $300 to $499 | 105 (21.4%) | 24 (11.9%) |
| $500 to $799 | 76 (15.5%) | 94 (46.8%) |
| $800 to $999 | 37 (7.5%) | 27 (13.4%) |
| $1,000 to $1,499 | 153 (31.2%) | 12 (6.0%) |
| $1,500 to $1,999 | 65 (13.2%) | 0 (0.0%) |
| $2,000 to $2,499 | 8 (1.6%) | 0 (0.0%) |
| $2,500 to $2,999 | 2 (0.4%) | 0 (0.0%) |
| $3,000 or more | 0 (0.0%) | 0 (0.0%) |
| Total | 491 (100.0%) | 201 (100.0%) |
Physical Housing Characteristics in Akron
Housing Structures in Akron
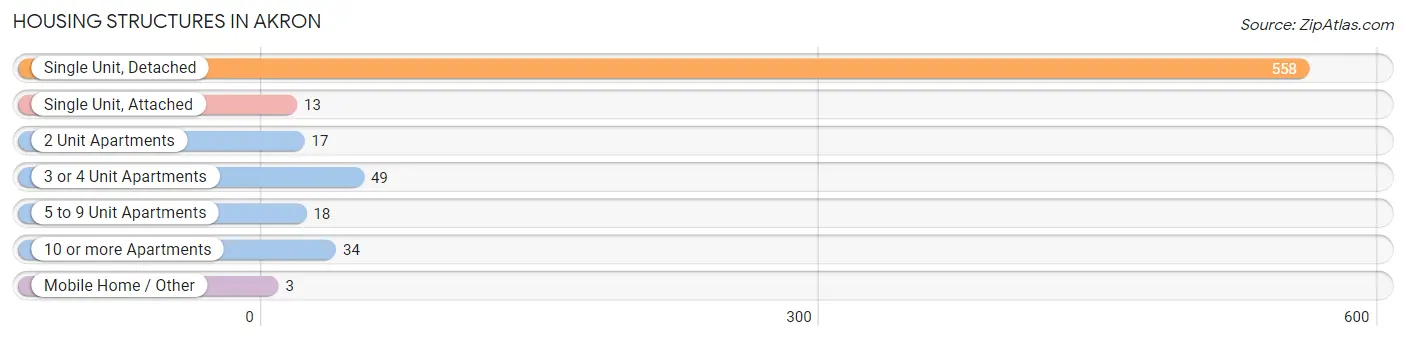
| Structure Type | # Housing Units | % Housing Units |
| Single Unit, Detached | 558 | 80.6% |
| Single Unit, Attached | 13 | 1.9% |
| 2 Unit Apartments | 17 | 2.5% |
| 3 or 4 Unit Apartments | 49 | 7.1% |
| 5 to 9 Unit Apartments | 18 | 2.6% |
| 10 or more Apartments | 34 | 4.9% |
| Mobile Home / Other | 3 | 0.4% |
| Total | 692 | 100.0% |
Housing Structures by Occupancy in Akron
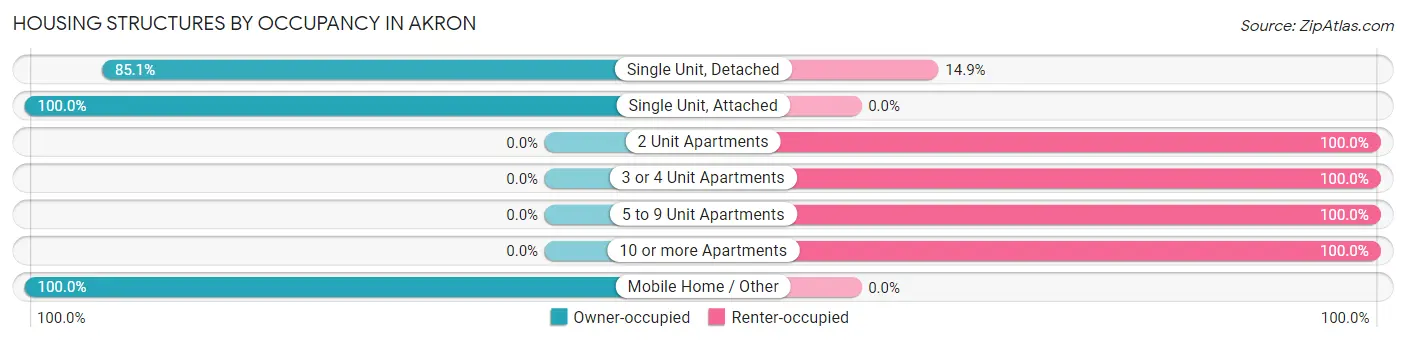
| Structure Type | Owner-occupied | Renter-occupied |
| Single Unit, Detached | 475 (85.1%) | 83 (14.9%) |
| Single Unit, Attached | 13 (100.0%) | 0 (0.0%) |
| 2 Unit Apartments | 0 (0.0%) | 17 (100.0%) |
| 3 or 4 Unit Apartments | 0 (0.0%) | 49 (100.0%) |
| 5 to 9 Unit Apartments | 0 (0.0%) | 18 (100.0%) |
| 10 or more Apartments | 0 (0.0%) | 34 (100.0%) |
| Mobile Home / Other | 3 (100.0%) | 0 (0.0%) |
| Total | 491 (71.0%) | 201 (29.0%) |
Housing Structures by Number of Rooms in Akron
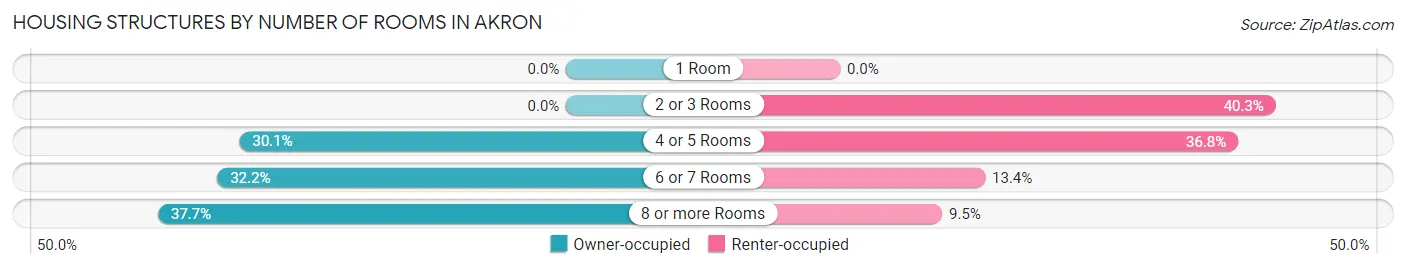
| Number of Rooms | Owner-occupied | Renter-occupied |
| 1 Room | 0 (0.0%) | 0 (0.0%) |
| 2 or 3 Rooms | 0 (0.0%) | 81 (40.3%) |
| 4 or 5 Rooms | 148 (30.1%) | 74 (36.8%) |
| 6 or 7 Rooms | 158 (32.2%) | 27 (13.4%) |
| 8 or more Rooms | 185 (37.7%) | 19 (9.5%) |
| Total | 491 (100.0%) | 201 (100.0%) |
Housing Structure by Heating Type in Akron
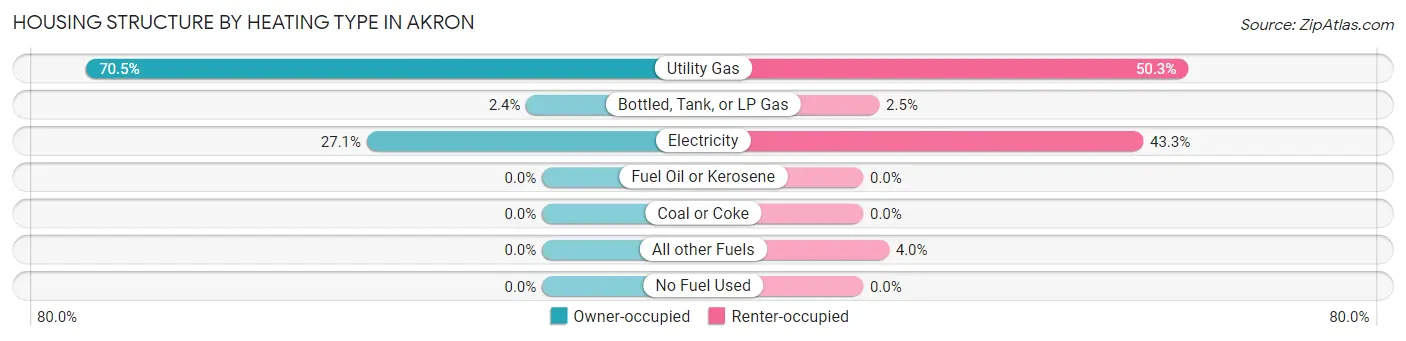
| Heating Type | Owner-occupied | Renter-occupied |
| Utility Gas | 346 (70.5%) | 101 (50.2%) |
| Bottled, Tank, or LP Gas | 12 (2.4%) | 5 (2.5%) |
| Electricity | 133 (27.1%) | 87 (43.3%) |
| Fuel Oil or Kerosene | 0 (0.0%) | 0 (0.0%) |
| Coal or Coke | 0 (0.0%) | 0 (0.0%) |
| All other Fuels | 0 (0.0%) | 8 (4.0%) |
| No Fuel Used | 0 (0.0%) | 0 (0.0%) |
| Total | 491 (100.0%) | 201 (100.0%) |
Household Vehicle Usage in Akron
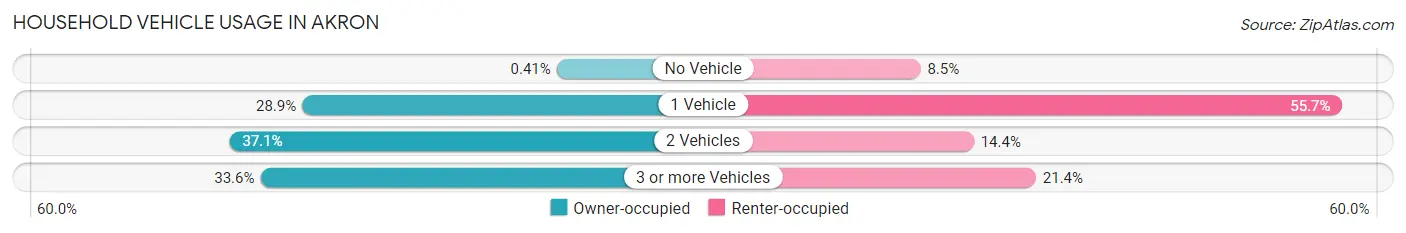
| Vehicles per Household | Owner-occupied | Renter-occupied |
| No Vehicle | 2 (0.4%) | 17 (8.5%) |
| 1 Vehicle | 142 (28.9%) | 112 (55.7%) |
| 2 Vehicles | 182 (37.1%) | 29 (14.4%) |
| 3 or more Vehicles | 165 (33.6%) | 43 (21.4%) |
| Total | 491 (100.0%) | 201 (100.0%) |
Real Estate & Mortgages in Akron
Real Estate and Mortgage Overview in Akron
| Characteristic | Without Mortgage | With Mortgage |
| Housing Units | 201 | 290 |
| Median Property Value | $117,000 | $153,600 |
| Median Household Income | $37,969 | $40 |
| Monthly Housing Costs | $411 | $0 |
| Real Estate Taxes | $1,806 | $18 |
Property Value by Mortgage Status in Akron
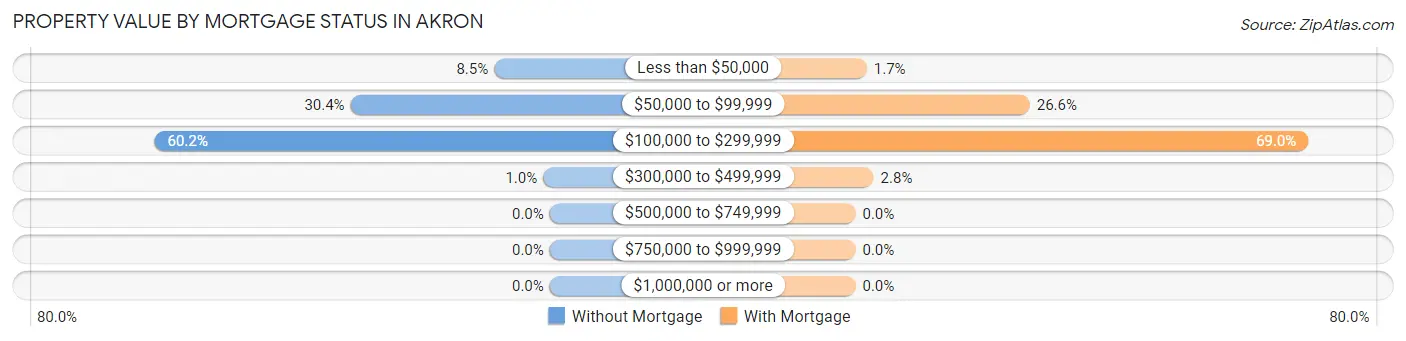
| Property Value | Without Mortgage | With Mortgage |
| Less than $50,000 | 17 (8.5%) | 5 (1.7%) |
| $50,000 to $99,999 | 61 (30.3%) | 77 (26.6%) |
| $100,000 to $299,999 | 121 (60.2%) | 200 (69.0%) |
| $300,000 to $499,999 | 2 (1.0%) | 8 (2.8%) |
| $500,000 to $749,999 | 0 (0.0%) | 0 (0.0%) |
| $750,000 to $999,999 | 0 (0.0%) | 0 (0.0%) |
| $1,000,000 or more | 0 (0.0%) | 0 (0.0%) |
| Total | 201 (100.0%) | 290 (100.0%) |
Household Income by Mortgage Status in Akron
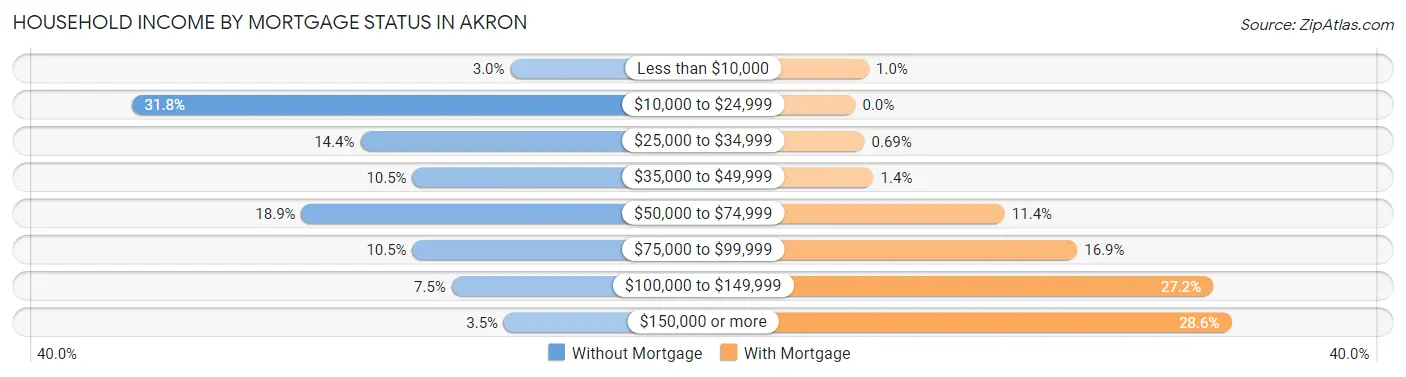
| Household Income | Without Mortgage | With Mortgage |
| Less than $10,000 | 6 (3.0%) | 3 (1.0%) |
| $10,000 to $24,999 | 64 (31.8%) | 0 (0.0%) |
| $25,000 to $34,999 | 29 (14.4%) | 2 (0.7%) |
| $35,000 to $49,999 | 21 (10.4%) | 4 (1.4%) |
| $50,000 to $74,999 | 38 (18.9%) | 33 (11.4%) |
| $75,000 to $99,999 | 21 (10.4%) | 49 (16.9%) |
| $100,000 to $149,999 | 15 (7.5%) | 79 (27.2%) |
| $150,000 or more | 7 (3.5%) | 83 (28.6%) |
| Total | 201 (100.0%) | 290 (100.0%) |
Property Value to Household Income Ratio in Akron
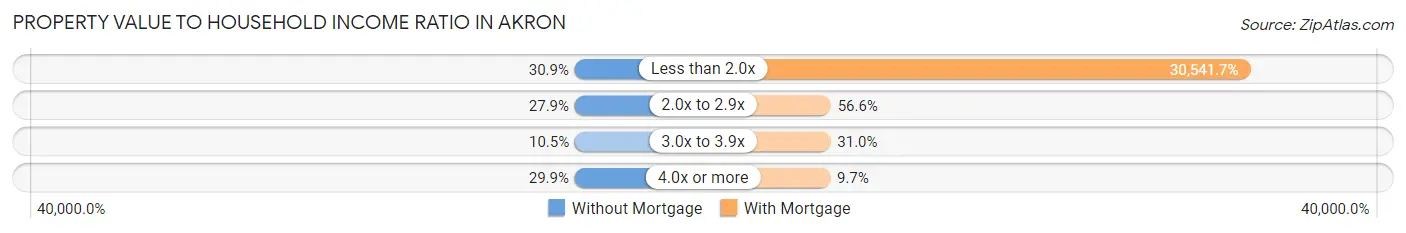
| Value-to-Income Ratio | Without Mortgage | With Mortgage |
| Less than 2.0x | 62 (30.8%) | 88,571 (30,541.7%) |
| 2.0x to 2.9x | 56 (27.9%) | 164 (56.6%) |
| 3.0x to 3.9x | 21 (10.4%) | 90 (31.0%) |
| 4.0x or more | 60 (29.8%) | 28 (9.7%) |
| Total | 201 (100.0%) | 290 (100.0%) |
Real Estate Taxes by Mortgage Status in Akron
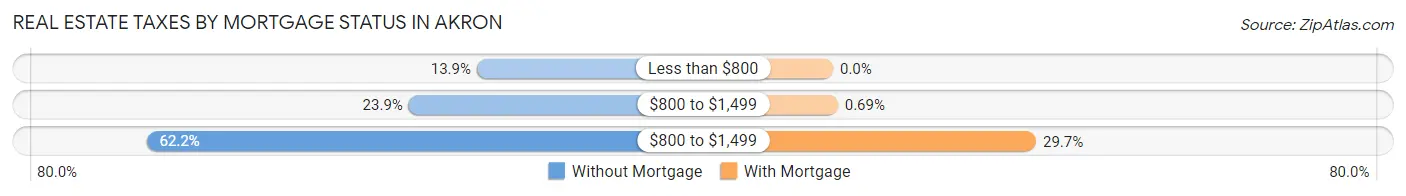
| Property Taxes | Without Mortgage | With Mortgage |
| Less than $800 | 28 (13.9%) | 0 (0.0%) |
| $800 to $1,499 | 48 (23.9%) | 2 (0.7%) |
| $800 to $1,499 | 125 (62.2%) | 86 (29.7%) |
| Total | 201 (100.0%) | 290 (100.0%) |
Health & Disability in Akron
Health Insurance Coverage by Age in Akron
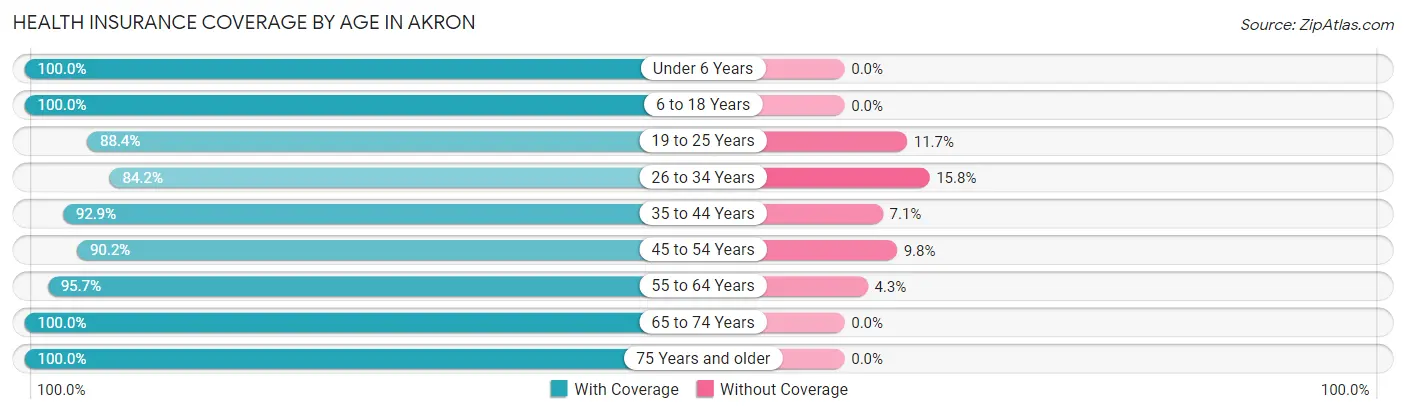
| Age Bracket | With Coverage | Without Coverage |
| Under 6 Years | 101 (100.0%) | 0 (0.0%) |
| 6 to 18 Years | 291 (100.0%) | 0 (0.0%) |
| 19 to 25 Years | 91 (88.3%) | 12 (11.7%) |
| 26 to 34 Years | 170 (84.2%) | 32 (15.8%) |
| 35 to 44 Years | 117 (92.9%) | 9 (7.1%) |
| 45 to 54 Years | 194 (90.2%) | 21 (9.8%) |
| 55 to 64 Years | 133 (95.7%) | 6 (4.3%) |
| 65 to 74 Years | 147 (100.0%) | 0 (0.0%) |
| 75 Years and older | 233 (100.0%) | 0 (0.0%) |
| Total | 1,477 (94.9%) | 80 (5.1%) |
Health Insurance Coverage by Citizenship Status in Akron
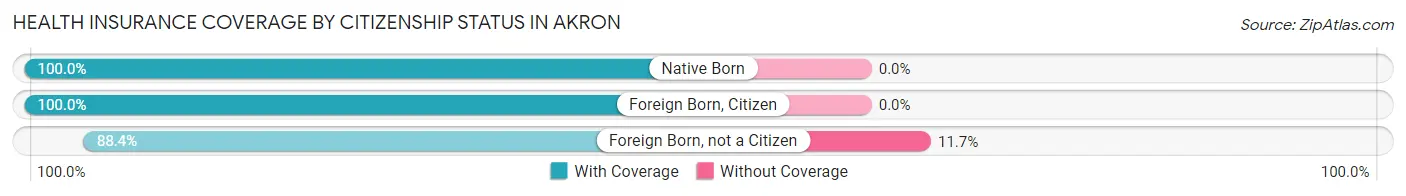
| Citizenship Status | With Coverage | Without Coverage |
| Native Born | 101 (100.0%) | 0 (0.0%) |
| Foreign Born, Citizen | 291 (100.0%) | 0 (0.0%) |
| Foreign Born, not a Citizen | 91 (88.3%) | 12 (11.7%) |
Health Insurance Coverage by Household Income in Akron
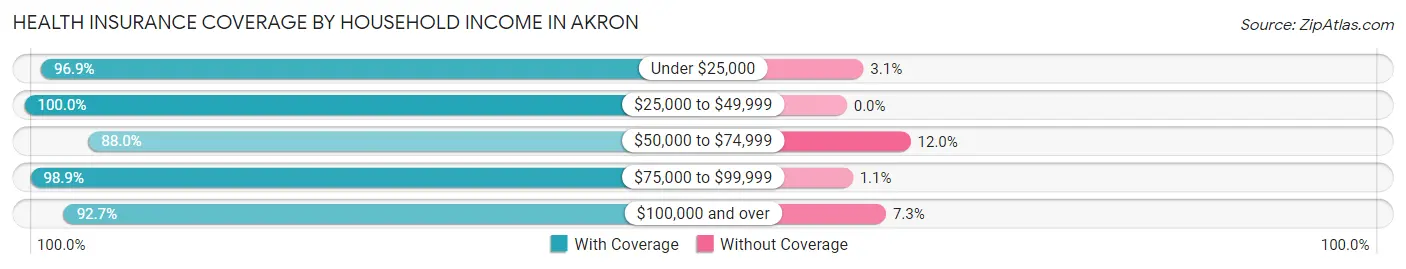
| Household Income | With Coverage | Without Coverage |
| Under $25,000 | 187 (96.9%) | 6 (3.1%) |
| $25,000 to $49,999 | 239 (100.0%) | 0 (0.0%) |
| $50,000 to $74,999 | 265 (88.0%) | 36 (12.0%) |
| $75,000 to $99,999 | 357 (98.9%) | 4 (1.1%) |
| $100,000 and over | 429 (92.7%) | 34 (7.3%) |
Public vs Private Health Insurance Coverage by Age in Akron
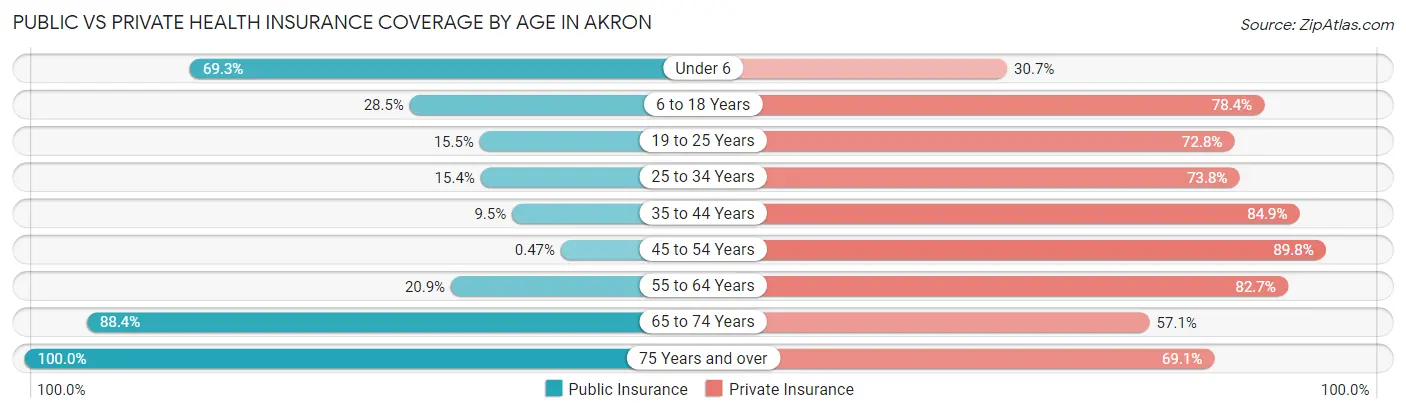
| Age Bracket | Public Insurance | Private Insurance |
| Under 6 | 70 (69.3%) | 31 (30.7%) |
| 6 to 18 Years | 83 (28.5%) | 228 (78.3%) |
| 19 to 25 Years | 16 (15.5%) | 75 (72.8%) |
| 25 to 34 Years | 31 (15.3%) | 149 (73.8%) |
| 35 to 44 Years | 12 (9.5%) | 107 (84.9%) |
| 45 to 54 Years | 1 (0.5%) | 193 (89.8%) |
| 55 to 64 Years | 29 (20.9%) | 115 (82.7%) |
| 65 to 74 Years | 130 (88.4%) | 84 (57.1%) |
| 75 Years and over | 233 (100.0%) | 161 (69.1%) |
| Total | 605 (38.9%) | 1,143 (73.4%) |
Disability Status by Sex by Age in Akron
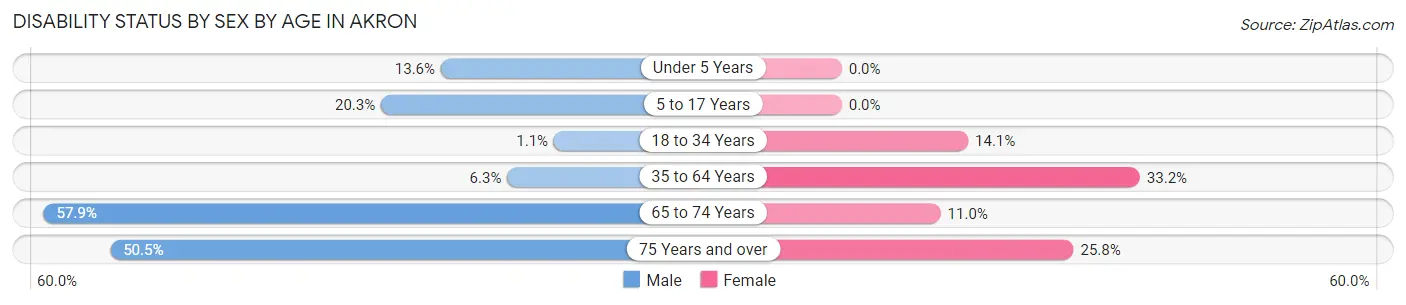
| Age Bracket | Male | Female |
| Under 5 Years | 3 (13.6%) | 0 (0.0%) |
| 5 to 17 Years | 27 (20.3%) | 0 (0.0%) |
| 18 to 34 Years | 2 (1.1%) | 19 (14.1%) |
| 35 to 64 Years | 14 (6.2%) | 85 (33.2%) |
| 65 to 74 Years | 22 (57.9%) | 12 (11.0%) |
| 75 Years and over | 55 (50.5%) | 32 (25.8%) |
Disability Class by Sex by Age in Akron
Disability Class: Hearing Difficulty
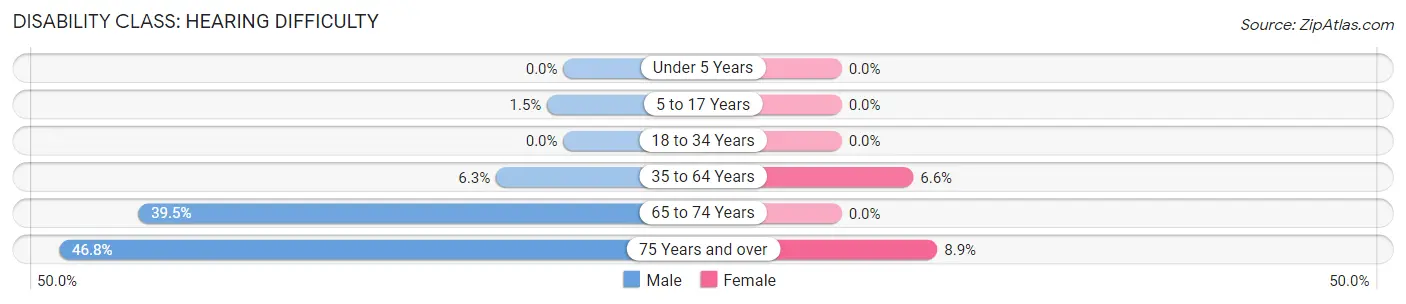
| Age Bracket | Male | Female |
| Under 5 Years | 0 (0.0%) | 0 (0.0%) |
| 5 to 17 Years | 2 (1.5%) | 0 (0.0%) |
| 18 to 34 Years | 0 (0.0%) | 0 (0.0%) |
| 35 to 64 Years | 14 (6.2%) | 17 (6.6%) |
| 65 to 74 Years | 15 (39.5%) | 0 (0.0%) |
| 75 Years and over | 51 (46.8%) | 11 (8.9%) |
Disability Class: Vision Difficulty
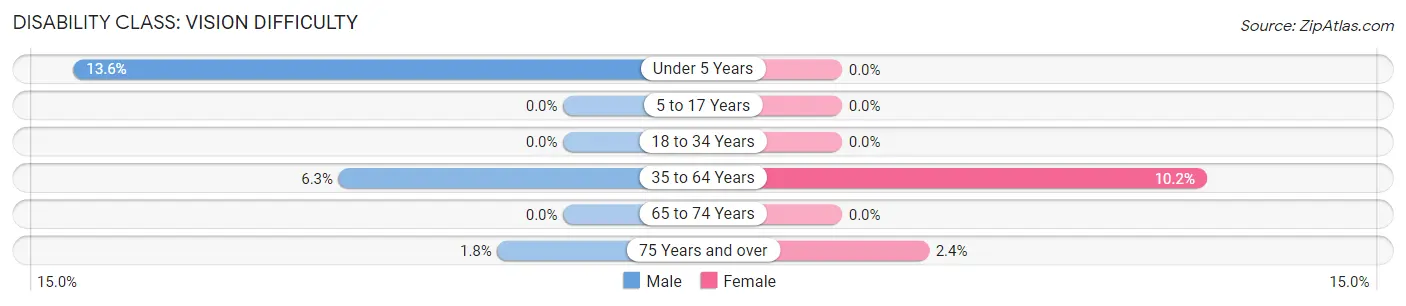
| Age Bracket | Male | Female |
| Under 5 Years | 3 (13.6%) | 0 (0.0%) |
| 5 to 17 Years | 0 (0.0%) | 0 (0.0%) |
| 18 to 34 Years | 0 (0.0%) | 0 (0.0%) |
| 35 to 64 Years | 14 (6.2%) | 26 (10.2%) |
| 65 to 74 Years | 0 (0.0%) | 0 (0.0%) |
| 75 Years and over | 2 (1.8%) | 3 (2.4%) |
Disability Class: Cognitive Difficulty
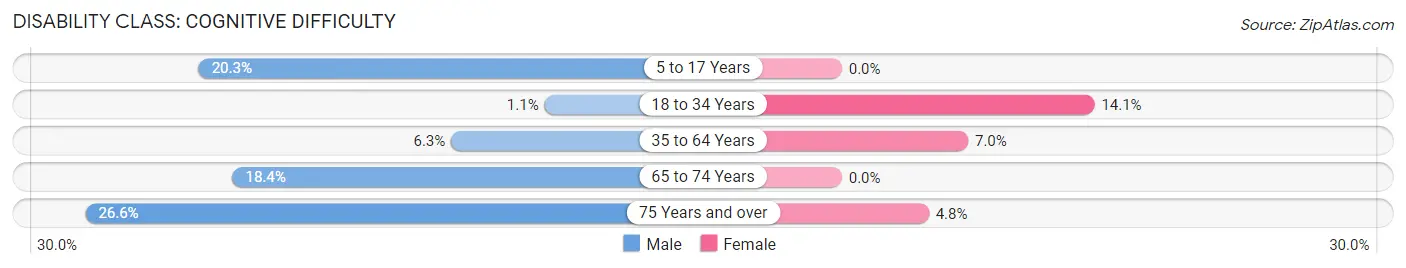
| Age Bracket | Male | Female |
| 5 to 17 Years | 27 (20.3%) | 0 (0.0%) |
| 18 to 34 Years | 2 (1.1%) | 19 (14.1%) |
| 35 to 64 Years | 14 (6.2%) | 18 (7.0%) |
| 65 to 74 Years | 7 (18.4%) | 0 (0.0%) |
| 75 Years and over | 29 (26.6%) | 6 (4.8%) |
Disability Class: Ambulatory Difficulty
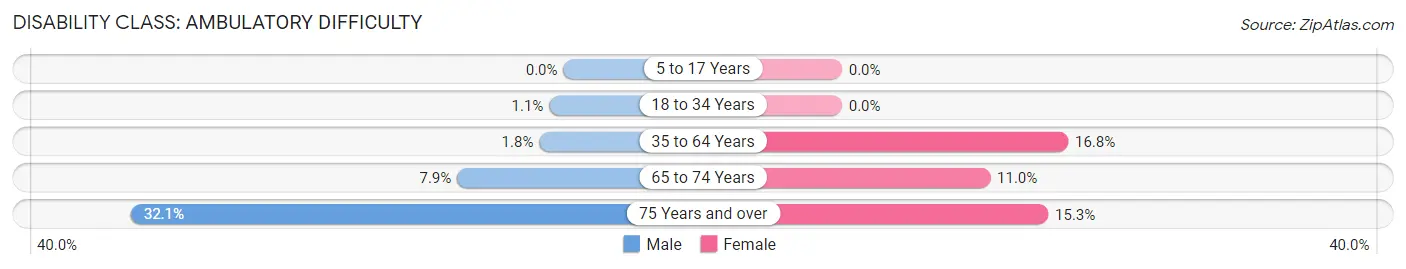
| Age Bracket | Male | Female |
| 5 to 17 Years | 0 (0.0%) | 0 (0.0%) |
| 18 to 34 Years | 2 (1.1%) | 0 (0.0%) |
| 35 to 64 Years | 4 (1.8%) | 43 (16.8%) |
| 65 to 74 Years | 3 (7.9%) | 12 (11.0%) |
| 75 Years and over | 35 (32.1%) | 19 (15.3%) |
Disability Class: Self-Care Difficulty
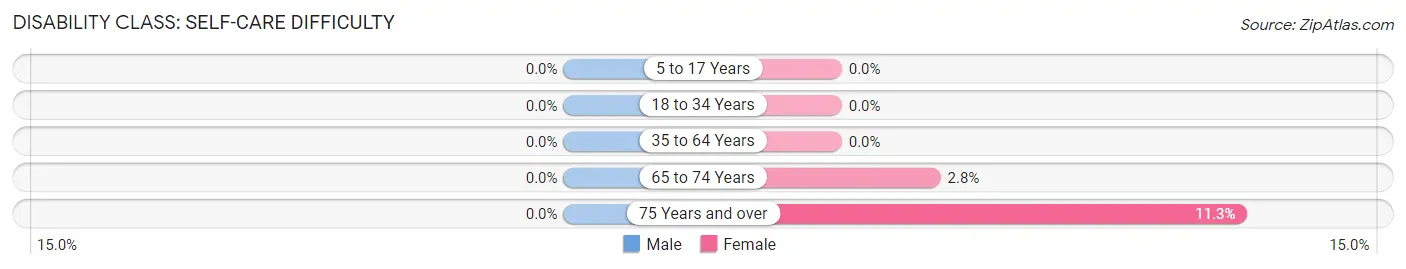
| Age Bracket | Male | Female |
| 5 to 17 Years | 0 (0.0%) | 0 (0.0%) |
| 18 to 34 Years | 0 (0.0%) | 0 (0.0%) |
| 35 to 64 Years | 0 (0.0%) | 0 (0.0%) |
| 65 to 74 Years | 0 (0.0%) | 3 (2.8%) |
| 75 Years and over | 0 (0.0%) | 14 (11.3%) |
Technology Access in Akron
Computing Device Access in Akron
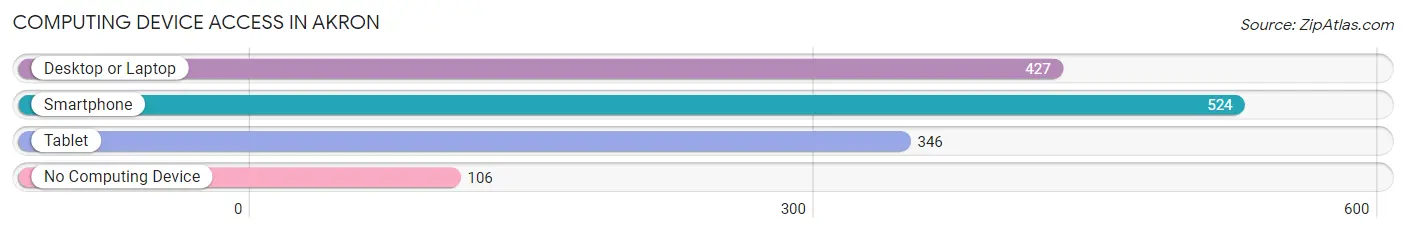
| Device Type | # Households | % Households |
| Desktop or Laptop | 427 | 61.7% |
| Smartphone | 524 | 75.7% |
| Tablet | 346 | 50.0% |
| No Computing Device | 106 | 15.3% |
| Total | 692 | 100.0% |
Internet Access in Akron
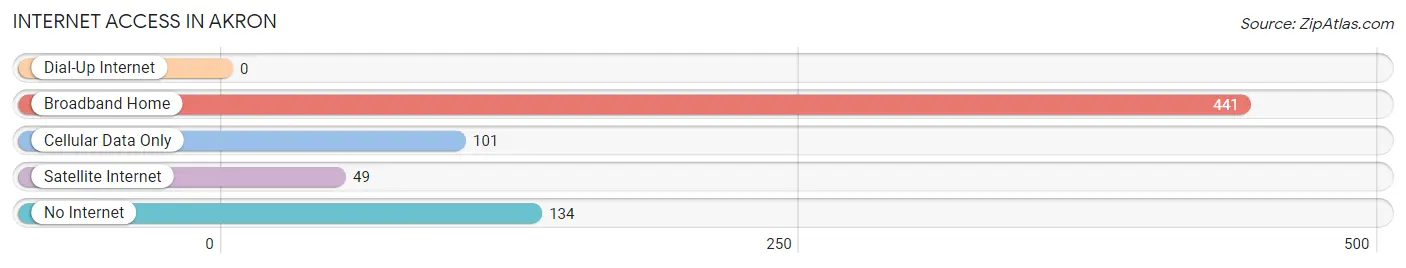
| Internet Type | # Households | % Households |
| Dial-Up Internet | 0 | 0.0% |
| Broadband Home | 441 | 63.7% |
| Cellular Data Only | 101 | 14.6% |
| Satellite Internet | 49 | 7.1% |
| No Internet | 134 | 19.4% |
| Total | 692 | 100.0% |
Akron Summary
Akron, Iowa is a small city located in the northwest corner of the state, in Plymouth County. It is situated on the banks of the West Fork of the Floyd River, and is part of the Sioux City metropolitan area. The city has a population of approximately 2,000 people, and is the county seat of Plymouth County.
History
The area that is now Akron was first settled in 1856 by a group of settlers from Ohio. The town was originally known as “Ohio City”, but was later renamed Akron in 1868. The name was chosen in honor of Akron, Ohio, the hometown of one of the settlers.
The city was officially incorporated in 1872, and the first mayor was elected in 1873. The city quickly grew, and by 1880, the population had reached 1,000.
In the late 19th century, Akron was a major center for the lumber industry. The city was home to several sawmills, and the lumber was used to build homes and businesses throughout the area.
In the early 20th century, Akron was a major center for the agricultural industry. The city was home to several grain elevators, and the area was known for its production of corn, oats, and hay.
Geography
Akron is located in the northwest corner of Iowa, in Plymouth County. The city is situated on the banks of the West Fork of the Floyd River, and is part of the Sioux City metropolitan area.
The city has a total area of 2.2 square miles, all of which is land. The terrain is mostly flat, with some rolling hills in the area.
Economy
The economy of Akron is largely based on agriculture and manufacturing. The city is home to several grain elevators, and the area is known for its production of corn, oats, and hay.
The city is also home to several manufacturing companies, including a plastics manufacturer, a metal fabrication company, and a food processing plant.
Demographics
As of the 2010 census, the population of Akron was 2,000. The racial makeup of the city was 97.5% White, 0.5% African American, 0.3% Native American, 0.2% Asian, 0.1% Pacific Islander, 0.5% from other races, and 0.9% from two or more races. Hispanic or Latino of any race were 1.2% of the population.
The median income for a household in the city was $41,250, and the median income for a family was $50,000. The per capita income for the city was $20,845. About 8.3% of families and 10.3% of the population were below the poverty line, including 14.3% of those under age 18 and 8.3% of those age 65 or over.
Common Questions
What is Per Capita Income in Akron?
Per Capita income in Akron is $31,208.
What is the Median Family Income in Akron?
Median Family Income in Akron is $74,750.
What is the Median Household income in Akron?
Median Household Income in Akron is $60,833.
What is Income or Wage Gap in Akron?
Income or Wage Gap in Akron is 29.0%.
Women in Akron earn 71.0 cents for every dollar earned by a man.
What is Inequality or Gini Index in Akron?
Inequality or Gini Index in Akron is 0.41.
What is the Total Population of Akron?
Total Population of Akron is 1,580.
What is the Total Male Population of Akron?
Total Male Population of Akron is 722.
What is the Total Female Population of Akron?
Total Female Population of Akron is 858.
What is the Ratio of Males per 100 Females in Akron?
There are 84.15 Males per 100 Females in Akron.
What is the Ratio of Females per 100 Males in Akron?
There are 118.84 Females per 100 Males in Akron.
What is the Median Population Age in Akron?
Median Population Age in Akron is 41.9 Years.
What is the Average Family Size in Akron
Average Family Size in Akron is 2.9 People.
What is the Average Household Size in Akron
Average Household Size in Akron is 2.2 People.
How Large is the Labor Force in Akron?
There are 788 People in the Labor Forcein in Akron.
What is the Percentage of People in the Labor Force in Akron?
62.4% of People are in the Labor Force in Akron.
What is the Unemployment Rate in Akron?
Unemployment Rate in Akron is 0.9%.