Zip Codes with the Highest Percentage of Population with a Degree in Computers and Mathematics in Delaware

RELATED REPORTS & OPTIONS

Computers and Mathematics
Population
Families and Households
Female Fertility
Female Fertility (Unmarried)
Race (Community Size)
Race (Percentage)
Ancestry (Community Size)
AfghanAfricanAlaska NativeAlaskan AthabascanAlbanianAleutAlsatianAmericanApacheArabArapahoArgentineanArmenianAssyrian / Chaldean / SyriacAustralianAustrianBahamianBangladeshiBarbadianBasqueBelgianBelizeanBermudanBhutaneseBlackfeetBolivianBrazilianBritishBritish West IndianBulgarianBurmeseCajunCambodianCanadianCape VerdeanCarpatho RusynCelticCentral AmericanCentral American IndianCherokeeCheyenneChickasawChileanChineseChippewaChoctawColombianColvilleComancheCosta RicanCreeCreekCroatianCrowCubanCypriotCzechCzechoslovakianDanishDelawareDominicanDutchDutch West IndianEastern EuropeanEcuadorianEgyptianEnglishEstonianEthiopianEuropeanFijianFilipinoFinnishFrenchFrench American IndianFrench CanadianGermanGerman RussianGhanaianGreekGuamanian / ChamorroGuatemalanGuyaneseHaitianHmongHonduranHopiHoumaHungarianIcelanderIndian (Asian)IndonesianInupiatIranianIraqiIrishIroquoisIsraeliItalianJamaicanJapaneseJordanianKenyanKiowaKoreanLaotianLatvianLebaneseLiberianLithuanianLumbeeLuxembourgerMacedonianMalaysianMalteseMarshalleseMenomineeMexicanMexican American IndianMongolianMoroccanNative HawaiianNavajoNepaleseNew ZealanderNicaraguanNigerianNorthern EuropeanNorwegianOkinawanOsageOttawaPaiutePakistaniPalestinianPanamanianParaguayanPennsylvania GermanPeruvianPimaPolishPortuguesePotawatomiPuebloPuerto RicanPuget Sound SalishRomanianRussianSalvadoranSamoanScandinavianScotch-IrishScottishSeminoleSenegaleseSerbianShoshoneSierra LeoneanSiouxSlavicSlovakSloveneSomaliSouth AfricanSouth AmericanSouth American IndianSoviet UnionSpaniardSpanishSpanish AmericanSpanish American IndianSri LankanSubsaharan AfricanSudaneseSwedishSwissSyrianTaiwaneseThaiTlingit-HaidaTohono O'OdhamTonganTrinidadian and TobagonianTsimshianTurkishU.S. Virgin IslanderUgandanUkrainianUruguayanUteVenezuelanVietnameseWelshWest IndianYakamaYaquiYugoslavianYumanYup'ikZimbabwean
Ancestry (Percentage)
AfghanAfricanAlaska NativeAlaskan AthabascanAlbanianAleutAlsatianAmericanApacheArabArapahoArgentineanArmenianAssyrian / Chaldean / SyriacAustralianAustrianBahamianBangladeshiBarbadianBasqueBelgianBelizeanBermudanBhutaneseBlackfeetBolivianBrazilianBritishBritish West IndianBulgarianBurmeseCajunCambodianCanadianCape VerdeanCarpatho RusynCelticCentral AmericanCentral American IndianCherokeeCheyenneChickasawChileanChineseChippewaChoctawColombianColvilleComancheCosta RicanCreeCreekCroatianCrowCubanCypriotCzechCzechoslovakianDanishDelawareDominicanDutchDutch West IndianEastern EuropeanEcuadorianEgyptianEnglishEstonianEthiopianEuropeanFijianFilipinoFinnishFrenchFrench American IndianFrench CanadianGermanGerman RussianGhanaianGreekGuamanian / ChamorroGuatemalanGuyaneseHaitianHmongHonduranHopiHoumaHungarianIcelanderIndian (Asian)IndonesianInupiatIranianIraqiIrishIroquoisIsraeliItalianJamaicanJapaneseJordanianKenyanKiowaKoreanLaotianLatvianLebaneseLiberianLithuanianLumbeeLuxembourgerMacedonianMalaysianMalteseMarshalleseMenomineeMexicanMexican American IndianMongolianMoroccanNative HawaiianNavajoNepaleseNew ZealanderNicaraguanNigerianNorthern EuropeanNorwegianOkinawanOsageOttawaPaiutePakistaniPalestinianPanamanianParaguayanPennsylvania GermanPeruvianPimaPolishPortuguesePotawatomiPuebloPuerto RicanPuget Sound SalishRomanianRussianSalvadoranSamoanScandinavianScotch-IrishScottishSeminoleSenegaleseSerbianShoshoneSierra LeoneanSiouxSlavicSlovakSloveneSomaliSouth AfricanSouth AmericanSouth American IndianSoviet UnionSpaniardSpanishSpanish AmericanSpanish American IndianSri LankanSubsaharan AfricanSudaneseSwedishSwissSyrianTaiwaneseThaiTlingit-HaidaTohono O'OdhamTonganTrinidadian and TobagonianTsimshianTurkishU.S. Virgin IslanderUgandanUkrainianUruguayanUteVenezuelanVietnameseWelshWest IndianYakamaYaquiYugoslavianYumanYup'ikZimbabwean
Immigrant Origin (Total)
AfghanistanAfricaAlbaniaArgentinaArmeniaAsiaAustraliaAustriaAzoresBahamasBangladeshBarbadosBelarusBelgiumBelizeBoliviaBosnia and HerzegovinaBrazilBulgariaBurma / MyanmarCabo VerdeCambodiaCameroonCanadaCaribbeanCentral AmericaChileChinaColombiaCongoCosta RicaCroatiaCubaCzechoslovakiaDenmarkDominicaDominican RepublicEastern AfricaEastern AsiaEastern EuropeEcuadorEgyptEl SalvadorEnglandEritreaEthiopiaEuropeFijiFranceGermanyGhanaGreeceGrenadaGuatemalaGuyanaHaitiHondurasHong KongHungaryIndiaIndonesiaIranIraqIrelandIsraelItalyJamaicaJapanJordanKazakhstanKenyaKoreaKuwaitLaosLatin AmericaLatviaLebanonLiberiaLithuaniaMalaysiaMexicoMicronesiaMiddle AfricaMoldovaMoroccoNepalNetherlandsNicaraguaNigeriaNorth MacedoniaNorthern AfricaNorthern EuropeNorwayOceaniaPakistanPanamaPeruPhilippinesPolandPortugalRomaniaRussiaSaudi ArabiaScotlandSenegalSerbiaSierra LeoneSingaporeSomaliaSouth AfricaSouth AmericaSouth Central AsiaSouth Eastern AsiaSouthern EuropeSpainSri LankaSt. Vincent and the GrenadinesSudanSwedenSwitzerlandSyriaTaiwanThailandTrinidad and TobagoTurkeyUgandaUkraineUruguayUzbekistanVenezuelaVietnamWest IndiesWestern AfricaWestern AsiaWestern EuropeYemenZaireZimbabwe
Immigrant Origin (Percentage)
AfghanistanAfricaAlbaniaArgentinaArmeniaAsiaAustraliaAustriaAzoresBahamasBangladeshBarbadosBelarusBelgiumBelizeBoliviaBosnia and HerzegovinaBrazilBulgariaBurma / MyanmarCabo VerdeCambodiaCameroonCanadaCaribbeanCentral AmericaChileChinaColombiaCongoCosta RicaCroatiaCubaCzechoslovakiaDenmarkDominicaDominican RepublicEastern AfricaEastern AsiaEastern EuropeEcuadorEgyptEl SalvadorEnglandEritreaEthiopiaEuropeFijiFranceGermanyGhanaGreeceGrenadaGuatemalaGuyanaHaitiHondurasHong KongHungaryIndiaIndonesiaIranIraqIrelandIsraelItalyJamaicaJapanJordanKazakhstanKenyaKoreaKuwaitLaosLatin AmericaLatviaLebanonLiberiaLithuaniaMalaysiaMexicoMicronesiaMiddle AfricaMoldovaMoroccoNepalNetherlandsNicaraguaNigeriaNorth MacedoniaNorthern AfricaNorthern EuropeNorwayOceaniaPakistanPanamaPeruPhilippinesPolandPortugalRomaniaRussiaSaudi ArabiaScotlandSenegalSerbiaSierra LeoneSingaporeSomaliaSouth AfricaSouth AmericaSouth Central AsiaSouth Eastern AsiaSouthern EuropeSpainSri LankaSt. Vincent and the GrenadinesSudanSwedenSwitzerlandSyriaTaiwanThailandTrinidad and TobagoTurkeyUgandaUkraineUruguayUzbekistanVenezuelaVietnamWest IndiesWestern AfricaWestern AsiaWestern EuropeYemenZaireZimbabwe
Income
Income (Families)
Income (Households)
Poverty
Poverty (Families)
Unemployment
Employment Occupations
Employment Industries
Employer Class
Commute Time
Commute Means
School Enrollment
Education by Degree Field
Occupancy
Finances
Physical Characteristics
Delaware
Compare Zip Codes
Comparison Subject

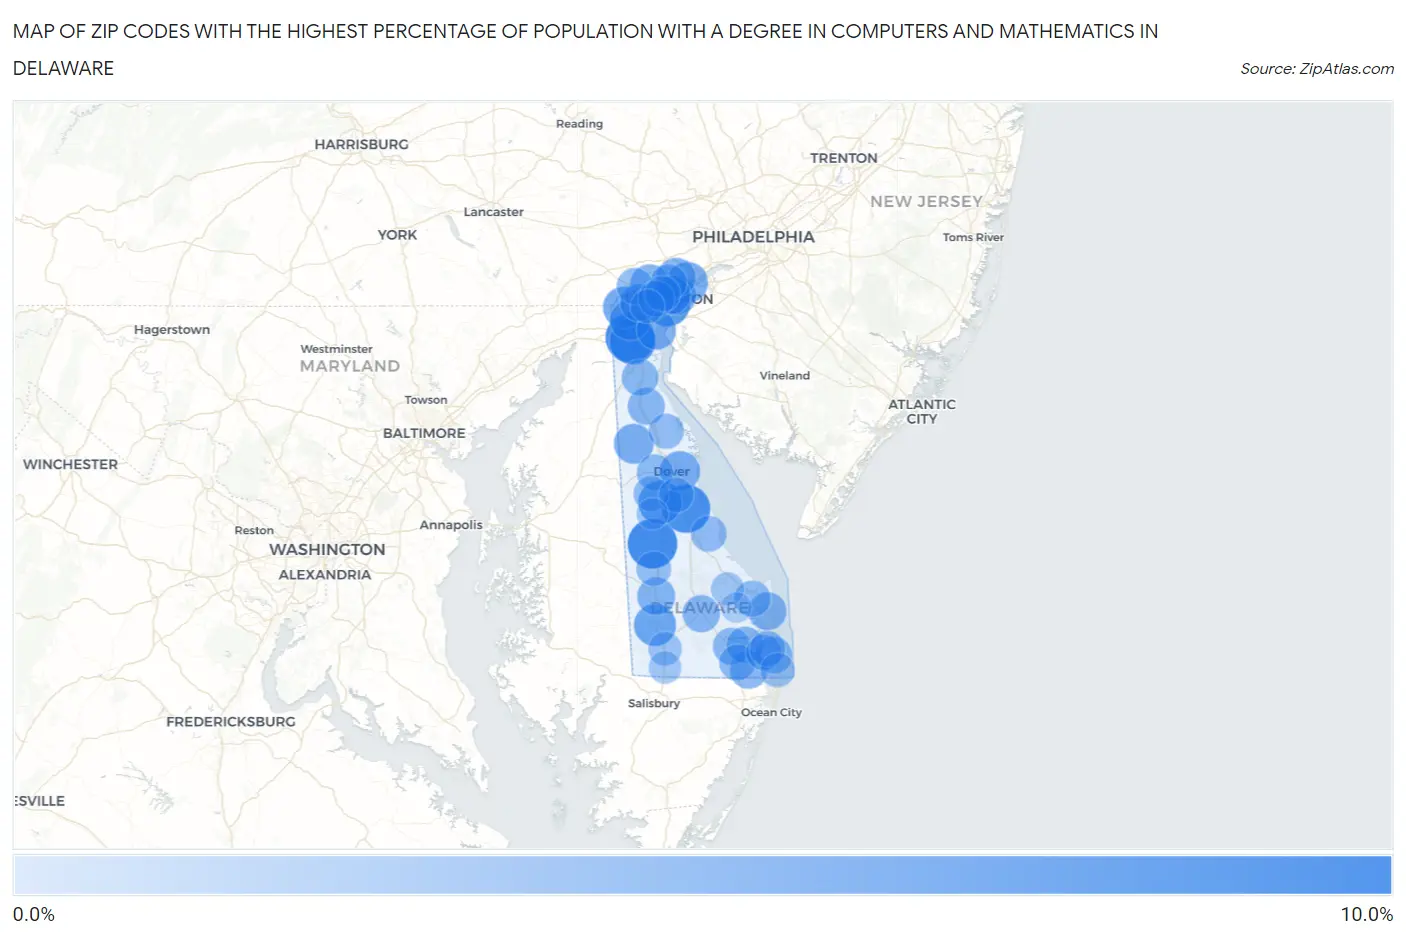
Map of Zip Codes with the Highest Percentage of Population with a Degree in Computers and Mathematics in Delaware

0.0%
10.0%
Zip Codes with the Highest Percentage of Population with a Degree in Computers and Mathematics in Delaware Map

Zip Codes with the Highest Percentage of Population with a Degree in Computers and Mathematics in Delaware

Zip Code % Graduates vs State vs National
1.199529.8%4.3%(+5.53)#14.9%(+4.91)#1,834
2.197029.5%4.3%(+5.22)#24.9%(+4.61)#1,967
3.199469.0%4.3%(+4.74)#34.9%(+4.13)#2,241
4.197018.1%4.3%(+3.81)#44.9%(+3.19)#2,832
5.198017.7%4.3%(+3.39)#54.9%(+2.77)#3,185
6.199796.8%4.3%(+2.48)#64.9%(+1.86)#4,134
7.199736.0%4.3%(+1.69)#74.9%(+1.07)#5,361
8.197115.6%4.3%(+1.37)#84.9%(+0.754)#5,979
9.197035.4%4.3%(+1.17)#94.9%(+0.553)#6,408
10.197135.1%4.3%(+0.867)#104.9%(+0.249)#7,106
11.199015.0%4.3%(+0.762)#114.9%(+0.145)#7,363
12.198095.0%4.3%(+0.704)#124.9%(+0.087)#7,501
13.199384.8%4.3%(+0.497)#134.9%(-0.120)#8,062
14.197204.6%4.3%(+0.295)#144.9%(-0.322)#8,642
15.198104.5%4.3%(+0.223)#154.9%(-0.394)#8,870
16.198074.4%4.3%(+0.097)#164.9%(-0.520)#9,278
17.198024.1%4.3%(-0.185)#174.9%(-0.802)#10,161
18.199713.9%4.3%(-0.399)#184.9%(-1.02)#10,874
19.199333.9%4.3%(-0.409)#194.9%(-1.03)#10,912
20.198083.8%4.3%(-0.485)#204.9%(-1.10)#11,217
21.199753.7%4.3%(-0.540)#214.9%(-1.16)#11,408
22.199473.6%4.3%(-0.726)#224.9%(-1.34)#12,090
23.197343.4%4.3%(-0.859)#234.9%(-1.48)#12,598
24.199303.3%4.3%(-0.940)#244.9%(-1.56)#12,878
25.199663.3%4.3%(-0.985)#254.9%(-1.60)#13,047
26.199393.2%4.3%(-1.03)#264.9%(-1.65)#13,202
27.197093.2%4.3%(-1.09)#274.9%(-1.70)#13,414
28.198033.1%4.3%(-1.13)#284.9%(-1.74)#13,552
29.197073.1%4.3%(-1.15)#294.9%(-1.77)#13,628
30.198053.1%4.3%(-1.21)#304.9%(-1.83)#13,848
31.199583.1%4.3%(-1.22)#314.9%(-1.84)#13,898
32.199453.0%4.3%(-1.25)#324.9%(-1.86)#13,985
33.199043.0%4.3%(-1.26)#334.9%(-1.88)#14,035
34.199632.8%4.3%(-1.49)#344.9%(-2.11)#14,834
35.198062.7%4.3%(-1.58)#354.9%(-2.20)#15,178
36.199672.6%4.3%(-1.64)#364.9%(-2.26)#15,402
37.199702.6%4.3%(-1.66)#374.9%(-2.27)#15,455
38.199342.5%4.3%(-1.75)#384.9%(-2.36)#15,789
39.199772.5%4.3%(-1.82)#394.9%(-2.44)#16,085
40.199502.3%4.3%(-1.99)#404.9%(-2.60)#16,622
41.199622.3%4.3%(-2.01)#414.9%(-2.63)#16,724
42.199442.1%4.3%(-2.21)#424.9%(-2.82)#17,375
43.198041.9%4.3%(-2.38)#434.9%(-3.00)#17,952
44.199561.6%4.3%(-2.63)#444.9%(-3.24)#18,696
45.199681.4%4.3%(-2.89)#454.9%(-3.51)#19,459
46.199401.1%4.3%(-3.17)#464.9%(-3.78)#20,231
47.199430.71%4.3%(-3.57)#474.9%(-4.19)#21,135
48.199510.21%4.3%(-4.07)#484.9%(-4.69)#21,762

Common Questions

What are the Top 10 Zip Codes with the Highest Percentage of Population with a Degree in Computers and Mathematics in Delaware?
Top 10 Zip Codes with the Highest Percentage of Population with a Degree in Computers and Mathematics in Delaware are:
#1
9.8%
#2
9.5%
#3
9.0%
#4
8.1%
#5
7.7%
#6
6.8%
#7
6.0%
#8
5.6%
#9
5.4%
#10
5.1%
What zip code has the Highest Percentage of Population with a Degree in Computers and Mathematics in Delaware?
19952 has the Highest Percentage of Population with a Degree in Computers and Mathematics in Delaware with 9.8%.
What is the Percentage of Population with a Degree in Computers and Mathematics in the State of Delaware?
Percentage of Population with a Degree in Computers and Mathematics in Delaware is 4.3%.
What is the Percentage of Population with a Degree in Computers and Mathematics in the United States?
Percentage of Population with a Degree in Computers and Mathematics in the United States is 4.9%.