Zip Codes with the Highest Poverty Level Among Children Under the Age of 5 in Vermont
RELATED REPORTS & OPTIONS
Highest Poverty | Child 0-5
Vermont
Compare Zip Codes
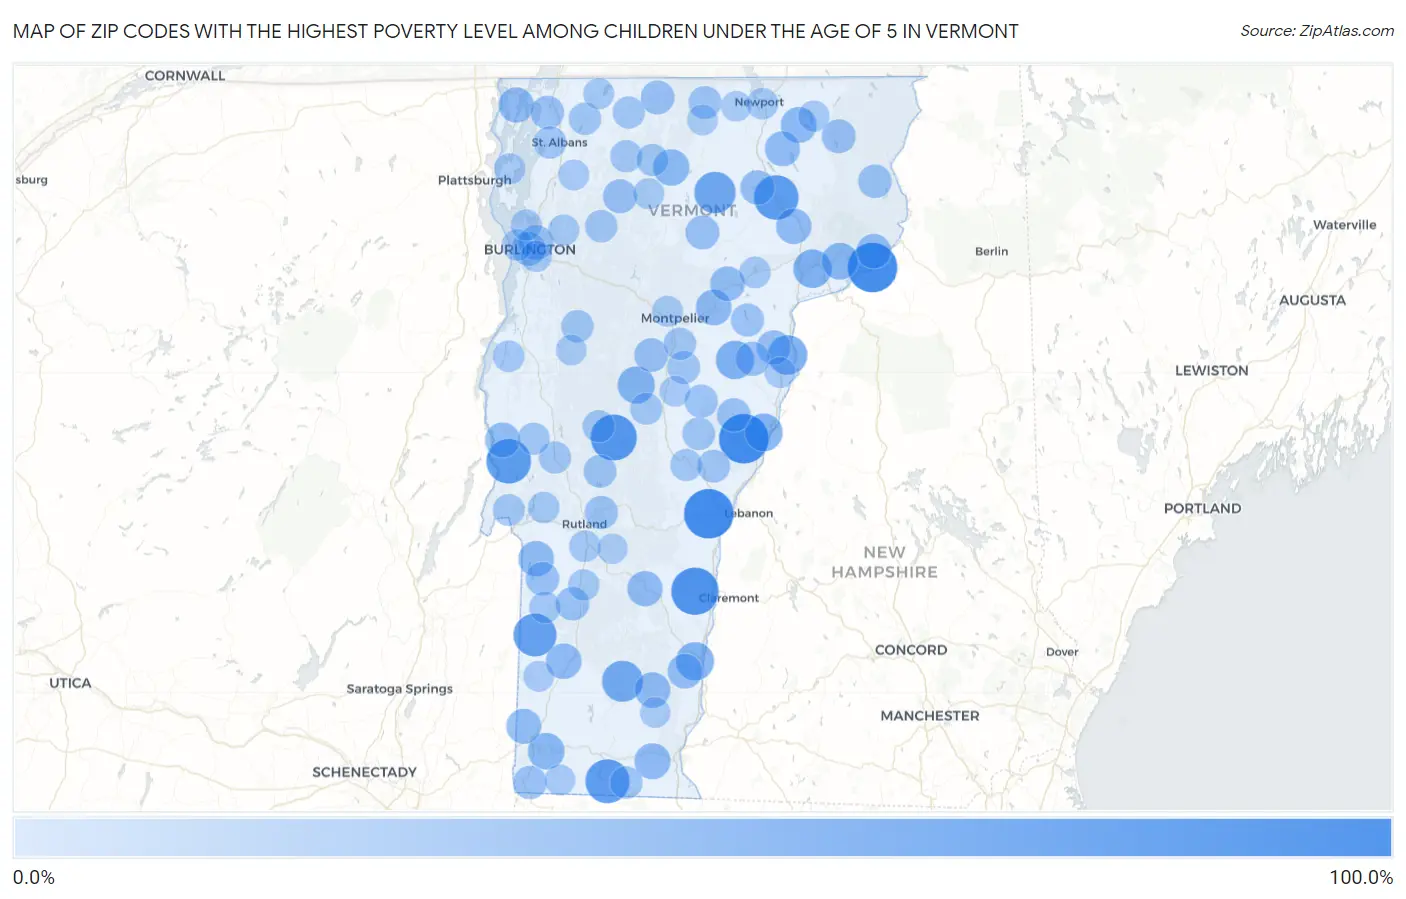
Map of Zip Codes with the Highest Poverty Level Among Children Under the Age of 5 in Vermont
0.0%
100.0%
Zip Codes with the Highest Poverty Level Among Children Under the Age of 5 in Vermont
| Zip Code | Child Poverty | vs State | vs National | |
| 1. | 05059 | 100.0% | 11.5%(+88.5)#1 | 18.1%(+81.9)#269 |
| 2. | 05904 | 100.0% | 11.5%(+88.5)#2 | 18.1%(+81.9)#379 |
| 3. | 05058 | 100.0% | 11.5%(+88.5)#3 | 18.1%(+81.9)#475 |
| 4. | 05151 | 88.9% | 11.5%(+77.4)#4 | 18.1%(+70.8)#646 |
| 5. | 05767 | 82.4% | 11.5%(+70.8)#5 | 18.1%(+64.3)#760 |
| 6. | 05760 | 75.0% | 11.5%(+63.5)#6 | 18.1%(+56.9)#959 |
| 7. | 05866 | 75.0% | 11.5%(+63.5)#7 | 18.1%(+56.9)#960 |
| 8. | 05361 | 72.2% | 11.5%(+60.7)#8 | 18.1%(+54.2)#1,075 |
| 9. | 05776 | 66.7% | 11.5%(+55.1)#9 | 18.1%(+48.6)#1,301 |
| 10. | 05826 | 58.8% | 11.5%(+47.3)#10 | 18.1%(+40.8)#1,780 |
| 11. | 05343 | 56.2% | 11.5%(+44.7)#11 | 18.1%(+38.2)#1,967 |
| 12. | 05081 | 50.0% | 11.5%(+38.5)#12 | 18.1%(+31.9)#2,566 |
| 13. | 05819 | 43.9% | 11.5%(+32.4)#13 | 18.1%(+25.8)#3,355 |
| 14. | 05086 | 43.5% | 11.5%(+32.0)#14 | 18.1%(+25.4)#3,418 |
| 15. | 05101 | 42.3% | 11.5%(+30.7)#15 | 18.1%(+24.2)#3,616 |
| 16. | 05045 | 40.4% | 11.5%(+28.9)#16 | 18.1%(+22.4)#3,941 |
| 17. | 05669 | 37.9% | 11.5%(+26.4)#17 | 18.1%(+19.8)#4,433 |
| 18. | 05824 | 35.7% | 11.5%(+24.2)#18 | 18.1%(+17.7)#4,887 |
| 19. | 05201 | 34.8% | 11.5%(+23.3)#19 | 18.1%(+16.7)#5,115 |
| 20. | 05652 | 33.3% | 11.5%(+21.8)#20 | 18.1%(+15.3)#5,482 |
| 21. | 05301 | 31.7% | 11.5%(+20.2)#21 | 18.1%(+13.6)#5,907 |
| 22. | 05872 | 31.2% | 11.5%(+19.7)#22 | 18.1%(+13.2)#6,020 |
| 23. | 05667 | 30.3% | 11.5%(+18.7)#23 | 18.1%(+12.2)#6,275 |
| 24. | 05255 | 29.9% | 11.5%(+18.3)#24 | 18.1%(+11.8)#6,387 |
| 25. | 05764 | 29.5% | 11.5%(+18.0)#25 | 18.1%(+11.4)#6,499 |
| 26. | 05353 | 29.2% | 11.5%(+17.6)#26 | 18.1%(+11.1)#6,603 |
| 27. | 05851 | 28.9% | 11.5%(+17.4)#27 | 18.1%(+10.8)#6,684 |
| 28. | 05440 | 28.1% | 11.5%(+16.6)#28 | 18.1%(+10.1)#6,939 |
| 29. | 05149 | 28.0% | 11.5%(+16.5)#29 | 18.1%(+9.99)#6,956 |
| 30. | 05860 | 27.1% | 11.5%(+15.6)#30 | 18.1%(+9.05)#7,276 |
| 31. | 05770 | 26.8% | 11.5%(+15.3)#31 | 18.1%(+8.72)#7,373 |
| 32. | 05257 | 26.6% | 11.5%(+15.1)#32 | 18.1%(+8.51)#7,451 |
| 33. | 05658 | 25.4% | 11.5%(+13.9)#33 | 18.1%(+7.31)#7,861 |
| 34. | 05154 | 25.3% | 11.5%(+13.8)#34 | 18.1%(+7.25)#7,873 |
| 35. | 05906 | 25.0% | 11.5%(+13.5)#35 | 18.1%(+6.94)#7,991 |
| 36. | 05404 | 24.8% | 11.5%(+13.3)#36 | 18.1%(+6.78)#8,074 |
| 37. | 05839 | 23.8% | 11.5%(+12.3)#37 | 18.1%(+5.75)#8,443 |
| 38. | 05069 | 23.3% | 11.5%(+11.8)#38 | 18.1%(+5.27)#8,639 |
| 39. | 05076 | 22.2% | 11.5%(+10.7)#39 | 18.1%(+4.16)#9,100 |
| 40. | 05401 | 21.8% | 11.5%(+10.3)#40 | 18.1%(+3.77)#9,254 |
| 41. | 05476 | 21.7% | 11.5%(+10.1)#41 | 18.1%(+3.59)#9,331 |
| 42. | 05846 | 21.6% | 11.5%(+10.1)#42 | 18.1%(+3.56)#9,343 |
| 43. | 05464 | 21.5% | 11.5%(+10.0)#43 | 18.1%(+3.46)#9,376 |
| 44. | 05680 | 21.4% | 11.5%(+9.84)#44 | 18.1%(+3.30)#9,450 |
| 45. | 05663 | 20.7% | 11.5%(+9.21)#45 | 18.1%(+2.67)#9,709 |
| 46. | 05774 | 20.3% | 11.5%(+8.82)#46 | 18.1%(+2.28)#9,875 |
| 47. | 05079 | 20.0% | 11.5%(+8.48)#47 | 18.1%(+1.94)#10,048 |
| 48. | 05739 | 19.7% | 11.5%(+8.15)#48 | 18.1%(+1.61)#10,189 |
| 49. | 05905 | 19.2% | 11.5%(+7.71)#49 | 18.1%(+1.17)#10,392 |
| 50. | 05488 | 18.9% | 11.5%(+7.40)#50 | 18.1%(+0.851)#10,538 |
| 51. | 05261 | 18.9% | 11.5%(+7.35)#51 | 18.1%(+0.805)#10,561 |
| 52. | 05038 | 17.9% | 11.5%(+6.43)#52 | 18.1%(-0.114)#10,983 |
| 53. | 05701 | 17.7% | 11.5%(+6.16)#53 | 18.1%(-0.382)#11,115 |
| 54. | 05046 | 17.6% | 11.5%(+6.13)#54 | 18.1%(-0.416)#11,135 |
| 55. | 05737 | 16.3% | 11.5%(+4.76)#55 | 18.1%(-1.78)#11,774 |
| 56. | 05859 | 16.3% | 11.5%(+4.74)#56 | 18.1%(-1.80)#11,784 |
| 57. | 05065 | 15.6% | 11.5%(+4.11)#57 | 18.1%(-2.44)#12,115 |
| 58. | 05679 | 15.4% | 11.5%(+3.87)#58 | 18.1%(-2.68)#12,225 |
| 59. | 05077 | 15.4% | 11.5%(+3.87)#59 | 18.1%(-2.68)#12,240 |
| 60. | 05487 | 14.5% | 11.5%(+2.98)#60 | 18.1%(-3.57)#12,731 |
| 61. | 05489 | 14.4% | 11.5%(+2.87)#61 | 18.1%(-3.67)#12,782 |
| 62. | 05342 | 14.3% | 11.5%(+2.77)#62 | 18.1%(-3.78)#12,875 |
| 63. | 05483 | 14.2% | 11.5%(+2.63)#63 | 18.1%(-3.91)#12,960 |
| 64. | 05478 | 13.9% | 11.5%(+2.34)#64 | 18.1%(-4.21)#13,120 |
| 65. | 05641 | 13.4% | 11.5%(+1.92)#65 | 18.1%(-4.62)#13,365 |
| 66. | 05733 | 13.1% | 11.5%(+1.60)#66 | 18.1%(-4.94)#13,555 |
| 67. | 05450 | 13.0% | 11.5%(+1.45)#67 | 18.1%(-5.09)#13,649 |
| 68. | 05748 | 12.9% | 11.5%(+1.39)#68 | 18.1%(-5.16)#13,689 |
| 69. | 05778 | 12.5% | 11.5%(+0.983)#69 | 18.1%(-5.56)#13,907 |
| 70. | 05441 | 12.5% | 11.5%(+0.983)#70 | 18.1%(-5.56)#13,917 |
| 71. | 05442 | 12.5% | 11.5%(+0.983)#71 | 18.1%(-5.56)#13,919 |
| 72. | 05068 | 12.3% | 11.5%(+0.828)#72 | 18.1%(-5.72)#14,011 |
| 73. | 05060 | 12.1% | 11.5%(+0.563)#73 | 18.1%(-5.98)#14,158 |
| 74. | 05743 | 11.2% | 11.5%(-0.281)#74 | 18.1%(-6.83)#14,674 |
| 75. | 05873 | 10.3% | 11.5%(-1.17)#75 | 18.1%(-7.72)#15,209 |
| 76. | 05761 | 10.2% | 11.5%(-1.31)#76 | 18.1%(-7.86)#15,292 |
| 77. | 05759 | 10.1% | 11.5%(-1.43)#77 | 18.1%(-7.98)#15,357 |
| 78. | 05855 | 9.8% | 11.5%(-1.73)#78 | 18.1%(-8.27)#15,541 |
| 79. | 05491 | 9.5% | 11.5%(-1.98)#79 | 18.1%(-8.52)#15,678 |
| 80. | 05408 | 9.5% | 11.5%(-2.04)#80 | 18.1%(-8.59)#15,746 |
| 81. | 05735 | 9.2% | 11.5%(-2.34)#81 | 18.1%(-8.89)#15,938 |
| 82. | 05403 | 8.7% | 11.5%(-2.84)#82 | 18.1%(-9.38)#16,288 |
| 83. | 05446 | 8.6% | 11.5%(-2.90)#83 | 18.1%(-9.45)#16,330 |
| 84. | 05853 | 8.6% | 11.5%(-2.95)#84 | 18.1%(-9.49)#16,371 |
| 85. | 05773 | 8.4% | 11.5%(-3.10)#85 | 18.1%(-9.64)#16,478 |
| 86. | 05602 | 7.3% | 11.5%(-4.17)#86 | 18.1%(-10.7)#17,165 |
| 87. | 05452 | 7.3% | 11.5%(-4.24)#87 | 18.1%(-10.8)#17,206 |
| 88. | 05457 | 7.1% | 11.5%(-4.37)#88 | 18.1%(-10.9)#17,290 |
| 89. | 05656 | 7.1% | 11.5%(-4.41)#89 | 18.1%(-11.0)#17,325 |
| 90. | 05458 | 6.7% | 11.5%(-4.85)#90 | 18.1%(-11.4)#17,624 |
| 91. | 05874 | 6.4% | 11.5%(-5.13)#91 | 18.1%(-11.7)#17,812 |
| 92. | 05250 | 6.2% | 11.5%(-5.31)#92 | 18.1%(-11.9)#17,931 |
| 93. | 05454 | 6.1% | 11.5%(-5.40)#93 | 18.1%(-11.9)#17,988 |
| 94. | 05051 | 6.1% | 11.5%(-5.44)#94 | 18.1%(-12.0)#18,023 |
| 95. | 05352 | 5.9% | 11.5%(-5.64)#95 | 18.1%(-12.2)#18,166 |
| 96. | 05443 | 5.6% | 11.5%(-5.96)#96 | 18.1%(-12.5)#18,378 |
| 97. | 05036 | 5.5% | 11.5%(-6.06)#97 | 18.1%(-12.6)#18,463 |
| 98. | 05857 | 5.1% | 11.5%(-6.42)#98 | 18.1%(-13.0)#18,705 |
| 99. | 05345 | 5.1% | 11.5%(-6.43)#99 | 18.1%(-13.0)#18,718 |
| 100. | 05738 | 4.0% | 11.5%(-7.48)#100 | 18.1%(-14.0)#19,473 |
Common Questions
What are the Top 10 Zip Codes with the Highest Poverty Level Among Children Under the Age of 5 in Vermont?
Top 10 Zip Codes with the Highest Poverty Level Among Children Under the Age of 5 in Vermont are:
What zip code has the Highest Poverty Level Among Children Under the Age of 5 in Vermont?
05059 has the Highest Poverty Level Among Children Under the Age of 5 in Vermont with 100.0%.
What is the Poverty Level Among Children Under the Age of 5 in the State of Vermont?
Poverty Level Among Children Under the Age of 5 in Vermont is 11.5%.
What is the Poverty Level Among Children Under the Age of 5 in the United States?
Poverty Level Among Children Under the Age of 5 in the United States is 18.1%.