Rusk, TX Map & Demographics
Rusk Map
Rusk Overview
$16,713
PER CAPITA INCOME
$73,821
AVG FAMILY INCOME
$68,611
AVG HOUSEHOLD INCOME
36.6%
WAGE / INCOME GAP [ % ]
63.4¢/ $1
WAGE / INCOME GAP [ $ ]
0.38
INEQUALITY / GINI INDEX
5,344
TOTAL POPULATION
3,734
MALE POPULATION
1,610
FEMALE POPULATION
231.93
MALES / 100 FEMALES
43.12
FEMALES / 100 MALES
39.7
MEDIAN AGE
3.1
AVG FAMILY SIZE
2.6
AVG HOUSEHOLD SIZE
1,238
LABOR FORCE [ PEOPLE ]
26.7%
PERCENT IN LABOR FORCE
9.6%
UNEMPLOYMENT RATE
Rusk Zip Codes
Income in Rusk
Income Overview in Rusk
Per Capita Income in Rusk is $16,713, while median incomes of families and households are $73,821 and $68,611 respectively.
| Characteristic | Number | Measure |
| Per Capita Income | 5,344 | $16,713 |
| Median Family Income | 697 | $73,821 |
| Mean Family Income | 697 | $87,964 |
| Median Household Income | 996 | $68,611 |
| Mean Household Income | 996 | $83,151 |
| Income Deficit | 697 | $0 |
| Wage / Income Gap (%) | 5,344 | 36.55% |
| Wage / Income Gap ($) | 5,344 | 63.45¢ per $1 |
| Gini / Inequality Index | 5,344 | 0.38 |
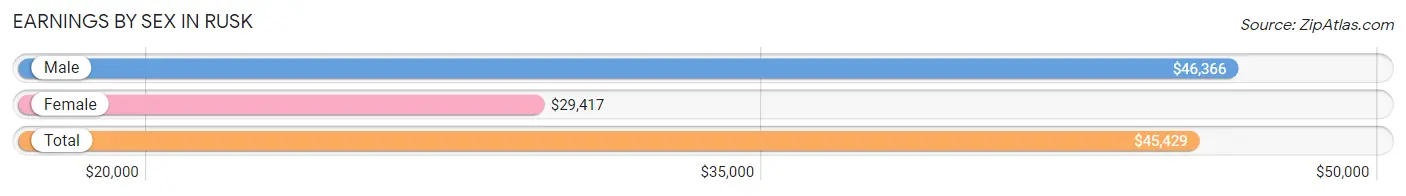
Earnings by Sex in Rusk
Average Earnings in Rusk are $45,429, $46,366 for men and $29,417 for women, a difference of 36.5%.
| Sex | Number | Average Earnings |
| Male | 823 (60.5%) | $46,366 |
| Female | 538 (39.5%) | $29,417 |
| Total | 1,361 (100.0%) | $45,429 |
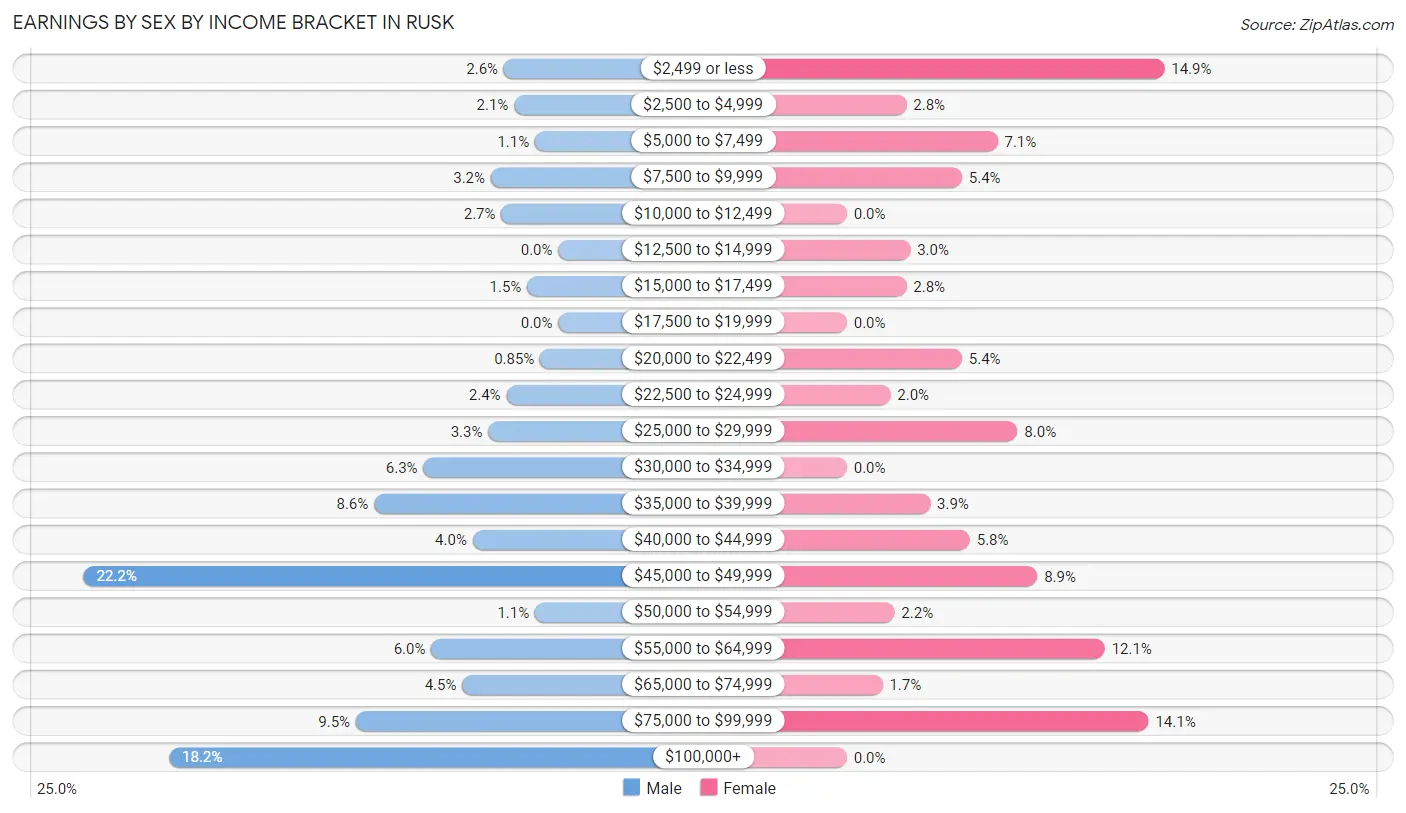
Earnings by Sex by Income Bracket in Rusk
The most common earnings brackets in Rusk are $45,000 to $49,999 for men (183 | 22.2%) and $2,499 or less for women (80 | 14.9%).
| Income | Male | Female |
| $2,499 or less | 21 (2.5%) | 80 (14.9%) |
| $2,500 to $4,999 | 17 (2.1%) | 15 (2.8%) |
| $5,000 to $7,499 | 9 (1.1%) | 38 (7.1%) |
| $7,500 to $9,999 | 26 (3.2%) | 29 (5.4%) |
| $10,000 to $12,499 | 22 (2.7%) | 0 (0.0%) |
| $12,500 to $14,999 | 0 (0.0%) | 16 (3.0%) |
| $15,000 to $17,499 | 12 (1.5%) | 15 (2.8%) |
| $17,500 to $19,999 | 0 (0.0%) | 0 (0.0%) |
| $20,000 to $22,499 | 7 (0.9%) | 29 (5.4%) |
| $22,500 to $24,999 | 20 (2.4%) | 11 (2.0%) |
| $25,000 to $29,999 | 27 (3.3%) | 43 (8.0%) |
| $30,000 to $34,999 | 52 (6.3%) | 0 (0.0%) |
| $35,000 to $39,999 | 71 (8.6%) | 21 (3.9%) |
| $40,000 to $44,999 | 33 (4.0%) | 31 (5.8%) |
| $45,000 to $49,999 | 183 (22.2%) | 48 (8.9%) |
| $50,000 to $54,999 | 9 (1.1%) | 12 (2.2%) |
| $55,000 to $64,999 | 49 (5.9%) | 65 (12.1%) |
| $65,000 to $74,999 | 37 (4.5%) | 9 (1.7%) |
| $75,000 to $99,999 | 78 (9.5%) | 76 (14.1%) |
| $100,000+ | 150 (18.2%) | 0 (0.0%) |
| Total | 823 (100.0%) | 538 (100.0%) |
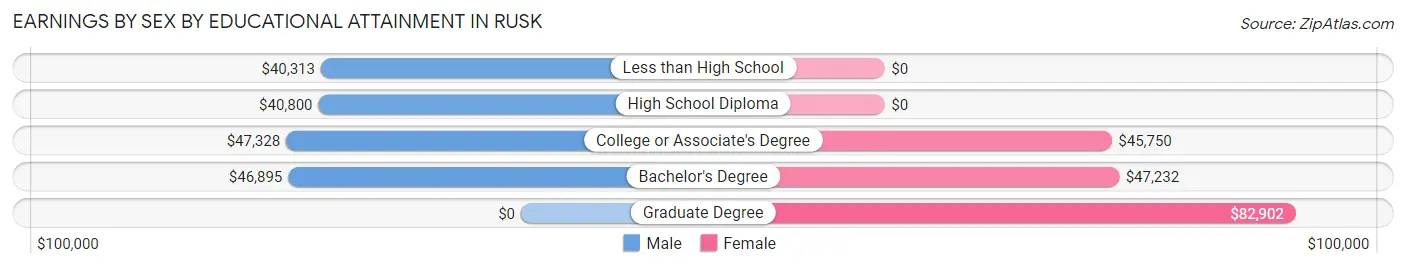
Earnings by Sex by Educational Attainment in Rusk
Average earnings in Rusk are $46,749 for men and $44,342 for women, a difference of 5.1%. Men with an educational attainment of college or associate's degree enjoy the highest average annual earnings of $47,328, while those with less than high school education earn the least with $40,313. Women with an educational attainment of graduate degree earn the most with the average annual earnings of $82,902, while those with college or associate's degree education have the smallest earnings of $45,750.
| Educational Attainment | Male Income | Female Income |
| Less than High School | $40,313 | $0 |
| High School Diploma | $40,800 | $0 |
| College or Associate's Degree | $47,328 | $45,750 |
| Bachelor's Degree | $46,895 | $47,232 |
| Graduate Degree | - | - |
| Total | $46,749 | $44,342 |
Family Income in Rusk
Family Income Brackets in Rusk
According to the Rusk family income data, there are 145 families falling into the $100,000 to $149,999 income range, which is the most common income bracket and makes up 20.8% of all families.
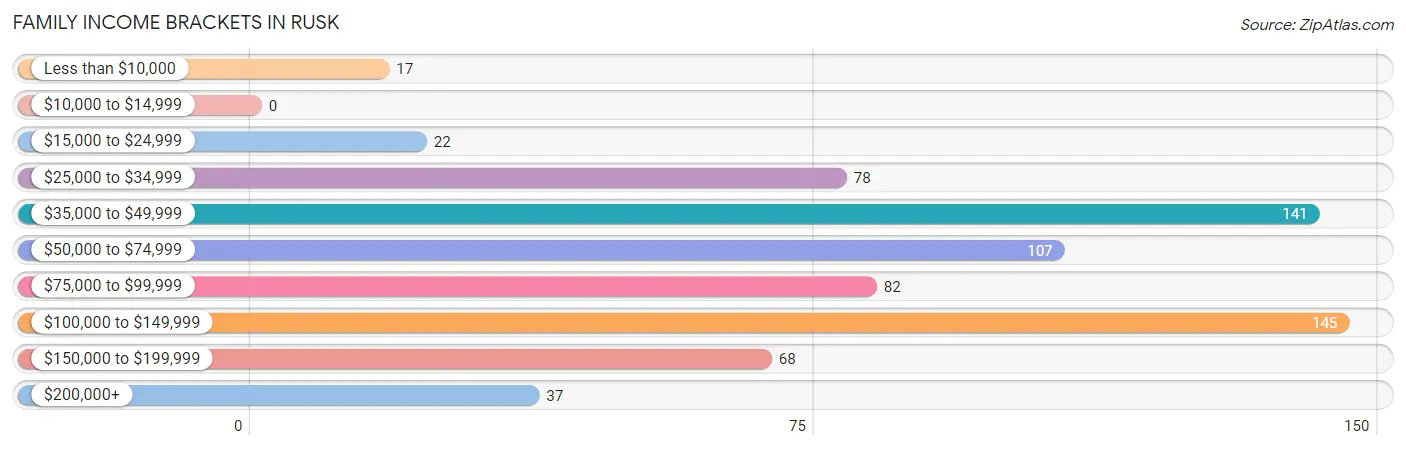
| Income Bracket | # Families | % Families |
| Less than $10,000 | 17 | 2.4% |
| $10,000 to $14,999 | 0 | 0.0% |
| $15,000 to $24,999 | 22 | 3.2% |
| $25,000 to $34,999 | 78 | 11.2% |
| $35,000 to $49,999 | 141 | 20.2% |
| $50,000 to $74,999 | 107 | 15.4% |
| $75,000 to $99,999 | 82 | 11.8% |
| $100,000 to $149,999 | 145 | 20.8% |
| $150,000 to $199,999 | 68 | 9.8% |
| $200,000+ | 37 | 5.3% |
Family Income by Famaliy Size in Rusk
5-person families (45 | 6.5%) account for the highest median family income in Rusk with $89,509 per family, while 2-person families (250 | 35.9%) have the highest median income of $35,625 per family member.
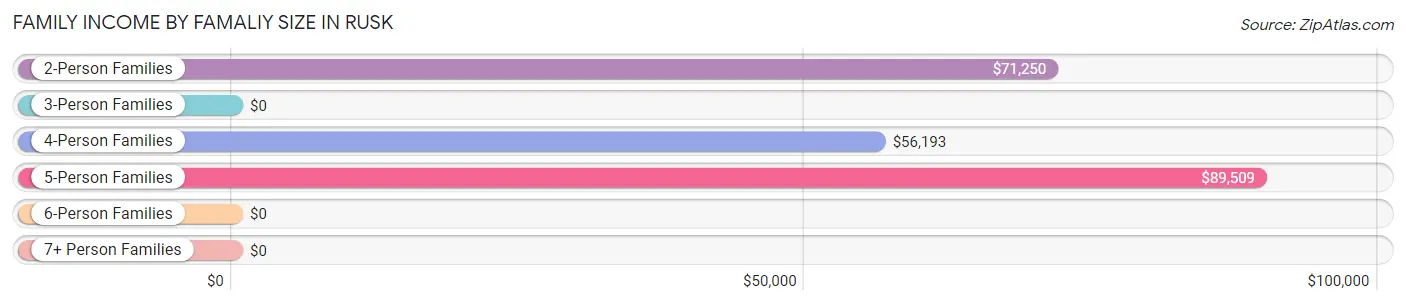
| Income Bracket | # Families | Median Income |
| 2-Person Families | 250 (35.9%) | $71,250 |
| 3-Person Families | 160 (23.0%) | $0 |
| 4-Person Families | 223 (32.0%) | $56,193 |
| 5-Person Families | 45 (6.5%) | $89,509 |
| 6-Person Families | 9 (1.3%) | $0 |
| 7+ Person Families | 10 (1.4%) | $0 |
| Total | 697 (100.0%) | $73,821 |
Family Income by Number of Earners in Rusk
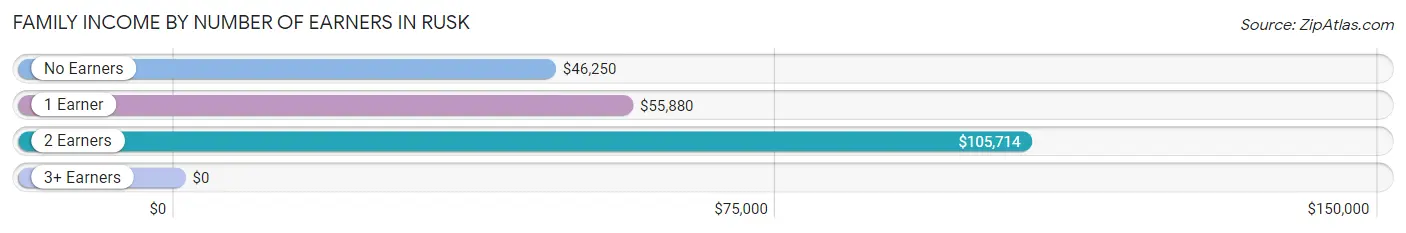
| Number of Earners | # Families | Median Income |
| No Earners | 84 (12.0%) | $46,250 |
| 1 Earner | 287 (41.2%) | $55,880 |
| 2 Earners | 252 (36.1%) | $105,714 |
| 3+ Earners | 74 (10.6%) | $0 |
| Total | 697 (100.0%) | $73,821 |
Household Income in Rusk
Household Income Brackets in Rusk
With 232 households falling in the category, the $35,000 to $49,999 income range is the most frequent in Rusk, accounting for 23.3% of all households.
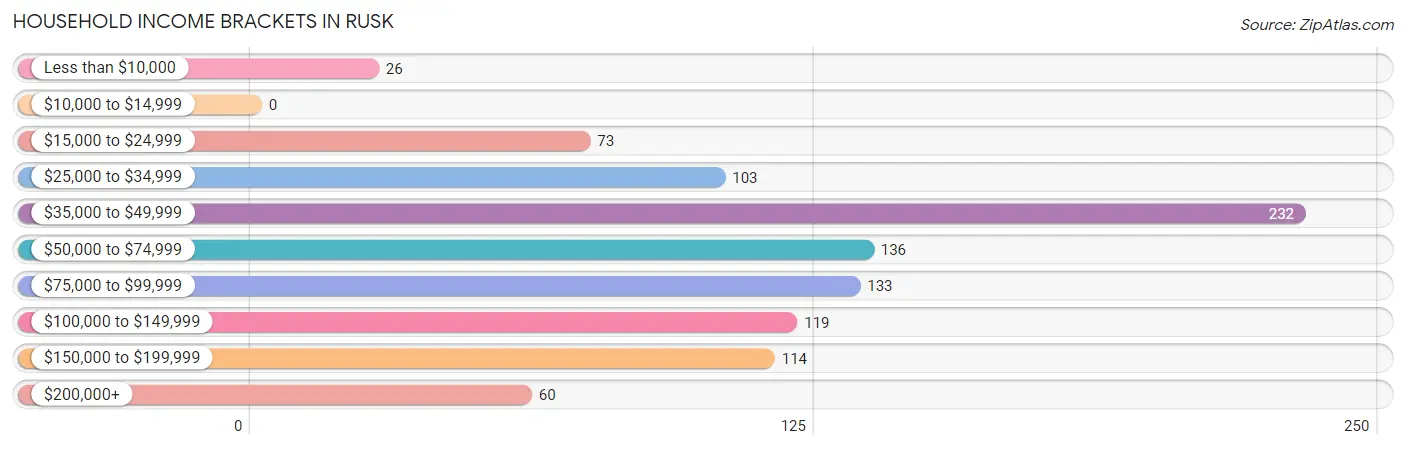
| Income Bracket | # Households | % Households |
| Less than $10,000 | 26 | 2.6% |
| $10,000 to $14,999 | 0 | 0.0% |
| $15,000 to $24,999 | 73 | 7.3% |
| $25,000 to $34,999 | 103 | 10.3% |
| $35,000 to $49,999 | 232 | 23.3% |
| $50,000 to $74,999 | 136 | 13.7% |
| $75,000 to $99,999 | 133 | 13.4% |
| $100,000 to $149,999 | 119 | 11.9% |
| $150,000 to $199,999 | 114 | 11.4% |
| $200,000+ | 60 | 6.0% |
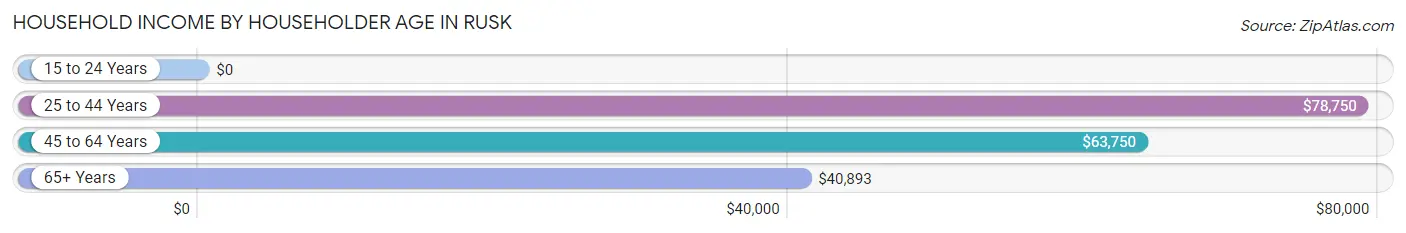
Household Income by Householder Age in Rusk
The median household income in Rusk is $68,611, with the highest median household income of $78,750 found in the 25 to 44 years age bracket for the primary householder. A total of 384 households (38.6%) fall into this category. Meanwhile, the 15 to 24 years age bracket for the primary householder has the lowest median household income of $0, with 14 households (1.4%) in this group.
| Income Bracket | # Households | Median Income |
| 15 to 24 Years | 14 (1.4%) | $0 |
| 25 to 44 Years | 384 (38.6%) | $78,750 |
| 45 to 64 Years | 398 (40.0%) | $63,750 |
| 65+ Years | 200 (20.1%) | $40,893 |
| Total | 996 (100.0%) | $68,611 |
Poverty in Rusk
Income Below Poverty by Sex and Age in Rusk
With 7.0% poverty level for males and 13.6% for females among the residents of Rusk, 55 to 64 year old males and 6 to 11 year old females are the most vulnerable to poverty, with 22 males (20.9%) and 88 females (44.7%) in their respective age groups living below the poverty level.
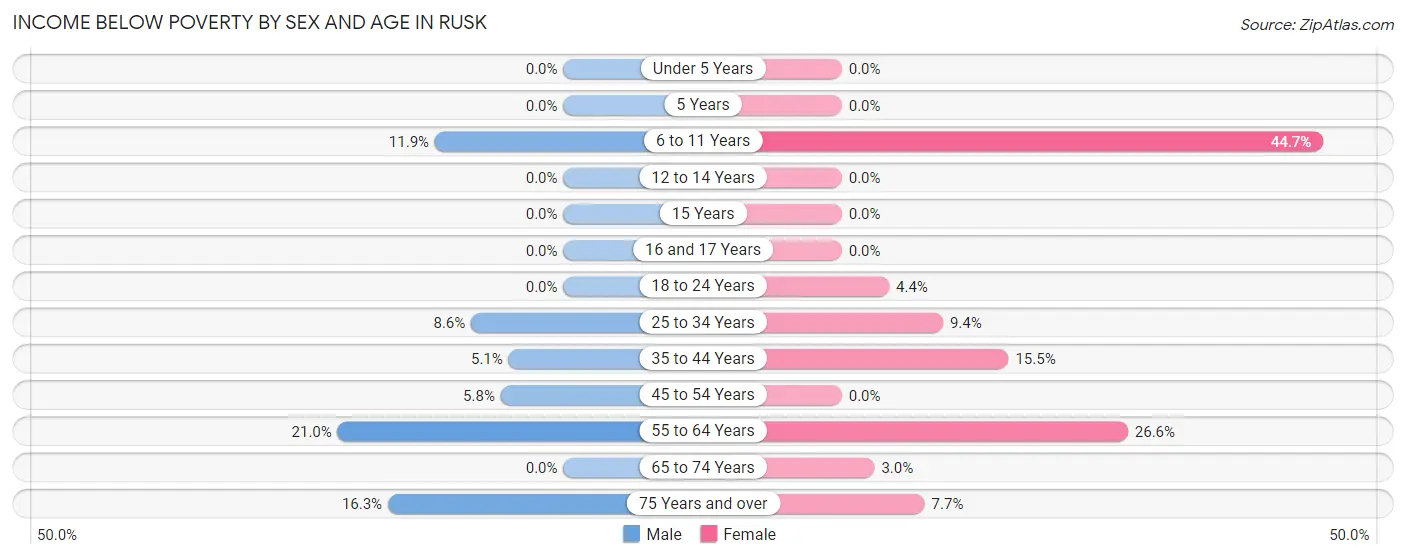
| Age Bracket | Male | Female |
| Under 5 Years | 0 (0.0%) | 0 (0.0%) |
| 5 Years | 0 (0.0%) | 0 (0.0%) |
| 6 to 11 Years | 18 (11.9%) | 88 (44.7%) |
| 12 to 14 Years | 0 (0.0%) | 0 (0.0%) |
| 15 Years | 0 (0.0%) | 0 (0.0%) |
| 16 and 17 Years | 0 (0.0%) | 0 (0.0%) |
| 18 to 24 Years | 0 (0.0%) | 5 (4.4%) |
| 25 to 34 Years | 22 (8.6%) | 17 (9.4%) |
| 35 to 44 Years | 6 (5.1%) | 28 (15.5%) |
| 45 to 54 Years | 15 (5.8%) | 0 (0.0%) |
| 55 to 64 Years | 22 (20.9%) | 30 (26.6%) |
| 65 to 74 Years | 0 (0.0%) | 4 (3.0%) |
| 75 Years and over | 7 (16.3%) | 5 (7.7%) |
| Total | 90 (7.0%) | 177 (13.6%) |
Income Above Poverty by Sex and Age in Rusk
According to the poverty statistics in Rusk, males aged under 5 years and females aged under 5 years are the age groups that are most secure financially, with 100.0% of males and 100.0% of females in these age groups living above the poverty line.
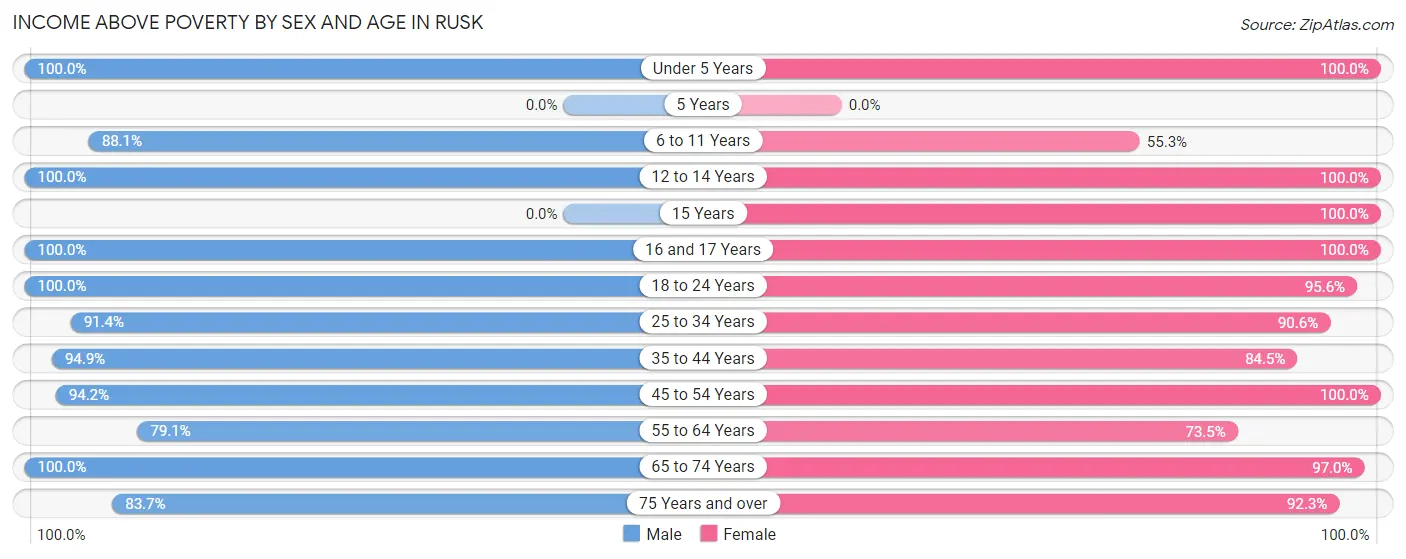
| Age Bracket | Male | Female |
| Under 5 Years | 189 (100.0%) | 75 (100.0%) |
| 5 Years | 0 (0.0%) | 0 (0.0%) |
| 6 to 11 Years | 133 (88.1%) | 109 (55.3%) |
| 12 to 14 Years | 25 (100.0%) | 30 (100.0%) |
| 15 Years | 0 (0.0%) | 22 (100.0%) |
| 16 and 17 Years | 25 (100.0%) | 29 (100.0%) |
| 18 to 24 Years | 55 (100.0%) | 109 (95.6%) |
| 25 to 34 Years | 235 (91.4%) | 164 (90.6%) |
| 35 to 44 Years | 112 (94.9%) | 153 (84.5%) |
| 45 to 54 Years | 243 (94.2%) | 161 (100.0%) |
| 55 to 64 Years | 83 (79.0%) | 83 (73.5%) |
| 65 to 74 Years | 66 (100.0%) | 128 (97.0%) |
| 75 Years and over | 36 (83.7%) | 60 (92.3%) |
| Total | 1,202 (93.0%) | 1,123 (86.4%) |
Income Below Poverty Among Married-Couple Families in Rusk
The poverty statistics for married-couple families in Rusk show that 1.5% or 7 of the total 480 families live below the poverty line. Families with no children have the highest poverty rate of 3.6%, comprising of 7 families. On the other hand, families with 1 or 2 children have the lowest poverty rate of 0.0%, which includes 0 families.
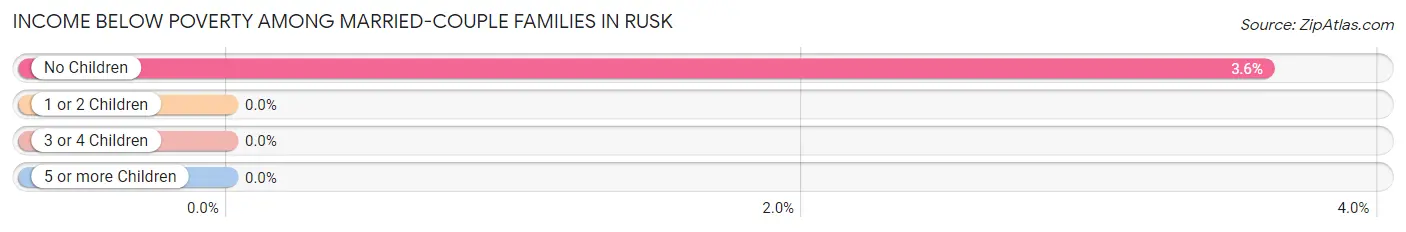
| Children | Above Poverty | Below Poverty |
| No Children | 187 (96.4%) | 7 (3.6%) |
| 1 or 2 Children | 250 (100.0%) | 0 (0.0%) |
| 3 or 4 Children | 36 (100.0%) | 0 (0.0%) |
| 5 or more Children | 0 (0.0%) | 0 (0.0%) |
| Total | 473 (98.5%) | 7 (1.5%) |
Income Below Poverty Among Single-Parent Households in Rusk
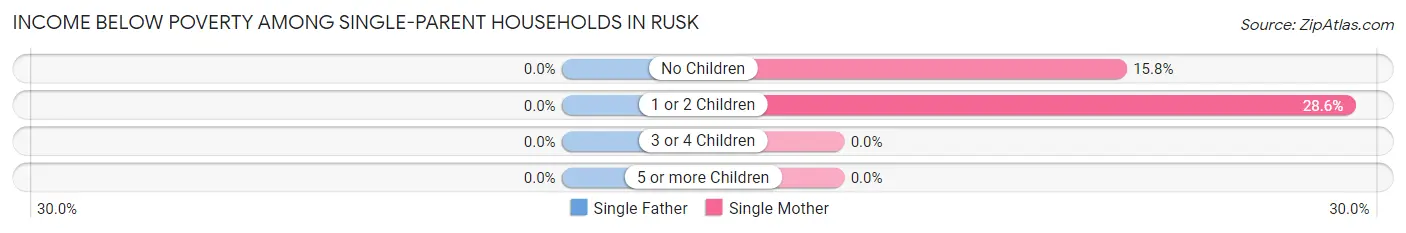
| Children | Single Father | Single Mother |
| No Children | 0 (0.0%) | 15 (15.8%) |
| 1 or 2 Children | 0 (0.0%) | 34 (28.6%) |
| 3 or 4 Children | 0 (0.0%) | 0 (0.0%) |
| 5 or more Children | 0 (0.0%) | 0 (0.0%) |
| Total | 0 (0.0%) | 49 (22.9%) |
Income Below Poverty Among Married-Couple vs Single-Parent Households in Rusk
The poverty data for Rusk shows that 7 of the married-couple family households (1.5%) and 49 of the single-parent households (22.6%) are living below the poverty level. Within the married-couple family households, those with no children have the highest poverty rate, with 7 households (3.6%) falling below the poverty line. Among the single-parent households, those with 1 or 2 children have the highest poverty rate, with 34 household (27.9%) living below poverty.
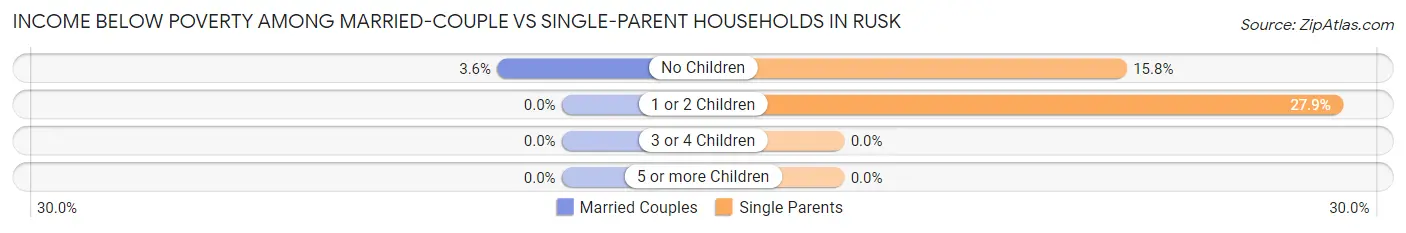
| Children | Married-Couple Families | Single-Parent Households |
| No Children | 7 (3.6%) | 15 (15.8%) |
| 1 or 2 Children | 0 (0.0%) | 34 (27.9%) |
| 3 or 4 Children | 0 (0.0%) | 0 (0.0%) |
| 5 or more Children | 0 (0.0%) | 0 (0.0%) |
| Total | 7 (1.5%) | 49 (22.6%) |
Race in Rusk
The most populous races in Rusk are White / Caucasian (2,909 | 54.4%), Black / African American (1,650 | 30.9%), and Hispanic or Latino (808 | 15.1%).
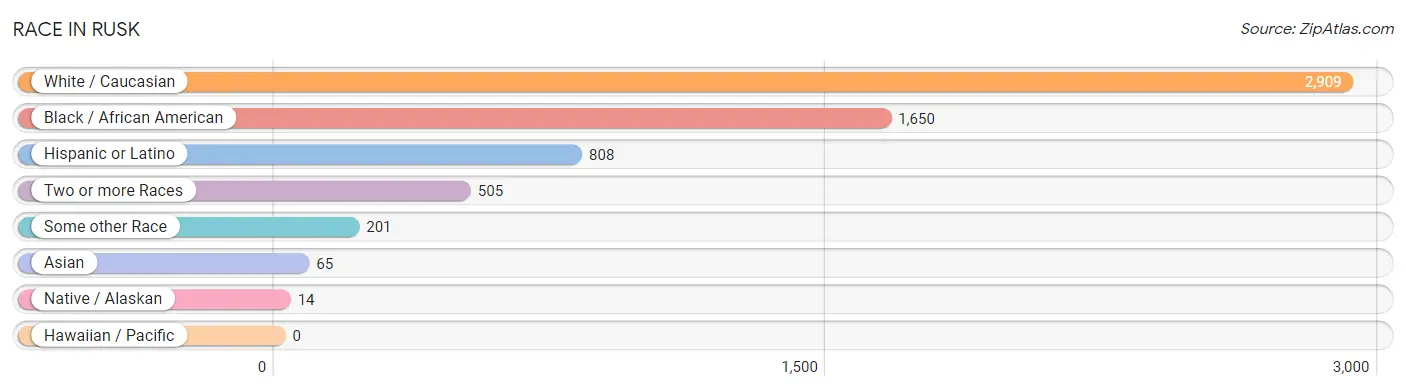
| Race | # Population | % Population |
| Asian | 65 | 1.2% |
| Black / African American | 1,650 | 30.9% |
| Hawaiian / Pacific | 0 | 0.0% |
| Hispanic or Latino | 808 | 15.1% |
| Native / Alaskan | 14 | 0.3% |
| White / Caucasian | 2,909 | 54.4% |
| Two or more Races | 505 | 9.5% |
| Some other Race | 201 | 3.8% |
| Total | 5,344 | 100.0% |
Ancestry in Rusk
The most populous ancestries reported in Rusk are American (957 | 17.9%), Mexican (758 | 14.2%), English (188 | 3.5%), German (165 | 3.1%), and Irish (161 | 3.0%), together accounting for 41.7% of all Rusk residents.
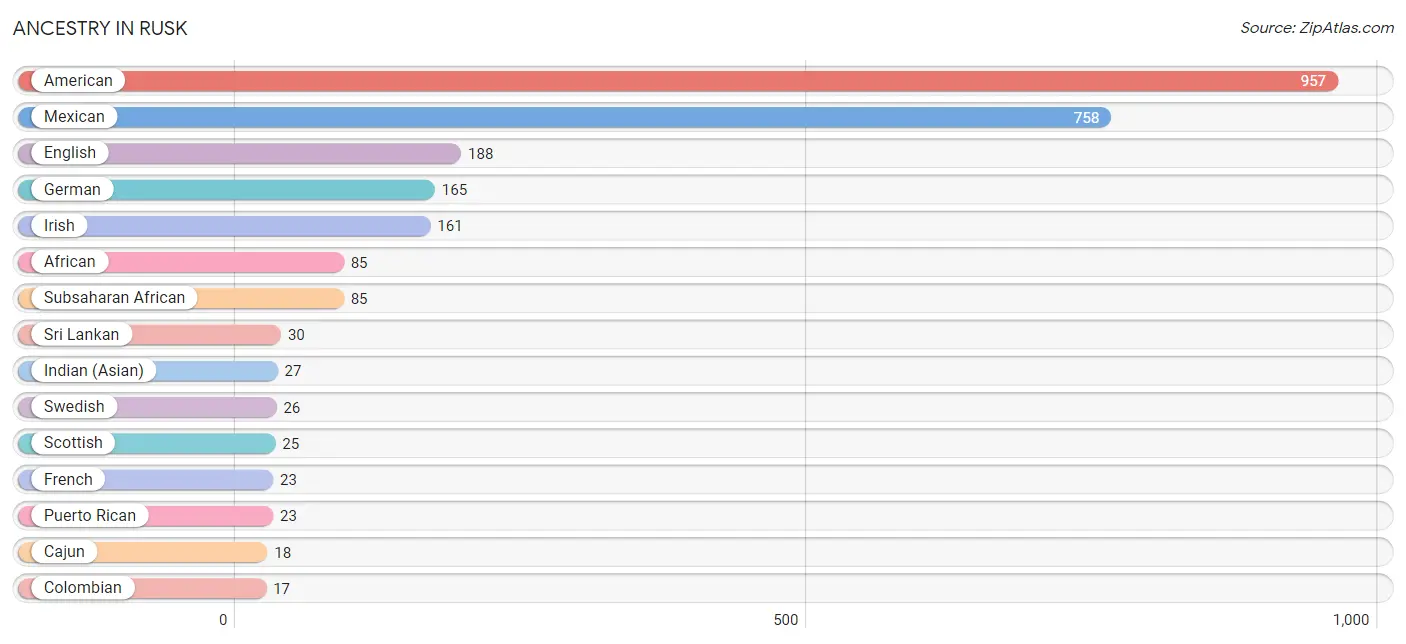
| Ancestry | # Population | % Population |
| African | 85 | 1.6% |
| American | 957 | 17.9% |
| British | 4 | 0.1% |
| Burmese | 4 | 0.1% |
| Cajun | 18 | 0.3% |
| Central American | 6 | 0.1% |
| Cherokee | 8 | 0.2% |
| Choctaw | 6 | 0.1% |
| Colombian | 17 | 0.3% |
| English | 188 | 3.5% |
| French | 23 | 0.4% |
| German | 165 | 3.1% |
| Honduran | 4 | 0.1% |
| Indian (Asian) | 27 | 0.5% |
| Irish | 161 | 3.0% |
| Italian | 17 | 0.3% |
| Mexican | 758 | 14.2% |
| Pakistani | 4 | 0.1% |
| Polish | 11 | 0.2% |
| Puerto Rican | 23 | 0.4% |
| Salvadoran | 2 | 0.0% |
| Scotch-Irish | 11 | 0.2% |
| Scottish | 25 | 0.5% |
| South American | 17 | 0.3% |
| Spanish | 4 | 0.1% |
| Sri Lankan | 30 | 0.6% |
| Subsaharan African | 85 | 1.6% |
| Swedish | 26 | 0.5% |
| Welsh | 13 | 0.2% | View All 29 Rows |
Immigrants in Rusk
The most numerous immigrant groups reported in Rusk came from Latin America (218 | 4.1%), Central America (212 | 4.0%), Mexico (170 | 3.2%), Asia (30 | 0.6%), and South Eastern Asia (26 | 0.5%), together accounting for 12.3% of all Rusk residents.
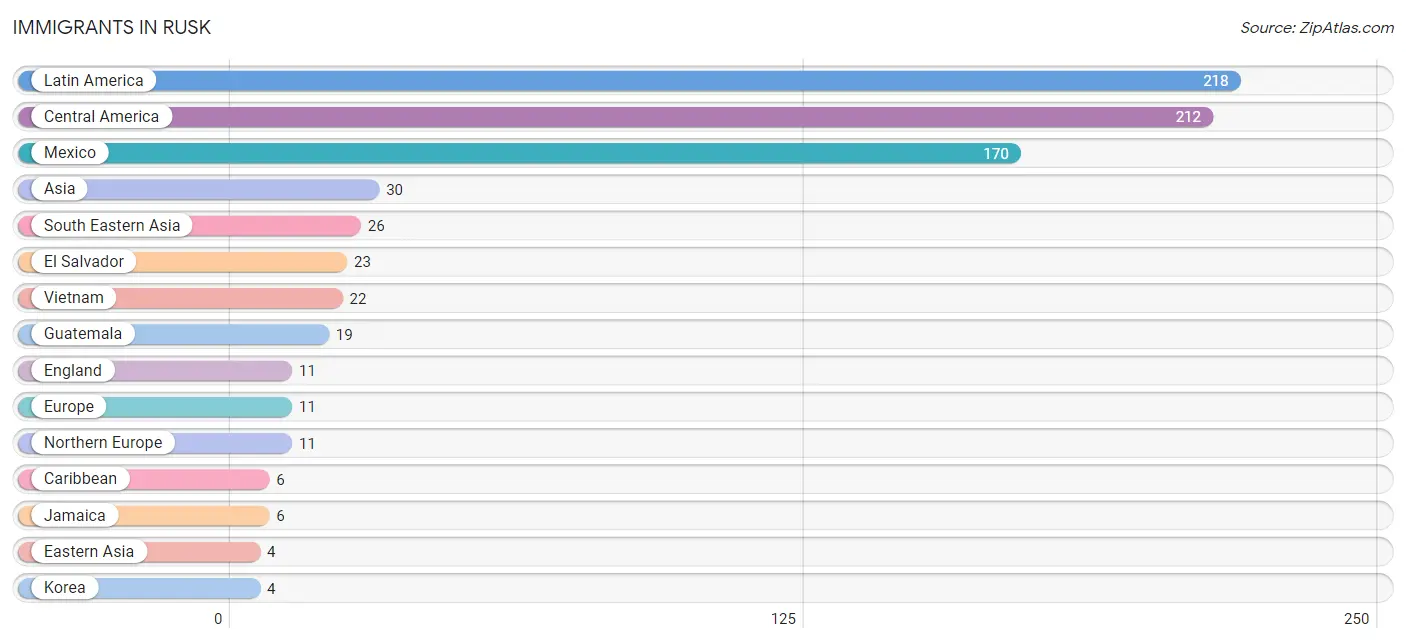
| Immigration Origin | # Population | % Population |
| Africa | 3 | 0.1% |
| Asia | 30 | 0.6% |
| Caribbean | 6 | 0.1% |
| Central America | 212 | 4.0% |
| Eastern Asia | 4 | 0.1% |
| El Salvador | 23 | 0.4% |
| England | 11 | 0.2% |
| Europe | 11 | 0.2% |
| Guatemala | 19 | 0.4% |
| Jamaica | 6 | 0.1% |
| Korea | 4 | 0.1% |
| Latin America | 218 | 4.1% |
| Mexico | 170 | 3.2% |
| Northern Europe | 11 | 0.2% |
| South Eastern Asia | 26 | 0.5% |
| Thailand | 4 | 0.1% |
| Vietnam | 22 | 0.4% | View All 17 Rows |
Sex and Age in Rusk
Sex and Age in Rusk
The most populous age groups in Rusk are 25 to 29 Years (500 | 13.4%) for men and 5 to 9 Years (190 | 11.8%) for women.
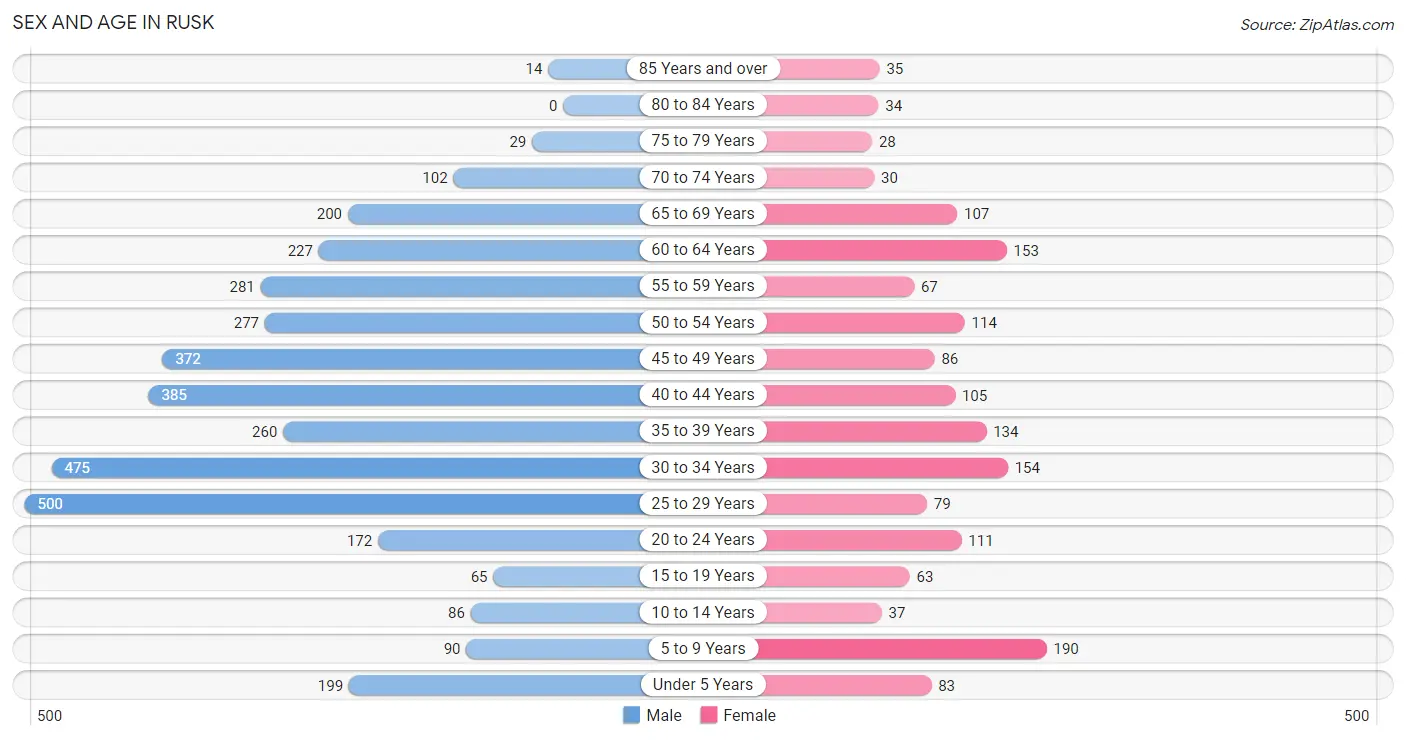
| Age Bracket | Male | Female |
| Under 5 Years | 199 (5.3%) | 83 (5.2%) |
| 5 to 9 Years | 90 (2.4%) | 190 (11.8%) |
| 10 to 14 Years | 86 (2.3%) | 37 (2.3%) |
| 15 to 19 Years | 65 (1.7%) | 63 (3.9%) |
| 20 to 24 Years | 172 (4.6%) | 111 (6.9%) |
| 25 to 29 Years | 500 (13.4%) | 79 (4.9%) |
| 30 to 34 Years | 475 (12.7%) | 154 (9.6%) |
| 35 to 39 Years | 260 (7.0%) | 134 (8.3%) |
| 40 to 44 Years | 385 (10.3%) | 105 (6.5%) |
| 45 to 49 Years | 372 (10.0%) | 86 (5.3%) |
| 50 to 54 Years | 277 (7.4%) | 114 (7.1%) |
| 55 to 59 Years | 281 (7.5%) | 67 (4.2%) |
| 60 to 64 Years | 227 (6.1%) | 153 (9.5%) |
| 65 to 69 Years | 200 (5.4%) | 107 (6.7%) |
| 70 to 74 Years | 102 (2.7%) | 30 (1.9%) |
| 75 to 79 Years | 29 (0.8%) | 28 (1.7%) |
| 80 to 84 Years | 0 (0.0%) | 34 (2.1%) |
| 85 Years and over | 14 (0.4%) | 35 (2.2%) |
| Total | 3,734 (100.0%) | 1,610 (100.0%) |
Families and Households in Rusk
Median Family Size in Rusk
The median family size in Rusk is 3.11 persons per family, with married-couple families (480 | 68.9%) accounting for the largest median family size of 3.37 persons per family. On the other hand, single male/father families (3 | 0.4%) represent the smallest median family size with 1.33 persons per family.
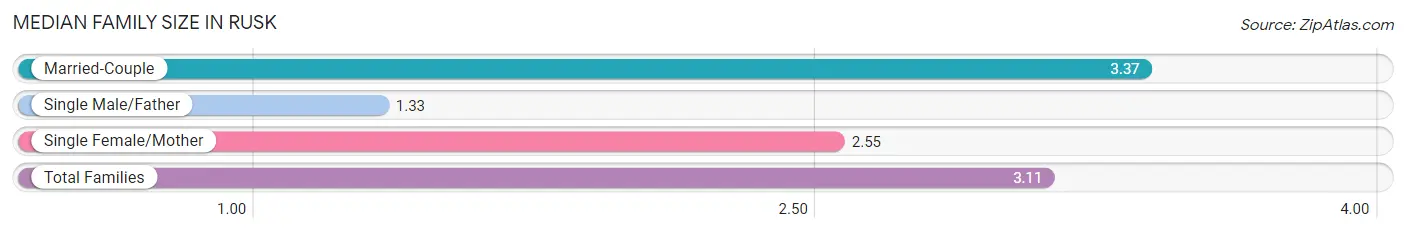
| Family Type | # Families | Family Size |
| Married-Couple | 480 (68.9%) | 3.37 |
| Single Male/Father | 3 (0.4%) | 1.33 |
| Single Female/Mother | 214 (30.7%) | 2.55 |
| Total Families | 697 (100.0%) | 3.11 |
Median Household Size in Rusk
The median household size in Rusk is 2.60 persons per household, with married-couple households (480 | 48.2%) accounting for the largest median household size of 3.43 persons per household. non-family households (299 | 30.0%) represent the smallest median household size with 1.11 persons per household.
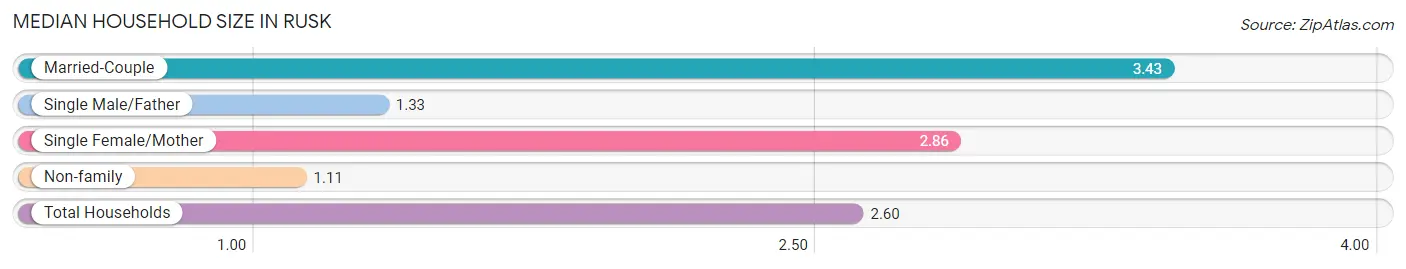
| Household Type | # Households | Household Size |
| Married-Couple | 480 (48.2%) | 3.43 |
| Single Male/Father | 3 (0.3%) | 1.33 |
| Single Female/Mother | 214 (21.5%) | 2.86 |
| Non-family | 299 (30.0%) | 1.11 |
| Total Households | 996 (100.0%) | 2.60 |
Household Size by Marriage Status in Rusk
Out of a total of 996 households in Rusk, 697 (70.0%) are family households, while 299 (30.0%) are nonfamily households. The most numerous type of family households are 2-person households, comprising 221, and the most common type of nonfamily households are 1-person households, comprising 265.
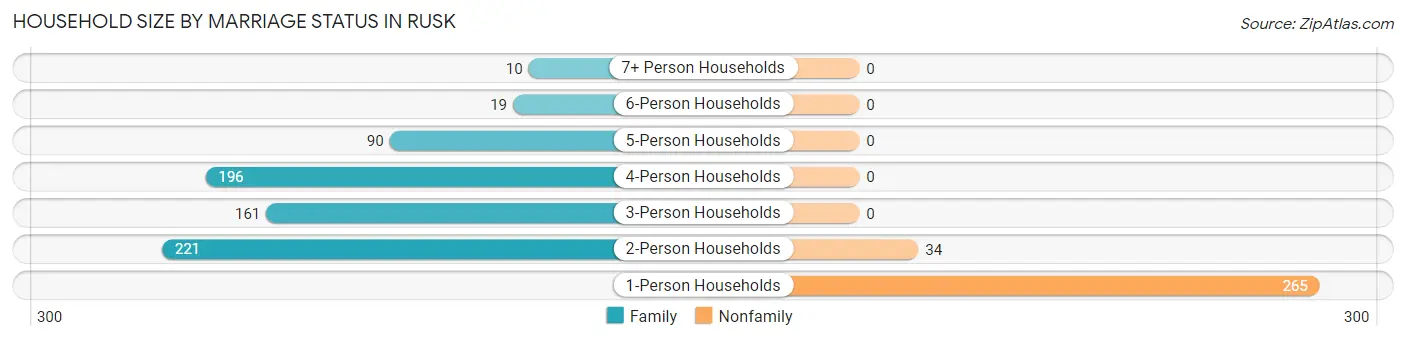
| Household Size | Family Households | Nonfamily Households |
| 1-Person Households | - | 265 (26.6%) |
| 2-Person Households | 221 (22.2%) | 34 (3.4%) |
| 3-Person Households | 161 (16.2%) | 0 (0.0%) |
| 4-Person Households | 196 (19.7%) | 0 (0.0%) |
| 5-Person Households | 90 (9.0%) | 0 (0.0%) |
| 6-Person Households | 19 (1.9%) | 0 (0.0%) |
| 7+ Person Households | 10 (1.0%) | 0 (0.0%) |
| Total | 697 (70.0%) | 299 (30.0%) |
Female Fertility in Rusk
Fertility by Age in Rusk
Average fertility rate in Rusk is 65.0 births per 1,000 women. Women in the age bracket of 20 to 34 years have the highest fertility rate with 140.0 births per 1,000 women. Women in the age bracket of 20 to 34 years acount for 100.0% of all women with births.
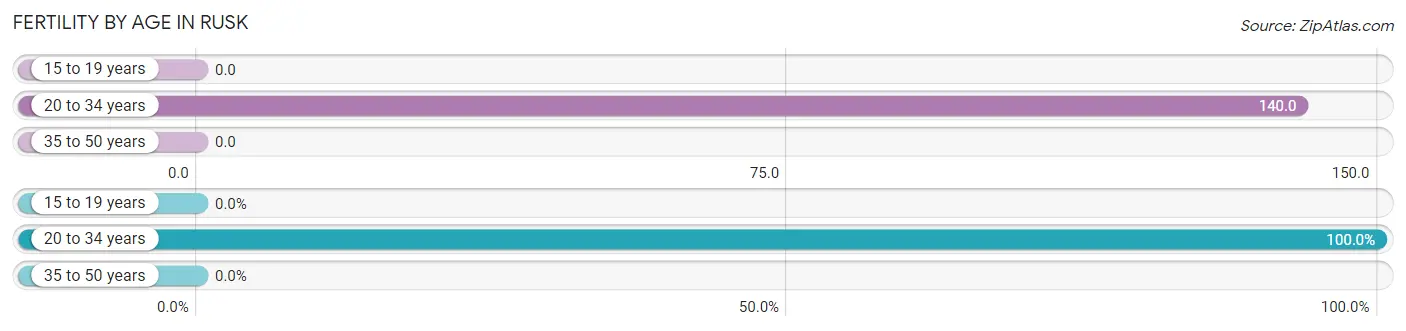
| Age Bracket | Women with Births | Births / 1,000 Women |
| 15 to 19 years | 0 (0.0%) | 0.0 |
| 20 to 34 years | 48 (100.0%) | 140.0 |
| 35 to 50 years | 0 (0.0%) | 0.0 |
| Total | 48 (100.0%) | 65.0 |
Fertility by Age by Marriage Status in Rusk
70.8% of women with births (48) in Rusk are married. The highest percentage of unmarried women with births falls into 20 to 34 years age bracket with 29.2% of them unmarried at the time of birth, while the lowest percentage of unmarried women with births belong to 20 to 34 years age bracket with 29.2% of them unmarried.
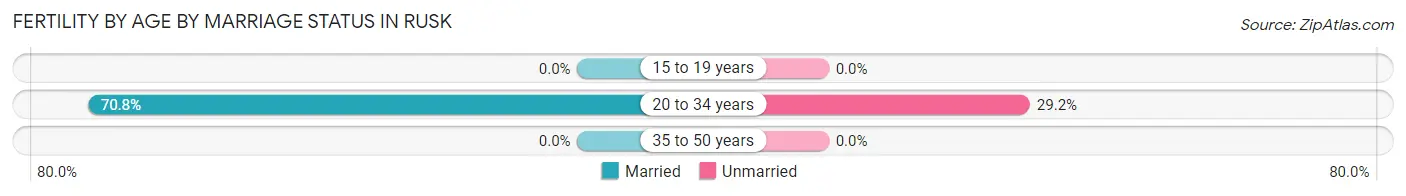
| Age Bracket | Married | Unmarried |
| 15 to 19 years | 0 (0.0%) | 0 (0.0%) |
| 20 to 34 years | 34 (70.8%) | 14 (29.2%) |
| 35 to 50 years | 0 (0.0%) | 0 (0.0%) |
| Total | 34 (70.8%) | 14 (29.2%) |
Fertility by Education in Rusk
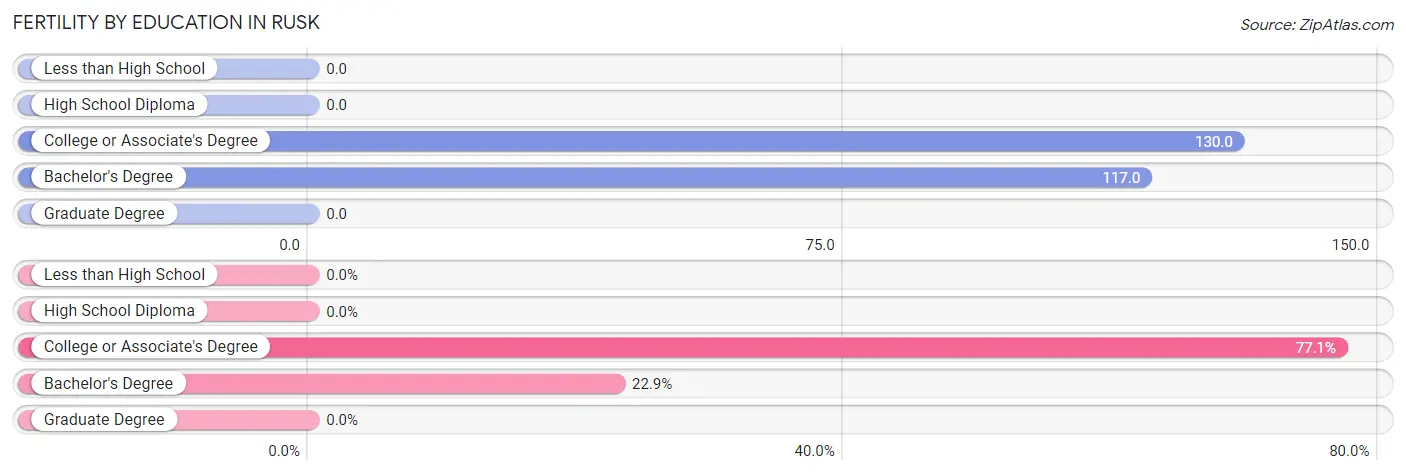
| Educational Attainment | Women with Births | Births / 1,000 Women |
| Less than High School | 0 (0.0%) | 0.0 |
| High School Diploma | 0 (0.0%) | 0.0 |
| College or Associate's Degree | 37 (77.1%) | 130.0 |
| Bachelor's Degree | 11 (22.9%) | 117.0 |
| Graduate Degree | 0 (0.0%) | 0.0 |
| Total | 48 (100.0%) | 65.0 |
Fertility by Education by Marriage Status in Rusk
29.2% of women with births in Rusk are unmarried. Women with the educational attainment of bachelor's degree are most likely to be married with 100.0% of them married at childbirth, while women with the educational attainment of college or associate's degree are least likely to be married with 37.8% of them unmarried at childbirth.
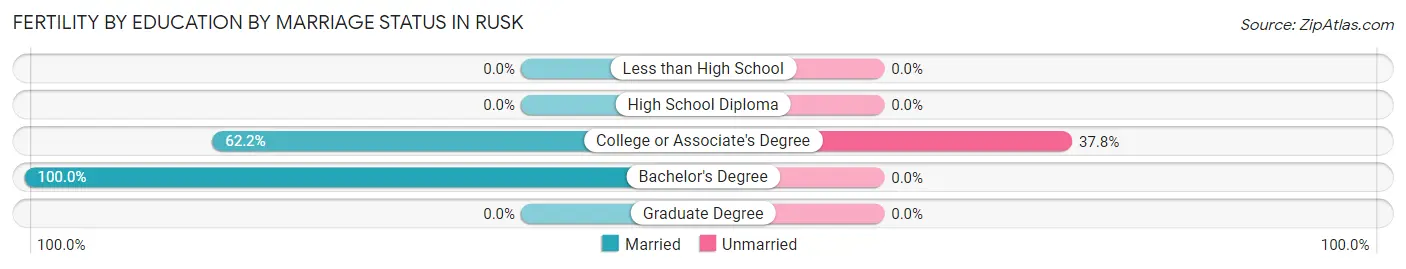
| Educational Attainment | Married | Unmarried |
| Less than High School | 0 (0.0%) | 0 (0.0%) |
| High School Diploma | 0 (0.0%) | 0 (0.0%) |
| College or Associate's Degree | 23 (62.2%) | 14 (37.8%) |
| Bachelor's Degree | 11 (100.0%) | 0 (0.0%) |
| Graduate Degree | 0 (0.0%) | 0 (0.0%) |
| Total | 34 (70.8%) | 14 (29.2%) |
Employment Characteristics in Rusk
Employment by Class of Employer in Rusk
Among the 1,117 employed individuals in Rusk, private company employees (666 | 59.6%), self-employed (not incorporated) (137 | 12.3%), and state government employees (122 | 10.9%) make up the most common classes of employment.
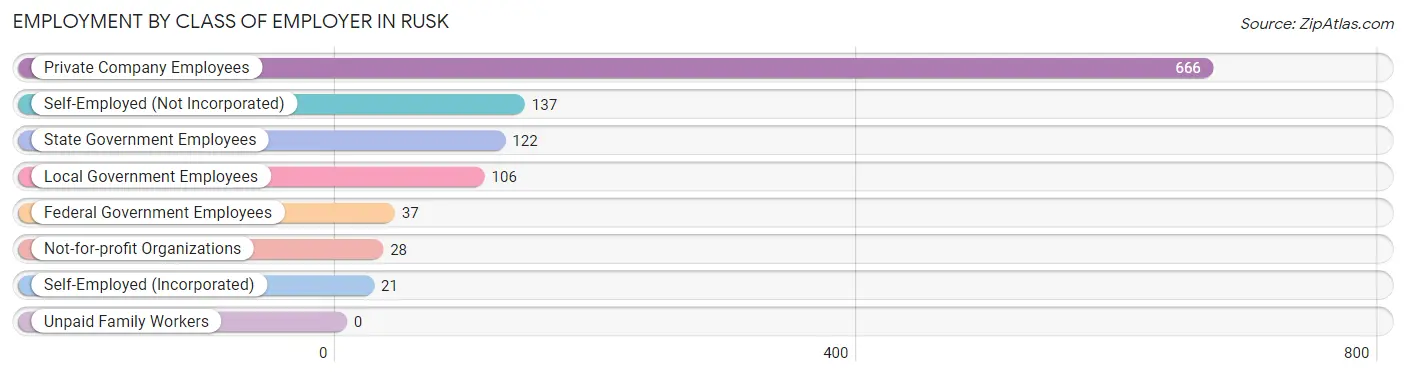
| Employer Class | # Employees | % Employees |
| Private Company Employees | 666 | 59.6% |
| Self-Employed (Incorporated) | 21 | 1.9% |
| Self-Employed (Not Incorporated) | 137 | 12.3% |
| Not-for-profit Organizations | 28 | 2.5% |
| Local Government Employees | 106 | 9.5% |
| State Government Employees | 122 | 10.9% |
| Federal Government Employees | 37 | 3.3% |
| Unpaid Family Workers | 0 | 0.0% |
| Total | 1,117 | 100.0% |
Employment Status by Age in Rusk
According to the labor force statistics for Rusk, out of the total population over 16 years of age (4,637), 26.7% or 1,238 individuals are in the labor force, with 9.6% or 119 of them unemployed. The age group with the highest labor force participation rate is 45 to 54 years, with 43.7% or 371 individuals in the labor force. Within the labor force, the 30 to 34 years age range has the highest percentage of unemployed individuals, with 41.1% or 92 of them being unemployed.
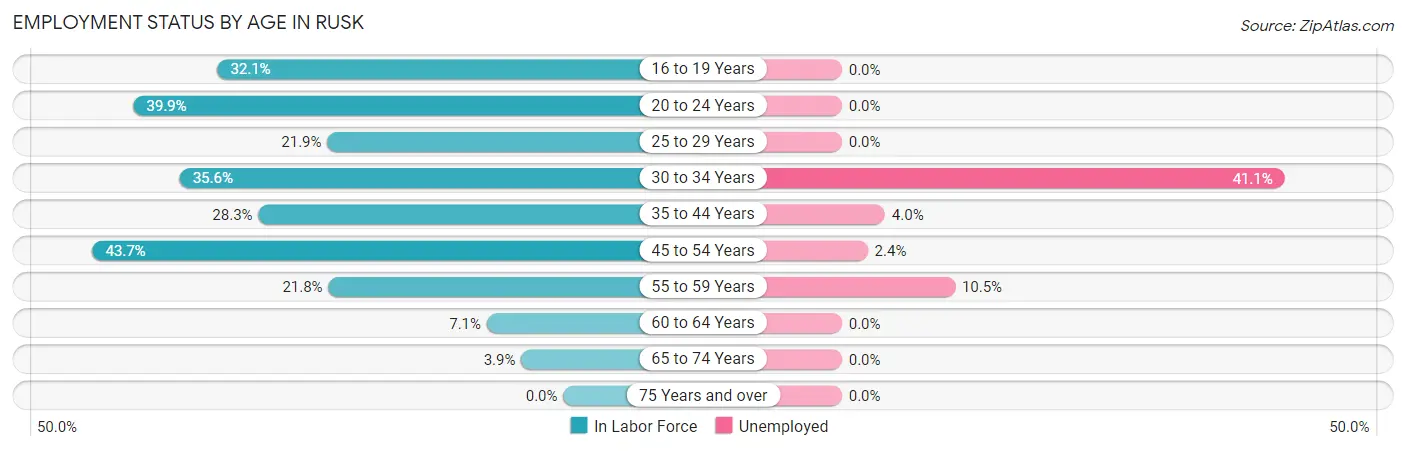
| Age Bracket | In Labor Force | Unemployed |
| 16 to 19 Years | 34 (32.1%) | 0 (0.0%) |
| 20 to 24 Years | 113 (39.9%) | 0 (0.0%) |
| 25 to 29 Years | 127 (21.9%) | 0 (0.0%) |
| 30 to 34 Years | 224 (35.6%) | 92 (41.1%) |
| 35 to 44 Years | 250 (28.3%) | 10 (4.0%) |
| 45 to 54 Years | 371 (43.7%) | 9 (2.4%) |
| 55 to 59 Years | 76 (21.8%) | 8 (10.5%) |
| 60 to 64 Years | 27 (7.1%) | 0 (0.0%) |
| 65 to 74 Years | 17 (3.9%) | 0 (0.0%) |
| 75 Years and over | 0 (0.0%) | 0 (0.0%) |
| Total | 1,238 (26.7%) | 119 (9.6%) |
Employment Status by Educational Attainment in Rusk
According to labor force statistics for Rusk, 29.3% of individuals (1,075) out of the total population between 25 and 64 years of age (3,669) are in the labor force, with 11.1% or 119 of them being unemployed. The group with the highest labor force participation rate are those with the educational attainment of bachelor's degree or higher, with 81.0% or 230 individuals in the labor force. Within the labor force, individuals with less than high school education have the highest percentage of unemployment, with 31.3% or 25 of them being unemployed.
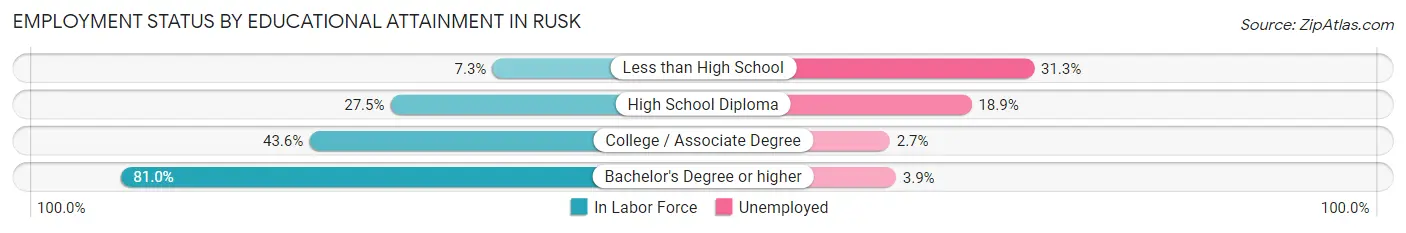
| Educational Attainment | In Labor Force | Unemployed |
| Less than High School | 80 (7.3%) | 344 (31.3%) |
| High School Diploma | 397 (27.5%) | 273 (18.9%) |
| College / Associate Degree | 368 (43.6%) | 23 (2.7%) |
| Bachelor's Degree or higher | 230 (81.0%) | 11 (3.9%) |
| Total | 1,075 (29.3%) | 407 (11.1%) |
Employment Occupations by Sex in Rusk
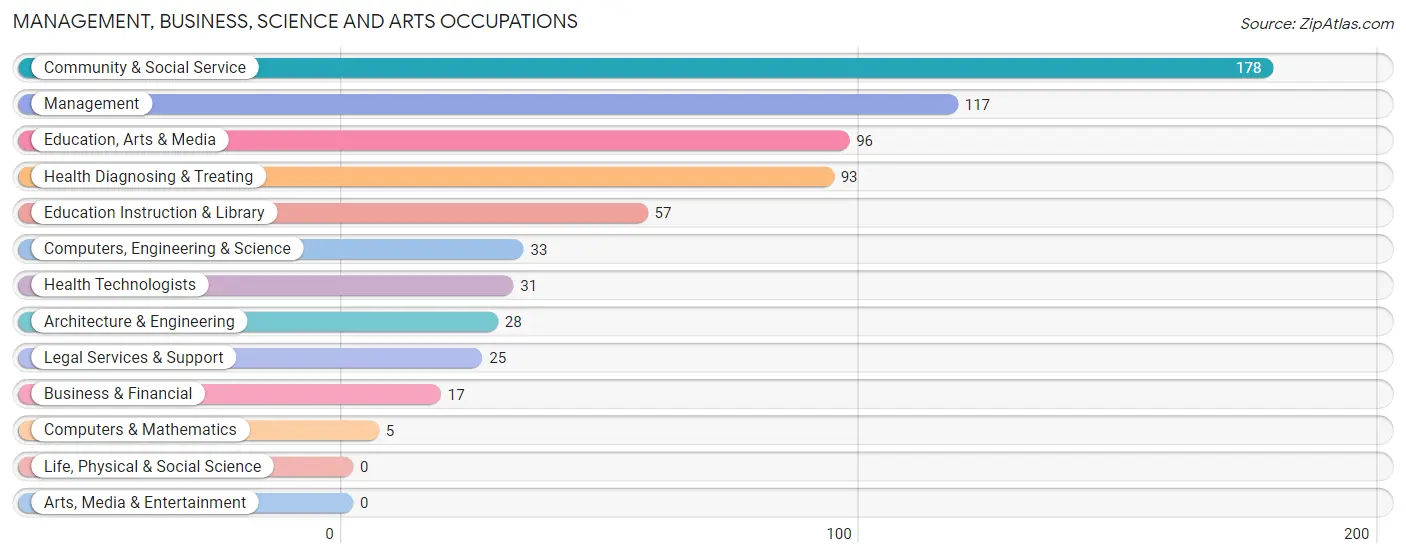
Management, Business, Science and Arts Occupations
The most common Management, Business, Science and Arts occupations in Rusk are Community & Social Service (178 | 15.9%), Management (117 | 10.4%), Education, Arts & Media (96 | 8.6%), Health Diagnosing & Treating (93 | 8.3%), and Education Instruction & Library (57 | 5.1%).
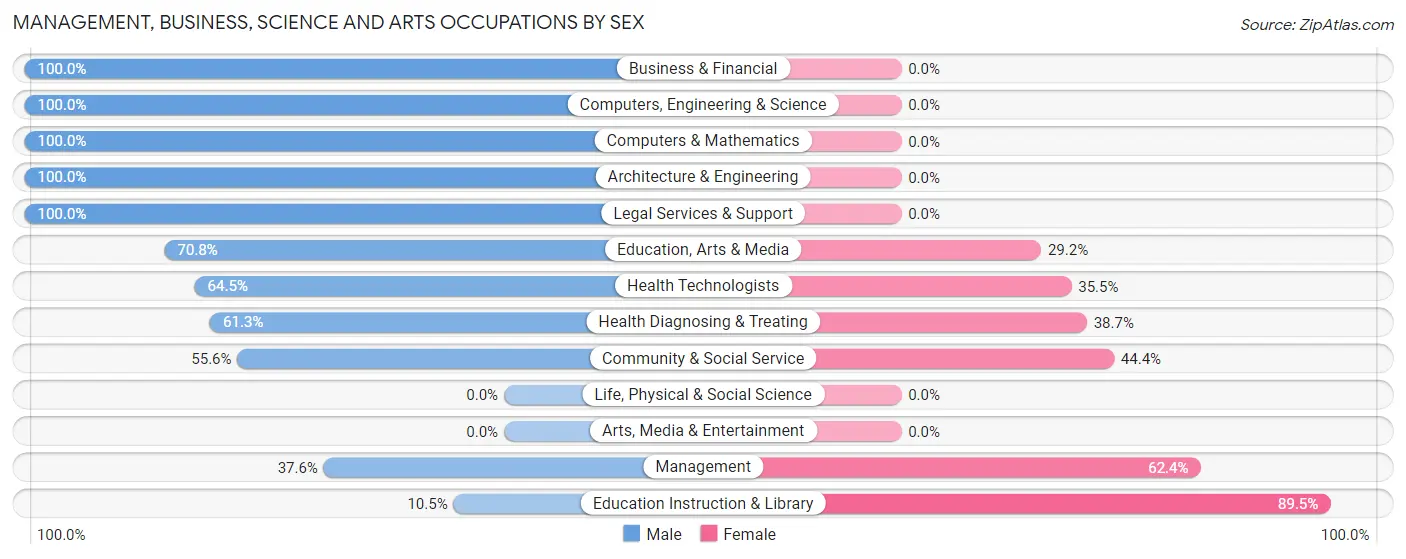
Management, Business, Science and Arts Occupations by Sex
Within the Management, Business, Science and Arts occupations in Rusk, the most male-oriented occupations are Business & Financial (100.0%), Computers, Engineering & Science (100.0%), and Computers & Mathematics (100.0%), while the most female-oriented occupations are Education Instruction & Library (89.5%), Management (62.4%), and Community & Social Service (44.4%).
| Occupation | Male | Female |
| Management | 44 (37.6%) | 73 (62.4%) |
| Business & Financial | 17 (100.0%) | 0 (0.0%) |
| Computers, Engineering & Science | 33 (100.0%) | 0 (0.0%) |
| Computers & Mathematics | 5 (100.0%) | 0 (0.0%) |
| Architecture & Engineering | 28 (100.0%) | 0 (0.0%) |
| Life, Physical & Social Science | 0 (0.0%) | 0 (0.0%) |
| Community & Social Service | 99 (55.6%) | 79 (44.4%) |
| Education, Arts & Media | 68 (70.8%) | 28 (29.2%) |
| Legal Services & Support | 25 (100.0%) | 0 (0.0%) |
| Education Instruction & Library | 6 (10.5%) | 51 (89.5%) |
| Arts, Media & Entertainment | 0 (0.0%) | 0 (0.0%) |
| Health Diagnosing & Treating | 57 (61.3%) | 36 (38.7%) |
| Health Technologists | 20 (64.5%) | 11 (35.5%) |
| Total (Category) | 250 (57.1%) | 188 (42.9%) |
| Total (Overall) | 650 (58.0%) | 470 (42.0%) |
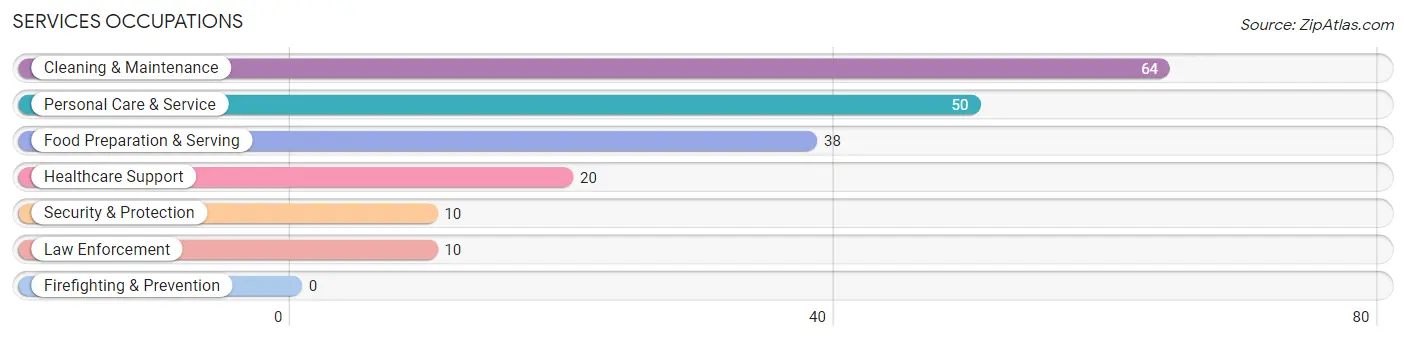
Services Occupations
The most common Services occupations in Rusk are Cleaning & Maintenance (64 | 5.7%), Personal Care & Service (50 | 4.5%), Food Preparation & Serving (38 | 3.4%), Healthcare Support (20 | 1.8%), and Security & Protection (10 | 0.9%).
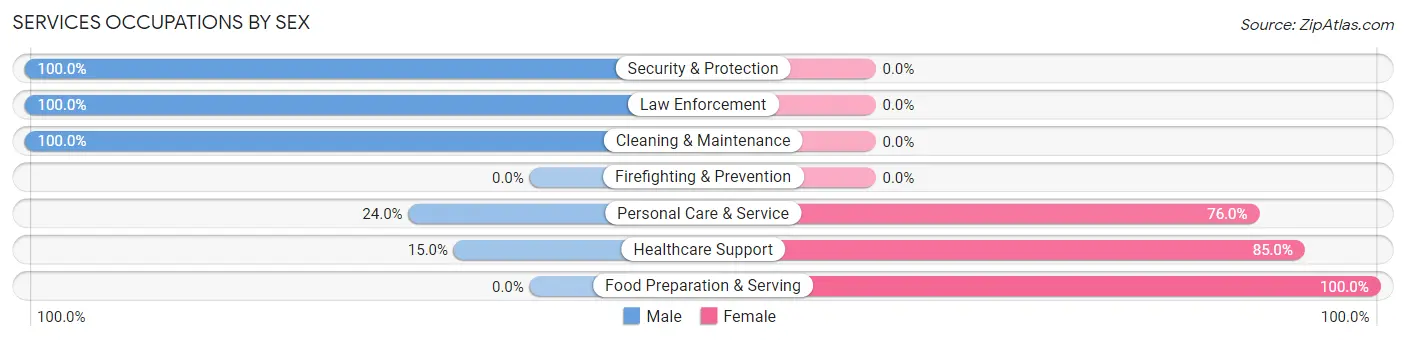
Services Occupations by Sex
Within the Services occupations in Rusk, the most male-oriented occupations are Security & Protection (100.0%), Law Enforcement (100.0%), and Cleaning & Maintenance (100.0%), while the most female-oriented occupations are Food Preparation & Serving (100.0%), Healthcare Support (85.0%), and Personal Care & Service (76.0%).
| Occupation | Male | Female |
| Healthcare Support | 3 (15.0%) | 17 (85.0%) |
| Security & Protection | 10 (100.0%) | 0 (0.0%) |
| Firefighting & Prevention | 0 (0.0%) | 0 (0.0%) |
| Law Enforcement | 10 (100.0%) | 0 (0.0%) |
| Food Preparation & Serving | 0 (0.0%) | 38 (100.0%) |
| Cleaning & Maintenance | 64 (100.0%) | 0 (0.0%) |
| Personal Care & Service | 12 (24.0%) | 38 (76.0%) |
| Total (Category) | 89 (48.9%) | 93 (51.1%) |
| Total (Overall) | 650 (58.0%) | 470 (42.0%) |
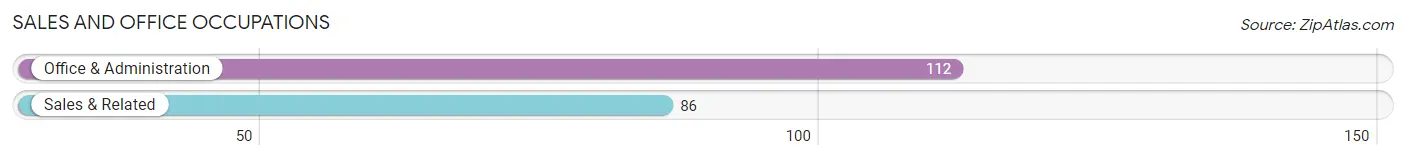
Sales and Office Occupations
The most common Sales and Office occupations in Rusk are Office & Administration (112 | 10.0%), and Sales & Related (86 | 7.7%).
Sales and Office Occupations by Sex
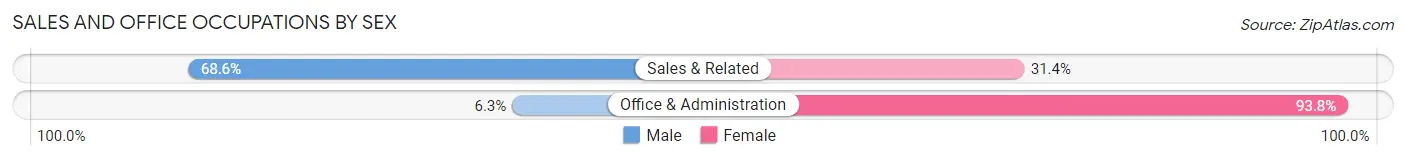
| Occupation | Male | Female |
| Sales & Related | 59 (68.6%) | 27 (31.4%) |
| Office & Administration | 7 (6.2%) | 105 (93.8%) |
| Total (Category) | 66 (33.3%) | 132 (66.7%) |
| Total (Overall) | 650 (58.0%) | 470 (42.0%) |
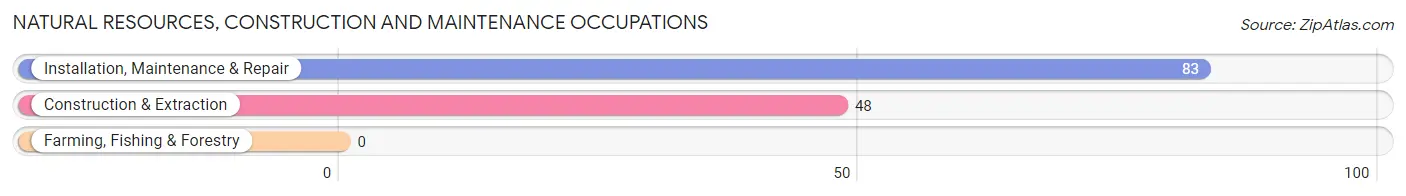
Natural Resources, Construction and Maintenance Occupations
The most common Natural Resources, Construction and Maintenance occupations in Rusk are Installation, Maintenance & Repair (83 | 7.4%), and Construction & Extraction (48 | 4.3%).
Natural Resources, Construction and Maintenance Occupations by Sex
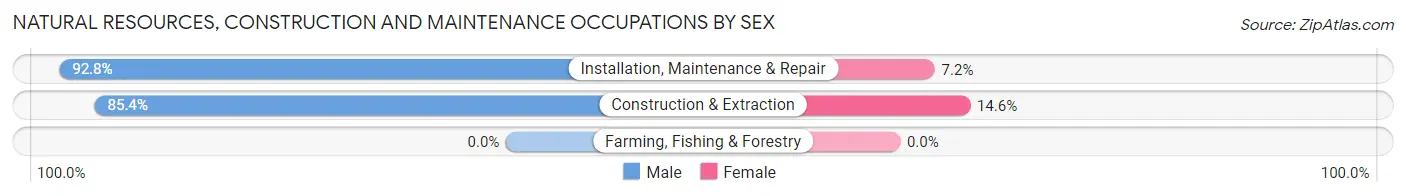
| Occupation | Male | Female |
| Farming, Fishing & Forestry | 0 (0.0%) | 0 (0.0%) |
| Construction & Extraction | 41 (85.4%) | 7 (14.6%) |
| Installation, Maintenance & Repair | 77 (92.8%) | 6 (7.2%) |
| Total (Category) | 118 (90.1%) | 13 (9.9%) |
| Total (Overall) | 650 (58.0%) | 470 (42.0%) |
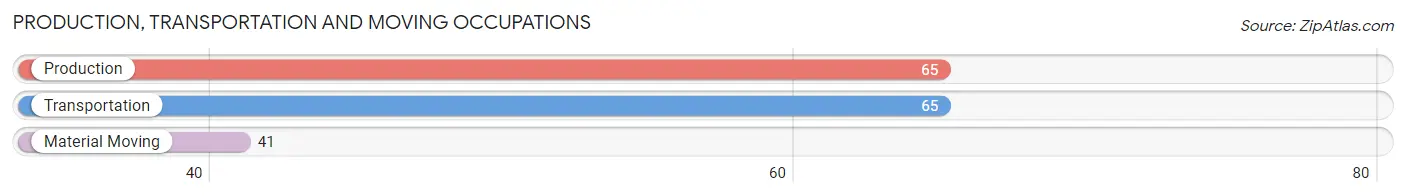
Production, Transportation and Moving Occupations
The most common Production, Transportation and Moving occupations in Rusk are Production (65 | 5.8%), Transportation (65 | 5.8%), and Material Moving (41 | 3.7%).
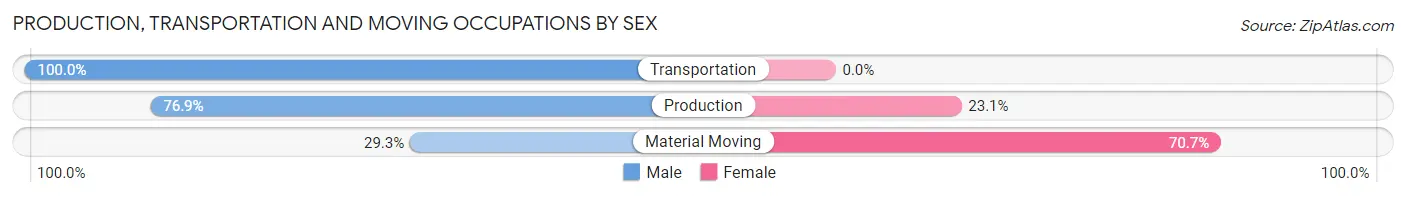
Production, Transportation and Moving Occupations by Sex
| Occupation | Male | Female |
| Production | 50 (76.9%) | 15 (23.1%) |
| Transportation | 65 (100.0%) | 0 (0.0%) |
| Material Moving | 12 (29.3%) | 29 (70.7%) |
| Total (Category) | 127 (74.3%) | 44 (25.7%) |
| Total (Overall) | 650 (58.0%) | 470 (42.0%) |
Employment Industries by Sex in Rusk
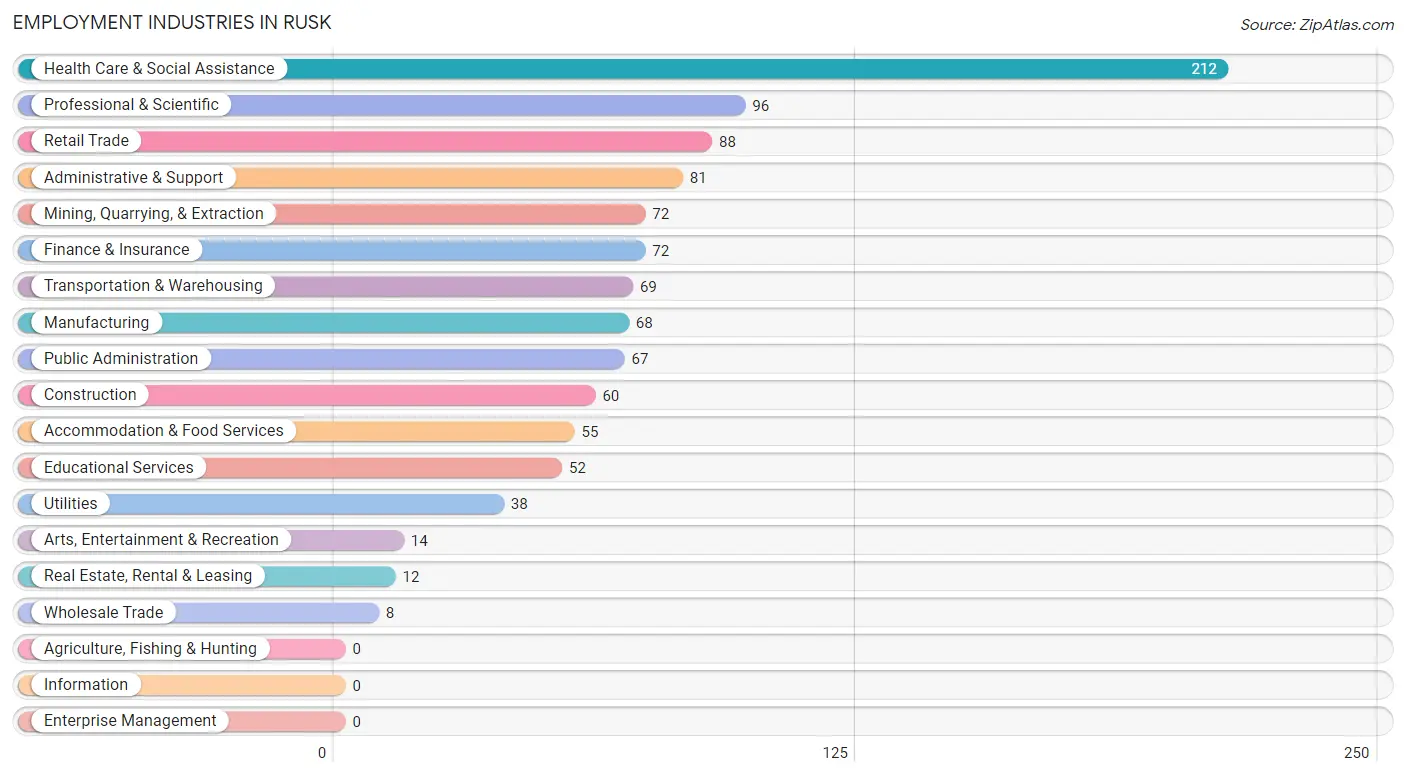
Employment Industries in Rusk
The major employment industries in Rusk include Health Care & Social Assistance (212 | 18.9%), Professional & Scientific (96 | 8.6%), Retail Trade (88 | 7.9%), Administrative & Support (81 | 7.2%), and Mining, Quarrying, & Extraction (72 | 6.4%).
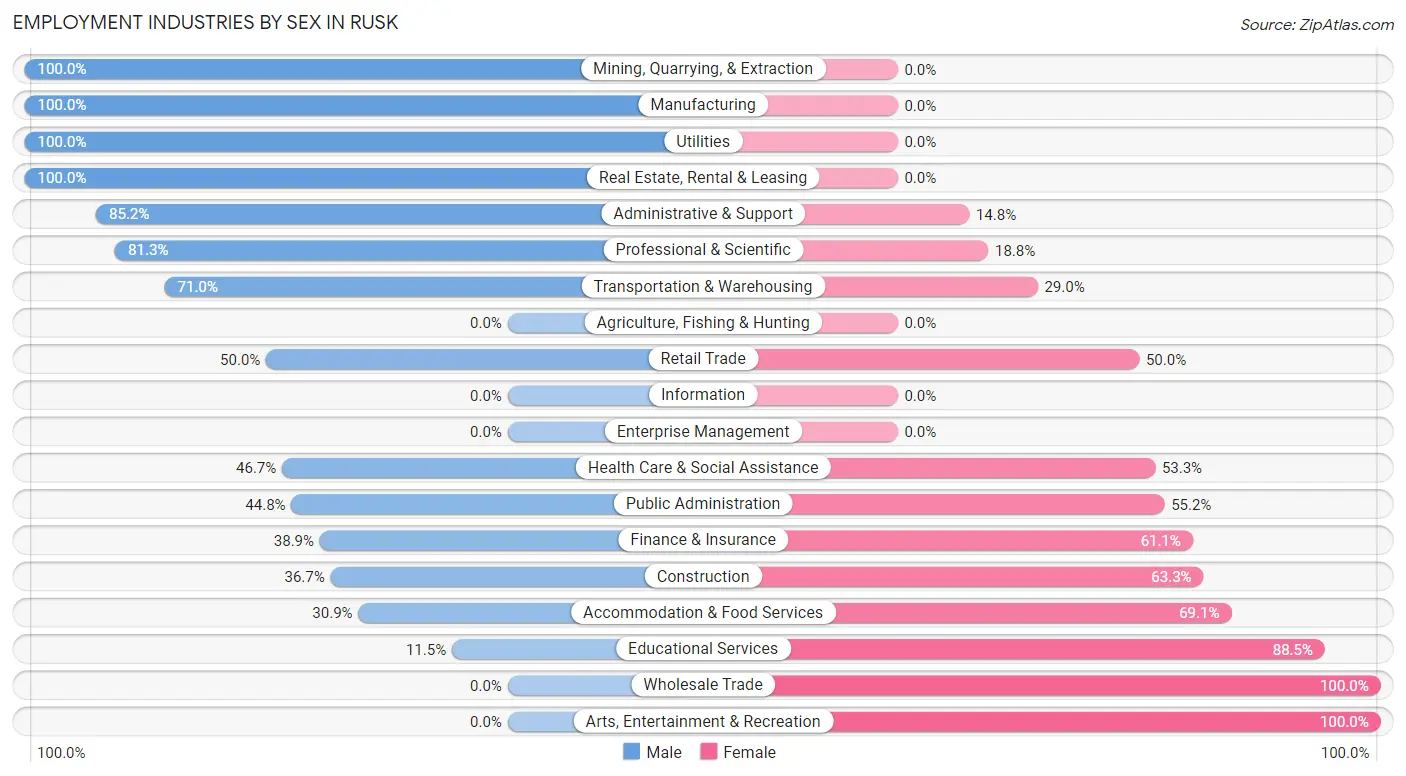
Employment Industries by Sex in Rusk
The Rusk industries that see more men than women are Mining, Quarrying, & Extraction (100.0%), Manufacturing (100.0%), and Utilities (100.0%), whereas the industries that tend to have a higher number of women are Wholesale Trade (100.0%), Arts, Entertainment & Recreation (100.0%), and Educational Services (88.5%).
| Industry | Male | Female |
| Agriculture, Fishing & Hunting | 0 (0.0%) | 0 (0.0%) |
| Mining, Quarrying, & Extraction | 72 (100.0%) | 0 (0.0%) |
| Construction | 22 (36.7%) | 38 (63.3%) |
| Manufacturing | 68 (100.0%) | 0 (0.0%) |
| Wholesale Trade | 0 (0.0%) | 8 (100.0%) |
| Retail Trade | 44 (50.0%) | 44 (50.0%) |
| Transportation & Warehousing | 49 (71.0%) | 20 (29.0%) |
| Utilities | 38 (100.0%) | 0 (0.0%) |
| Information | 0 (0.0%) | 0 (0.0%) |
| Finance & Insurance | 28 (38.9%) | 44 (61.1%) |
| Real Estate, Rental & Leasing | 12 (100.0%) | 0 (0.0%) |
| Professional & Scientific | 78 (81.2%) | 18 (18.8%) |
| Enterprise Management | 0 (0.0%) | 0 (0.0%) |
| Administrative & Support | 69 (85.2%) | 12 (14.8%) |
| Educational Services | 6 (11.5%) | 46 (88.5%) |
| Health Care & Social Assistance | 99 (46.7%) | 113 (53.3%) |
| Arts, Entertainment & Recreation | 0 (0.0%) | 14 (100.0%) |
| Accommodation & Food Services | 17 (30.9%) | 38 (69.1%) |
| Public Administration | 30 (44.8%) | 37 (55.2%) |
| Total | 650 (58.0%) | 470 (42.0%) |
Education in Rusk
School Enrollment in Rusk
The most common levels of schooling among the 701 students in Rusk are elementary school (266 | 38.0%), college / undergraduate (169 | 24.1%), and high school (145 | 20.7%).
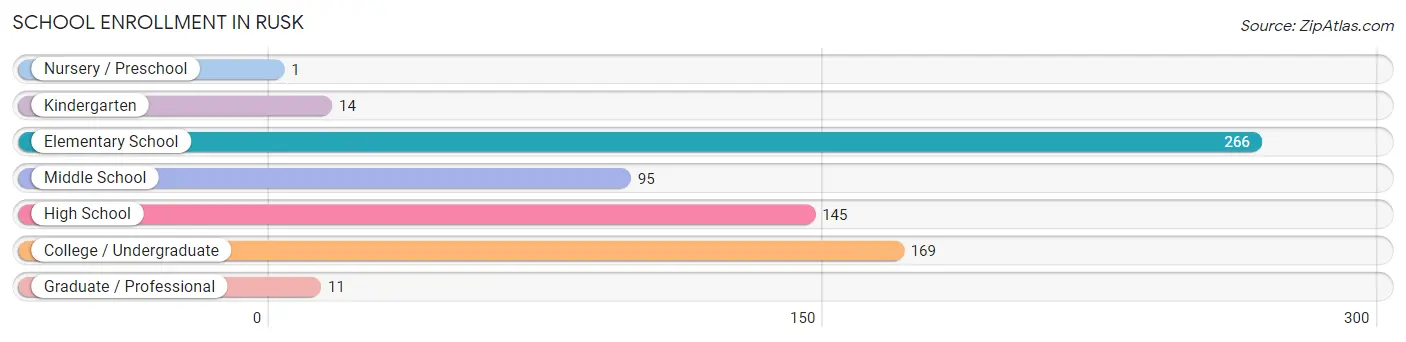
| School Level | # Students | % Students |
| Nursery / Preschool | 1 | 0.1% |
| Kindergarten | 14 | 2.0% |
| Elementary School | 266 | 38.0% |
| Middle School | 95 | 13.6% |
| High School | 145 | 20.7% |
| College / Undergraduate | 169 | 24.1% |
| Graduate / Professional | 11 | 1.6% |
| Total | 701 | 100.0% |
School Enrollment by Age by Funding Source in Rusk
Out of a total of 701 students who are enrolled in schools in Rusk, 21 (3.0%) attend a private institution, while the remaining 680 (97.0%) are enrolled in public schools. The age group of 20 to 24 year olds has the highest likelihood of being enrolled in private schools, with 16 (21.0% in the age bracket) enrolled. Conversely, the age group of 3 to 4 year olds has the lowest likelihood of being enrolled in a private school, with 1 (100.0% in the age bracket) attending a public institution.
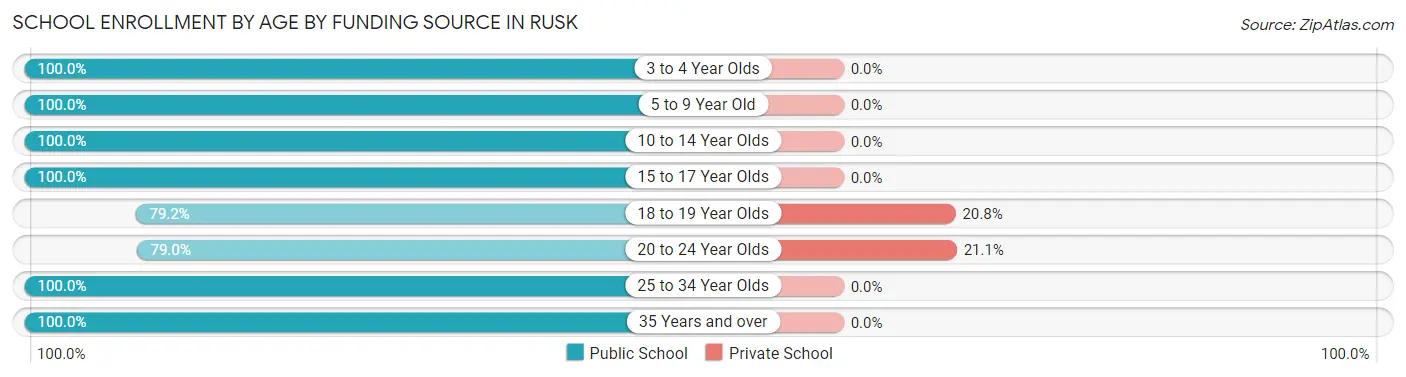
| Age Bracket | Public School | Private School |
| 3 to 4 Year Olds | 1 (100.0%) | 0 (0.0%) |
| 5 to 9 Year Old | 280 (100.0%) | 0 (0.0%) |
| 10 to 14 Year Olds | 123 (100.0%) | 0 (0.0%) |
| 15 to 17 Year Olds | 76 (100.0%) | 0 (0.0%) |
| 18 to 19 Year Olds | 19 (79.2%) | 5 (20.8%) |
| 20 to 24 Year Olds | 60 (78.9%) | 16 (21.0%) |
| 25 to 34 Year Olds | 51 (100.0%) | 0 (0.0%) |
| 35 Years and over | 70 (100.0%) | 0 (0.0%) |
| Total | 680 (97.0%) | 21 (3.0%) |
Educational Attainment by Field of Study in Rusk
Education (86 | 24.2%), engineering (64 | 18.0%), science & technology (33 | 9.3%), bio, nature & agricultural (32 | 9.0%), and arts & humanities (32 | 9.0%) are the most common fields of study among 355 individuals in Rusk who have obtained a bachelor's degree or higher.
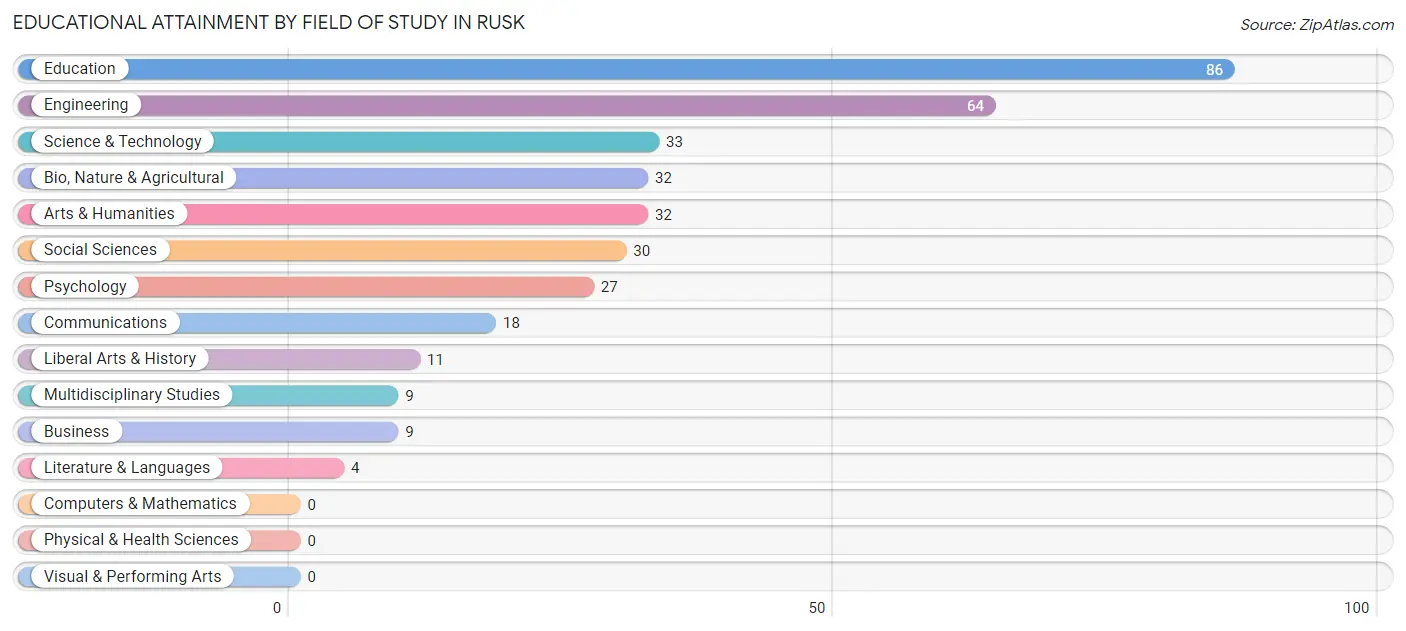
| Field of Study | # Graduates | % Graduates |
| Computers & Mathematics | 0 | 0.0% |
| Bio, Nature & Agricultural | 32 | 9.0% |
| Physical & Health Sciences | 0 | 0.0% |
| Psychology | 27 | 7.6% |
| Social Sciences | 30 | 8.5% |
| Engineering | 64 | 18.0% |
| Multidisciplinary Studies | 9 | 2.5% |
| Science & Technology | 33 | 9.3% |
| Business | 9 | 2.5% |
| Education | 86 | 24.2% |
| Literature & Languages | 4 | 1.1% |
| Liberal Arts & History | 11 | 3.1% |
| Visual & Performing Arts | 0 | 0.0% |
| Communications | 18 | 5.1% |
| Arts & Humanities | 32 | 9.0% |
| Total | 355 | 100.0% |
Transportation & Commute in Rusk
Vehicle Availability by Sex in Rusk
The most prevalent vehicle ownership categories in Rusk are males with 2 vehicles (299, accounting for 46.0%) and females with 2 vehicles (253, making up 64.0%).
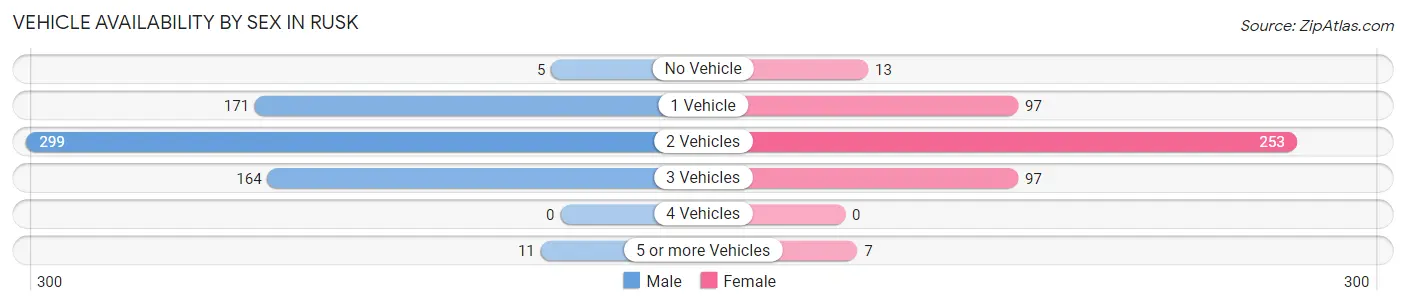
| Vehicles Available | Male | Female |
| No Vehicle | 5 (0.8%) | 13 (2.8%) |
| 1 Vehicle | 171 (26.3%) | 97 (20.8%) |
| 2 Vehicles | 299 (46.0%) | 253 (54.2%) |
| 3 Vehicles | 164 (25.2%) | 97 (20.8%) |
| 4 Vehicles | 0 (0.0%) | 0 (0.0%) |
| 5 or more Vehicles | 11 (1.7%) | 7 (1.5%) |
| Total | 650 (100.0%) | 467 (100.0%) |
Commute Time in Rusk
The most frequently occuring commute durations in Rusk are 5 to 9 minutes (245 commuters, 28.0%), 10 to 14 minutes (175 commuters, 20.0%), and less than 5 minutes (75 commuters, 8.6%).
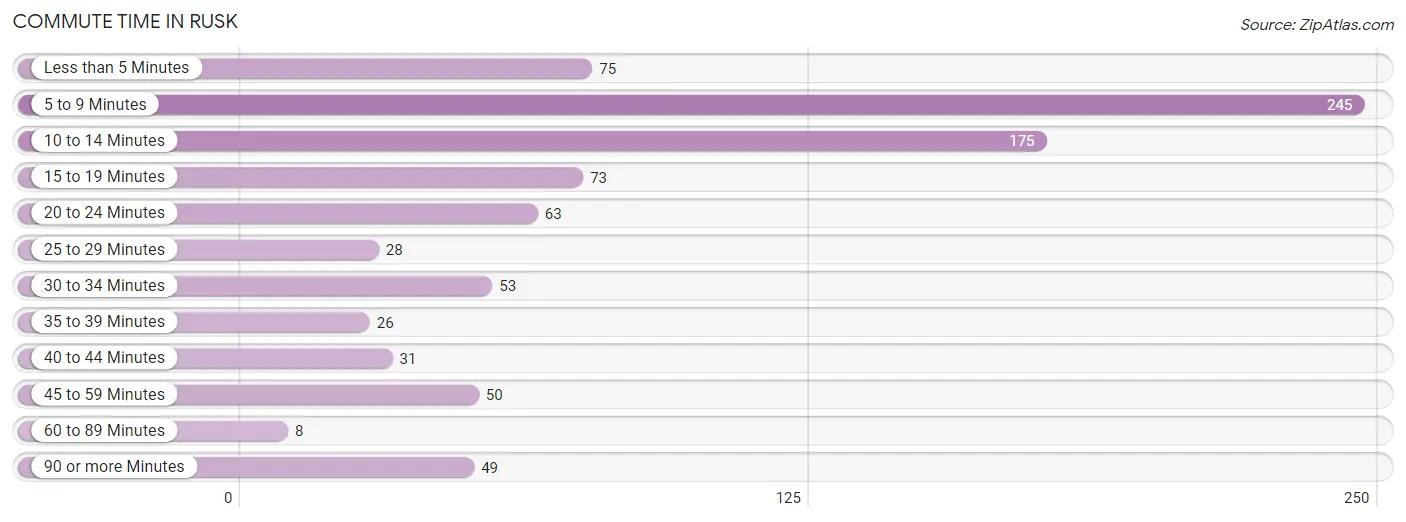
| Commute Time | # Commuters | % Commuters |
| Less than 5 Minutes | 75 | 8.6% |
| 5 to 9 Minutes | 245 | 28.0% |
| 10 to 14 Minutes | 175 | 20.0% |
| 15 to 19 Minutes | 73 | 8.3% |
| 20 to 24 Minutes | 63 | 7.2% |
| 25 to 29 Minutes | 28 | 3.2% |
| 30 to 34 Minutes | 53 | 6.0% |
| 35 to 39 Minutes | 26 | 3.0% |
| 40 to 44 Minutes | 31 | 3.5% |
| 45 to 59 Minutes | 50 | 5.7% |
| 60 to 89 Minutes | 8 | 0.9% |
| 90 or more Minutes | 49 | 5.6% |
Commute Time by Sex in Rusk
The most common commute times in Rusk are 5 to 9 minutes (148 commuters, 29.4%) for males and 5 to 9 minutes (97 commuters, 26.1%) for females.
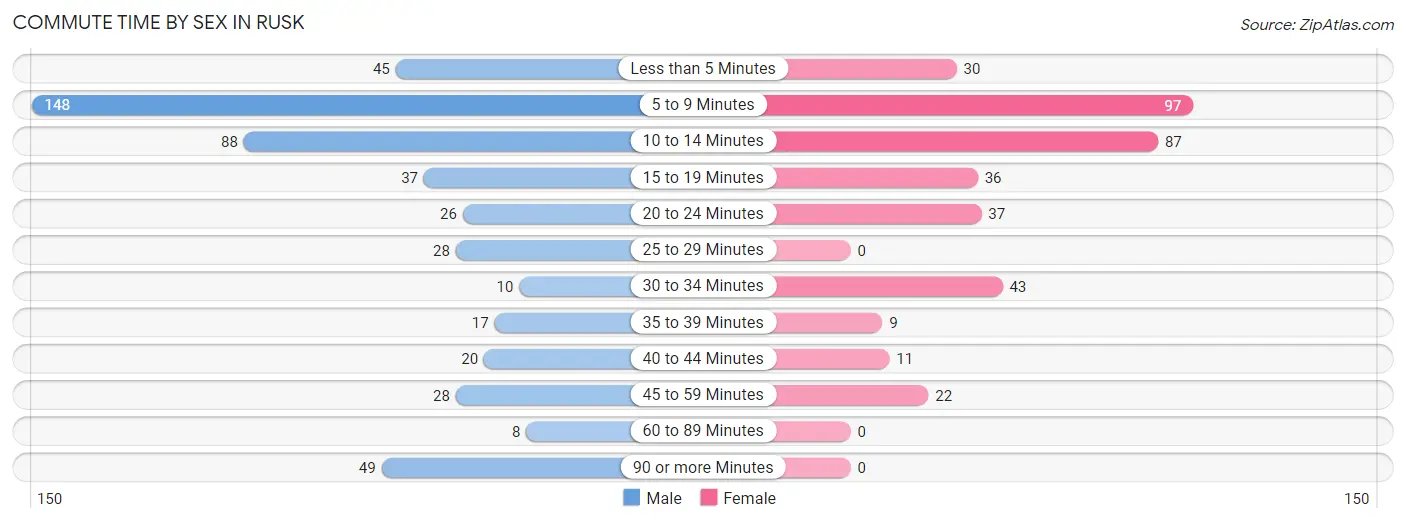
| Commute Time | Male | Female |
| Less than 5 Minutes | 45 (8.9%) | 30 (8.1%) |
| 5 to 9 Minutes | 148 (29.4%) | 97 (26.1%) |
| 10 to 14 Minutes | 88 (17.5%) | 87 (23.4%) |
| 15 to 19 Minutes | 37 (7.3%) | 36 (9.7%) |
| 20 to 24 Minutes | 26 (5.2%) | 37 (10.0%) |
| 25 to 29 Minutes | 28 (5.6%) | 0 (0.0%) |
| 30 to 34 Minutes | 10 (2.0%) | 43 (11.6%) |
| 35 to 39 Minutes | 17 (3.4%) | 9 (2.4%) |
| 40 to 44 Minutes | 20 (4.0%) | 11 (3.0%) |
| 45 to 59 Minutes | 28 (5.6%) | 22 (5.9%) |
| 60 to 89 Minutes | 8 (1.6%) | 0 (0.0%) |
| 90 or more Minutes | 49 (9.7%) | 0 (0.0%) |
Time of Departure to Work by Sex in Rusk
The most frequent times of departure to work in Rusk are 5:00 AM to 5:29 AM (98, 19.4%) for males and 7:30 AM to 7:59 AM (116, 31.2%) for females.
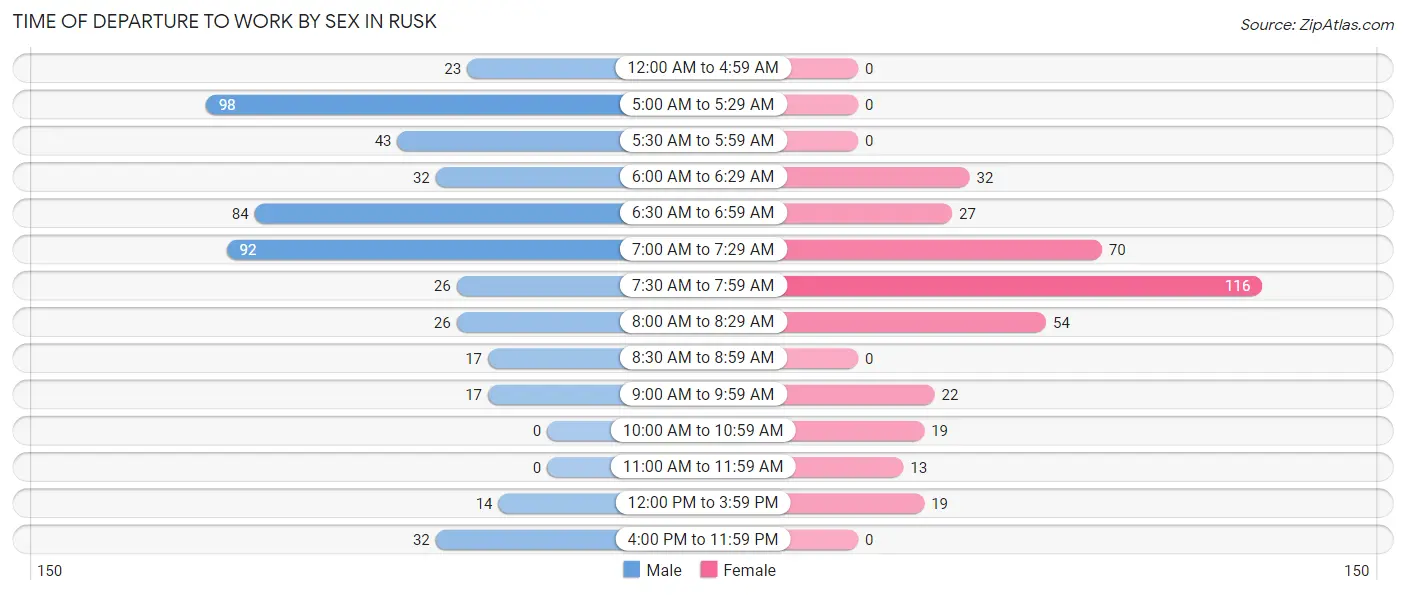
| Time of Departure | Male | Female |
| 12:00 AM to 4:59 AM | 23 (4.6%) | 0 (0.0%) |
| 5:00 AM to 5:29 AM | 98 (19.4%) | 0 (0.0%) |
| 5:30 AM to 5:59 AM | 43 (8.5%) | 0 (0.0%) |
| 6:00 AM to 6:29 AM | 32 (6.4%) | 32 (8.6%) |
| 6:30 AM to 6:59 AM | 84 (16.7%) | 27 (7.3%) |
| 7:00 AM to 7:29 AM | 92 (18.2%) | 70 (18.8%) |
| 7:30 AM to 7:59 AM | 26 (5.2%) | 116 (31.2%) |
| 8:00 AM to 8:29 AM | 26 (5.2%) | 54 (14.5%) |
| 8:30 AM to 8:59 AM | 17 (3.4%) | 0 (0.0%) |
| 9:00 AM to 9:59 AM | 17 (3.4%) | 22 (5.9%) |
| 10:00 AM to 10:59 AM | 0 (0.0%) | 19 (5.1%) |
| 11:00 AM to 11:59 AM | 0 (0.0%) | 13 (3.5%) |
| 12:00 PM to 3:59 PM | 14 (2.8%) | 19 (5.1%) |
| 4:00 PM to 11:59 PM | 32 (6.4%) | 0 (0.0%) |
| Total | 504 (100.0%) | 372 (100.0%) |
Housing Occupancy in Rusk
Occupancy by Ownership in Rusk
Of the total 996 dwellings in Rusk, owner-occupied units account for 664 (66.7%), while renter-occupied units make up 332 (33.3%).
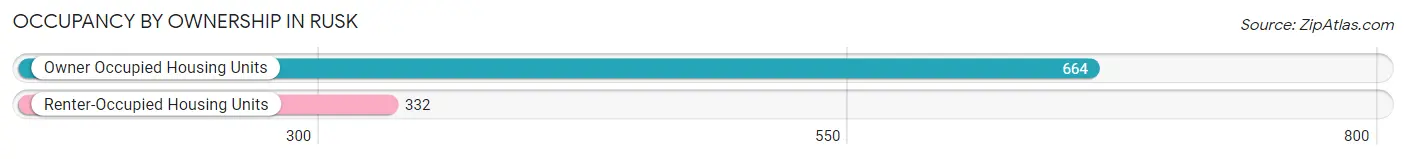
| Occupancy | # Housing Units | % Housing Units |
| Owner Occupied Housing Units | 664 | 66.7% |
| Renter-Occupied Housing Units | 332 | 33.3% |
| Total Occupied Housing Units | 996 | 100.0% |
Occupancy by Household Size in Rusk
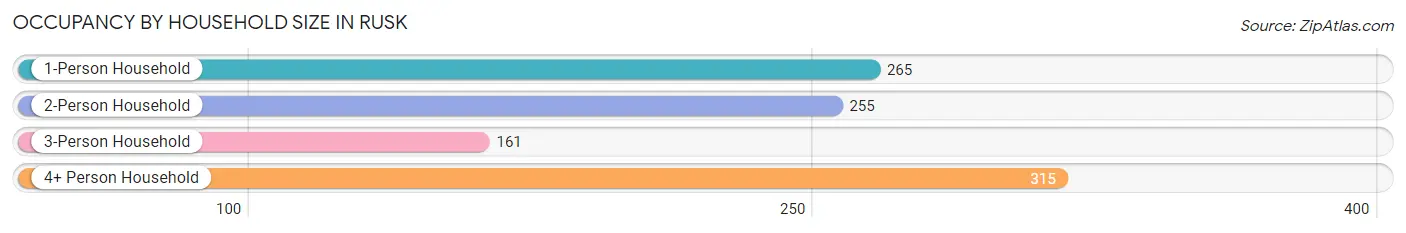
| Household Size | # Housing Units | % Housing Units |
| 1-Person Household | 265 | 26.6% |
| 2-Person Household | 255 | 25.6% |
| 3-Person Household | 161 | 16.2% |
| 4+ Person Household | 315 | 31.6% |
| Total Housing Units | 996 | 100.0% |
Occupancy by Ownership by Household Size in Rusk
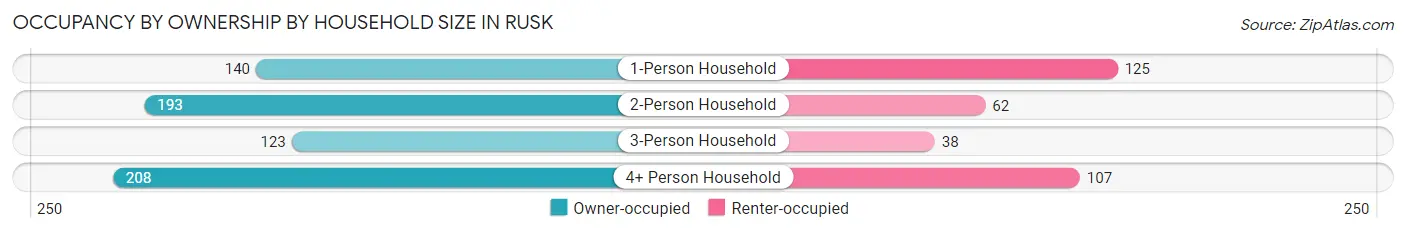
| Household Size | Owner-occupied | Renter-occupied |
| 1-Person Household | 140 (52.8%) | 125 (47.2%) |
| 2-Person Household | 193 (75.7%) | 62 (24.3%) |
| 3-Person Household | 123 (76.4%) | 38 (23.6%) |
| 4+ Person Household | 208 (66.0%) | 107 (34.0%) |
| Total Housing Units | 664 (66.7%) | 332 (33.3%) |
Occupancy by Educational Attainment in Rusk
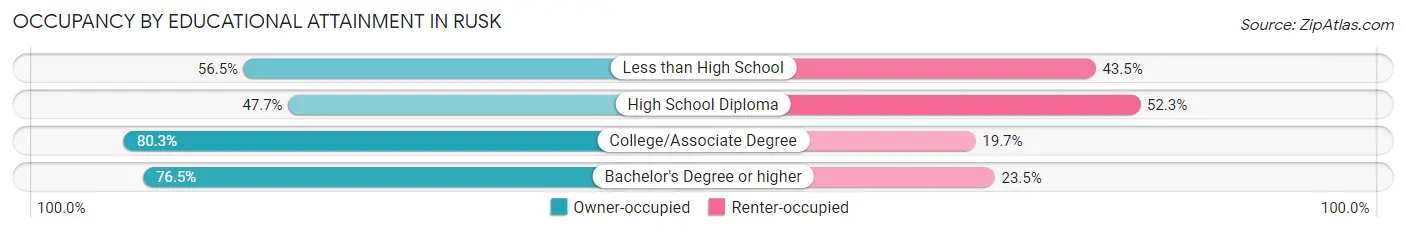
| Household Size | Owner-occupied | Renter-occupied |
| Less than High School | 52 (56.5%) | 40 (43.5%) |
| High School Diploma | 155 (47.7%) | 170 (52.3%) |
| College/Associate Degree | 294 (80.3%) | 72 (19.7%) |
| Bachelor's Degree or higher | 163 (76.5%) | 50 (23.5%) |
Occupancy by Age of Householder in Rusk
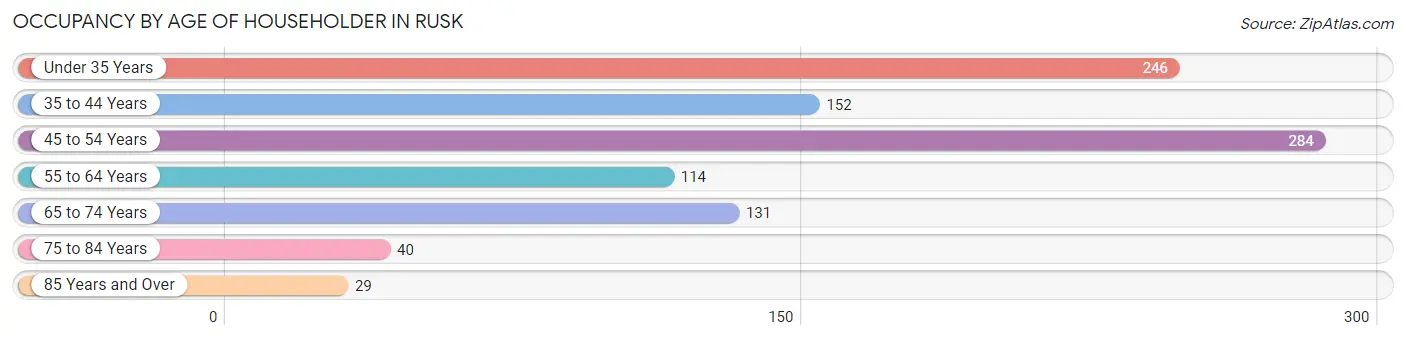
| Age Bracket | # Households | % Households |
| Under 35 Years | 246 | 24.7% |
| 35 to 44 Years | 152 | 15.3% |
| 45 to 54 Years | 284 | 28.5% |
| 55 to 64 Years | 114 | 11.5% |
| 65 to 74 Years | 131 | 13.2% |
| 75 to 84 Years | 40 | 4.0% |
| 85 Years and Over | 29 | 2.9% |
| Total | 996 | 100.0% |
Housing Finances in Rusk
Median Income by Occupancy in Rusk
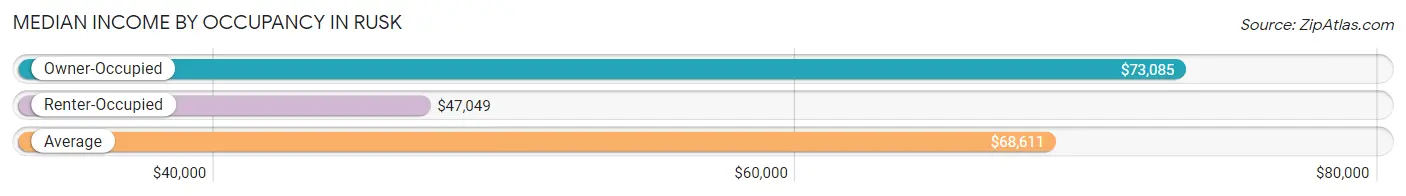
| Occupancy Type | # Households | Median Income |
| Owner-Occupied | 664 (66.7%) | $73,085 |
| Renter-Occupied | 332 (33.3%) | $47,049 |
| Average | 996 (100.0%) | $68,611 |
Occupancy by Householder Income Bracket in Rusk
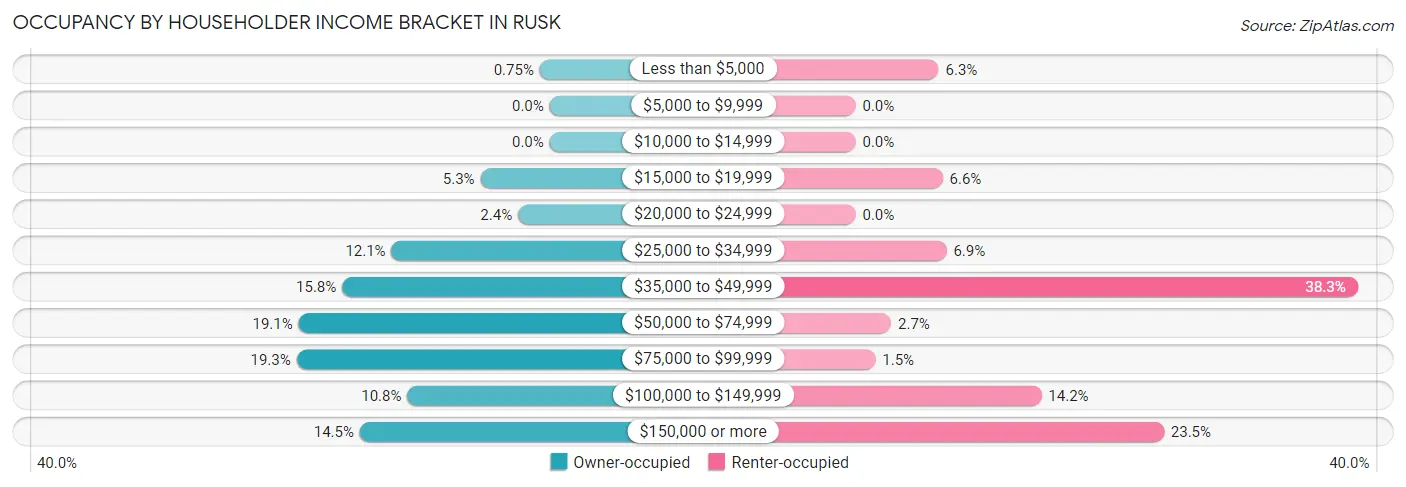
| Income Bracket | Owner-occupied | Renter-occupied |
| Less than $5,000 | 5 (0.7%) | 21 (6.3%) |
| $5,000 to $9,999 | 0 (0.0%) | 0 (0.0%) |
| $10,000 to $14,999 | 0 (0.0%) | 0 (0.0%) |
| $15,000 to $19,999 | 35 (5.3%) | 22 (6.6%) |
| $20,000 to $24,999 | 16 (2.4%) | 0 (0.0%) |
| $25,000 to $34,999 | 80 (12.0%) | 23 (6.9%) |
| $35,000 to $49,999 | 105 (15.8%) | 127 (38.3%) |
| $50,000 to $74,999 | 127 (19.1%) | 9 (2.7%) |
| $75,000 to $99,999 | 128 (19.3%) | 5 (1.5%) |
| $100,000 to $149,999 | 72 (10.8%) | 47 (14.2%) |
| $150,000 or more | 96 (14.5%) | 78 (23.5%) |
| Total | 664 (100.0%) | 332 (100.0%) |
Monthly Housing Cost Tiers in Rusk
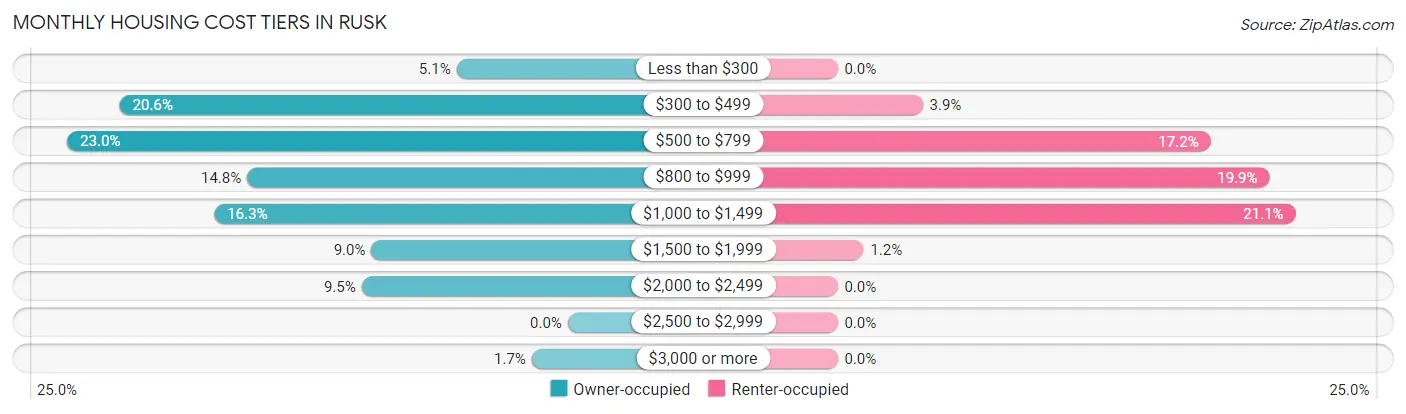
| Monthly Cost | Owner-occupied | Renter-occupied |
| Less than $300 | 34 (5.1%) | 0 (0.0%) |
| $300 to $499 | 137 (20.6%) | 13 (3.9%) |
| $500 to $799 | 153 (23.0%) | 57 (17.2%) |
| $800 to $999 | 98 (14.8%) | 66 (19.9%) |
| $1,000 to $1,499 | 108 (16.3%) | 70 (21.1%) |
| $1,500 to $1,999 | 60 (9.0%) | 4 (1.2%) |
| $2,000 to $2,499 | 63 (9.5%) | 0 (0.0%) |
| $2,500 to $2,999 | 0 (0.0%) | 0 (0.0%) |
| $3,000 or more | 11 (1.7%) | 0 (0.0%) |
| Total | 664 (100.0%) | 332 (100.0%) |
Physical Housing Characteristics in Rusk
Housing Structures in Rusk
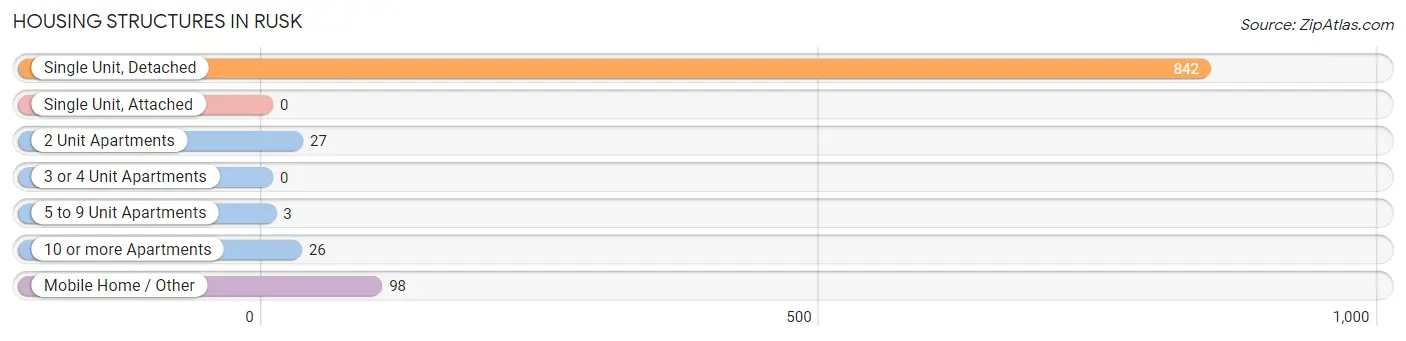
| Structure Type | # Housing Units | % Housing Units |
| Single Unit, Detached | 842 | 84.5% |
| Single Unit, Attached | 0 | 0.0% |
| 2 Unit Apartments | 27 | 2.7% |
| 3 or 4 Unit Apartments | 0 | 0.0% |
| 5 to 9 Unit Apartments | 3 | 0.3% |
| 10 or more Apartments | 26 | 2.6% |
| Mobile Home / Other | 98 | 9.8% |
| Total | 996 | 100.0% |
Housing Structures by Occupancy in Rusk
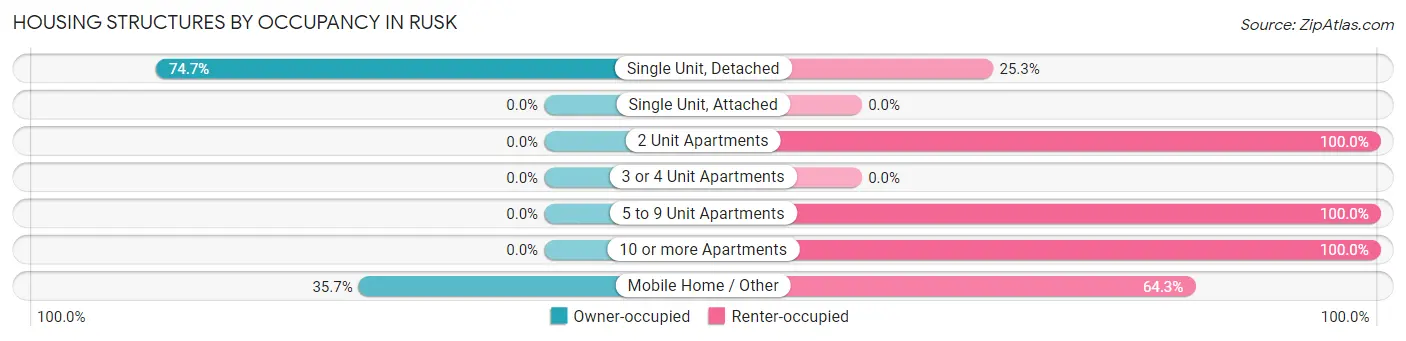
| Structure Type | Owner-occupied | Renter-occupied |
| Single Unit, Detached | 629 (74.7%) | 213 (25.3%) |
| Single Unit, Attached | 0 (0.0%) | 0 (0.0%) |
| 2 Unit Apartments | 0 (0.0%) | 27 (100.0%) |
| 3 or 4 Unit Apartments | 0 (0.0%) | 0 (0.0%) |
| 5 to 9 Unit Apartments | 0 (0.0%) | 3 (100.0%) |
| 10 or more Apartments | 0 (0.0%) | 26 (100.0%) |
| Mobile Home / Other | 35 (35.7%) | 63 (64.3%) |
| Total | 664 (66.7%) | 332 (33.3%) |
Housing Structures by Number of Rooms in Rusk
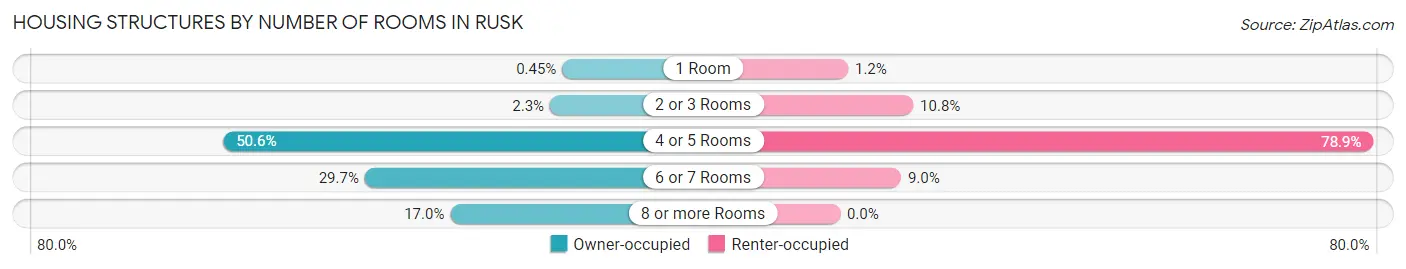
| Number of Rooms | Owner-occupied | Renter-occupied |
| 1 Room | 3 (0.4%) | 4 (1.2%) |
| 2 or 3 Rooms | 15 (2.3%) | 36 (10.8%) |
| 4 or 5 Rooms | 336 (50.6%) | 262 (78.9%) |
| 6 or 7 Rooms | 197 (29.7%) | 30 (9.0%) |
| 8 or more Rooms | 113 (17.0%) | 0 (0.0%) |
| Total | 664 (100.0%) | 332 (100.0%) |
Housing Structure by Heating Type in Rusk

| Heating Type | Owner-occupied | Renter-occupied |
| Utility Gas | 372 (56.0%) | 142 (42.8%) |
| Bottled, Tank, or LP Gas | 33 (5.0%) | 0 (0.0%) |
| Electricity | 255 (38.4%) | 190 (57.2%) |
| Fuel Oil or Kerosene | 0 (0.0%) | 0 (0.0%) |
| Coal or Coke | 0 (0.0%) | 0 (0.0%) |
| All other Fuels | 0 (0.0%) | 0 (0.0%) |
| No Fuel Used | 4 (0.6%) | 0 (0.0%) |
| Total | 664 (100.0%) | 332 (100.0%) |
Household Vehicle Usage in Rusk
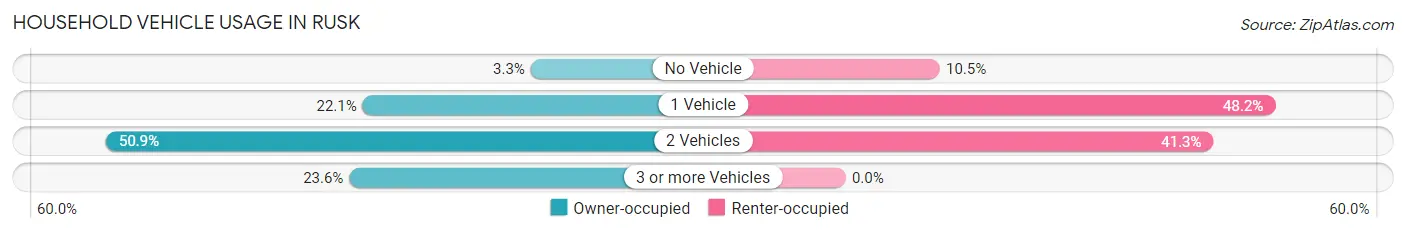
| Vehicles per Household | Owner-occupied | Renter-occupied |
| No Vehicle | 22 (3.3%) | 35 (10.5%) |
| 1 Vehicle | 147 (22.1%) | 160 (48.2%) |
| 2 Vehicles | 338 (50.9%) | 137 (41.3%) |
| 3 or more Vehicles | 157 (23.6%) | 0 (0.0%) |
| Total | 664 (100.0%) | 332 (100.0%) |
Real Estate & Mortgages in Rusk
Real Estate and Mortgage Overview in Rusk
| Characteristic | Without Mortgage | With Mortgage |
| Housing Units | 328 | 336 |
| Median Property Value | $78,700 | $150,000 |
| Median Household Income | $56,204 | $76 |
| Monthly Housing Costs | $493 | $11 |
| Real Estate Taxes | $1,230 | $16 |
Property Value by Mortgage Status in Rusk
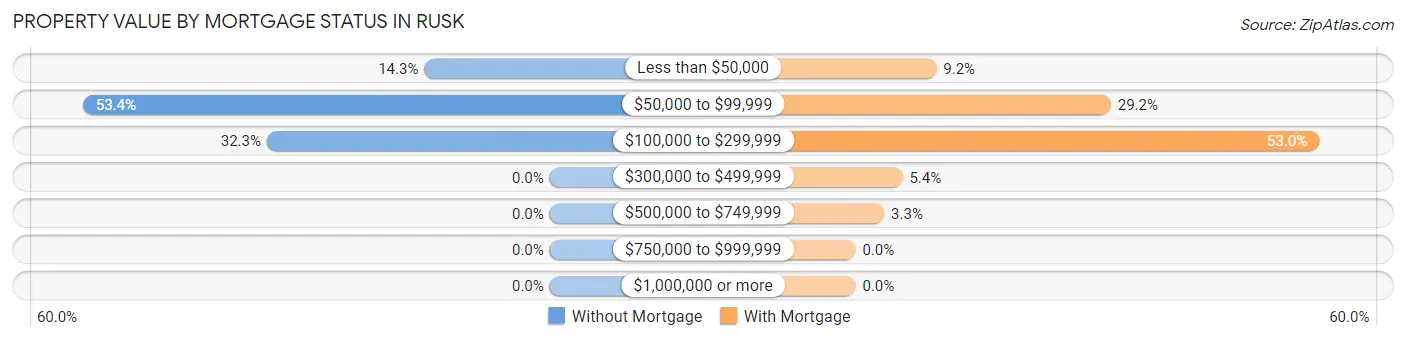
| Property Value | Without Mortgage | With Mortgage |
| Less than $50,000 | 47 (14.3%) | 31 (9.2%) |
| $50,000 to $99,999 | 175 (53.3%) | 98 (29.2%) |
| $100,000 to $299,999 | 106 (32.3%) | 178 (53.0%) |
| $300,000 to $499,999 | 0 (0.0%) | 18 (5.4%) |
| $500,000 to $749,999 | 0 (0.0%) | 11 (3.3%) |
| $750,000 to $999,999 | 0 (0.0%) | 0 (0.0%) |
| $1,000,000 or more | 0 (0.0%) | 0 (0.0%) |
| Total | 328 (100.0%) | 336 (100.0%) |
Household Income by Mortgage Status in Rusk
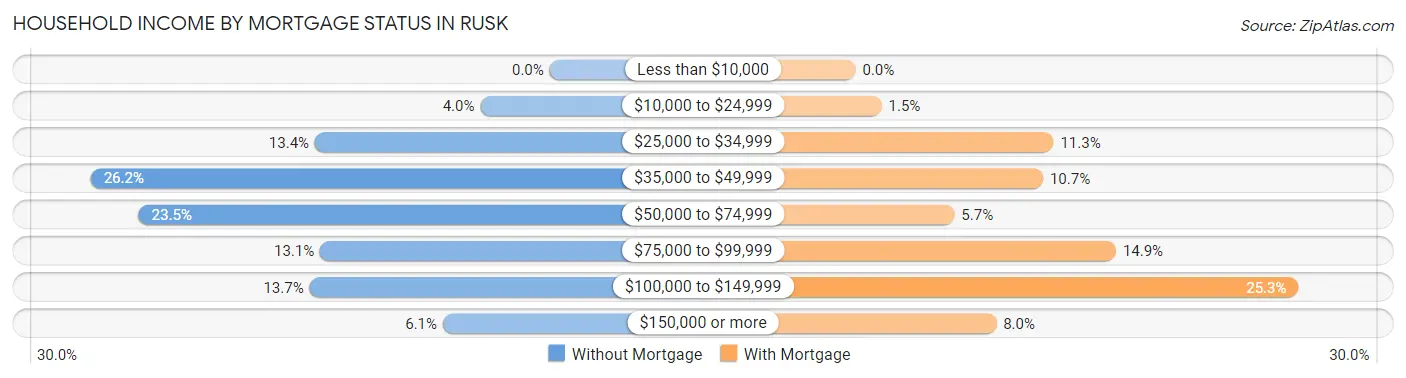
| Household Income | Without Mortgage | With Mortgage |
| Less than $10,000 | 0 (0.0%) | 0 (0.0%) |
| $10,000 to $24,999 | 13 (4.0%) | 5 (1.5%) |
| $25,000 to $34,999 | 44 (13.4%) | 38 (11.3%) |
| $35,000 to $49,999 | 86 (26.2%) | 36 (10.7%) |
| $50,000 to $74,999 | 77 (23.5%) | 19 (5.7%) |
| $75,000 to $99,999 | 43 (13.1%) | 50 (14.9%) |
| $100,000 to $149,999 | 45 (13.7%) | 85 (25.3%) |
| $150,000 or more | 20 (6.1%) | 27 (8.0%) |
| Total | 328 (100.0%) | 336 (100.0%) |
Property Value to Household Income Ratio in Rusk
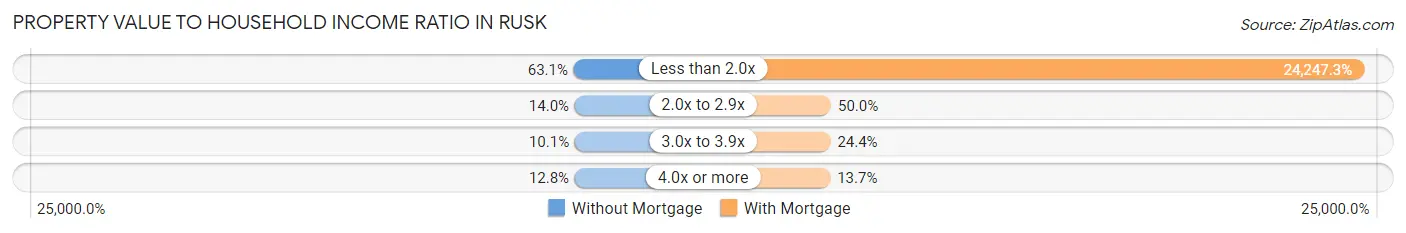
| Value-to-Income Ratio | Without Mortgage | With Mortgage |
| Less than 2.0x | 207 (63.1%) | 81,471 (24,247.3%) |
| 2.0x to 2.9x | 46 (14.0%) | 168 (50.0%) |
| 3.0x to 3.9x | 33 (10.1%) | 82 (24.4%) |
| 4.0x or more | 42 (12.8%) | 46 (13.7%) |
| Total | 328 (100.0%) | 336 (100.0%) |
Real Estate Taxes by Mortgage Status in Rusk
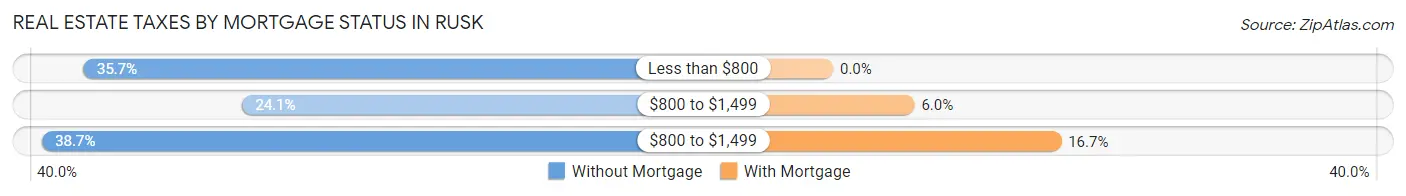
| Property Taxes | Without Mortgage | With Mortgage |
| Less than $800 | 117 (35.7%) | 0 (0.0%) |
| $800 to $1,499 | 79 (24.1%) | 20 (5.9%) |
| $800 to $1,499 | 127 (38.7%) | 56 (16.7%) |
| Total | 328 (100.0%) | 336 (100.0%) |
Health & Disability in Rusk
Health Insurance Coverage by Age in Rusk
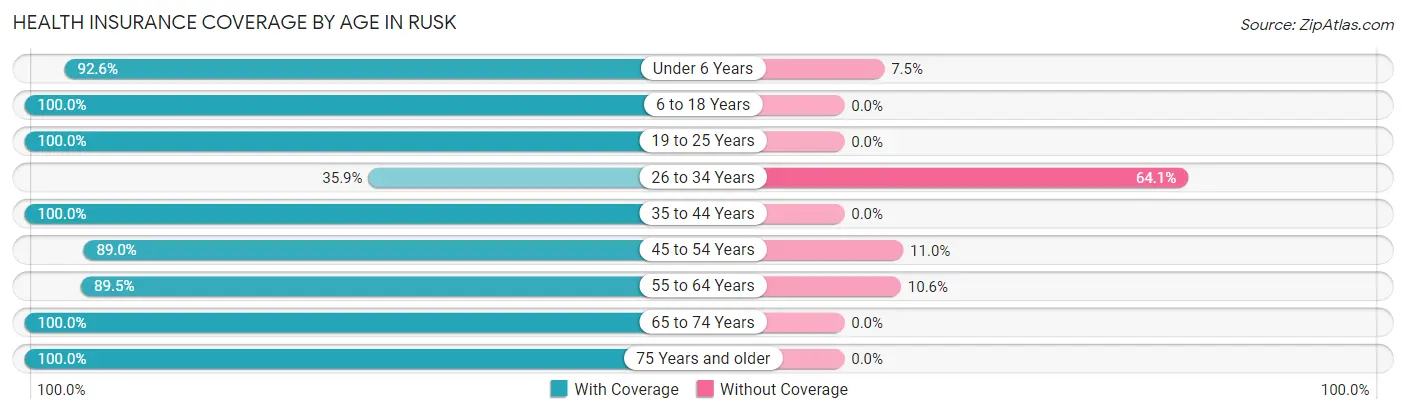
| Age Bracket | With Coverage | Without Coverage |
| Under 6 Years | 261 (92.5%) | 21 (7.4%) |
| 6 to 18 Years | 500 (100.0%) | 0 (0.0%) |
| 19 to 25 Years | 171 (100.0%) | 0 (0.0%) |
| 26 to 34 Years | 149 (35.9%) | 266 (64.1%) |
| 35 to 44 Years | 299 (100.0%) | 0 (0.0%) |
| 45 to 54 Years | 373 (89.0%) | 46 (11.0%) |
| 55 to 64 Years | 195 (89.4%) | 23 (10.5%) |
| 65 to 74 Years | 198 (100.0%) | 0 (0.0%) |
| 75 Years and older | 108 (100.0%) | 0 (0.0%) |
| Total | 2,254 (86.4%) | 356 (13.6%) |
Health Insurance Coverage by Citizenship Status in Rusk
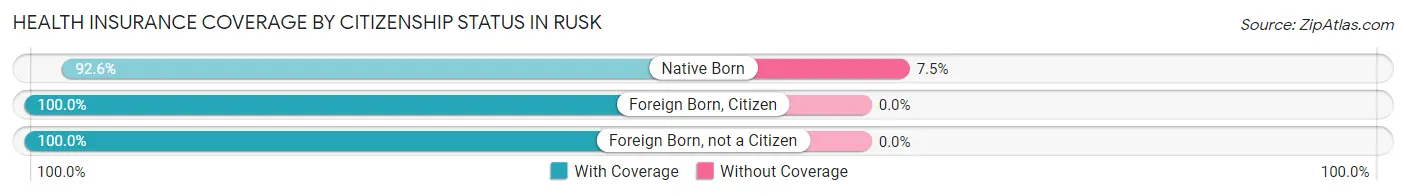
| Citizenship Status | With Coverage | Without Coverage |
| Native Born | 261 (92.5%) | 21 (7.4%) |
| Foreign Born, Citizen | 500 (100.0%) | 0 (0.0%) |
| Foreign Born, not a Citizen | 171 (100.0%) | 0 (0.0%) |
Health Insurance Coverage by Household Income in Rusk
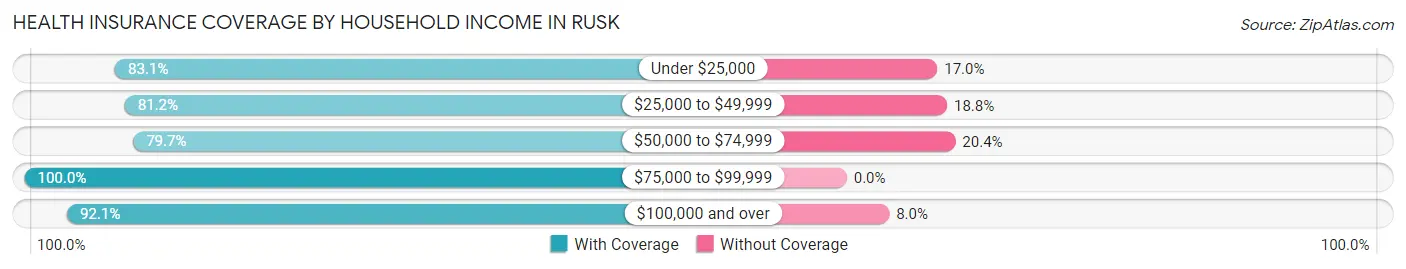
| Household Income | With Coverage | Without Coverage |
| Under $25,000 | 147 (83.1%) | 30 (17.0%) |
| $25,000 to $49,999 | 731 (81.2%) | 169 (18.8%) |
| $50,000 to $74,999 | 317 (79.6%) | 81 (20.3%) |
| $75,000 to $99,999 | 289 (100.0%) | 0 (0.0%) |
| $100,000 and over | 764 (92.0%) | 66 (8.0%) |
Public vs Private Health Insurance Coverage by Age in Rusk
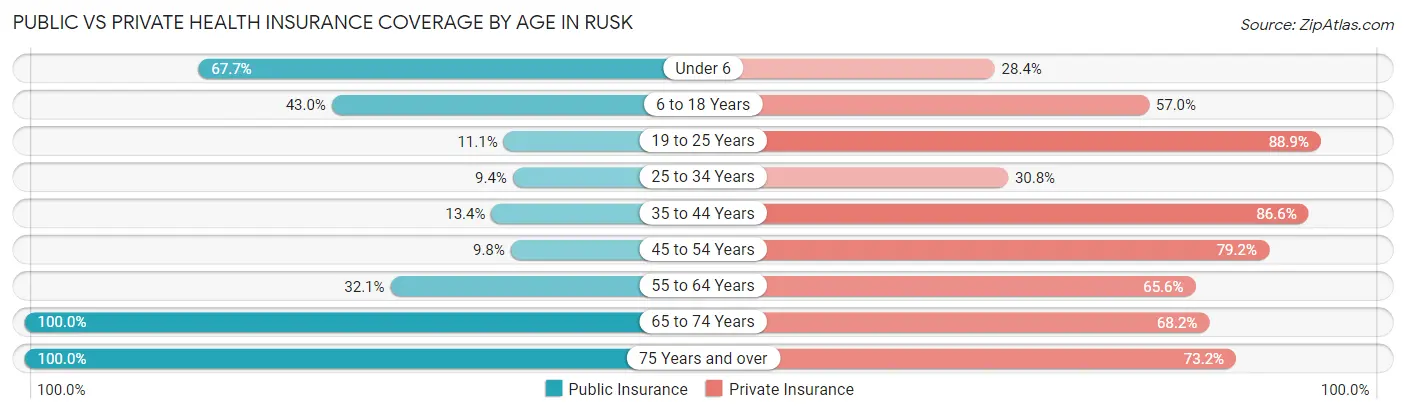
| Age Bracket | Public Insurance | Private Insurance |
| Under 6 | 191 (67.7%) | 80 (28.4%) |
| 6 to 18 Years | 215 (43.0%) | 285 (57.0%) |
| 19 to 25 Years | 19 (11.1%) | 152 (88.9%) |
| 25 to 34 Years | 39 (9.4%) | 128 (30.8%) |
| 35 to 44 Years | 40 (13.4%) | 259 (86.6%) |
| 45 to 54 Years | 41 (9.8%) | 332 (79.2%) |
| 55 to 64 Years | 70 (32.1%) | 143 (65.6%) |
| 65 to 74 Years | 198 (100.0%) | 135 (68.2%) |
| 75 Years and over | 108 (100.0%) | 79 (73.2%) |
| Total | 921 (35.3%) | 1,593 (61.0%) |
Disability Status by Sex by Age in Rusk
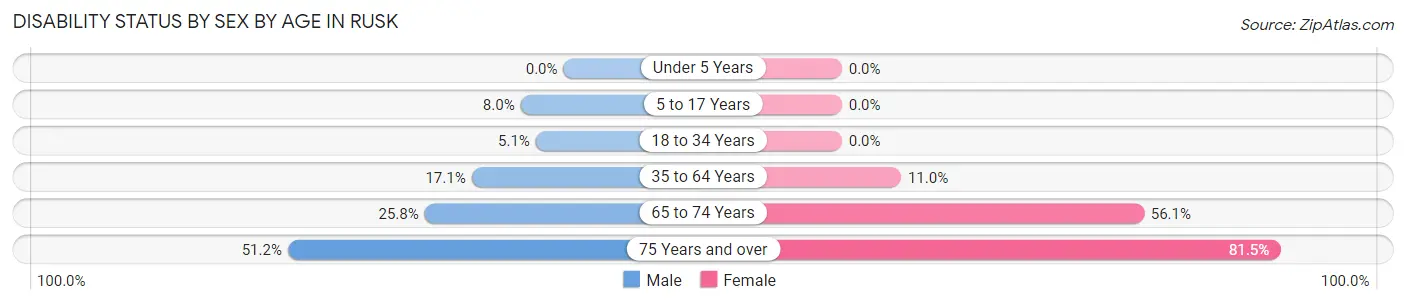
| Age Bracket | Male | Female |
| Under 5 Years | 0 (0.0%) | 0 (0.0%) |
| 5 to 17 Years | 16 (8.0%) | 0 (0.0%) |
| 18 to 34 Years | 16 (5.1%) | 0 (0.0%) |
| 35 to 64 Years | 82 (17.1%) | 50 (11.0%) |
| 65 to 74 Years | 17 (25.8%) | 74 (56.1%) |
| 75 Years and over | 22 (51.2%) | 53 (81.5%) |
Disability Class by Sex by Age in Rusk
Disability Class: Hearing Difficulty
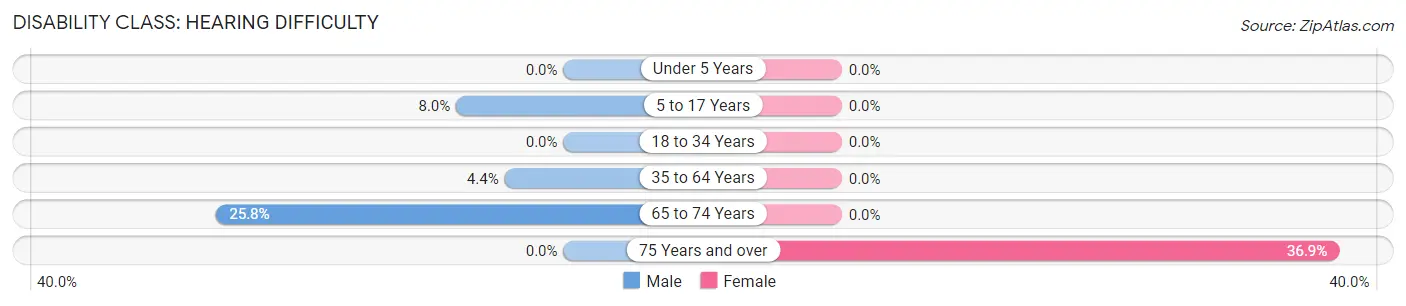
| Age Bracket | Male | Female |
| Under 5 Years | 0 (0.0%) | 0 (0.0%) |
| 5 to 17 Years | 16 (8.0%) | 0 (0.0%) |
| 18 to 34 Years | 0 (0.0%) | 0 (0.0%) |
| 35 to 64 Years | 21 (4.4%) | 0 (0.0%) |
| 65 to 74 Years | 17 (25.8%) | 0 (0.0%) |
| 75 Years and over | 0 (0.0%) | 24 (36.9%) |
Disability Class: Vision Difficulty
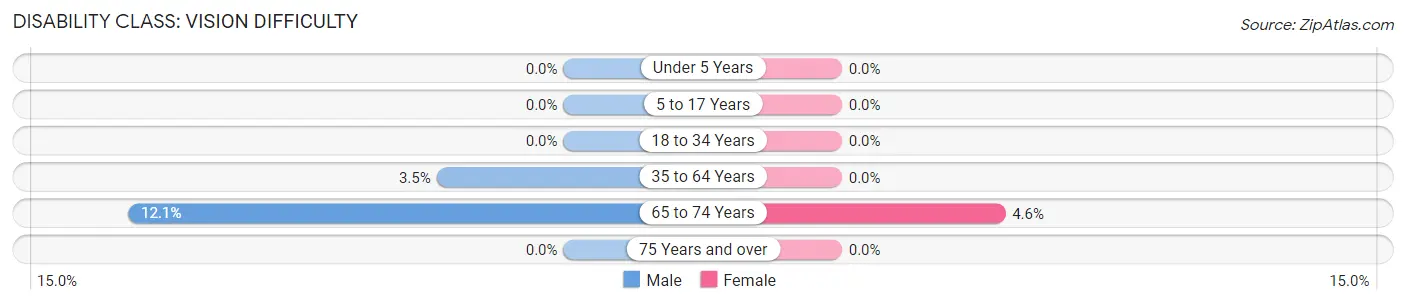
| Age Bracket | Male | Female |
| Under 5 Years | 0 (0.0%) | 0 (0.0%) |
| 5 to 17 Years | 0 (0.0%) | 0 (0.0%) |
| 18 to 34 Years | 0 (0.0%) | 0 (0.0%) |
| 35 to 64 Years | 17 (3.5%) | 0 (0.0%) |
| 65 to 74 Years | 8 (12.1%) | 6 (4.5%) |
| 75 Years and over | 0 (0.0%) | 0 (0.0%) |
Disability Class: Cognitive Difficulty
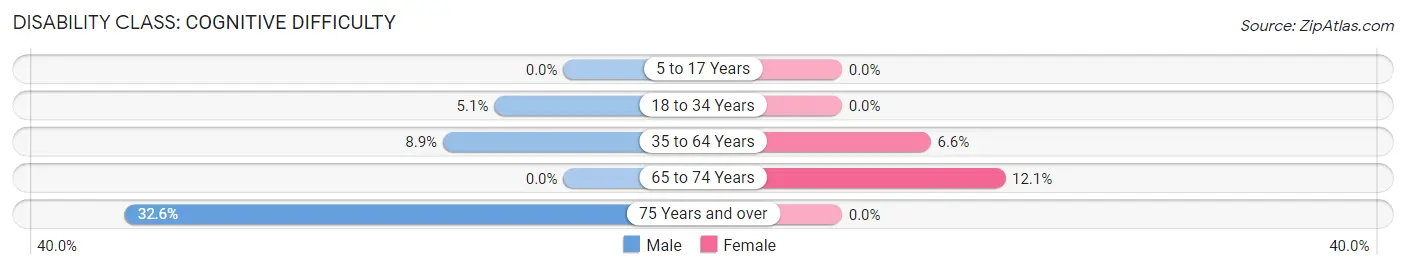
| Age Bracket | Male | Female |
| 5 to 17 Years | 0 (0.0%) | 0 (0.0%) |
| 18 to 34 Years | 16 (5.1%) | 0 (0.0%) |
| 35 to 64 Years | 43 (8.9%) | 30 (6.6%) |
| 65 to 74 Years | 0 (0.0%) | 16 (12.1%) |
| 75 Years and over | 14 (32.6%) | 0 (0.0%) |
Disability Class: Ambulatory Difficulty
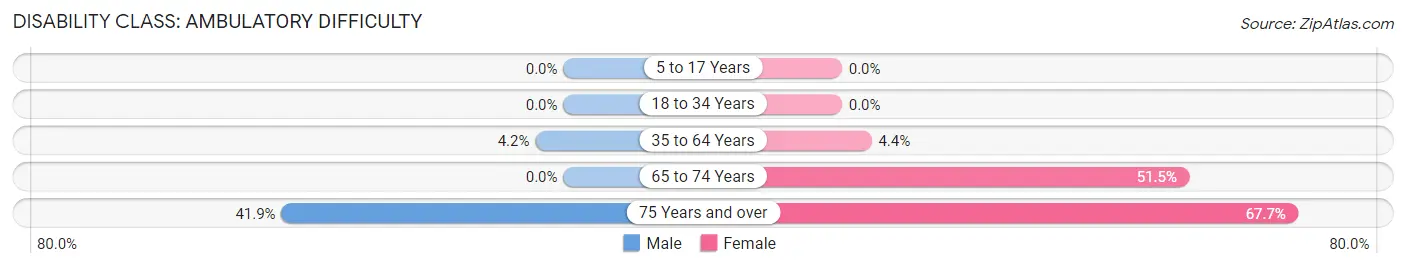
| Age Bracket | Male | Female |
| 5 to 17 Years | 0 (0.0%) | 0 (0.0%) |
| 18 to 34 Years | 0 (0.0%) | 0 (0.0%) |
| 35 to 64 Years | 20 (4.2%) | 20 (4.4%) |
| 65 to 74 Years | 0 (0.0%) | 68 (51.5%) |
| 75 Years and over | 18 (41.9%) | 44 (67.7%) |
Disability Class: Self-Care Difficulty
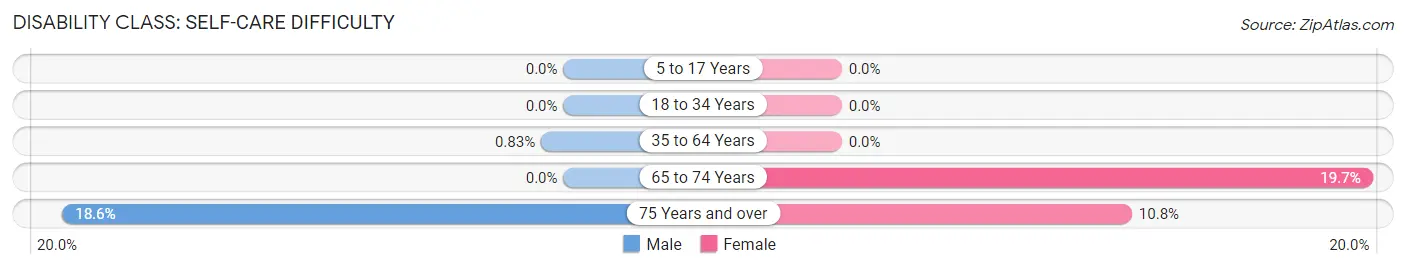
| Age Bracket | Male | Female |
| 5 to 17 Years | 0 (0.0%) | 0 (0.0%) |
| 18 to 34 Years | 0 (0.0%) | 0 (0.0%) |
| 35 to 64 Years | 4 (0.8%) | 0 (0.0%) |
| 65 to 74 Years | 0 (0.0%) | 26 (19.7%) |
| 75 Years and over | 8 (18.6%) | 7 (10.8%) |
Technology Access in Rusk
Computing Device Access in Rusk
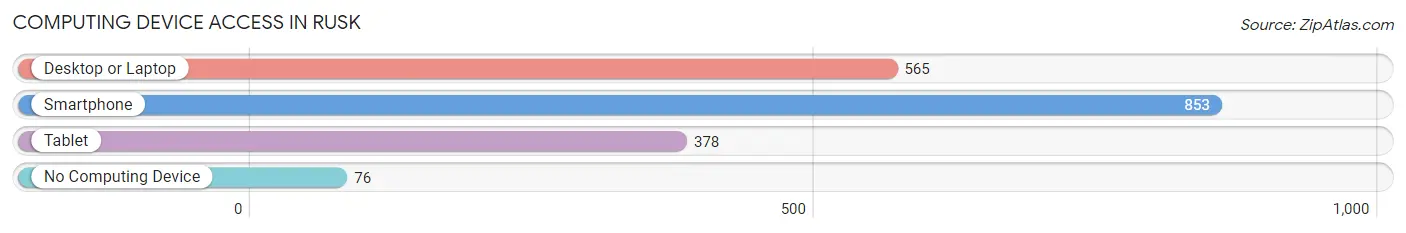
| Device Type | # Households | % Households |
| Desktop or Laptop | 565 | 56.7% |
| Smartphone | 853 | 85.6% |
| Tablet | 378 | 38.0% |
| No Computing Device | 76 | 7.6% |
| Total | 996 | 100.0% |
Internet Access in Rusk
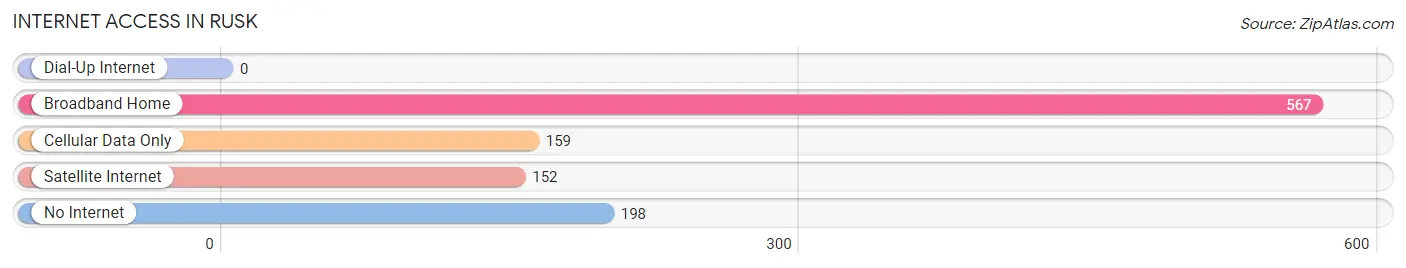
| Internet Type | # Households | % Households |
| Dial-Up Internet | 0 | 0.0% |
| Broadband Home | 567 | 56.9% |
| Cellular Data Only | 159 | 16.0% |
| Satellite Internet | 152 | 15.3% |
| No Internet | 198 | 19.9% |
| Total | 996 | 100.0% |
Rusk Summary
Rusk, Texas is a small city located in the eastern part of the state, in Cherokee County. It is situated about halfway between Dallas and Shreveport, Louisiana, and is the county seat of Cherokee County. The city was named after Thomas Jefferson Rusk, a signer of the Texas Declaration of Independence. The population of Rusk was estimated to be 3,719 in 2019.
History
Rusk was founded in 1846 by a group of settlers from Nacogdoches. The town was named after Thomas Jefferson Rusk, a signer of the Texas Declaration of Independence. The town was incorporated in 1887 and was the county seat of Cherokee County.
In the late 19th century, Rusk was a major center for the timber industry. The town was home to several sawmills and lumber companies, and the timber industry was the main source of employment for the town's residents.
In the early 20th century, Rusk was a major center for the oil industry. The town was home to several oil refineries and oil-related businesses, and the oil industry was the main source of employment for the town's residents.
Geography
Rusk is located in the eastern part of Texas, in Cherokee County. The city is situated about halfway between Dallas and Shreveport, Louisiana. The city is located at the intersection of U.S. Highway 69 and State Highway 204.
The city is situated on the banks of the Neches River, and is surrounded by rolling hills and pine forests. The climate in Rusk is humid subtropical, with hot summers and mild winters.
Economy
The economy of Rusk is largely based on the timber and oil industries. The timber industry is still a major employer in the city, and the oil industry is still a major source of employment.
In addition to the timber and oil industries, Rusk is also home to several manufacturing companies, including a paper mill, a furniture factory, and a plastics factory. The city is also home to several retail stores, restaurants, and other businesses.
Demographics
As of the 2019 census, the population of Rusk was estimated to be 3,719. The racial makeup of the city was 79.3% White, 16.2% African American, 0.7% Native American, 0.3% Asian, 0.1% Pacific Islander, and 3.4% from other races. The median household income in Rusk was $37,945, and the median family income was $45,945.
The city is served by the Rusk Independent School District, which includes two elementary schools, one middle school, and one high school. The city is also home to several churches, including Baptist, Methodist, and Catholic churches.
Common Questions
What is Per Capita Income in Rusk?
Per Capita income in Rusk is $16,713.
What is the Median Family Income in Rusk?
Median Family Income in Rusk is $73,821.
What is the Median Household income in Rusk?
Median Household Income in Rusk is $68,611.
What is Income or Wage Gap in Rusk?
Income or Wage Gap in Rusk is 36.6%.
Women in Rusk earn 63.4 cents for every dollar earned by a man.
What is Inequality or Gini Index in Rusk?
Inequality or Gini Index in Rusk is 0.38.
What is the Total Population of Rusk?
Total Population of Rusk is 5,344.
What is the Total Male Population of Rusk?
Total Male Population of Rusk is 3,734.
What is the Total Female Population of Rusk?
Total Female Population of Rusk is 1,610.
What is the Ratio of Males per 100 Females in Rusk?
There are 231.93 Males per 100 Females in Rusk.
What is the Ratio of Females per 100 Males in Rusk?
There are 43.12 Females per 100 Males in Rusk.
What is the Median Population Age in Rusk?
Median Population Age in Rusk is 39.7 Years.
What is the Average Family Size in Rusk
Average Family Size in Rusk is 3.1 People.
What is the Average Household Size in Rusk
Average Household Size in Rusk is 2.6 People.
How Large is the Labor Force in Rusk?
There are 1,238 People in the Labor Forcein in Rusk.
What is the Percentage of People in the Labor Force in Rusk?
26.7% of People are in the Labor Force in Rusk.
What is the Unemployment Rate in Rusk?
Unemployment Rate in Rusk is 9.6%.