Jacinto City, TX Map & Demographics
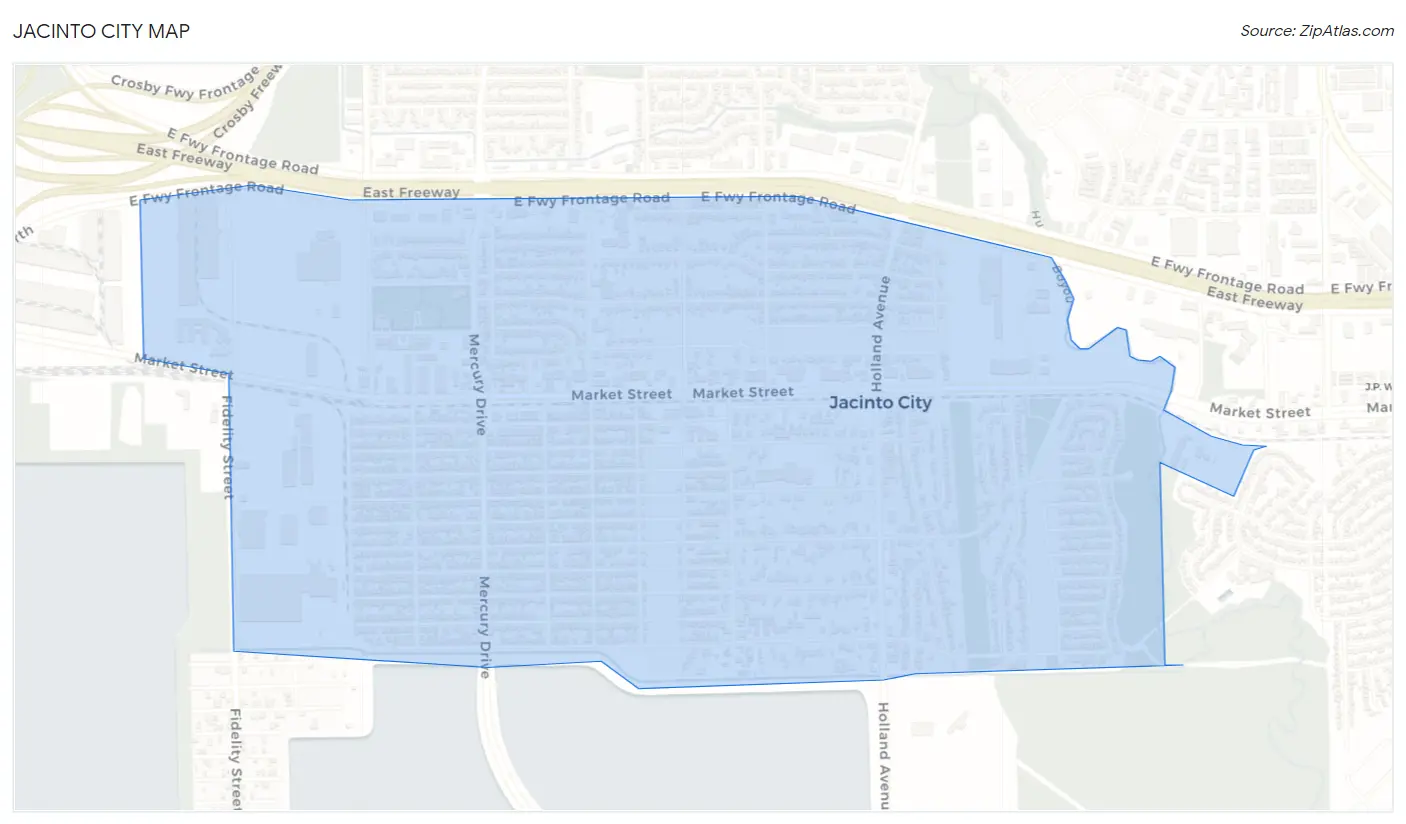
Jacinto City Map
Jacinto City Overview
$21,521
PER CAPITA INCOME
$68,029
AVG FAMILY INCOME
$58,333
AVG HOUSEHOLD INCOME
29.7%
WAGE / INCOME GAP [ % ]
70.3¢/ $1
WAGE / INCOME GAP [ $ ]
$12,729
FAMILY INCOME DEFICIT
0.37
INEQUALITY / GINI INDEX
9,589
TOTAL POPULATION
5,042
MALE POPULATION
4,547
FEMALE POPULATION
110.89
MALES / 100 FEMALES
90.18
FEMALES / 100 MALES
38.9
MEDIAN AGE
3.7
AVG FAMILY SIZE
3.1
AVG HOUSEHOLD SIZE
4,627
LABOR FORCE [ PEOPLE ]
61.7%
PERCENT IN LABOR FORCE
5.6%
UNEMPLOYMENT RATE
Jacinto City Area Codes
Income in Jacinto City
Income Overview in Jacinto City
Per Capita Income in Jacinto City is $21,521, while median incomes of families and households are $68,029 and $58,333 respectively.
| Characteristic | Number | Measure |
| Per Capita Income | 9,589 | $21,521 |
| Median Family Income | 2,256 | $68,029 |
| Mean Family Income | 2,256 | $72,649 |
| Median Household Income | 3,084 | $58,333 |
| Mean Household Income | 3,084 | $64,720 |
| Income Deficit | 2,256 | $12,729 |
| Wage / Income Gap (%) | 9,589 | 29.74% |
| Wage / Income Gap ($) | 9,589 | 70.26¢ per $1 |
| Gini / Inequality Index | 9,589 | 0.37 |
Earnings by Sex in Jacinto City
Average Earnings in Jacinto City are $32,877, $35,607 for men and $25,017 for women, a difference of 29.7%.
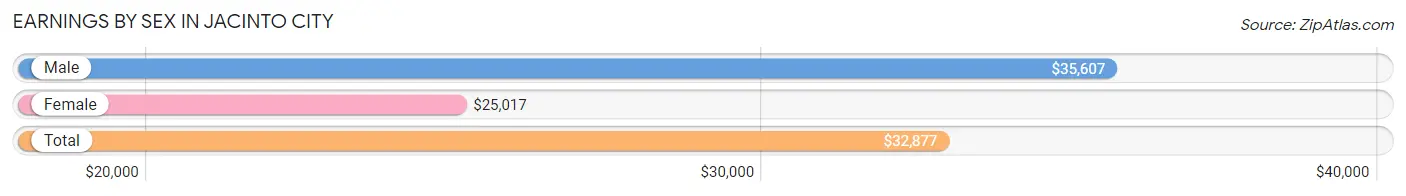
| Sex | Number | Average Earnings |
| Male | 2,834 (60.5%) | $35,607 |
| Female | 1,847 (39.5%) | $25,017 |
| Total | 4,681 (100.0%) | $32,877 |
Earnings by Sex by Income Bracket in Jacinto City
The most common earnings brackets in Jacinto City are $30,000 to $34,999 for men (416 | 14.7%) and $10,000 to $12,499 for women (200 | 10.8%).
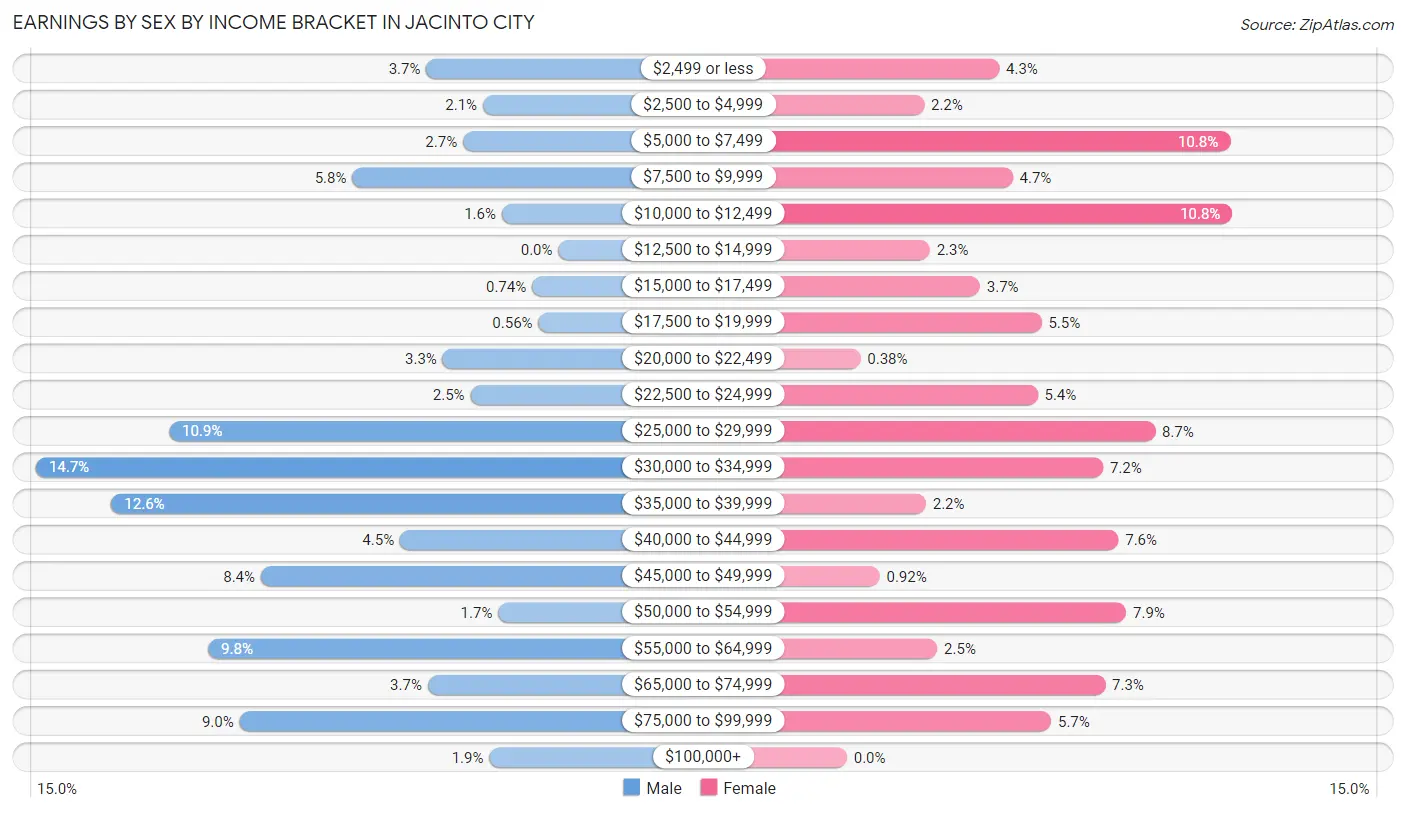
| Income | Male | Female |
| $2,499 or less | 105 (3.7%) | 79 (4.3%) |
| $2,500 to $4,999 | 60 (2.1%) | 40 (2.2%) |
| $5,000 to $7,499 | 76 (2.7%) | 199 (10.8%) |
| $7,500 to $9,999 | 164 (5.8%) | 86 (4.7%) |
| $10,000 to $12,499 | 45 (1.6%) | 200 (10.8%) |
| $12,500 to $14,999 | 0 (0.0%) | 43 (2.3%) |
| $15,000 to $17,499 | 21 (0.7%) | 69 (3.7%) |
| $17,500 to $19,999 | 16 (0.6%) | 101 (5.5%) |
| $20,000 to $22,499 | 92 (3.3%) | 7 (0.4%) |
| $22,500 to $24,999 | 70 (2.5%) | 99 (5.4%) |
| $25,000 to $29,999 | 310 (10.9%) | 160 (8.7%) |
| $30,000 to $34,999 | 416 (14.7%) | 133 (7.2%) |
| $35,000 to $39,999 | 356 (12.6%) | 41 (2.2%) |
| $40,000 to $44,999 | 126 (4.4%) | 141 (7.6%) |
| $45,000 to $49,999 | 237 (8.4%) | 17 (0.9%) |
| $50,000 to $54,999 | 48 (1.7%) | 145 (7.9%) |
| $55,000 to $64,999 | 279 (9.8%) | 47 (2.5%) |
| $65,000 to $74,999 | 104 (3.7%) | 134 (7.3%) |
| $75,000 to $99,999 | 254 (9.0%) | 106 (5.7%) |
| $100,000+ | 55 (1.9%) | 0 (0.0%) |
| Total | 2,834 (100.0%) | 1,847 (100.0%) |
Earnings by Sex by Educational Attainment in Jacinto City
Average earnings in Jacinto City are $37,629 for men and $28,065 for women, a difference of 25.4%. Men with an educational attainment of college or associate's degree enjoy the highest average annual earnings of $56,250, while those with less than high school education earn the least with $36,192. Women with an educational attainment of bachelor's degree earn the most with the average annual earnings of $68,906, while those with less than high school education have the smallest earnings of $10,000.
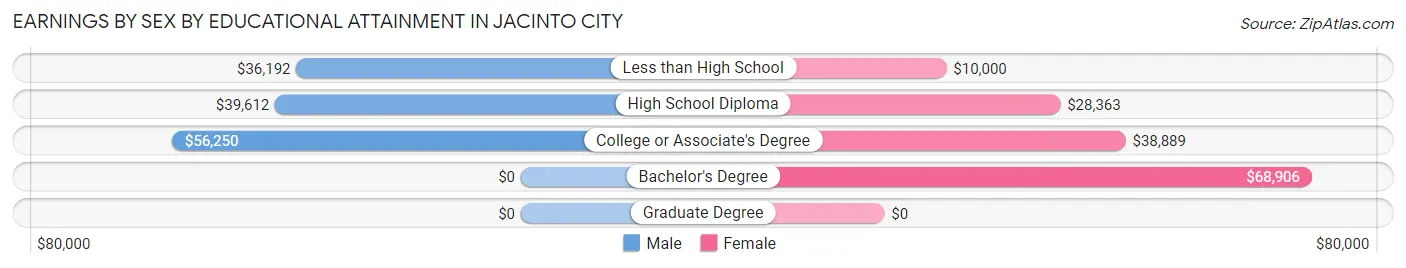
| Educational Attainment | Male Income | Female Income |
| Less than High School | $36,192 | $10,000 |
| High School Diploma | $39,612 | $28,363 |
| College or Associate's Degree | $56,250 | $38,889 |
| Bachelor's Degree | - | - |
| Graduate Degree | - | - |
| Total | $37,629 | $28,065 |
Family Income in Jacinto City
Family Income Brackets in Jacinto City
According to the Jacinto City family income data, there are 600 families falling into the $50,000 to $74,999 income range, which is the most common income bracket and makes up 26.6% of all families. Conversely, the $150,000 to $199,999 income bracket is the least frequent group with only 16 families (0.7%) belonging to this category.
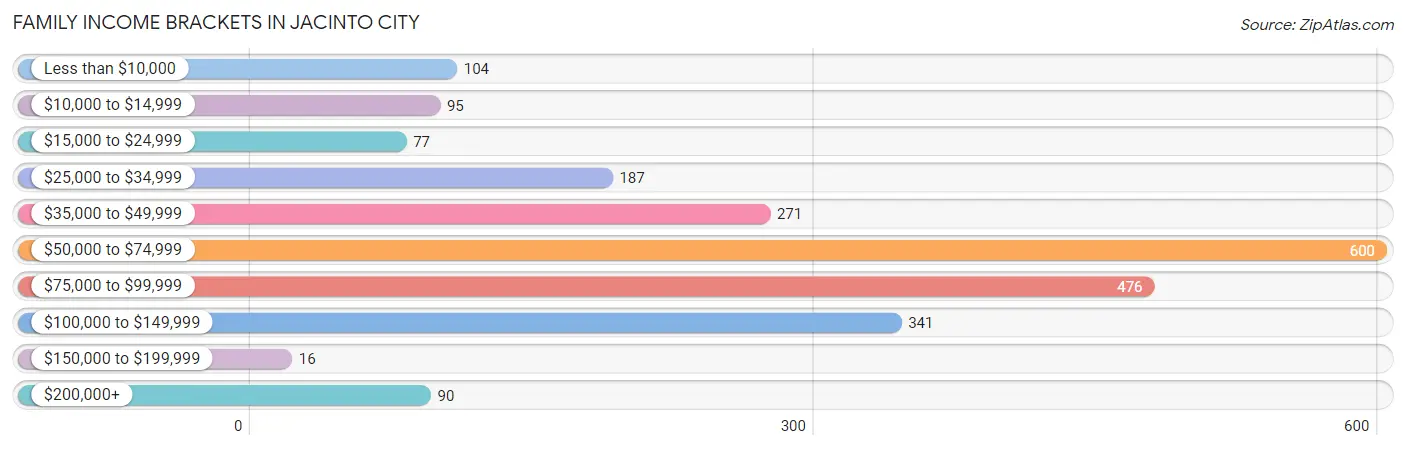
| Income Bracket | # Families | % Families |
| Less than $10,000 | 104 | 4.6% |
| $10,000 to $14,999 | 95 | 4.2% |
| $15,000 to $24,999 | 77 | 3.4% |
| $25,000 to $34,999 | 187 | 8.3% |
| $35,000 to $49,999 | 271 | 12.0% |
| $50,000 to $74,999 | 600 | 26.6% |
| $75,000 to $99,999 | 476 | 21.1% |
| $100,000 to $149,999 | 341 | 15.1% |
| $150,000 to $199,999 | 16 | 0.7% |
| $200,000+ | 90 | 4.0% |
Family Income by Famaliy Size in Jacinto City
5-person families (275 | 12.2%) account for the highest median family income in Jacinto City with $84,612 per family, while 2-person families (836 | 37.1%) have the highest median income of $23,234 per family member.
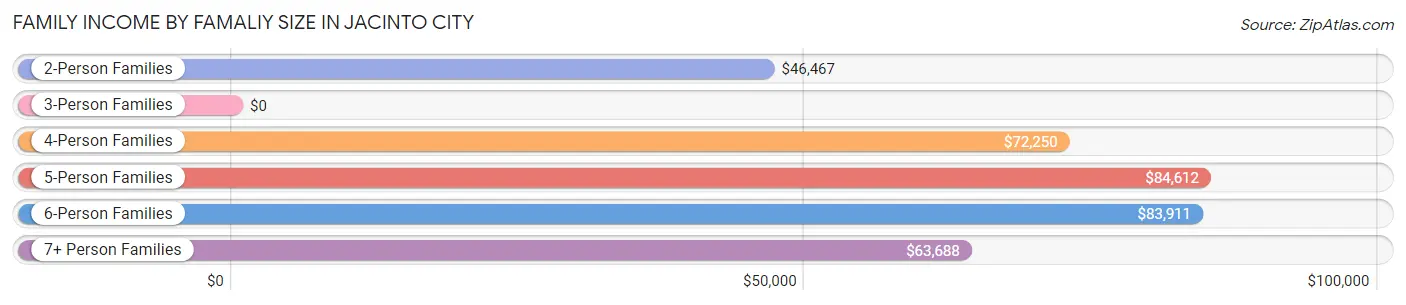
| Income Bracket | # Families | Median Income |
| 2-Person Families | 836 (37.1%) | $46,467 |
| 3-Person Families | 434 (19.2%) | $0 |
| 4-Person Families | 417 (18.5%) | $72,250 |
| 5-Person Families | 275 (12.2%) | $84,612 |
| 6-Person Families | 179 (7.9%) | $83,911 |
| 7+ Person Families | 115 (5.1%) | $63,688 |
| Total | 2,256 (100.0%) | $68,029 |
Family Income by Number of Earners in Jacinto City
The median family income in Jacinto City is $68,029, with families comprising 3+ earners (370) having the highest median family income of $119,583, while families with no earners (202) have the lowest median family income of $25,900, accounting for 16.4% and 8.9% of families, respectively.
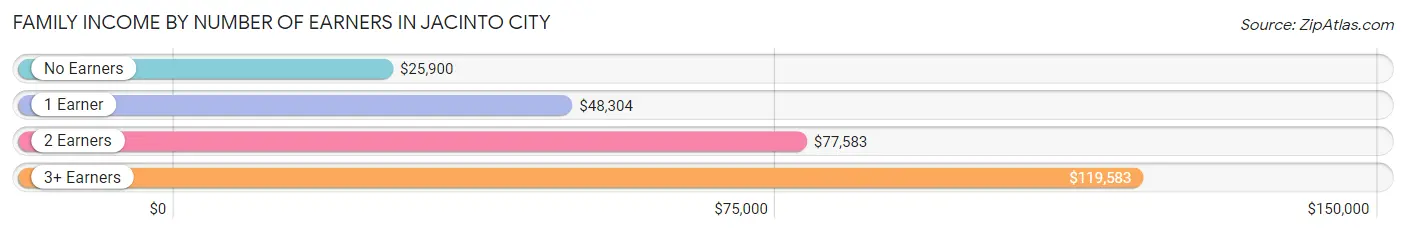
| Number of Earners | # Families | Median Income |
| No Earners | 202 (8.9%) | $25,900 |
| 1 Earner | 809 (35.9%) | $48,304 |
| 2 Earners | 875 (38.8%) | $77,583 |
| 3+ Earners | 370 (16.4%) | $119,583 |
| Total | 2,256 (100.0%) | $68,029 |
Household Income in Jacinto City
Household Income Brackets in Jacinto City
With 728 households falling in the category, the $50,000 to $74,999 income range is the most frequent in Jacinto City, accounting for 23.6% of all households. In contrast, only 15 households (0.5%) fall into the $150,000 to $199,999 income bracket, making it the least populous group.
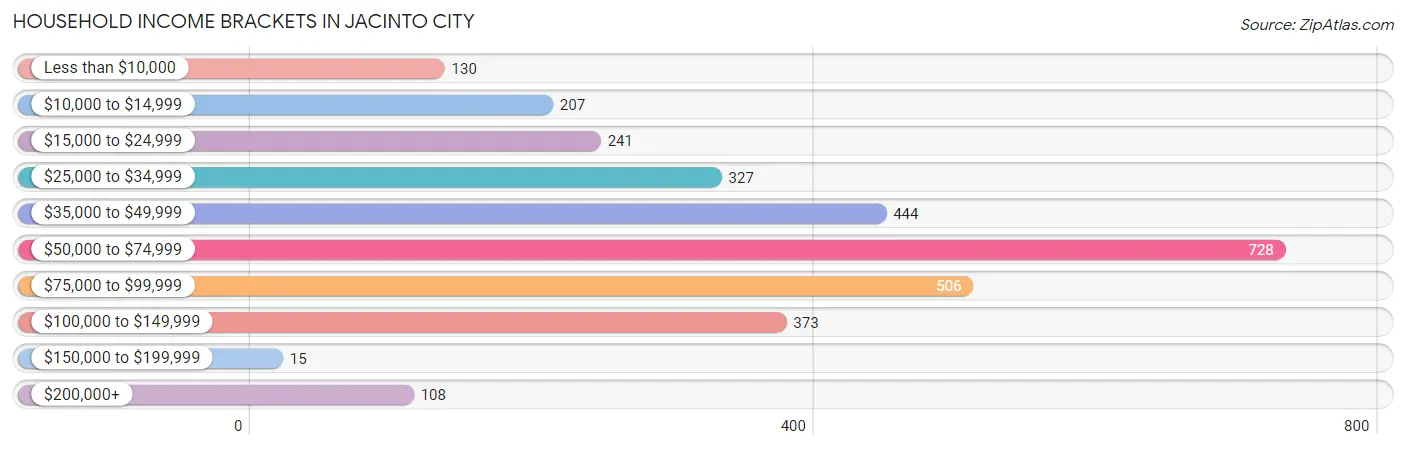
| Income Bracket | # Households | % Households |
| Less than $10,000 | 130 | 4.2% |
| $10,000 to $14,999 | 207 | 6.7% |
| $15,000 to $24,999 | 241 | 7.8% |
| $25,000 to $34,999 | 327 | 10.6% |
| $35,000 to $49,999 | 444 | 14.4% |
| $50,000 to $74,999 | 728 | 23.6% |
| $75,000 to $99,999 | 506 | 16.4% |
| $100,000 to $149,999 | 373 | 12.1% |
| $150,000 to $199,999 | 15 | 0.5% |
| $200,000+ | 108 | 3.5% |
Household Income by Householder Age in Jacinto City
The median household income in Jacinto City is $58,333, with the highest median household income of $70,286 found in the 25 to 44 years age bracket for the primary householder. A total of 938 households (30.4%) fall into this category. Meanwhile, the 15 to 24 years age bracket for the primary householder has the lowest median household income of $0, with 51 households (1.7%) in this group.
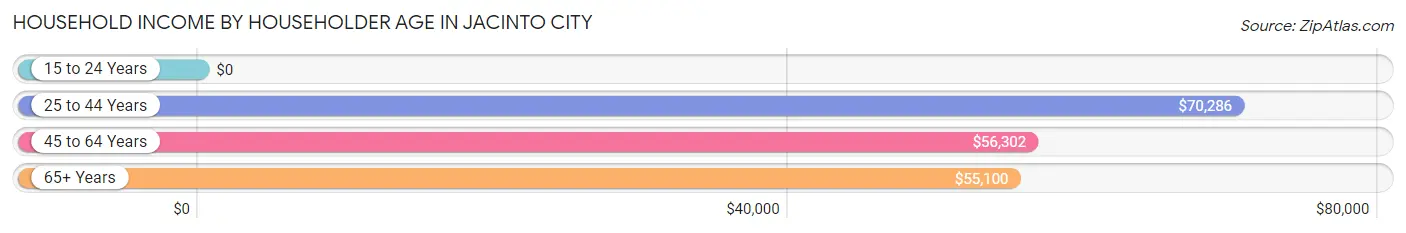
| Income Bracket | # Households | Median Income |
| 15 to 24 Years | 51 (1.7%) | $0 |
| 25 to 44 Years | 938 (30.4%) | $70,286 |
| 45 to 64 Years | 1,523 (49.4%) | $56,302 |
| 65+ Years | 572 (18.5%) | $55,100 |
| Total | 3,084 (100.0%) | $58,333 |
Poverty in Jacinto City
Income Below Poverty by Sex and Age in Jacinto City
With 10.7% poverty level for males and 18.9% for females among the residents of Jacinto City, under 5 year old males and 55 to 64 year old females are the most vulnerable to poverty, with 94 males (29.9%) and 236 females (37.3%) in their respective age groups living below the poverty level.
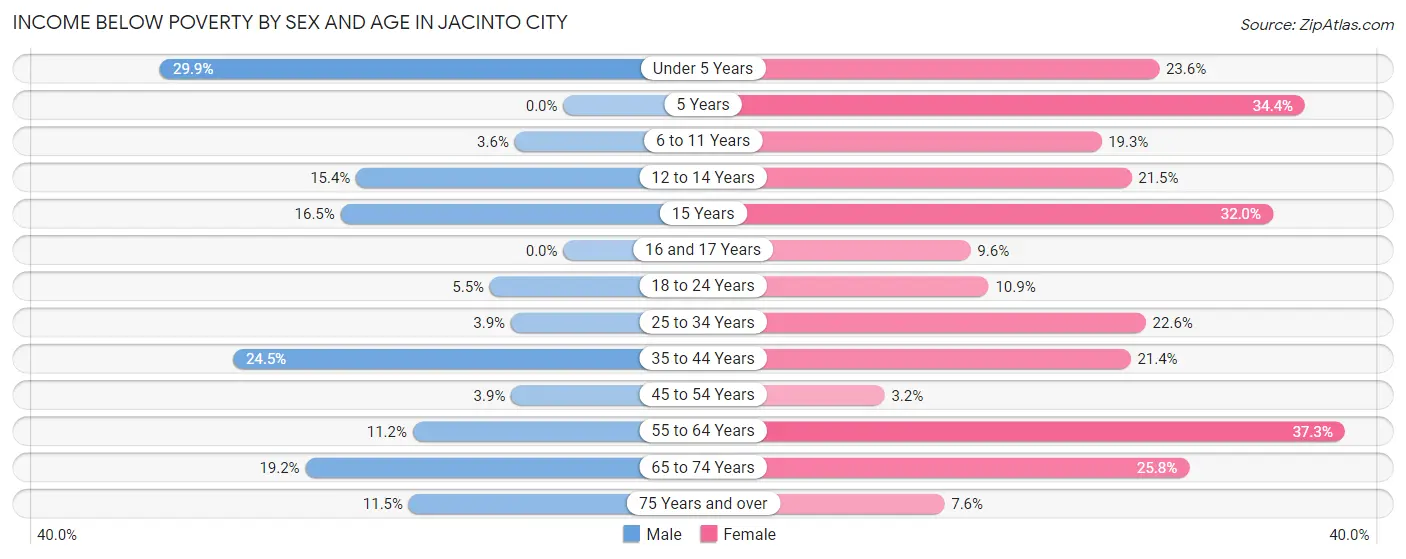
| Age Bracket | Male | Female |
| Under 5 Years | 94 (29.9%) | 61 (23.5%) |
| 5 Years | 0 (0.0%) | 33 (34.4%) |
| 6 to 11 Years | 23 (3.6%) | 57 (19.3%) |
| 12 to 14 Years | 20 (15.4%) | 43 (21.5%) |
| 15 Years | 22 (16.5%) | 8 (32.0%) |
| 16 and 17 Years | 0 (0.0%) | 15 (9.6%) |
| 18 to 24 Years | 22 (5.4%) | 54 (10.9%) |
| 25 to 34 Years | 28 (3.9%) | 74 (22.6%) |
| 35 to 44 Years | 130 (24.5%) | 141 (21.4%) |
| 45 to 54 Years | 29 (3.9%) | 24 (3.2%) |
| 55 to 64 Years | 72 (11.2%) | 236 (37.3%) |
| 65 to 74 Years | 68 (19.2%) | 83 (25.8%) |
| 75 Years and over | 25 (11.5%) | 22 (7.6%) |
| Total | 533 (10.7%) | 851 (18.9%) |
Income Above Poverty by Sex and Age in Jacinto City
According to the poverty statistics in Jacinto City, males aged 16 and 17 years and females aged 45 to 54 years are the age groups that are most secure financially, with 100.0% of males and 96.8% of females in these age groups living above the poverty line.
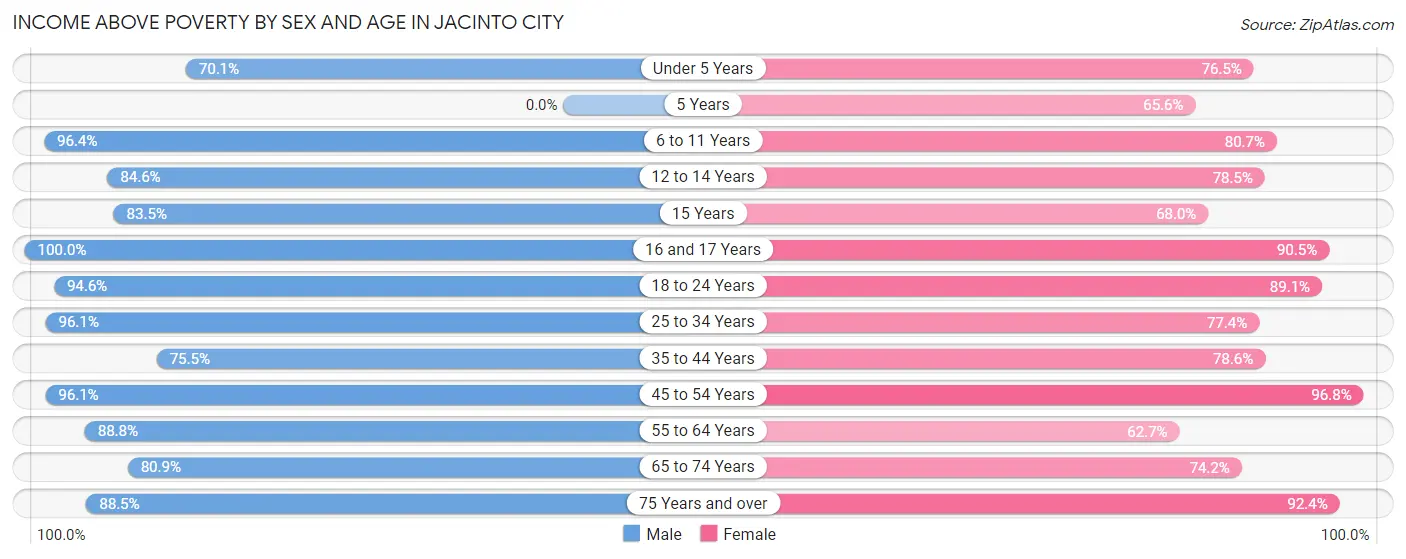
| Age Bracket | Male | Female |
| Under 5 Years | 220 (70.1%) | 198 (76.4%) |
| 5 Years | 0 (0.0%) | 63 (65.6%) |
| 6 to 11 Years | 614 (96.4%) | 239 (80.7%) |
| 12 to 14 Years | 110 (84.6%) | 157 (78.5%) |
| 15 Years | 111 (83.5%) | 17 (68.0%) |
| 16 and 17 Years | 149 (100.0%) | 142 (90.4%) |
| 18 to 24 Years | 382 (94.6%) | 442 (89.1%) |
| 25 to 34 Years | 692 (96.1%) | 254 (77.4%) |
| 35 to 44 Years | 400 (75.5%) | 517 (78.6%) |
| 45 to 54 Years | 721 (96.1%) | 732 (96.8%) |
| 55 to 64 Years | 572 (88.8%) | 396 (62.7%) |
| 65 to 74 Years | 287 (80.8%) | 239 (74.2%) |
| 75 Years and over | 193 (88.5%) | 267 (92.4%) |
| Total | 4,451 (89.3%) | 3,663 (81.1%) |
Income Below Poverty Among Married-Couple Families in Jacinto City
The poverty statistics for married-couple families in Jacinto City show that 10.6% or 160 of the total 1,508 families live below the poverty line. Families with no children have the highest poverty rate of 16.1%, comprising of 140 families. On the other hand, families with 3 or 4 children have the lowest poverty rate of 0.0%, which includes 0 families.
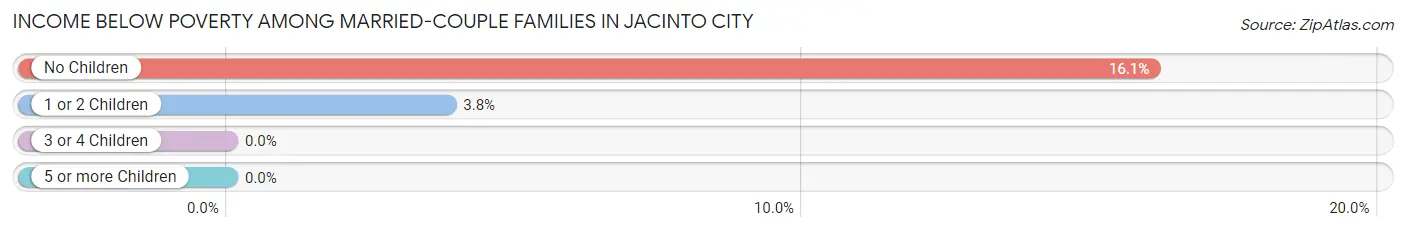
| Children | Above Poverty | Below Poverty |
| No Children | 731 (83.9%) | 140 (16.1%) |
| 1 or 2 Children | 507 (96.2%) | 20 (3.8%) |
| 3 or 4 Children | 90 (100.0%) | 0 (0.0%) |
| 5 or more Children | 20 (100.0%) | 0 (0.0%) |
| Total | 1,348 (89.4%) | 160 (10.6%) |
Income Below Poverty Among Single-Parent Households in Jacinto City
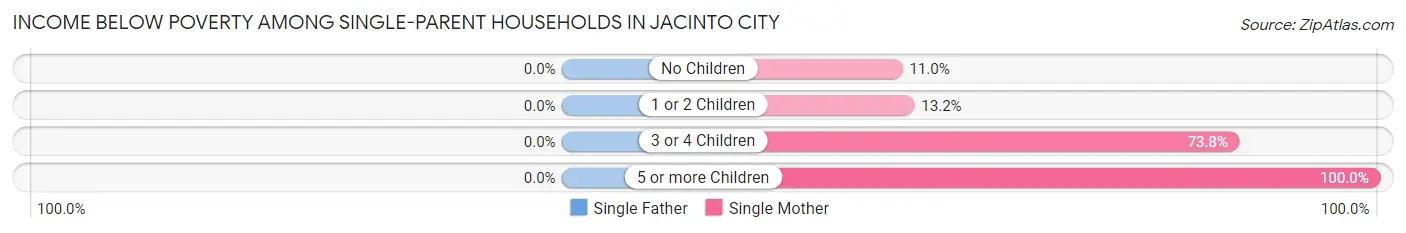
| Children | Single Father | Single Mother |
| No Children | 0 (0.0%) | 17 (11.0%) |
| 1 or 2 Children | 0 (0.0%) | 41 (13.2%) |
| 3 or 4 Children | 0 (0.0%) | 45 (73.8%) |
| 5 or more Children | 0 (0.0%) | 18 (100.0%) |
| Total | 0 (0.0%) | 121 (22.2%) |
Income Below Poverty Among Married-Couple vs Single-Parent Households in Jacinto City
The poverty data for Jacinto City shows that 160 of the married-couple family households (10.6%) and 121 of the single-parent households (16.2%) are living below the poverty level. Within the married-couple family households, those with no children have the highest poverty rate, with 140 households (16.1%) falling below the poverty line. Among the single-parent households, those with 5 or more children have the highest poverty rate, with 18 household (100.0%) living below poverty.
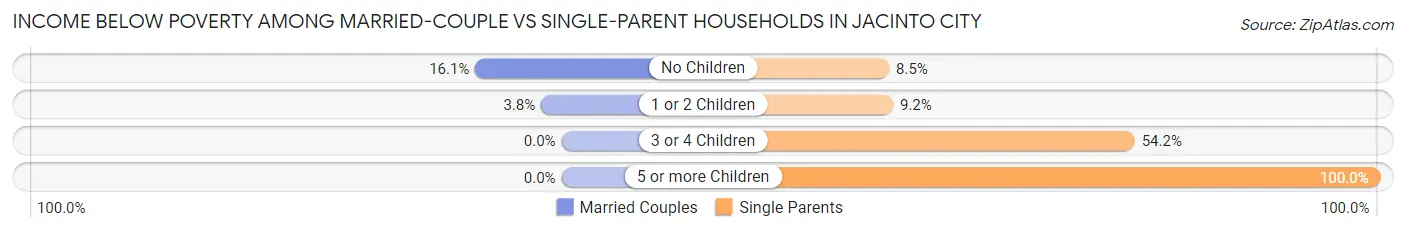
| Children | Married-Couple Families | Single-Parent Households |
| No Children | 140 (16.1%) | 17 (8.5%) |
| 1 or 2 Children | 20 (3.8%) | 41 (9.2%) |
| 3 or 4 Children | 0 (0.0%) | 45 (54.2%) |
| 5 or more Children | 0 (0.0%) | 18 (100.0%) |
| Total | 160 (10.6%) | 121 (16.2%) |
Race in Jacinto City
The most populous races in Jacinto City are Hispanic or Latino (8,131 | 84.8%), White / Caucasian (4,305 | 44.9%), and Two or more Races (3,290 | 34.3%).
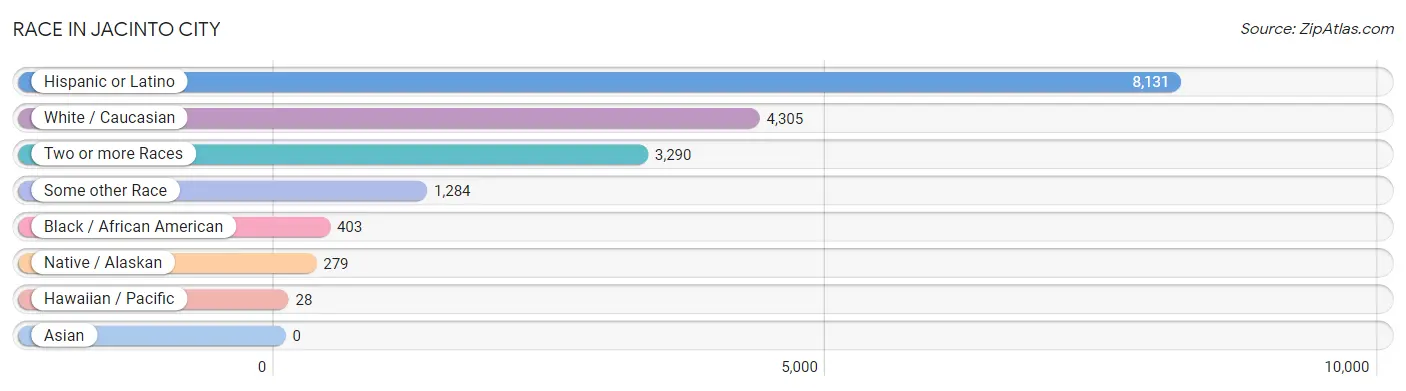
| Race | # Population | % Population |
| Asian | 0 | 0.0% |
| Black / African American | 403 | 4.2% |
| Hawaiian / Pacific | 28 | 0.3% |
| Hispanic or Latino | 8,131 | 84.8% |
| Native / Alaskan | 279 | 2.9% |
| White / Caucasian | 4,305 | 44.9% |
| Two or more Races | 3,290 | 34.3% |
| Some other Race | 1,284 | 13.4% |
| Total | 9,589 | 100.0% |
Ancestry in Jacinto City
The most populous ancestries reported in Jacinto City are Mexican (7,495 | 78.2%), Central American (543 | 5.7%), Guatemalan (348 | 3.6%), Irish (247 | 2.6%), and Central American Indian (238 | 2.5%), together accounting for 92.5% of all Jacinto City residents.
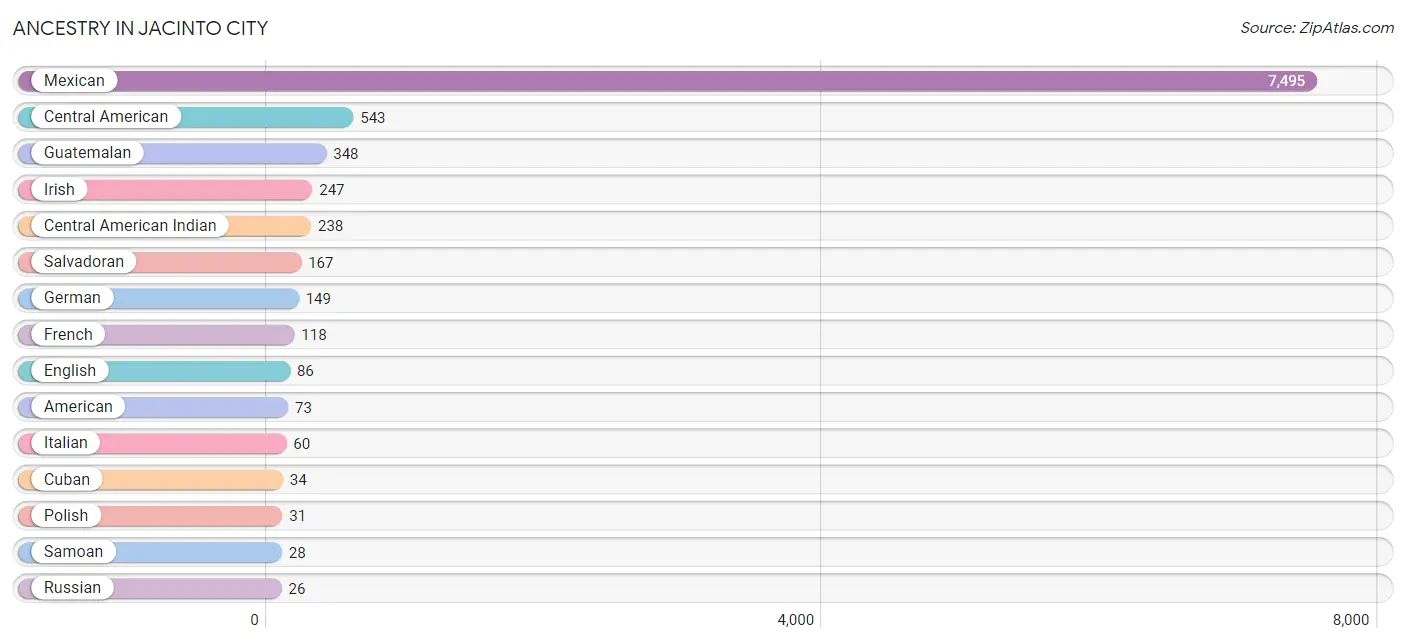
| Ancestry | # Population | % Population |
| African | 10 | 0.1% |
| American | 73 | 0.8% |
| Arab | 12 | 0.1% |
| Central American | 543 | 5.7% |
| Central American Indian | 238 | 2.5% |
| Cuban | 34 | 0.4% |
| Czech | 13 | 0.1% |
| English | 86 | 0.9% |
| European | 15 | 0.2% |
| French | 118 | 1.2% |
| German | 149 | 1.5% |
| Greek | 22 | 0.2% |
| Guatemalan | 348 | 3.6% |
| Honduran | 6 | 0.1% |
| Irish | 247 | 2.6% |
| Italian | 60 | 0.6% |
| Korean | 23 | 0.2% |
| Lebanese | 12 | 0.1% |
| Mexican | 7,495 | 78.2% |
| Nicaraguan | 22 | 0.2% |
| Norwegian | 8 | 0.1% |
| Polish | 31 | 0.3% |
| Russian | 26 | 0.3% |
| Salvadoran | 167 | 1.7% |
| Samoan | 28 | 0.3% |
| Scotch-Irish | 5 | 0.1% |
| Scottish | 12 | 0.1% |
| South American | 7 | 0.1% |
| Spaniard | 23 | 0.2% |
| Subsaharan African | 10 | 0.1% |
| Venezuelan | 7 | 0.1% | View All 31 Rows |
Immigrants in Jacinto City
The most numerous immigrant groups reported in Jacinto City came from Latin America (3,372 | 35.2%), Central America (3,348 | 34.9%), Mexico (3,049 | 31.8%), Guatemala (169 | 1.8%), and El Salvador (102 | 1.1%), together accounting for 104.7% of all Jacinto City residents.
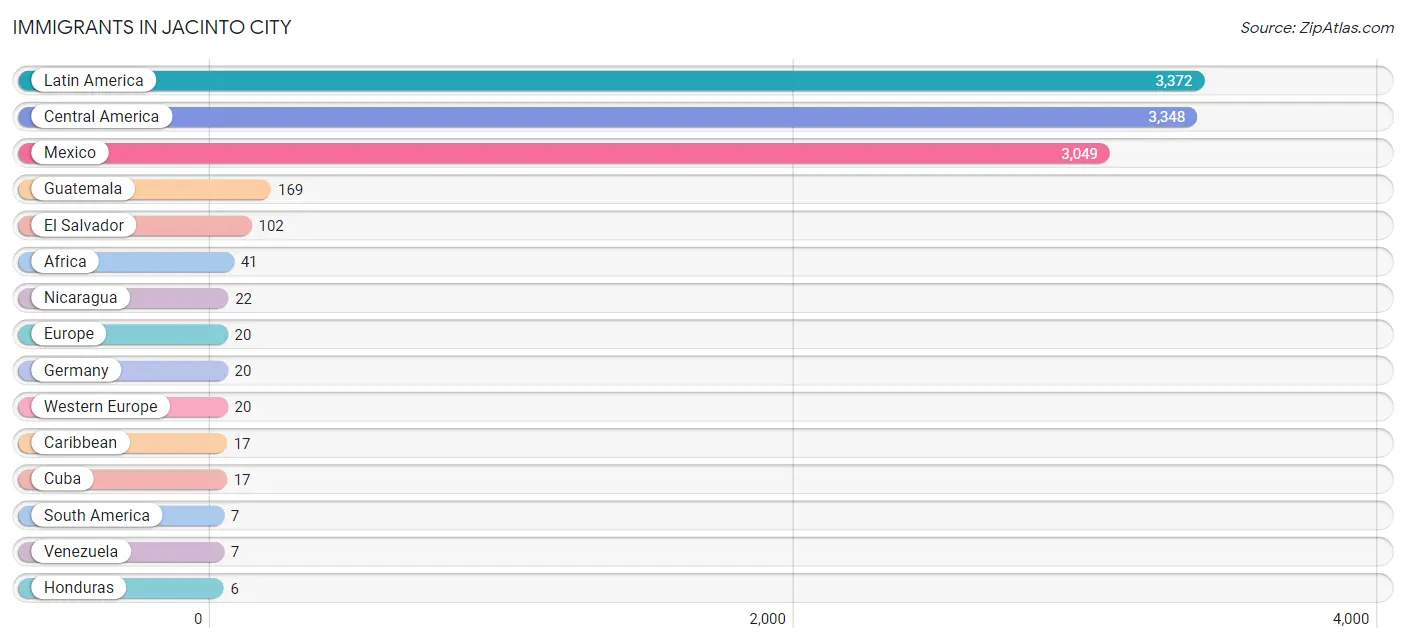
| Immigration Origin | # Population | % Population |
| Africa | 41 | 0.4% |
| Caribbean | 17 | 0.2% |
| Central America | 3,348 | 34.9% |
| Cuba | 17 | 0.2% |
| El Salvador | 102 | 1.1% |
| Europe | 20 | 0.2% |
| Germany | 20 | 0.2% |
| Guatemala | 169 | 1.8% |
| Honduras | 6 | 0.1% |
| Latin America | 3,372 | 35.2% |
| Mexico | 3,049 | 31.8% |
| Nicaragua | 22 | 0.2% |
| South America | 7 | 0.1% |
| Venezuela | 7 | 0.1% |
| Western Europe | 20 | 0.2% | View All 15 Rows |
Sex and Age in Jacinto City
Sex and Age in Jacinto City
The most populous age groups in Jacinto City are 50 to 54 Years (471 | 9.3%) for men and 50 to 54 Years (511 | 11.2%) for women.
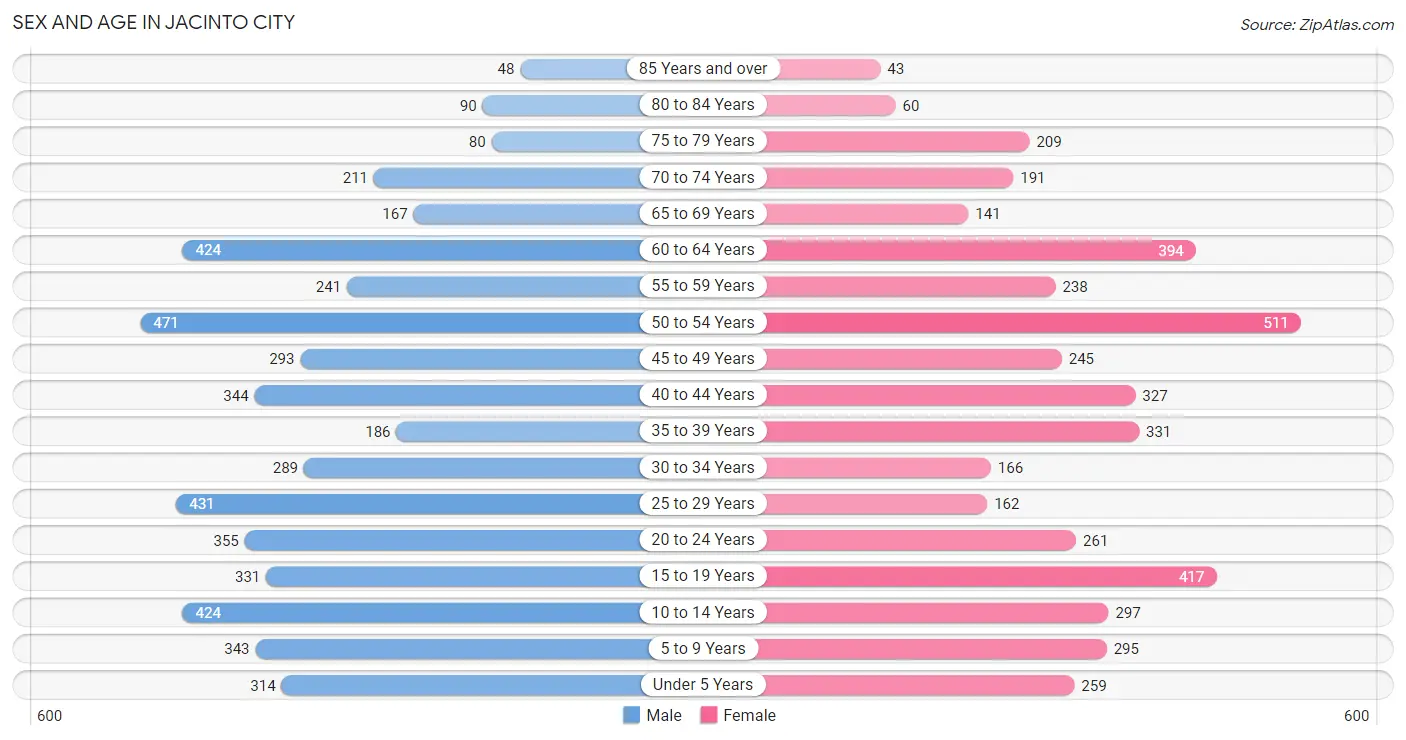
| Age Bracket | Male | Female |
| Under 5 Years | 314 (6.2%) | 259 (5.7%) |
| 5 to 9 Years | 343 (6.8%) | 295 (6.5%) |
| 10 to 14 Years | 424 (8.4%) | 297 (6.5%) |
| 15 to 19 Years | 331 (6.6%) | 417 (9.2%) |
| 20 to 24 Years | 355 (7.0%) | 261 (5.7%) |
| 25 to 29 Years | 431 (8.6%) | 162 (3.6%) |
| 30 to 34 Years | 289 (5.7%) | 166 (3.6%) |
| 35 to 39 Years | 186 (3.7%) | 331 (7.3%) |
| 40 to 44 Years | 344 (6.8%) | 327 (7.2%) |
| 45 to 49 Years | 293 (5.8%) | 245 (5.4%) |
| 50 to 54 Years | 471 (9.3%) | 511 (11.2%) |
| 55 to 59 Years | 241 (4.8%) | 238 (5.2%) |
| 60 to 64 Years | 424 (8.4%) | 394 (8.7%) |
| 65 to 69 Years | 167 (3.3%) | 141 (3.1%) |
| 70 to 74 Years | 211 (4.2%) | 191 (4.2%) |
| 75 to 79 Years | 80 (1.6%) | 209 (4.6%) |
| 80 to 84 Years | 90 (1.8%) | 60 (1.3%) |
| 85 Years and over | 48 (0.9%) | 43 (0.9%) |
| Total | 5,042 (100.0%) | 4,547 (100.0%) |
Families and Households in Jacinto City
Median Family Size in Jacinto City
The median family size in Jacinto City is 3.74 persons per family, with single male/father families (203 | 9.0%) accounting for the largest median family size of 4.88 persons per family. On the other hand, married-couple families (1,508 | 66.8%) represent the smallest median family size with 3.59 persons per family.
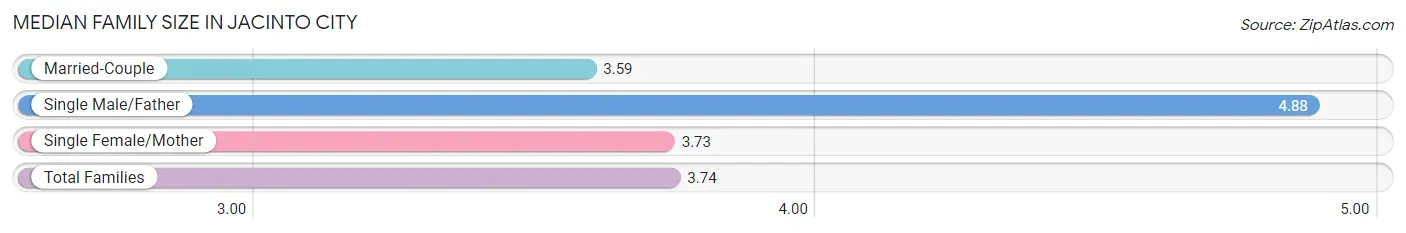
| Family Type | # Families | Family Size |
| Married-Couple | 1,508 (66.8%) | 3.59 |
| Single Male/Father | 203 (9.0%) | 4.88 |
| Single Female/Mother | 545 (24.2%) | 3.73 |
| Total Families | 2,256 (100.0%) | 3.74 |
Median Household Size in Jacinto City
The median household size in Jacinto City is 3.08 persons per household, with single male/father households (203 | 6.6%) accounting for the largest median household size of 5.16 persons per household. non-family households (828 | 26.9%) represent the smallest median household size with 1.10 persons per household.
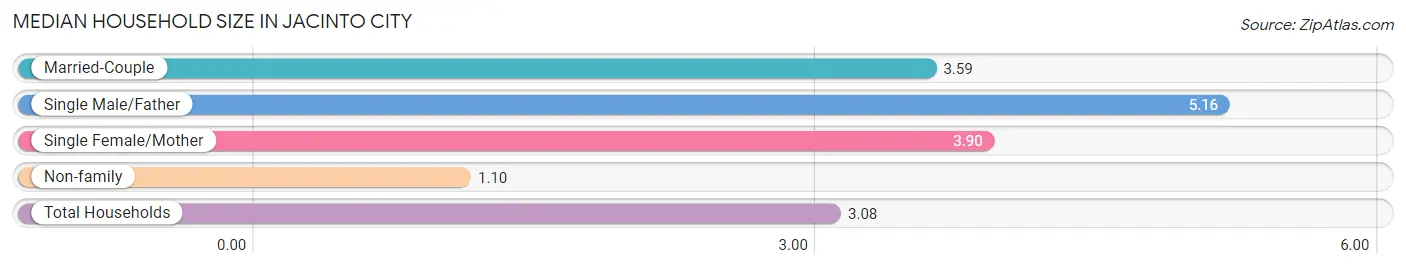
| Household Type | # Households | Household Size |
| Married-Couple | 1,508 (48.9%) | 3.59 |
| Single Male/Father | 203 (6.6%) | 5.16 |
| Single Female/Mother | 545 (17.7%) | 3.90 |
| Non-family | 828 (26.9%) | 1.10 |
| Total Households | 3,084 (100.0%) | 3.08 |
Household Size by Marriage Status in Jacinto City
Out of a total of 3,084 households in Jacinto City, 2,256 (73.2%) are family households, while 828 (26.9%) are nonfamily households. The most numerous type of family households are 2-person households, comprising 789, and the most common type of nonfamily households are 1-person households, comprising 739.
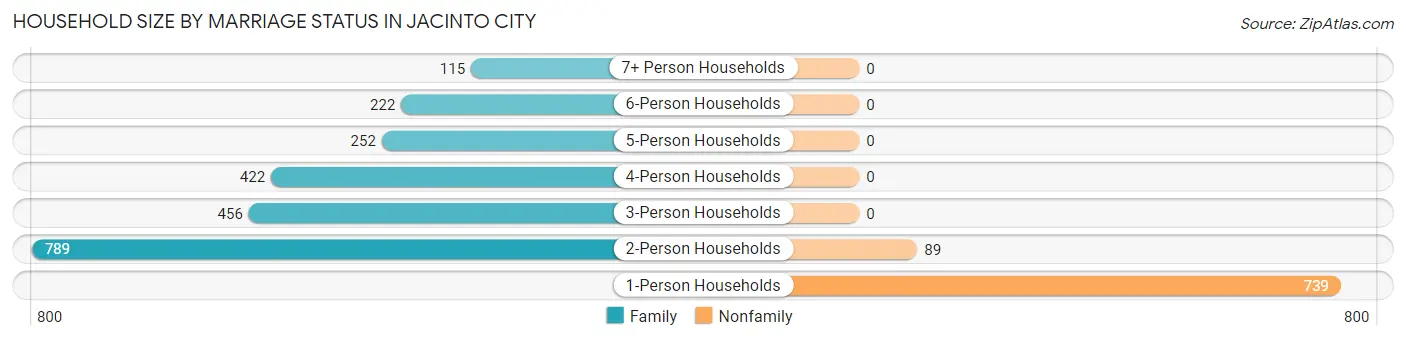
| Household Size | Family Households | Nonfamily Households |
| 1-Person Households | - | 739 (24.0%) |
| 2-Person Households | 789 (25.6%) | 89 (2.9%) |
| 3-Person Households | 456 (14.8%) | 0 (0.0%) |
| 4-Person Households | 422 (13.7%) | 0 (0.0%) |
| 5-Person Households | 252 (8.2%) | 0 (0.0%) |
| 6-Person Households | 222 (7.2%) | 0 (0.0%) |
| 7+ Person Households | 115 (3.7%) | 0 (0.0%) |
| Total | 2,256 (73.2%) | 828 (26.9%) |
Female Fertility in Jacinto City
Fertility by Age in Jacinto City
Average fertility rate in Jacinto City is 62.0 births per 1,000 women. Women in the age bracket of 20 to 34 years have the highest fertility rate with 107.0 births per 1,000 women. Women in the age bracket of 20 to 34 years acount for 48.1% of all women with births.
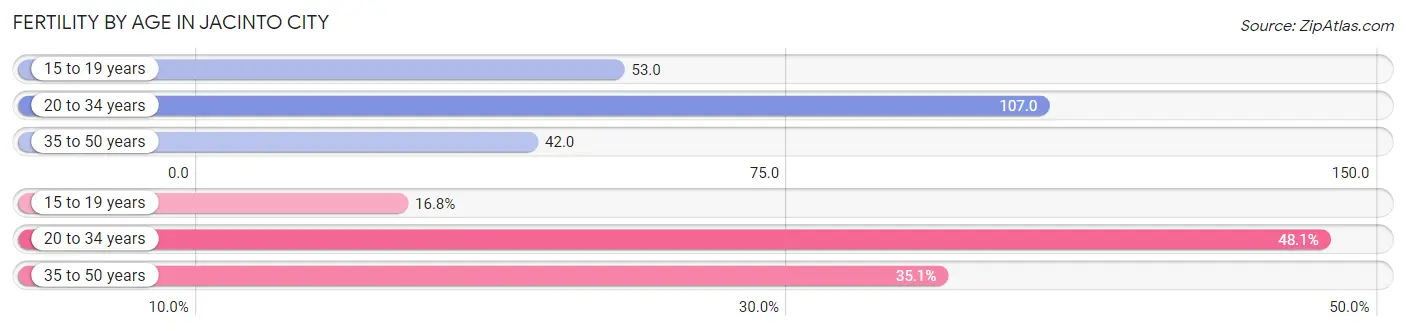
| Age Bracket | Women with Births | Births / 1,000 Women |
| 15 to 19 years | 22 (16.8%) | 53.0 |
| 20 to 34 years | 63 (48.1%) | 107.0 |
| 35 to 50 years | 46 (35.1%) | 42.0 |
| Total | 131 (100.0%) | 62.0 |
Fertility by Age by Marriage Status in Jacinto City
55.7% of women with births (131) in Jacinto City are married. The highest percentage of unmarried women with births falls into 15 to 19 years age bracket with 100.0% of them unmarried at the time of birth, while the lowest percentage of unmarried women with births belong to 35 to 50 years age bracket with 0.0% of them unmarried.
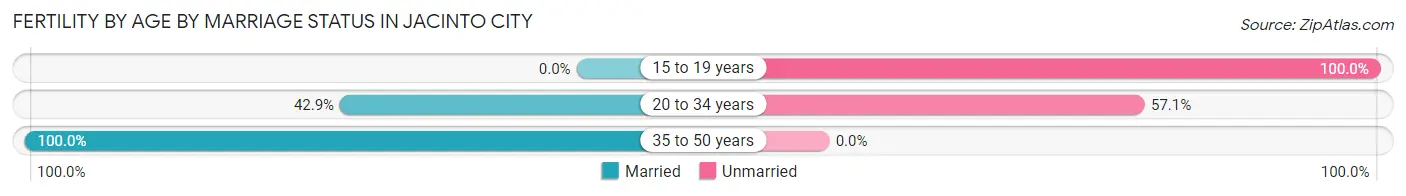
| Age Bracket | Married | Unmarried |
| 15 to 19 years | 0 (0.0%) | 22 (100.0%) |
| 20 to 34 years | 27 (42.9%) | 36 (57.1%) |
| 35 to 50 years | 46 (100.0%) | 0 (0.0%) |
| Total | 73 (55.7%) | 58 (44.3%) |
Fertility by Education in Jacinto City
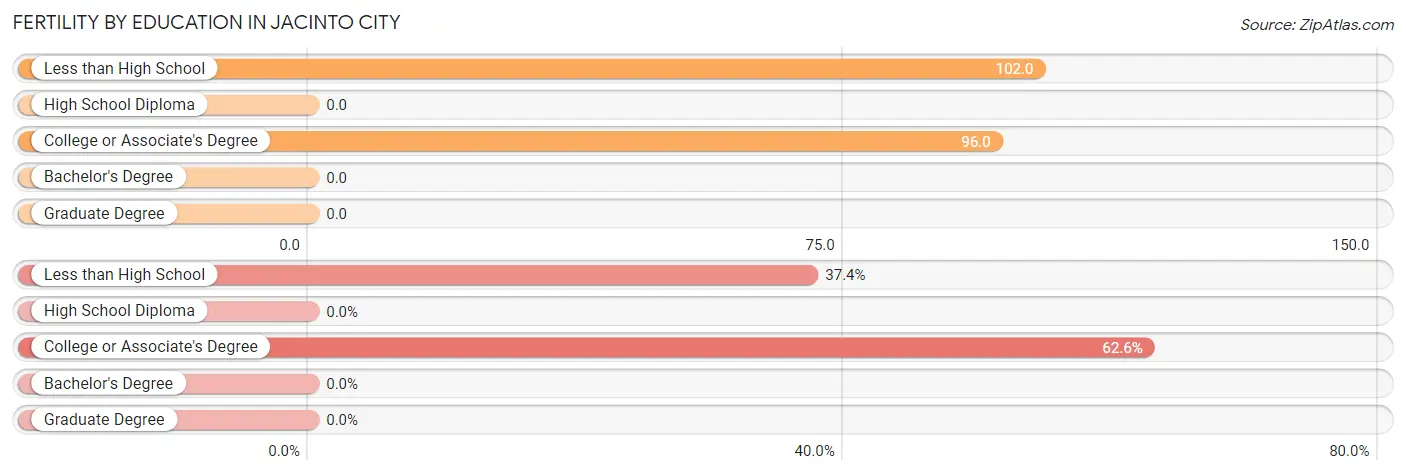
| Educational Attainment | Women with Births | Births / 1,000 Women |
| Less than High School | 49 (37.4%) | 102.0 |
| High School Diploma | 0 (0.0%) | 0.0 |
| College or Associate's Degree | 82 (62.6%) | 96.0 |
| Bachelor's Degree | 0 (0.0%) | 0.0 |
| Graduate Degree | 0 (0.0%) | 0.0 |
| Total | 131 (100.0%) | 62.0 |
Fertility by Education by Marriage Status in Jacinto City
44.3% of women with births in Jacinto City are unmarried. Women with the educational attainment of college or associate's degree are most likely to be married with 56.1% of them married at childbirth, while women with the educational attainment of less than high school are least likely to be married with 44.9% of them unmarried at childbirth.
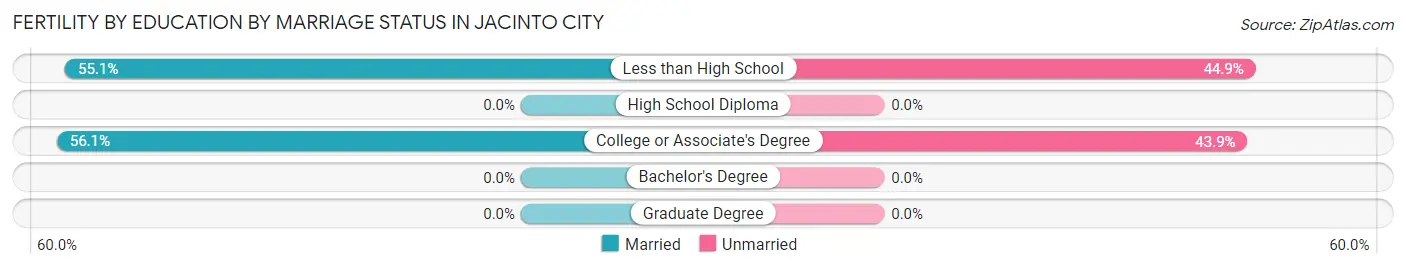
| Educational Attainment | Married | Unmarried |
| Less than High School | 27 (55.1%) | 22 (44.9%) |
| High School Diploma | 0 (0.0%) | 0 (0.0%) |
| College or Associate's Degree | 46 (56.1%) | 36 (43.9%) |
| Bachelor's Degree | 0 (0.0%) | 0 (0.0%) |
| Graduate Degree | 0 (0.0%) | 0 (0.0%) |
| Total | 73 (55.7%) | 58 (44.3%) |
Employment Characteristics in Jacinto City
Employment by Class of Employer in Jacinto City
Among the 4,289 employed individuals in Jacinto City, private company employees (3,080 | 71.8%), self-employed (not incorporated) (533 | 12.4%), and local government employees (209 | 4.9%) make up the most common classes of employment.
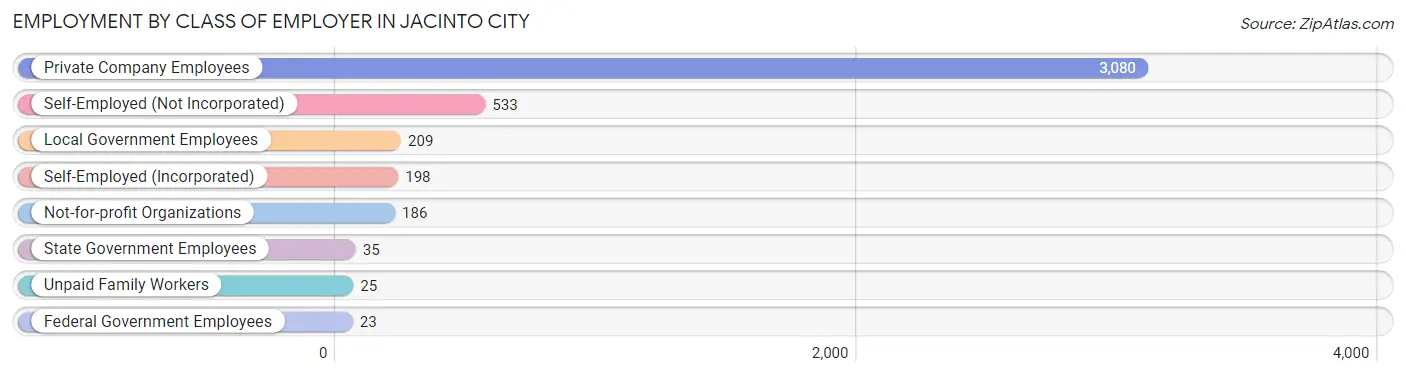
| Employer Class | # Employees | % Employees |
| Private Company Employees | 3,080 | 71.8% |
| Self-Employed (Incorporated) | 198 | 4.6% |
| Self-Employed (Not Incorporated) | 533 | 12.4% |
| Not-for-profit Organizations | 186 | 4.3% |
| Local Government Employees | 209 | 4.9% |
| State Government Employees | 35 | 0.8% |
| Federal Government Employees | 23 | 0.5% |
| Unpaid Family Workers | 25 | 0.6% |
| Total | 4,289 | 100.0% |
Employment Status by Age in Jacinto City
According to the labor force statistics for Jacinto City, out of the total population over 16 years of age (7,499), 61.7% or 4,627 individuals are in the labor force, with 5.6% or 259 of them unemployed. The age group with the highest labor force participation rate is 30 to 34 years, with 100.0% or 455 individuals in the labor force. Within the labor force, the 25 to 29 years age range has the highest percentage of unemployed individuals, with 13.7% or 73 of them being unemployed.
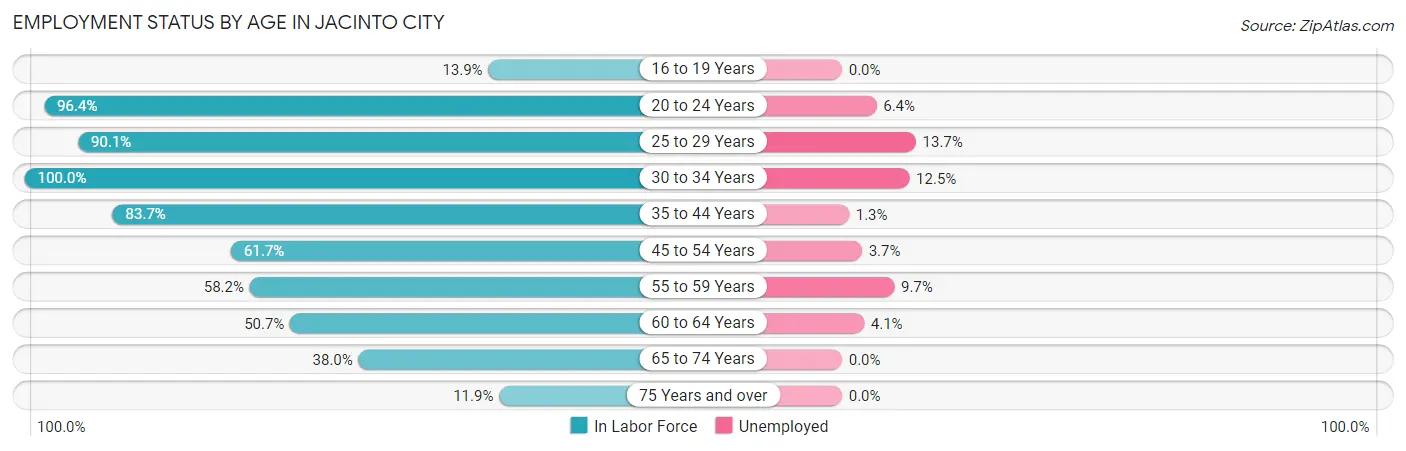
| Age Bracket | In Labor Force | Unemployed |
| 16 to 19 Years | 82 (13.9%) | 0 (0.0%) |
| 20 to 24 Years | 594 (96.4%) | 38 (6.4%) |
| 25 to 29 Years | 534 (90.1%) | 73 (13.7%) |
| 30 to 34 Years | 455 (100.0%) | 57 (12.5%) |
| 35 to 44 Years | 994 (83.7%) | 13 (1.3%) |
| 45 to 54 Years | 938 (61.7%) | 35 (3.7%) |
| 55 to 59 Years | 279 (58.2%) | 27 (9.7%) |
| 60 to 64 Years | 415 (50.7%) | 17 (4.1%) |
| 65 to 74 Years | 270 (38.0%) | 0 (0.0%) |
| 75 Years and over | 63 (11.9%) | 0 (0.0%) |
| Total | 4,627 (61.7%) | 259 (5.6%) |
Employment Status by Educational Attainment in Jacinto City
According to labor force statistics for Jacinto City, 71.5% of individuals (3,613) out of the total population between 25 and 64 years of age (5,053) are in the labor force, with 6.1% or 220 of them being unemployed. The group with the highest labor force participation rate are those with the educational attainment of bachelor's degree or higher, with 86.2% or 349 individuals in the labor force. Within the labor force, individuals with less than high school education have the highest percentage of unemployment, with 10.7% or 133 of them being unemployed.
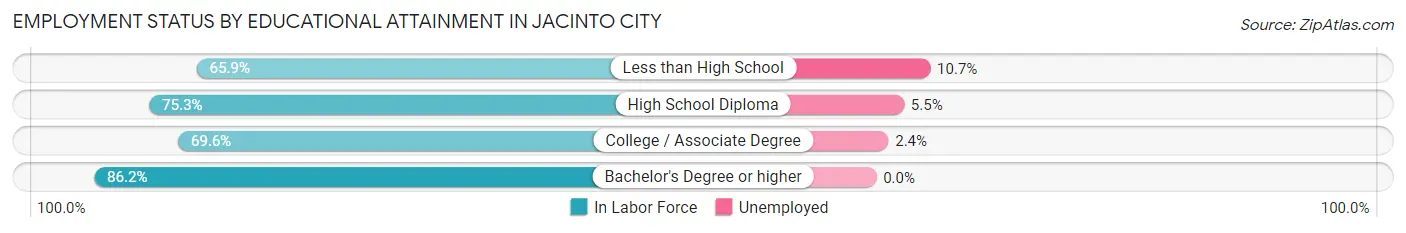
| Educational Attainment | In Labor Force | Unemployed |
| Less than High School | 1,246 (65.9%) | 202 (10.7%) |
| High School Diploma | 1,313 (75.3%) | 96 (5.5%) |
| College / Associate Degree | 705 (69.6%) | 24 (2.4%) |
| Bachelor's Degree or higher | 349 (86.2%) | 0 (0.0%) |
| Total | 3,613 (71.5%) | 308 (6.1%) |
Employment Occupations by Sex in Jacinto City
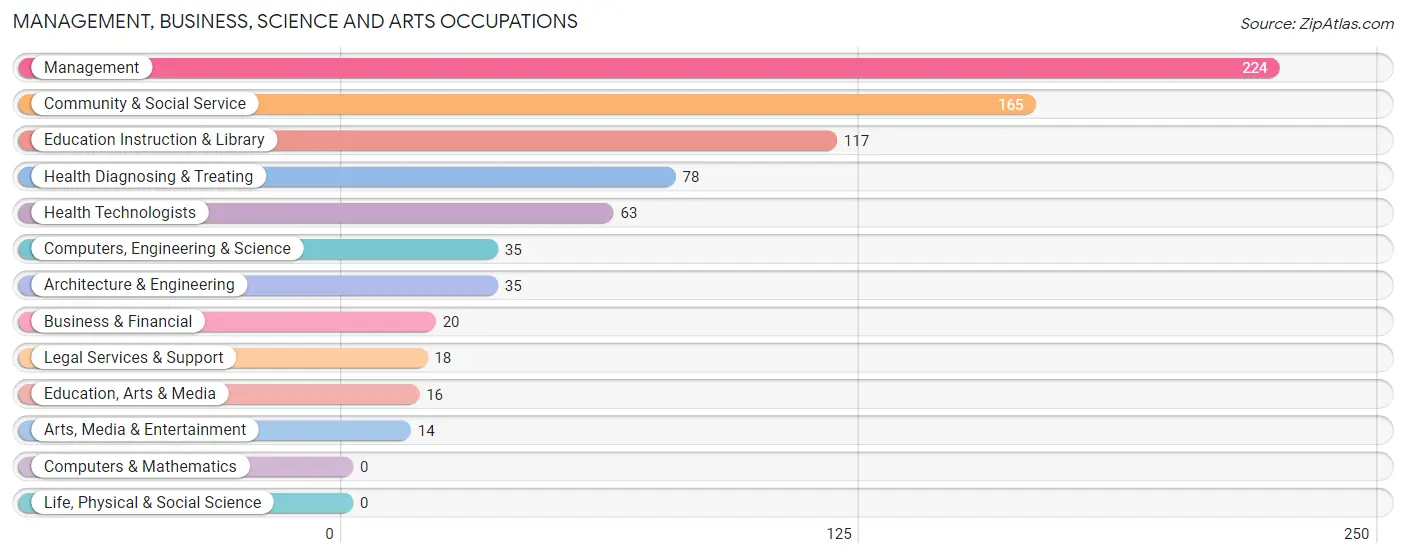
Management, Business, Science and Arts Occupations
The most common Management, Business, Science and Arts occupations in Jacinto City are Management (224 | 5.1%), Community & Social Service (165 | 3.8%), Education Instruction & Library (117 | 2.7%), Health Diagnosing & Treating (78 | 1.8%), and Health Technologists (63 | 1.4%).
Management, Business, Science and Arts Occupations by Sex
Within the Management, Business, Science and Arts occupations in Jacinto City, the most male-oriented occupations are Computers, Engineering & Science (100.0%), Architecture & Engineering (100.0%), and Management (51.8%), while the most female-oriented occupations are Business & Financial (100.0%), Education, Arts & Media (100.0%), and Legal Services & Support (100.0%).
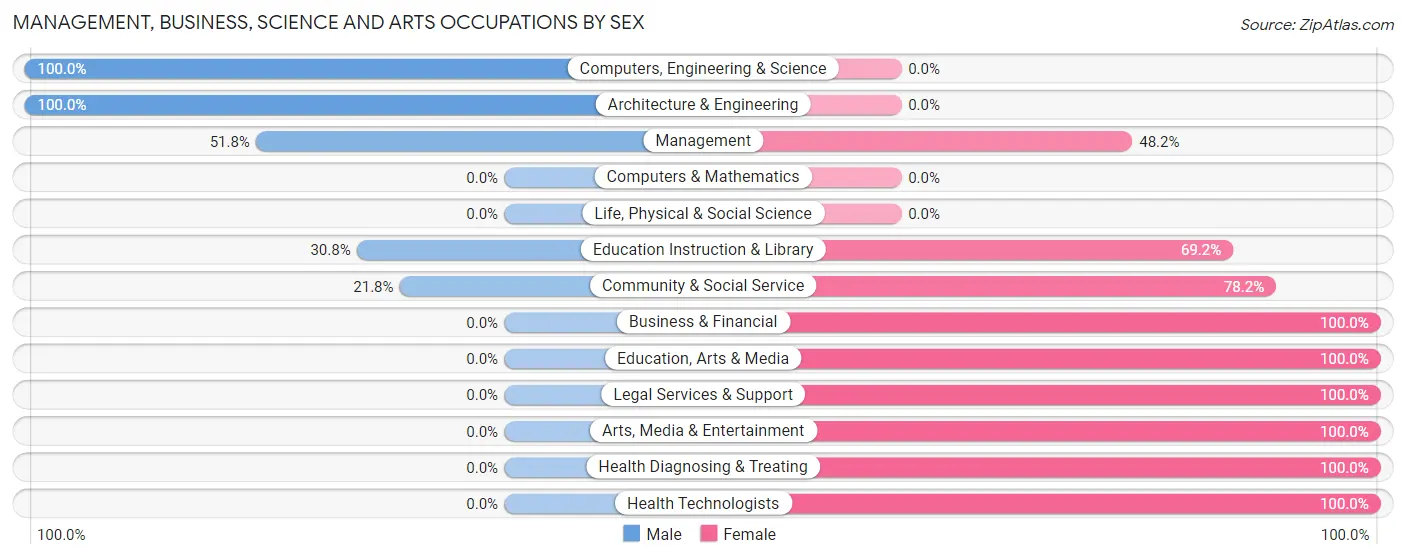
| Occupation | Male | Female |
| Management | 116 (51.8%) | 108 (48.2%) |
| Business & Financial | 0 (0.0%) | 20 (100.0%) |
| Computers, Engineering & Science | 35 (100.0%) | 0 (0.0%) |
| Computers & Mathematics | 0 (0.0%) | 0 (0.0%) |
| Architecture & Engineering | 35 (100.0%) | 0 (0.0%) |
| Life, Physical & Social Science | 0 (0.0%) | 0 (0.0%) |
| Community & Social Service | 36 (21.8%) | 129 (78.2%) |
| Education, Arts & Media | 0 (0.0%) | 16 (100.0%) |
| Legal Services & Support | 0 (0.0%) | 18 (100.0%) |
| Education Instruction & Library | 36 (30.8%) | 81 (69.2%) |
| Arts, Media & Entertainment | 0 (0.0%) | 14 (100.0%) |
| Health Diagnosing & Treating | 0 (0.0%) | 78 (100.0%) |
| Health Technologists | 0 (0.0%) | 63 (100.0%) |
| Total (Category) | 187 (35.8%) | 335 (64.2%) |
| Total (Overall) | 2,638 (60.5%) | 1,726 (39.6%) |
Services Occupations
The most common Services occupations in Jacinto City are Food Preparation & Serving (434 | 10.0%), Cleaning & Maintenance (248 | 5.7%), Security & Protection (142 | 3.3%), Firefighting & Prevention (104 | 2.4%), and Personal Care & Service (96 | 2.2%).
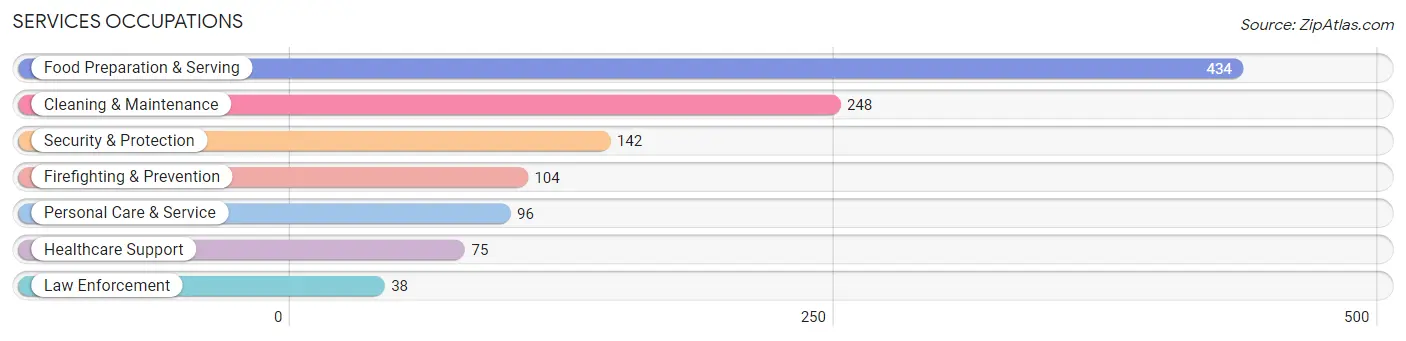
Services Occupations by Sex
Within the Services occupations in Jacinto City, the most male-oriented occupations are Firefighting & Prevention (81.7%), Security & Protection (76.1%), and Law Enforcement (60.5%), while the most female-oriented occupations are Healthcare Support (100.0%), Food Preparation & Serving (76.3%), and Cleaning & Maintenance (66.1%).
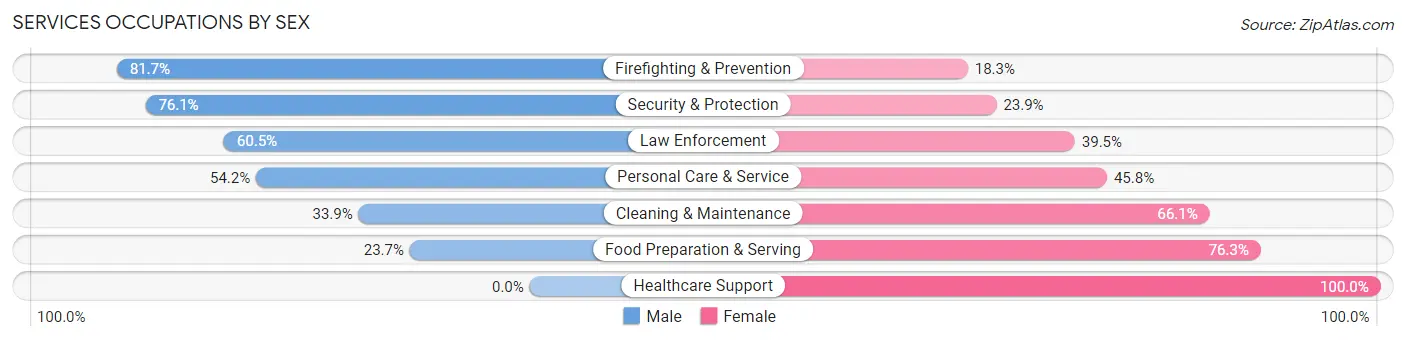
| Occupation | Male | Female |
| Healthcare Support | 0 (0.0%) | 75 (100.0%) |
| Security & Protection | 108 (76.1%) | 34 (23.9%) |
| Firefighting & Prevention | 85 (81.7%) | 19 (18.3%) |
| Law Enforcement | 23 (60.5%) | 15 (39.5%) |
| Food Preparation & Serving | 103 (23.7%) | 331 (76.3%) |
| Cleaning & Maintenance | 84 (33.9%) | 164 (66.1%) |
| Personal Care & Service | 52 (54.2%) | 44 (45.8%) |
| Total (Category) | 347 (34.9%) | 648 (65.1%) |
| Total (Overall) | 2,638 (60.5%) | 1,726 (39.6%) |
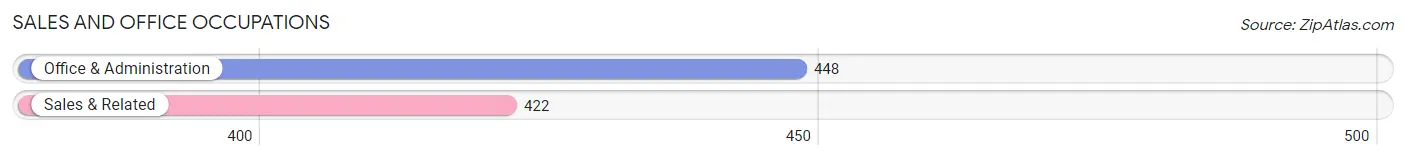
Sales and Office Occupations
The most common Sales and Office occupations in Jacinto City are Office & Administration (448 | 10.3%), and Sales & Related (422 | 9.7%).
Sales and Office Occupations by Sex
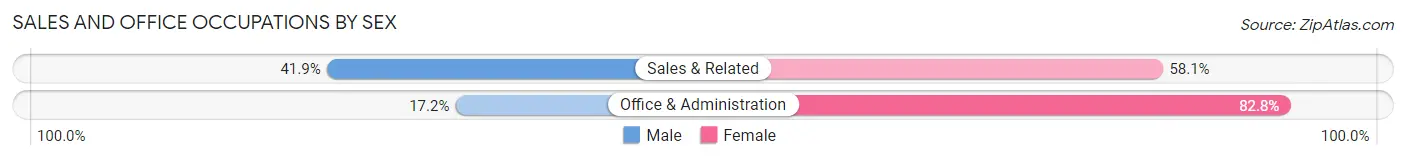
| Occupation | Male | Female |
| Sales & Related | 177 (41.9%) | 245 (58.1%) |
| Office & Administration | 77 (17.2%) | 371 (82.8%) |
| Total (Category) | 254 (29.2%) | 616 (70.8%) |
| Total (Overall) | 2,638 (60.5%) | 1,726 (39.6%) |
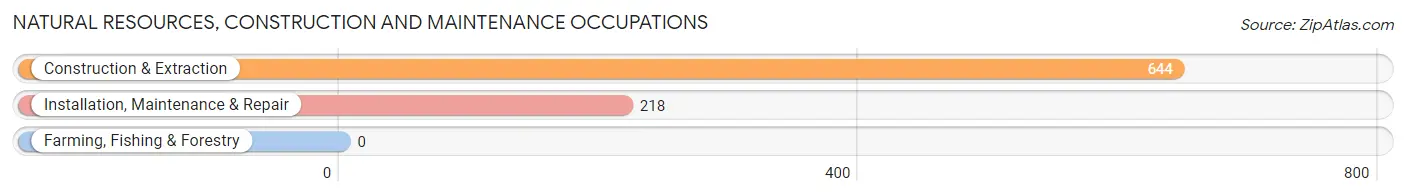
Natural Resources, Construction and Maintenance Occupations
The most common Natural Resources, Construction and Maintenance occupations in Jacinto City are Construction & Extraction (644 | 14.8%), and Installation, Maintenance & Repair (218 | 5.0%).
Natural Resources, Construction and Maintenance Occupations by Sex
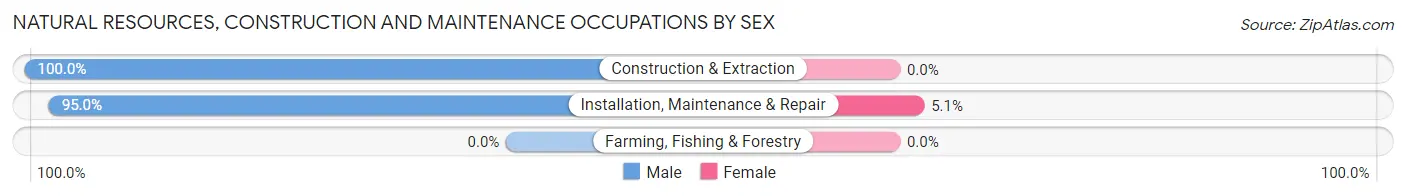
| Occupation | Male | Female |
| Farming, Fishing & Forestry | 0 (0.0%) | 0 (0.0%) |
| Construction & Extraction | 644 (100.0%) | 0 (0.0%) |
| Installation, Maintenance & Repair | 207 (95.0%) | 11 (5.1%) |
| Total (Category) | 851 (98.7%) | 11 (1.3%) |
| Total (Overall) | 2,638 (60.5%) | 1,726 (39.6%) |
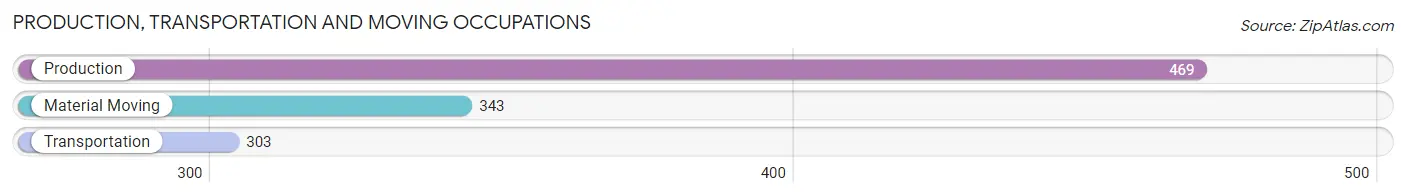
Production, Transportation and Moving Occupations
The most common Production, Transportation and Moving occupations in Jacinto City are Production (469 | 10.7%), Material Moving (343 | 7.9%), and Transportation (303 | 6.9%).
Production, Transportation and Moving Occupations by Sex
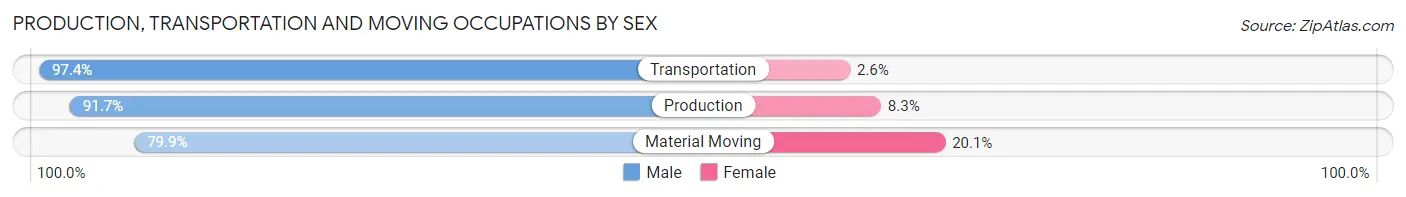
| Occupation | Male | Female |
| Production | 430 (91.7%) | 39 (8.3%) |
| Transportation | 295 (97.4%) | 8 (2.6%) |
| Material Moving | 274 (79.9%) | 69 (20.1%) |
| Total (Category) | 999 (89.6%) | 116 (10.4%) |
| Total (Overall) | 2,638 (60.5%) | 1,726 (39.6%) |
Employment Industries by Sex in Jacinto City
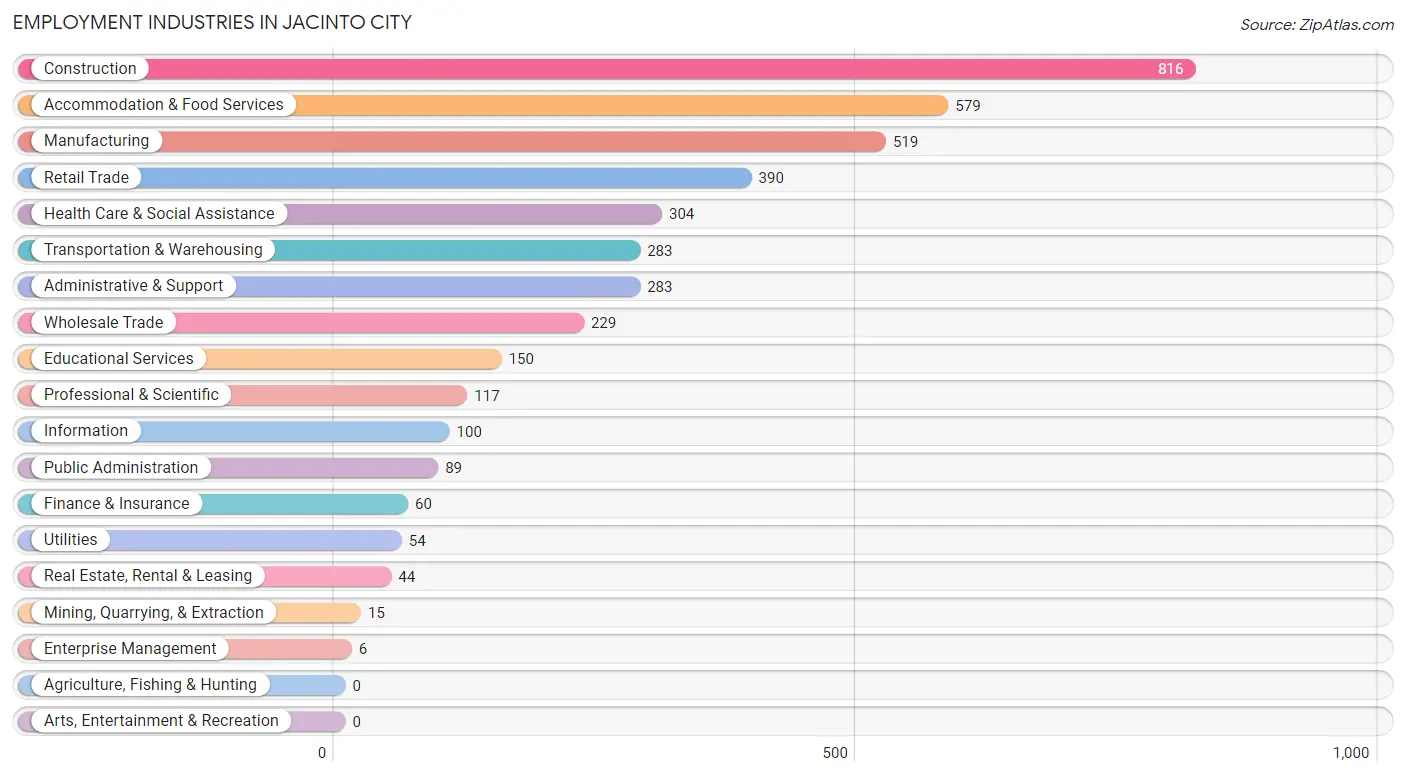
Employment Industries in Jacinto City
The major employment industries in Jacinto City include Construction (816 | 18.7%), Accommodation & Food Services (579 | 13.3%), Manufacturing (519 | 11.9%), Retail Trade (390 | 8.9%), and Health Care & Social Assistance (304 | 7.0%).
Employment Industries by Sex in Jacinto City
The Jacinto City industries that see more men than women are Utilities (100.0%), Enterprise Management (100.0%), and Manufacturing (89.8%), whereas the industries that tend to have a higher number of women are Mining, Quarrying, & Extraction (100.0%), Information (100.0%), and Finance & Insurance (100.0%).
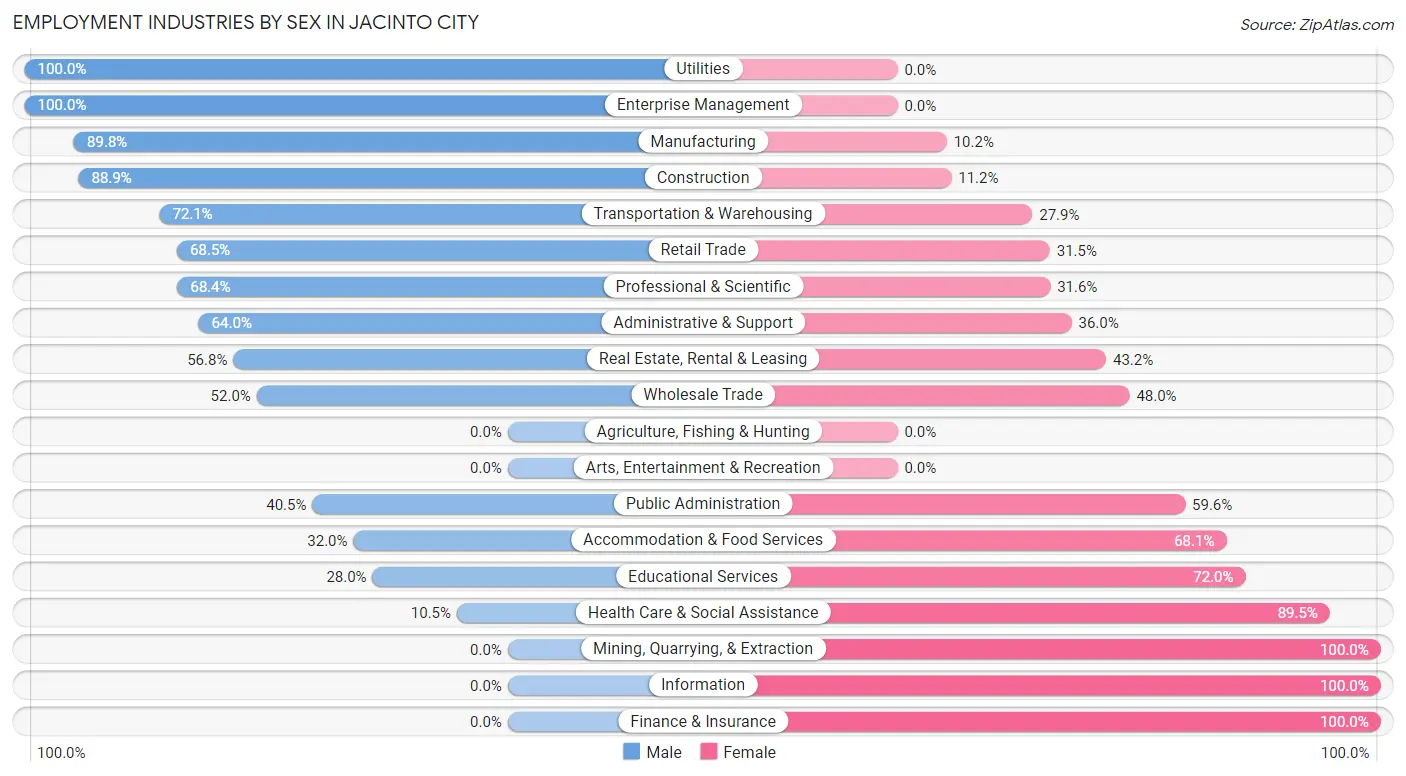
| Industry | Male | Female |
| Agriculture, Fishing & Hunting | 0 (0.0%) | 0 (0.0%) |
| Mining, Quarrying, & Extraction | 0 (0.0%) | 15 (100.0%) |
| Construction | 725 (88.8%) | 91 (11.2%) |
| Manufacturing | 466 (89.8%) | 53 (10.2%) |
| Wholesale Trade | 119 (52.0%) | 110 (48.0%) |
| Retail Trade | 267 (68.5%) | 123 (31.5%) |
| Transportation & Warehousing | 204 (72.1%) | 79 (27.9%) |
| Utilities | 54 (100.0%) | 0 (0.0%) |
| Information | 0 (0.0%) | 100 (100.0%) |
| Finance & Insurance | 0 (0.0%) | 60 (100.0%) |
| Real Estate, Rental & Leasing | 25 (56.8%) | 19 (43.2%) |
| Professional & Scientific | 80 (68.4%) | 37 (31.6%) |
| Enterprise Management | 6 (100.0%) | 0 (0.0%) |
| Administrative & Support | 181 (64.0%) | 102 (36.0%) |
| Educational Services | 42 (28.0%) | 108 (72.0%) |
| Health Care & Social Assistance | 32 (10.5%) | 272 (89.5%) |
| Arts, Entertainment & Recreation | 0 (0.0%) | 0 (0.0%) |
| Accommodation & Food Services | 185 (32.0%) | 394 (68.0%) |
| Public Administration | 36 (40.5%) | 53 (59.6%) |
| Total | 2,638 (60.5%) | 1,726 (39.6%) |
Education in Jacinto City
School Enrollment in Jacinto City
The most common levels of schooling among the 2,497 students in Jacinto City are elementary school (678 | 27.2%), college / undergraduate (586 | 23.5%), and middle school (584 | 23.4%).
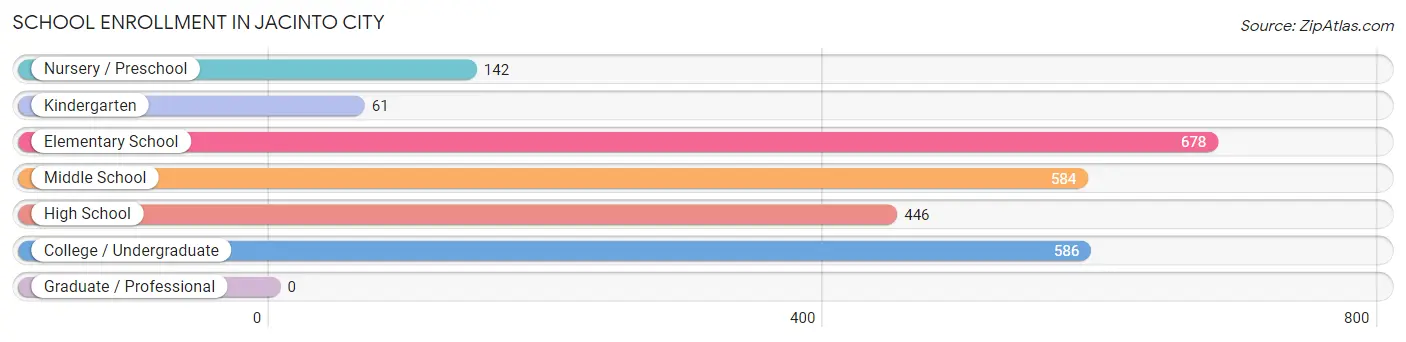
| School Level | # Students | % Students |
| Nursery / Preschool | 142 | 5.7% |
| Kindergarten | 61 | 2.4% |
| Elementary School | 678 | 27.2% |
| Middle School | 584 | 23.4% |
| High School | 446 | 17.9% |
| College / Undergraduate | 586 | 23.5% |
| Graduate / Professional | 0 | 0.0% |
| Total | 2,497 | 100.0% |
School Enrollment by Age by Funding Source in Jacinto City
Out of a total of 2,497 students who are enrolled in schools in Jacinto City, 70 (2.8%) attend a private institution, while the remaining 2,427 (97.2%) are enrolled in public schools. The age group of 35 years and over has the highest likelihood of being enrolled in private schools, with 9 (52.9% in the age bracket) enrolled. Conversely, the age group of 15 to 17 year olds has the lowest likelihood of being enrolled in a private school, with 442 (100.0% in the age bracket) attending a public institution.
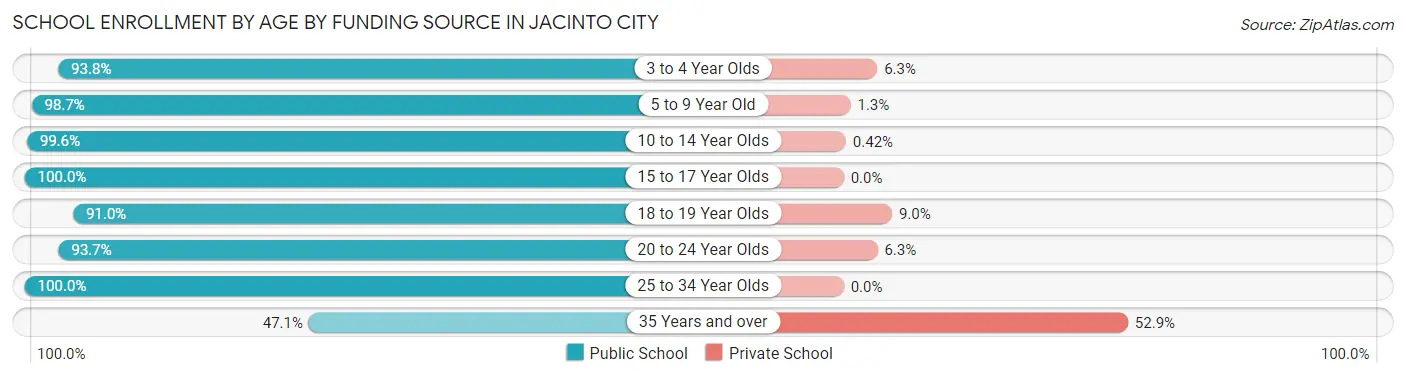
| Age Bracket | Public School | Private School |
| 3 to 4 Year Olds | 90 (93.8%) | 6 (6.2%) |
| 5 to 9 Year Old | 619 (98.7%) | 8 (1.3%) |
| 10 to 14 Year Olds | 718 (99.6%) | 3 (0.4%) |
| 15 to 17 Year Olds | 442 (100.0%) | 0 (0.0%) |
| 18 to 19 Year Olds | 212 (91.0%) | 21 (9.0%) |
| 20 to 24 Year Olds | 328 (93.7%) | 22 (6.3%) |
| 25 to 34 Year Olds | 11 (100.0%) | 0 (0.0%) |
| 35 Years and over | 8 (47.1%) | 9 (52.9%) |
| Total | 2,427 (97.2%) | 70 (2.8%) |
Educational Attainment by Field of Study in Jacinto City
Business (246 | 50.7%), social sciences (144 | 29.7%), education (70 | 14.4%), engineering (14 | 2.9%), and visual & performing arts (6 | 1.2%) are the most common fields of study among 485 individuals in Jacinto City who have obtained a bachelor's degree or higher.
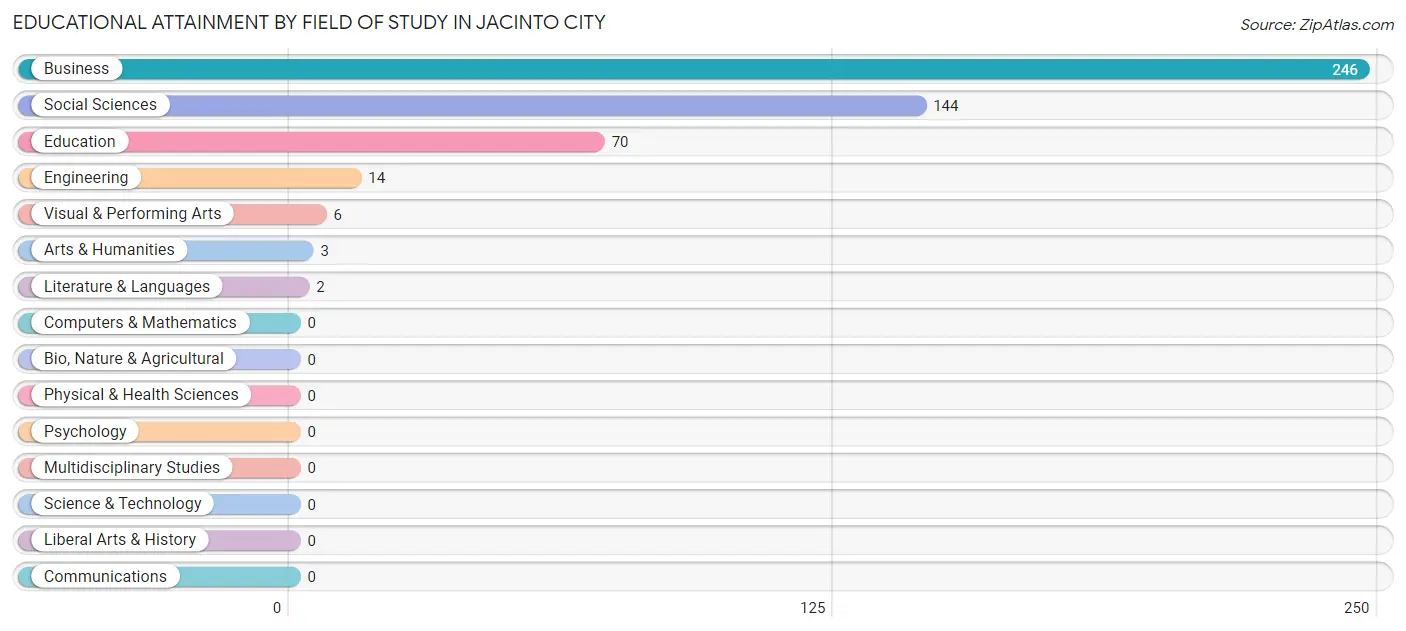
| Field of Study | # Graduates | % Graduates |
| Computers & Mathematics | 0 | 0.0% |
| Bio, Nature & Agricultural | 0 | 0.0% |
| Physical & Health Sciences | 0 | 0.0% |
| Psychology | 0 | 0.0% |
| Social Sciences | 144 | 29.7% |
| Engineering | 14 | 2.9% |
| Multidisciplinary Studies | 0 | 0.0% |
| Science & Technology | 0 | 0.0% |
| Business | 246 | 50.7% |
| Education | 70 | 14.4% |
| Literature & Languages | 2 | 0.4% |
| Liberal Arts & History | 0 | 0.0% |
| Visual & Performing Arts | 6 | 1.2% |
| Communications | 0 | 0.0% |
| Arts & Humanities | 3 | 0.6% |
| Total | 485 | 100.0% |
Transportation & Commute in Jacinto City
Vehicle Availability by Sex in Jacinto City
The most prevalent vehicle ownership categories in Jacinto City are males with 2 vehicles (757, accounting for 29.3%) and females with 2 vehicles (671, making up 44.4%).
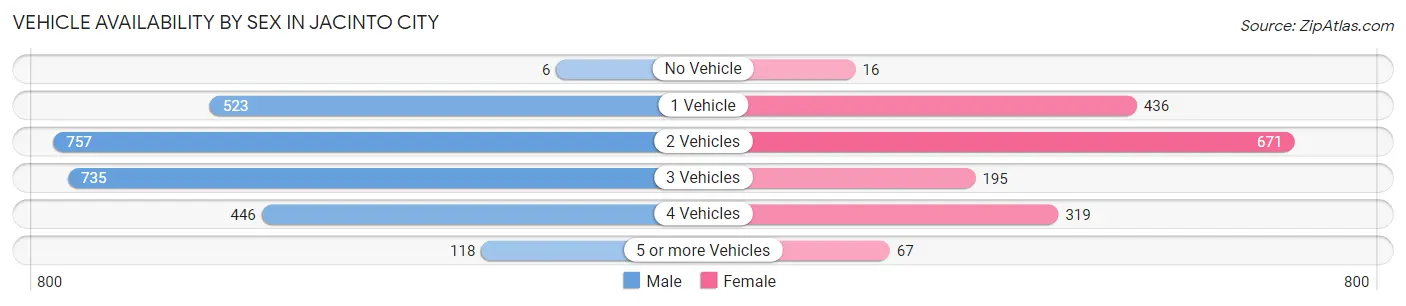
| Vehicles Available | Male | Female |
| No Vehicle | 6 (0.2%) | 16 (0.9%) |
| 1 Vehicle | 523 (20.2%) | 436 (25.6%) |
| 2 Vehicles | 757 (29.3%) | 671 (39.4%) |
| 3 Vehicles | 735 (28.4%) | 195 (11.4%) |
| 4 Vehicles | 446 (17.2%) | 319 (18.7%) |
| 5 or more Vehicles | 118 (4.6%) | 67 (3.9%) |
| Total | 2,585 (100.0%) | 1,704 (100.0%) |
Commute Time in Jacinto City
The most frequently occuring commute durations in Jacinto City are 20 to 24 minutes (952 commuters, 22.4%), 30 to 34 minutes (860 commuters, 20.2%), and 45 to 59 minutes (624 commuters, 14.7%).
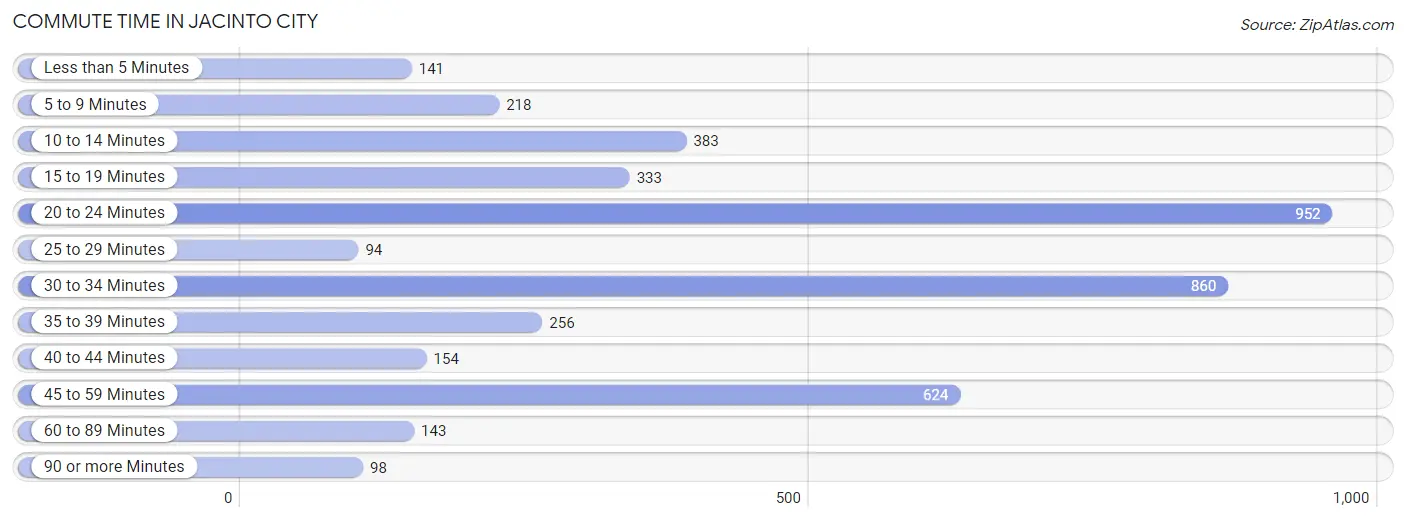
| Commute Time | # Commuters | % Commuters |
| Less than 5 Minutes | 141 | 3.3% |
| 5 to 9 Minutes | 218 | 5.1% |
| 10 to 14 Minutes | 383 | 9.0% |
| 15 to 19 Minutes | 333 | 7.8% |
| 20 to 24 Minutes | 952 | 22.4% |
| 25 to 29 Minutes | 94 | 2.2% |
| 30 to 34 Minutes | 860 | 20.2% |
| 35 to 39 Minutes | 256 | 6.0% |
| 40 to 44 Minutes | 154 | 3.6% |
| 45 to 59 Minutes | 624 | 14.7% |
| 60 to 89 Minutes | 143 | 3.4% |
| 90 or more Minutes | 98 | 2.3% |
Commute Time by Sex in Jacinto City
The most common commute times in Jacinto City are 30 to 34 minutes (701 commuters, 27.2%) for males and 45 to 59 minutes (341 commuters, 20.3%) for females.
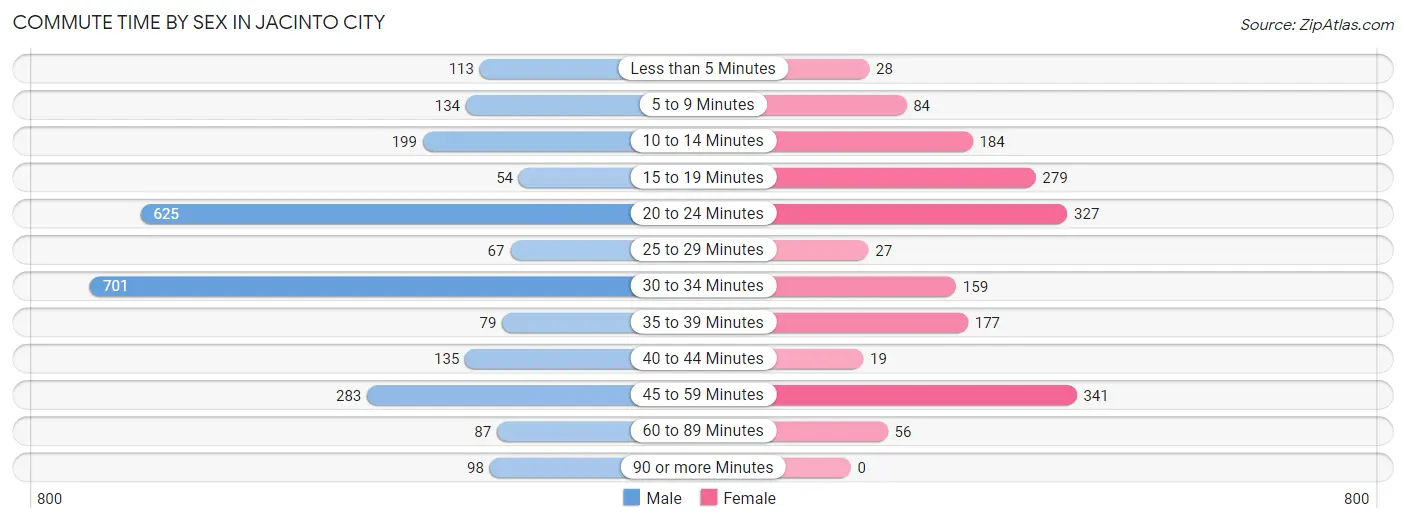
| Commute Time | Male | Female |
| Less than 5 Minutes | 113 (4.4%) | 28 (1.7%) |
| 5 to 9 Minutes | 134 (5.2%) | 84 (5.0%) |
| 10 to 14 Minutes | 199 (7.7%) | 184 (11.0%) |
| 15 to 19 Minutes | 54 (2.1%) | 279 (16.6%) |
| 20 to 24 Minutes | 625 (24.3%) | 327 (19.5%) |
| 25 to 29 Minutes | 67 (2.6%) | 27 (1.6%) |
| 30 to 34 Minutes | 701 (27.2%) | 159 (9.5%) |
| 35 to 39 Minutes | 79 (3.1%) | 177 (10.5%) |
| 40 to 44 Minutes | 135 (5.2%) | 19 (1.1%) |
| 45 to 59 Minutes | 283 (11.0%) | 341 (20.3%) |
| 60 to 89 Minutes | 87 (3.4%) | 56 (3.3%) |
| 90 or more Minutes | 98 (3.8%) | 0 (0.0%) |
Time of Departure to Work by Sex in Jacinto City
The most frequent times of departure to work in Jacinto City are 5:00 AM to 5:29 AM (876, 34.0%) for males and 7:30 AM to 7:59 AM (220, 13.1%) for females.
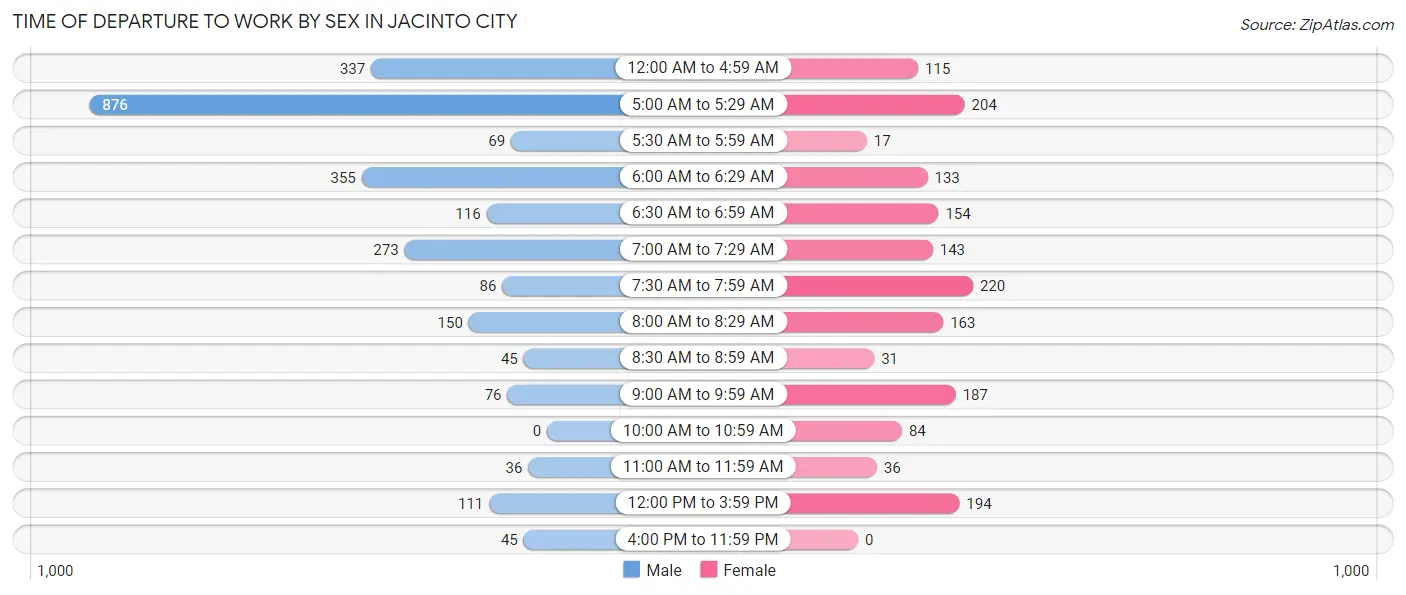
| Time of Departure | Male | Female |
| 12:00 AM to 4:59 AM | 337 (13.1%) | 115 (6.8%) |
| 5:00 AM to 5:29 AM | 876 (34.0%) | 204 (12.1%) |
| 5:30 AM to 5:59 AM | 69 (2.7%) | 17 (1.0%) |
| 6:00 AM to 6:29 AM | 355 (13.8%) | 133 (7.9%) |
| 6:30 AM to 6:59 AM | 116 (4.5%) | 154 (9.2%) |
| 7:00 AM to 7:29 AM | 273 (10.6%) | 143 (8.5%) |
| 7:30 AM to 7:59 AM | 86 (3.3%) | 220 (13.1%) |
| 8:00 AM to 8:29 AM | 150 (5.8%) | 163 (9.7%) |
| 8:30 AM to 8:59 AM | 45 (1.8%) | 31 (1.8%) |
| 9:00 AM to 9:59 AM | 76 (2.9%) | 187 (11.1%) |
| 10:00 AM to 10:59 AM | 0 (0.0%) | 84 (5.0%) |
| 11:00 AM to 11:59 AM | 36 (1.4%) | 36 (2.1%) |
| 12:00 PM to 3:59 PM | 111 (4.3%) | 194 (11.5%) |
| 4:00 PM to 11:59 PM | 45 (1.8%) | 0 (0.0%) |
| Total | 2,575 (100.0%) | 1,681 (100.0%) |
Housing Occupancy in Jacinto City
Occupancy by Ownership in Jacinto City
Of the total 3,084 dwellings in Jacinto City, owner-occupied units account for 2,098 (68.0%), while renter-occupied units make up 986 (32.0%).
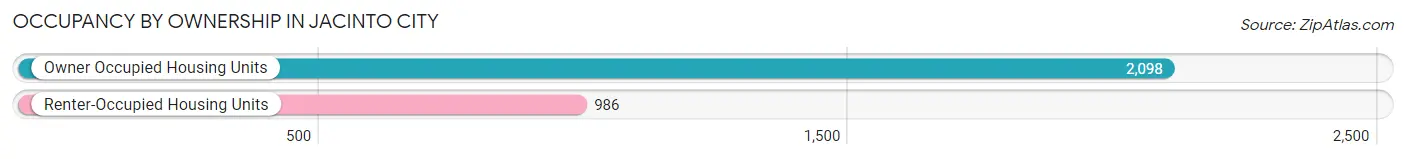
| Occupancy | # Housing Units | % Housing Units |
| Owner Occupied Housing Units | 2,098 | 68.0% |
| Renter-Occupied Housing Units | 986 | 32.0% |
| Total Occupied Housing Units | 3,084 | 100.0% |
Occupancy by Household Size in Jacinto City
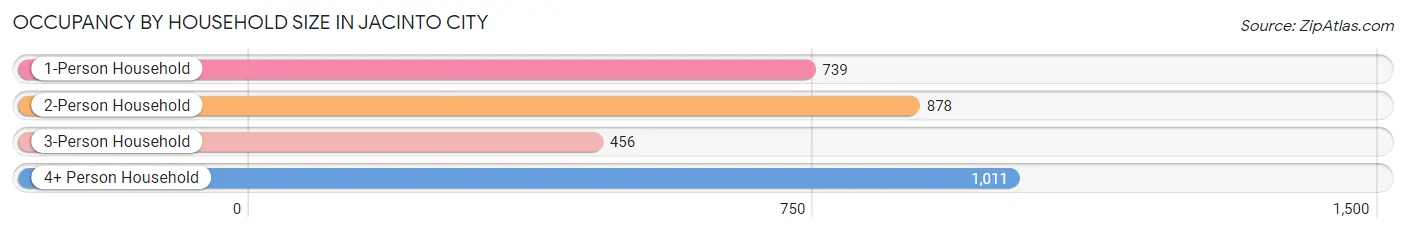
| Household Size | # Housing Units | % Housing Units |
| 1-Person Household | 739 | 24.0% |
| 2-Person Household | 878 | 28.5% |
| 3-Person Household | 456 | 14.8% |
| 4+ Person Household | 1,011 | 32.8% |
| Total Housing Units | 3,084 | 100.0% |
Occupancy by Ownership by Household Size in Jacinto City
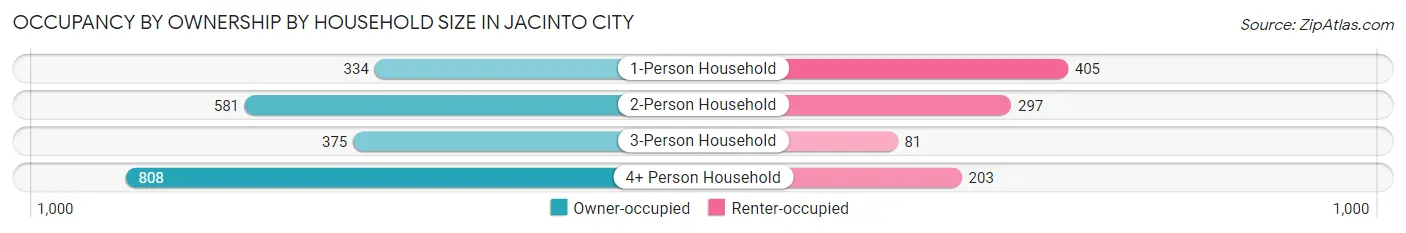
| Household Size | Owner-occupied | Renter-occupied |
| 1-Person Household | 334 (45.2%) | 405 (54.8%) |
| 2-Person Household | 581 (66.2%) | 297 (33.8%) |
| 3-Person Household | 375 (82.2%) | 81 (17.8%) |
| 4+ Person Household | 808 (79.9%) | 203 (20.1%) |
| Total Housing Units | 2,098 (68.0%) | 986 (32.0%) |
Occupancy by Educational Attainment in Jacinto City
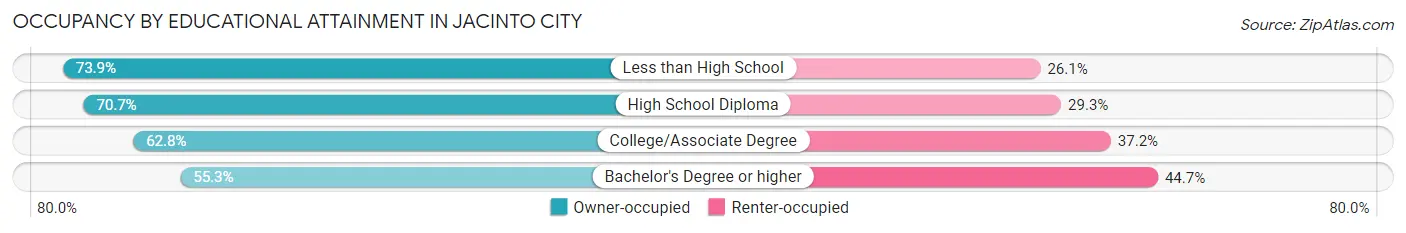
| Household Size | Owner-occupied | Renter-occupied |
| Less than High School | 851 (73.9%) | 300 (26.1%) |
| High School Diploma | 566 (70.7%) | 235 (29.3%) |
| College/Associate Degree | 462 (62.8%) | 274 (37.2%) |
| Bachelor's Degree or higher | 219 (55.3%) | 177 (44.7%) |
Occupancy by Age of Householder in Jacinto City
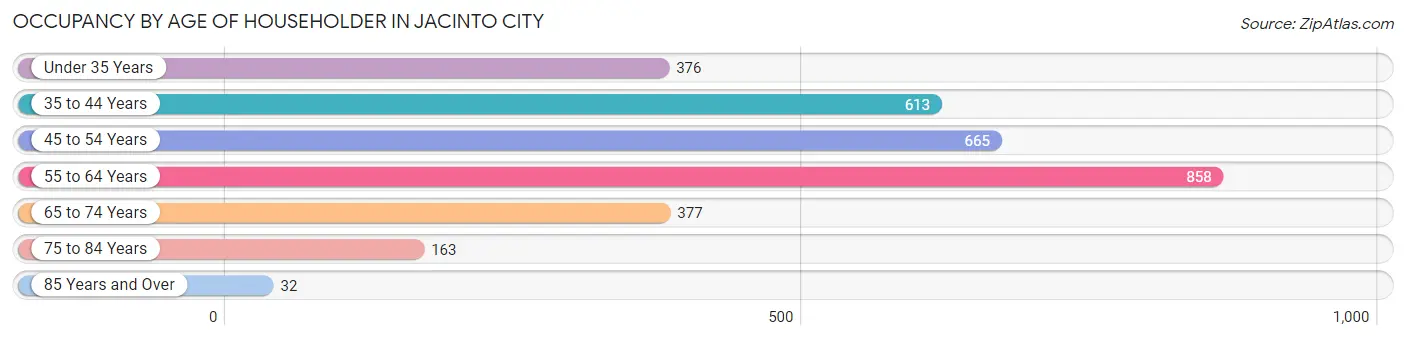
| Age Bracket | # Households | % Households |
| Under 35 Years | 376 | 12.2% |
| 35 to 44 Years | 613 | 19.9% |
| 45 to 54 Years | 665 | 21.6% |
| 55 to 64 Years | 858 | 27.8% |
| 65 to 74 Years | 377 | 12.2% |
| 75 to 84 Years | 163 | 5.3% |
| 85 Years and Over | 32 | 1.0% |
| Total | 3,084 | 100.0% |
Housing Finances in Jacinto City
Median Income by Occupancy in Jacinto City
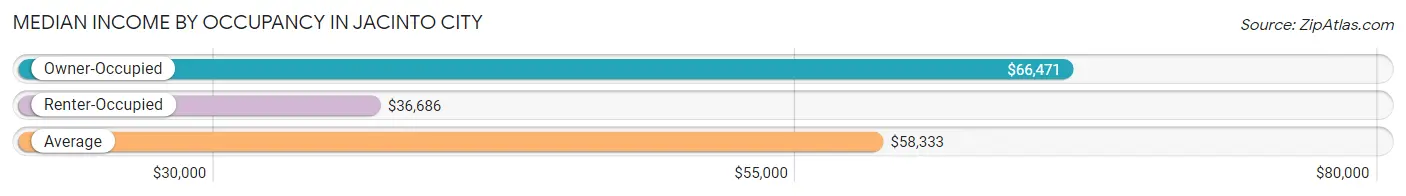
| Occupancy Type | # Households | Median Income |
| Owner-Occupied | 2,098 (68.0%) | $66,471 |
| Renter-Occupied | 986 (32.0%) | $36,686 |
| Average | 3,084 (100.0%) | $58,333 |
Occupancy by Householder Income Bracket in Jacinto City
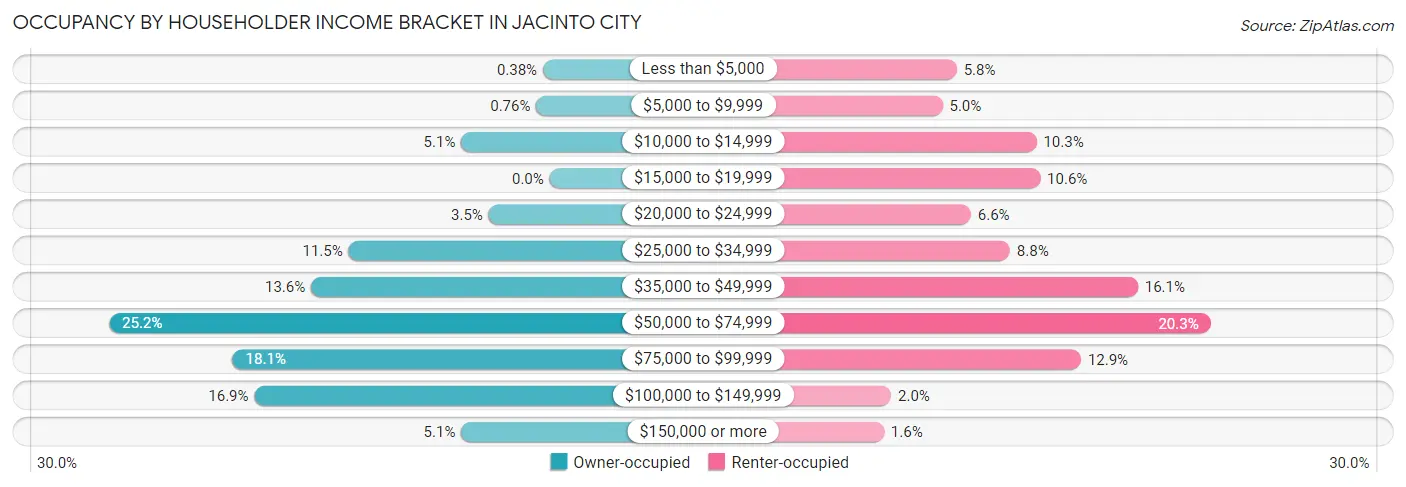
| Income Bracket | Owner-occupied | Renter-occupied |
| Less than $5,000 | 8 (0.4%) | 57 (5.8%) |
| $5,000 to $9,999 | 16 (0.8%) | 49 (5.0%) |
| $10,000 to $14,999 | 106 (5.1%) | 102 (10.3%) |
| $15,000 to $19,999 | 0 (0.0%) | 104 (10.5%) |
| $20,000 to $24,999 | 73 (3.5%) | 65 (6.6%) |
| $25,000 to $34,999 | 241 (11.5%) | 87 (8.8%) |
| $35,000 to $49,999 | 286 (13.6%) | 159 (16.1%) |
| $50,000 to $74,999 | 528 (25.2%) | 200 (20.3%) |
| $75,000 to $99,999 | 380 (18.1%) | 127 (12.9%) |
| $100,000 to $149,999 | 354 (16.9%) | 20 (2.0%) |
| $150,000 or more | 106 (5.1%) | 16 (1.6%) |
| Total | 2,098 (100.0%) | 986 (100.0%) |
Monthly Housing Cost Tiers in Jacinto City
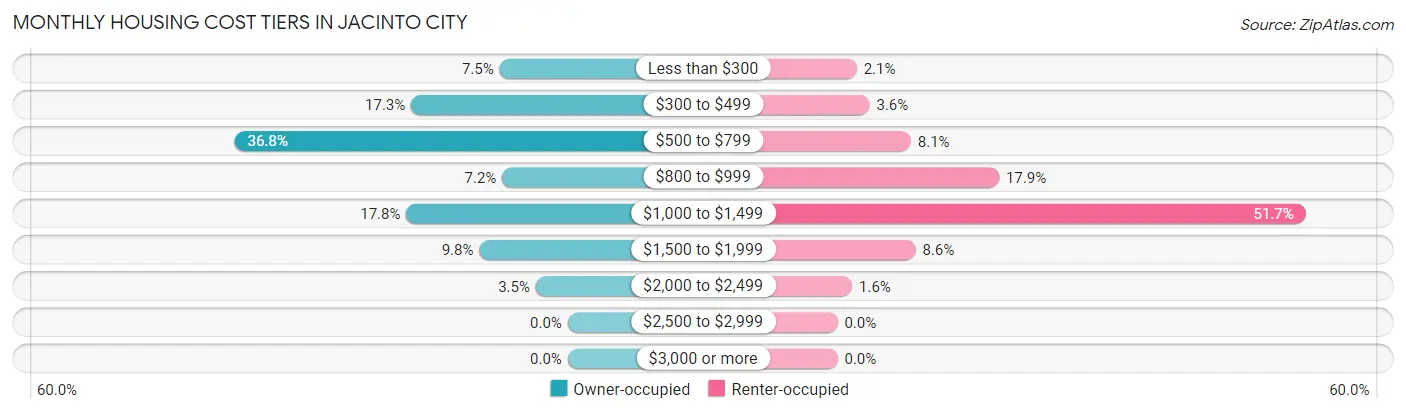
| Monthly Cost | Owner-occupied | Renter-occupied |
| Less than $300 | 158 (7.5%) | 21 (2.1%) |
| $300 to $499 | 363 (17.3%) | 35 (3.5%) |
| $500 to $799 | 772 (36.8%) | 80 (8.1%) |
| $800 to $999 | 152 (7.2%) | 176 (17.8%) |
| $1,000 to $1,499 | 374 (17.8%) | 510 (51.7%) |
| $1,500 to $1,999 | 205 (9.8%) | 85 (8.6%) |
| $2,000 to $2,499 | 74 (3.5%) | 16 (1.6%) |
| $2,500 to $2,999 | 0 (0.0%) | 0 (0.0%) |
| $3,000 or more | 0 (0.0%) | 0 (0.0%) |
| Total | 2,098 (100.0%) | 986 (100.0%) |
Physical Housing Characteristics in Jacinto City
Housing Structures in Jacinto City
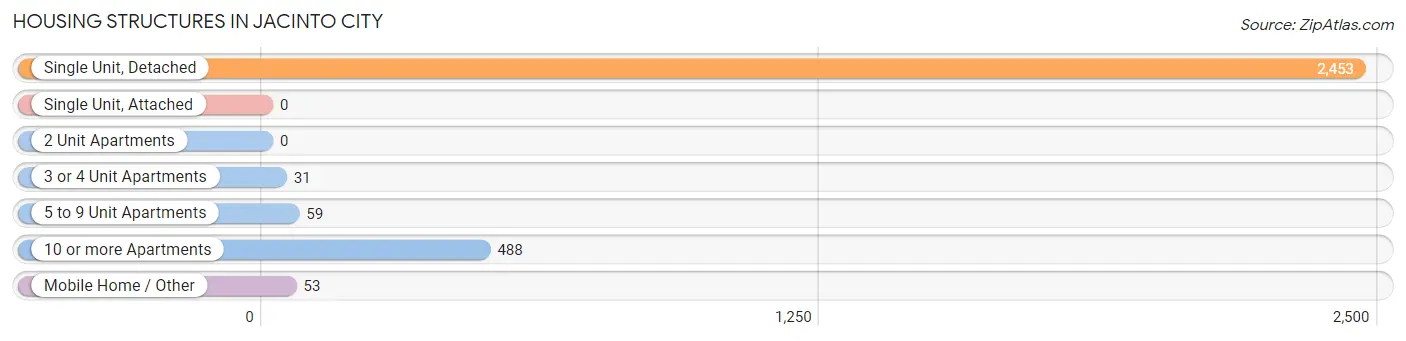
| Structure Type | # Housing Units | % Housing Units |
| Single Unit, Detached | 2,453 | 79.5% |
| Single Unit, Attached | 0 | 0.0% |
| 2 Unit Apartments | 0 | 0.0% |
| 3 or 4 Unit Apartments | 31 | 1.0% |
| 5 to 9 Unit Apartments | 59 | 1.9% |
| 10 or more Apartments | 488 | 15.8% |
| Mobile Home / Other | 53 | 1.7% |
| Total | 3,084 | 100.0% |
Housing Structures by Occupancy in Jacinto City
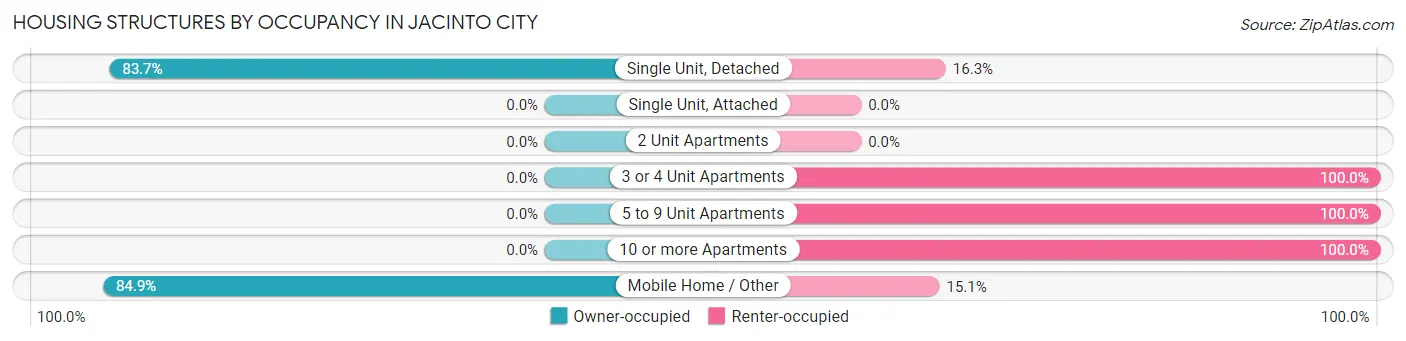
| Structure Type | Owner-occupied | Renter-occupied |
| Single Unit, Detached | 2,053 (83.7%) | 400 (16.3%) |
| Single Unit, Attached | 0 (0.0%) | 0 (0.0%) |
| 2 Unit Apartments | 0 (0.0%) | 0 (0.0%) |
| 3 or 4 Unit Apartments | 0 (0.0%) | 31 (100.0%) |
| 5 to 9 Unit Apartments | 0 (0.0%) | 59 (100.0%) |
| 10 or more Apartments | 0 (0.0%) | 488 (100.0%) |
| Mobile Home / Other | 45 (84.9%) | 8 (15.1%) |
| Total | 2,098 (68.0%) | 986 (32.0%) |
Housing Structures by Number of Rooms in Jacinto City
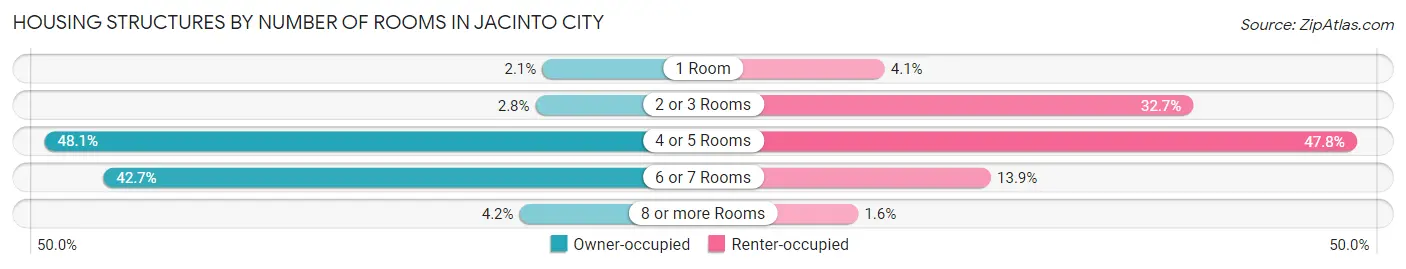
| Number of Rooms | Owner-occupied | Renter-occupied |
| 1 Room | 45 (2.1%) | 40 (4.1%) |
| 2 or 3 Rooms | 58 (2.8%) | 322 (32.7%) |
| 4 or 5 Rooms | 1,010 (48.1%) | 471 (47.8%) |
| 6 or 7 Rooms | 896 (42.7%) | 137 (13.9%) |
| 8 or more Rooms | 89 (4.2%) | 16 (1.6%) |
| Total | 2,098 (100.0%) | 986 (100.0%) |
Housing Structure by Heating Type in Jacinto City
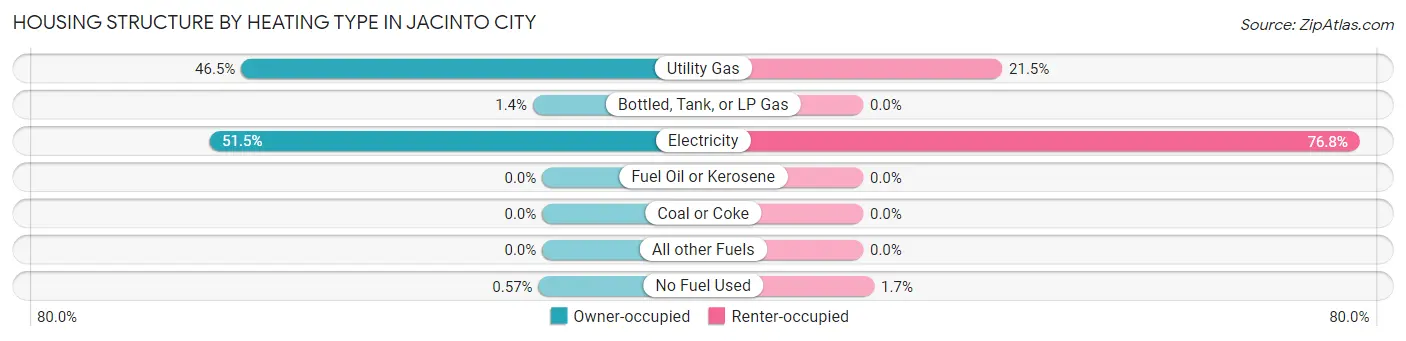
| Heating Type | Owner-occupied | Renter-occupied |
| Utility Gas | 976 (46.5%) | 212 (21.5%) |
| Bottled, Tank, or LP Gas | 30 (1.4%) | 0 (0.0%) |
| Electricity | 1,080 (51.5%) | 757 (76.8%) |
| Fuel Oil or Kerosene | 0 (0.0%) | 0 (0.0%) |
| Coal or Coke | 0 (0.0%) | 0 (0.0%) |
| All other Fuels | 0 (0.0%) | 0 (0.0%) |
| No Fuel Used | 12 (0.6%) | 17 (1.7%) |
| Total | 2,098 (100.0%) | 986 (100.0%) |
Household Vehicle Usage in Jacinto City
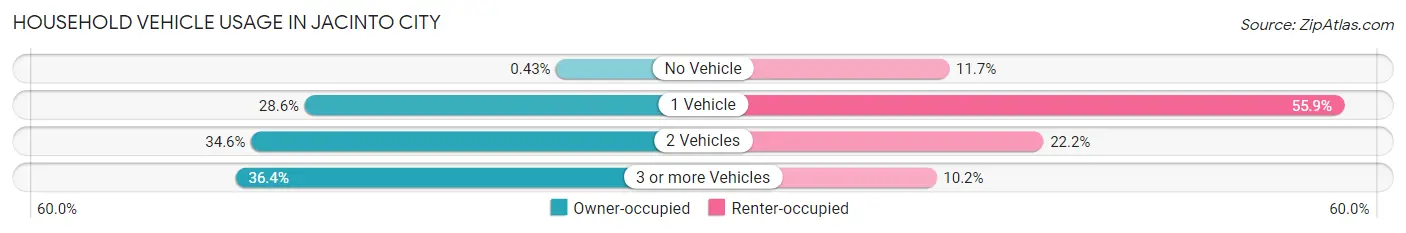
| Vehicles per Household | Owner-occupied | Renter-occupied |
| No Vehicle | 9 (0.4%) | 115 (11.7%) |
| 1 Vehicle | 600 (28.6%) | 551 (55.9%) |
| 2 Vehicles | 726 (34.6%) | 219 (22.2%) |
| 3 or more Vehicles | 763 (36.4%) | 101 (10.2%) |
| Total | 2,098 (100.0%) | 986 (100.0%) |
Real Estate & Mortgages in Jacinto City
Real Estate and Mortgage Overview in Jacinto City
| Characteristic | Without Mortgage | With Mortgage |
| Housing Units | 1,430 | 668 |
| Median Property Value | $119,800 | $120,700 |
| Median Household Income | $61,938 | $103 |
| Monthly Housing Costs | $585 | $0 |
| Real Estate Taxes | $2,195 | $11 |
Property Value by Mortgage Status in Jacinto City
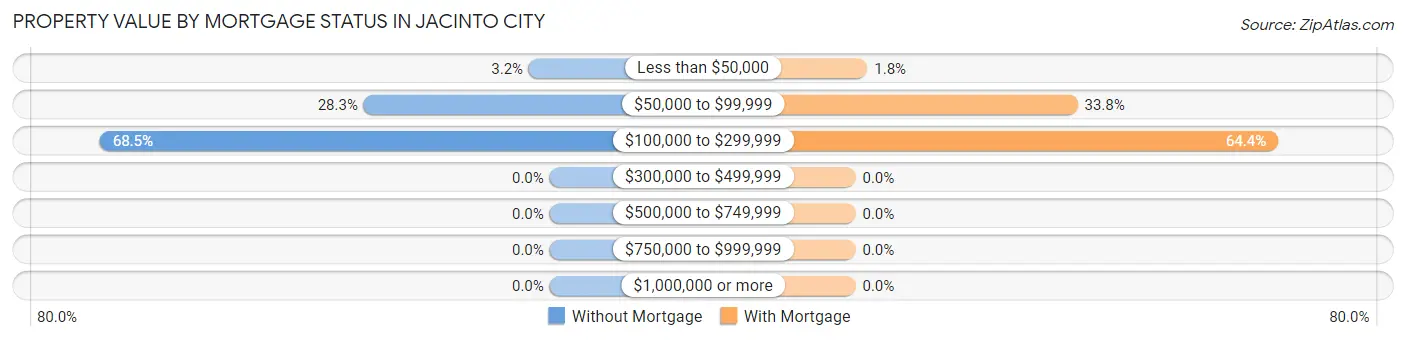
| Property Value | Without Mortgage | With Mortgage |
| Less than $50,000 | 45 (3.2%) | 12 (1.8%) |
| $50,000 to $99,999 | 405 (28.3%) | 226 (33.8%) |
| $100,000 to $299,999 | 980 (68.5%) | 430 (64.4%) |
| $300,000 to $499,999 | 0 (0.0%) | 0 (0.0%) |
| $500,000 to $749,999 | 0 (0.0%) | 0 (0.0%) |
| $750,000 to $999,999 | 0 (0.0%) | 0 (0.0%) |
| $1,000,000 or more | 0 (0.0%) | 0 (0.0%) |
| Total | 1,430 (100.0%) | 668 (100.0%) |
Household Income by Mortgage Status in Jacinto City
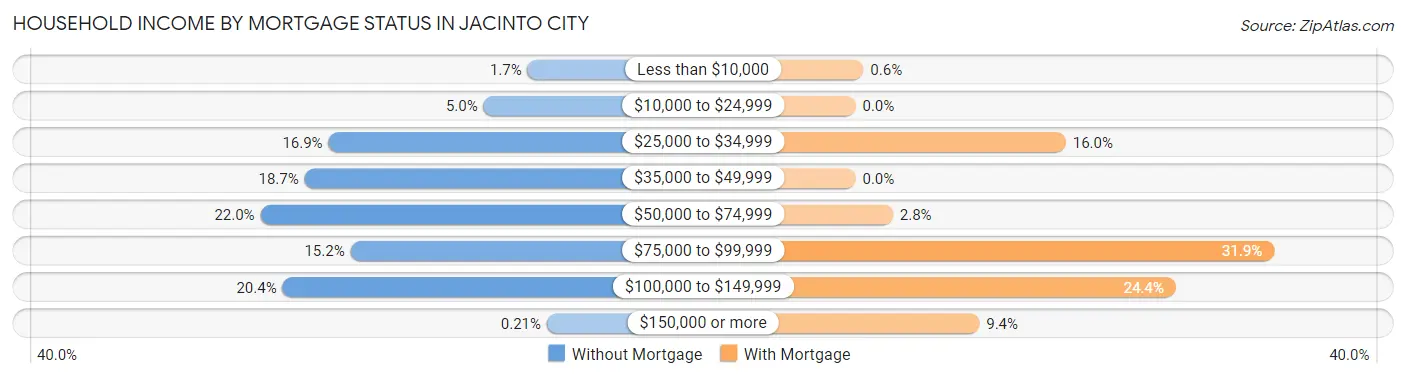
| Household Income | Without Mortgage | With Mortgage |
| Less than $10,000 | 24 (1.7%) | 4 (0.6%) |
| $10,000 to $24,999 | 72 (5.0%) | 0 (0.0%) |
| $25,000 to $34,999 | 241 (16.9%) | 107 (16.0%) |
| $35,000 to $49,999 | 267 (18.7%) | 0 (0.0%) |
| $50,000 to $74,999 | 315 (22.0%) | 19 (2.8%) |
| $75,000 to $99,999 | 217 (15.2%) | 213 (31.9%) |
| $100,000 to $149,999 | 291 (20.3%) | 163 (24.4%) |
| $150,000 or more | 3 (0.2%) | 63 (9.4%) |
| Total | 1,430 (100.0%) | 668 (100.0%) |
Property Value to Household Income Ratio in Jacinto City
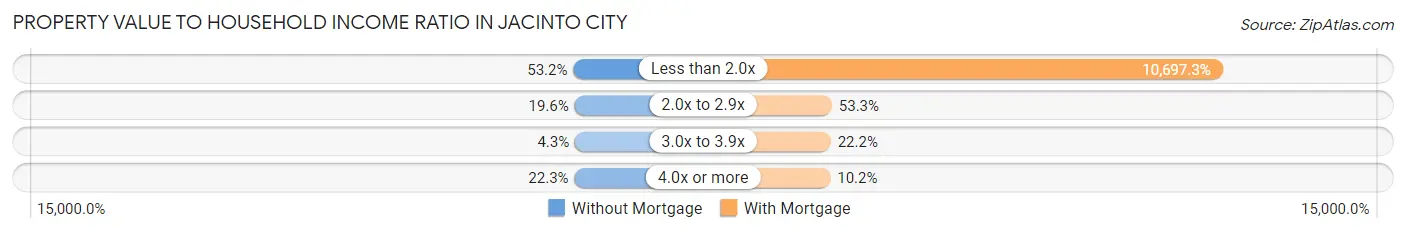
| Value-to-Income Ratio | Without Mortgage | With Mortgage |
| Less than 2.0x | 761 (53.2%) | 71,458 (10,697.3%) |
| 2.0x to 2.9x | 280 (19.6%) | 356 (53.3%) |
| 3.0x to 3.9x | 62 (4.3%) | 148 (22.2%) |
| 4.0x or more | 319 (22.3%) | 68 (10.2%) |
| Total | 1,430 (100.0%) | 668 (100.0%) |
Real Estate Taxes by Mortgage Status in Jacinto City
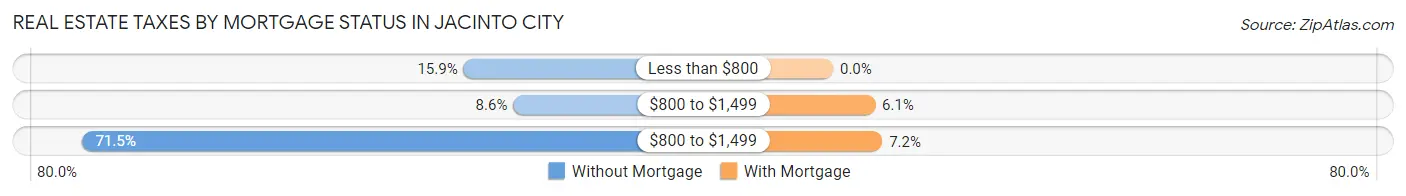
| Property Taxes | Without Mortgage | With Mortgage |
| Less than $800 | 227 (15.9%) | 0 (0.0%) |
| $800 to $1,499 | 123 (8.6%) | 41 (6.1%) |
| $800 to $1,499 | 1,023 (71.5%) | 48 (7.2%) |
| Total | 1,430 (100.0%) | 668 (100.0%) |
Health & Disability in Jacinto City
Health Insurance Coverage by Age in Jacinto City
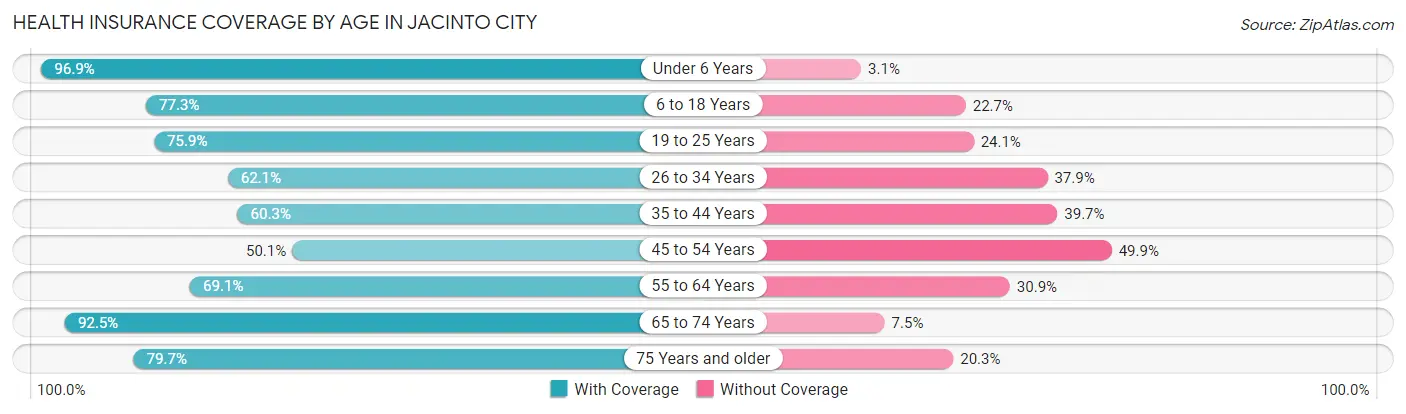
| Age Bracket | With Coverage | Without Coverage |
| Under 6 Years | 648 (96.9%) | 21 (3.1%) |
| 6 to 18 Years | 1,348 (77.3%) | 395 (22.7%) |
| 19 to 25 Years | 761 (75.9%) | 242 (24.1%) |
| 26 to 34 Years | 577 (62.1%) | 352 (37.9%) |
| 35 to 44 Years | 716 (60.3%) | 472 (39.7%) |
| 45 to 54 Years | 755 (50.1%) | 751 (49.9%) |
| 55 to 64 Years | 882 (69.1%) | 394 (30.9%) |
| 65 to 74 Years | 626 (92.5%) | 51 (7.5%) |
| 75 Years and older | 404 (79.7%) | 103 (20.3%) |
| Total | 6,717 (70.7%) | 2,781 (29.3%) |
Health Insurance Coverage by Citizenship Status in Jacinto City
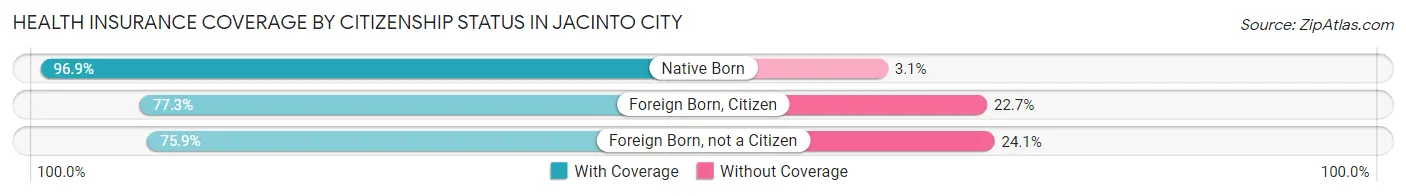
| Citizenship Status | With Coverage | Without Coverage |
| Native Born | 648 (96.9%) | 21 (3.1%) |
| Foreign Born, Citizen | 1,348 (77.3%) | 395 (22.7%) |
| Foreign Born, not a Citizen | 761 (75.9%) | 242 (24.1%) |
Health Insurance Coverage by Household Income in Jacinto City
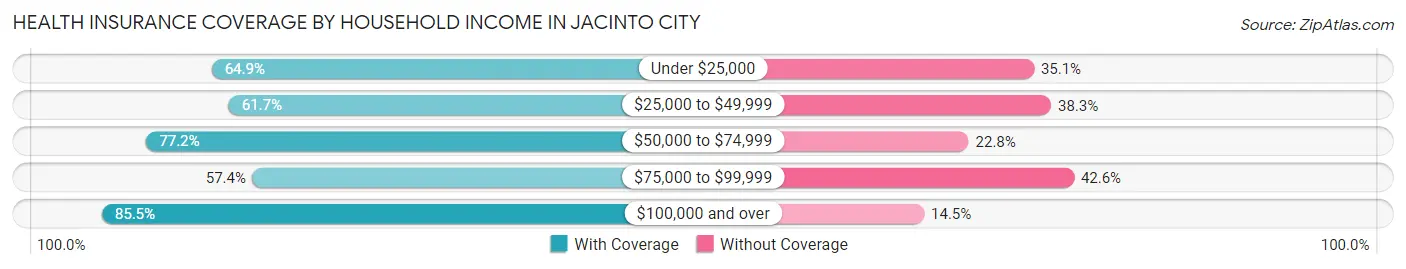
| Household Income | With Coverage | Without Coverage |
| Under $25,000 | 841 (64.9%) | 454 (35.1%) |
| $25,000 to $49,999 | 955 (61.7%) | 592 (38.3%) |
| $50,000 to $74,999 | 1,897 (77.2%) | 561 (22.8%) |
| $75,000 to $99,999 | 1,158 (57.4%) | 858 (42.6%) |
| $100,000 and over | 1,866 (85.5%) | 316 (14.5%) |
Public vs Private Health Insurance Coverage by Age in Jacinto City
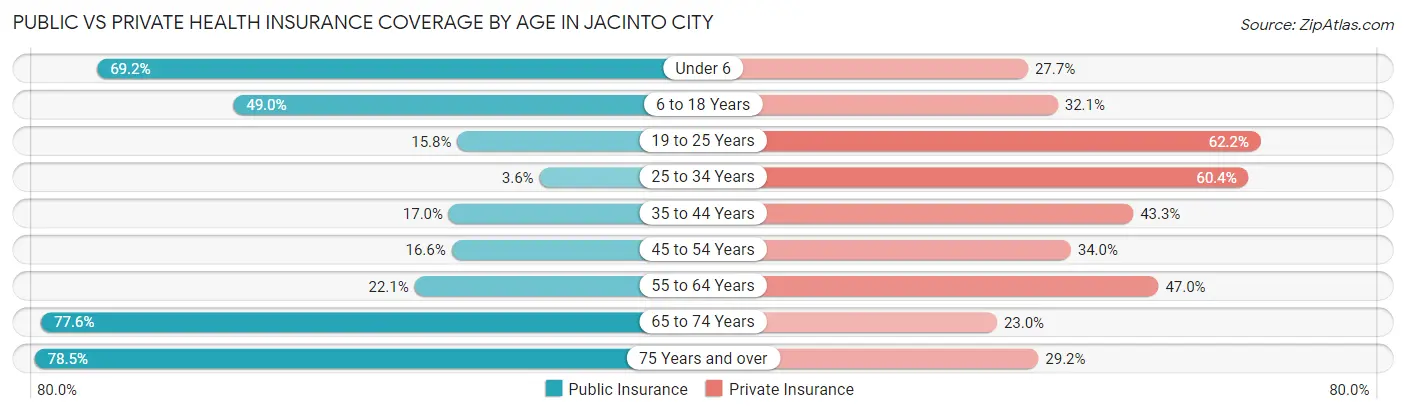
| Age Bracket | Public Insurance | Private Insurance |
| Under 6 | 463 (69.2%) | 185 (27.7%) |
| 6 to 18 Years | 854 (49.0%) | 559 (32.1%) |
| 19 to 25 Years | 158 (15.8%) | 624 (62.2%) |
| 25 to 34 Years | 33 (3.5%) | 561 (60.4%) |
| 35 to 44 Years | 202 (17.0%) | 514 (43.3%) |
| 45 to 54 Years | 250 (16.6%) | 512 (34.0%) |
| 55 to 64 Years | 282 (22.1%) | 600 (47.0%) |
| 65 to 74 Years | 525 (77.5%) | 156 (23.0%) |
| 75 Years and over | 398 (78.5%) | 148 (29.2%) |
| Total | 3,165 (33.3%) | 3,859 (40.6%) |
Disability Status by Sex by Age in Jacinto City
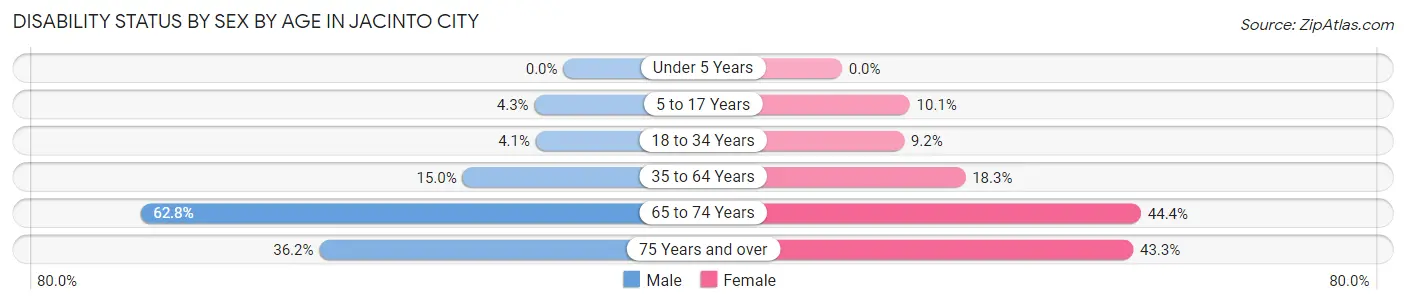
| Age Bracket | Male | Female |
| Under 5 Years | 0 (0.0%) | 0 (0.0%) |
| 5 to 17 Years | 45 (4.3%) | 78 (10.1%) |
| 18 to 34 Years | 46 (4.1%) | 76 (9.2%) |
| 35 to 64 Years | 288 (15.0%) | 375 (18.3%) |
| 65 to 74 Years | 223 (62.8%) | 143 (44.4%) |
| 75 Years and over | 79 (36.2%) | 125 (43.2%) |
Disability Class by Sex by Age in Jacinto City
Disability Class: Hearing Difficulty
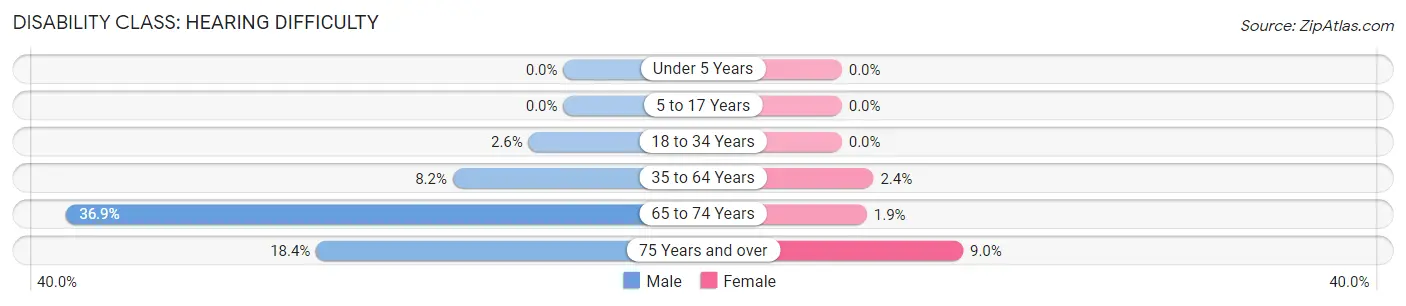
| Age Bracket | Male | Female |
| Under 5 Years | 0 (0.0%) | 0 (0.0%) |
| 5 to 17 Years | 0 (0.0%) | 0 (0.0%) |
| 18 to 34 Years | 29 (2.6%) | 0 (0.0%) |
| 35 to 64 Years | 158 (8.2%) | 48 (2.4%) |
| 65 to 74 Years | 131 (36.9%) | 6 (1.9%) |
| 75 Years and over | 40 (18.3%) | 26 (9.0%) |
Disability Class: Vision Difficulty
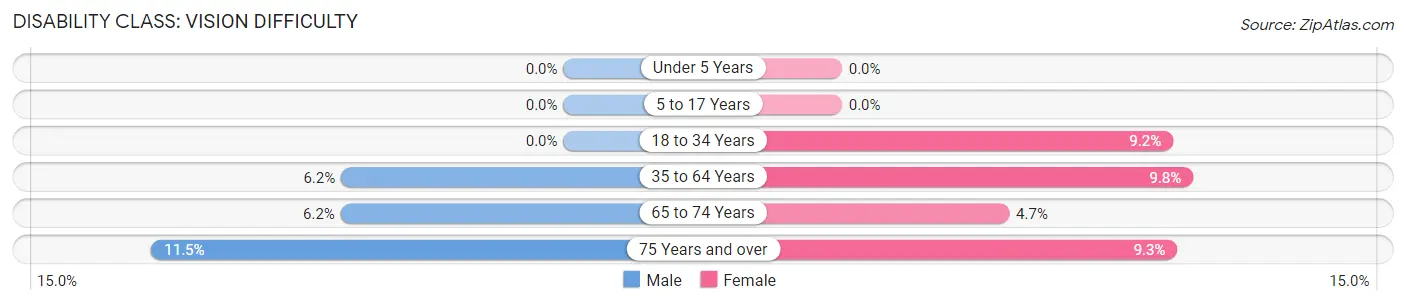
| Age Bracket | Male | Female |
| Under 5 Years | 0 (0.0%) | 0 (0.0%) |
| 5 to 17 Years | 0 (0.0%) | 0 (0.0%) |
| 18 to 34 Years | 0 (0.0%) | 76 (9.2%) |
| 35 to 64 Years | 119 (6.2%) | 200 (9.8%) |
| 65 to 74 Years | 22 (6.2%) | 15 (4.7%) |
| 75 Years and over | 25 (11.5%) | 27 (9.3%) |
Disability Class: Cognitive Difficulty
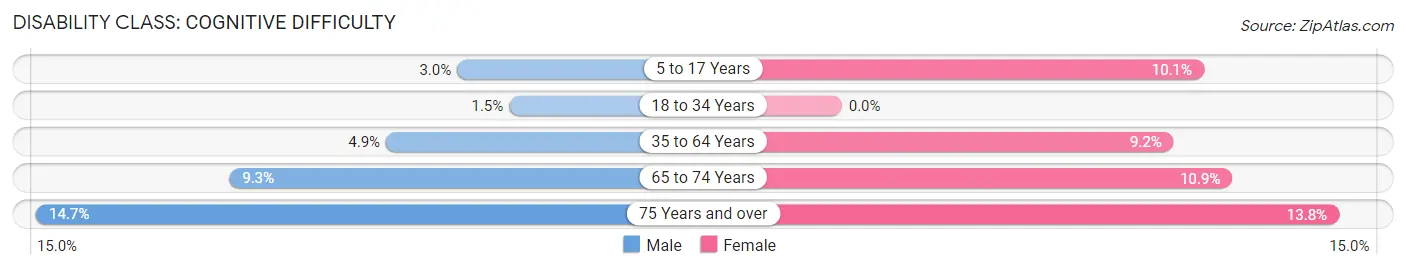
| Age Bracket | Male | Female |
| 5 to 17 Years | 31 (3.0%) | 78 (10.1%) |
| 18 to 34 Years | 17 (1.5%) | 0 (0.0%) |
| 35 to 64 Years | 95 (4.9%) | 189 (9.2%) |
| 65 to 74 Years | 33 (9.3%) | 35 (10.9%) |
| 75 Years and over | 32 (14.7%) | 40 (13.8%) |
Disability Class: Ambulatory Difficulty
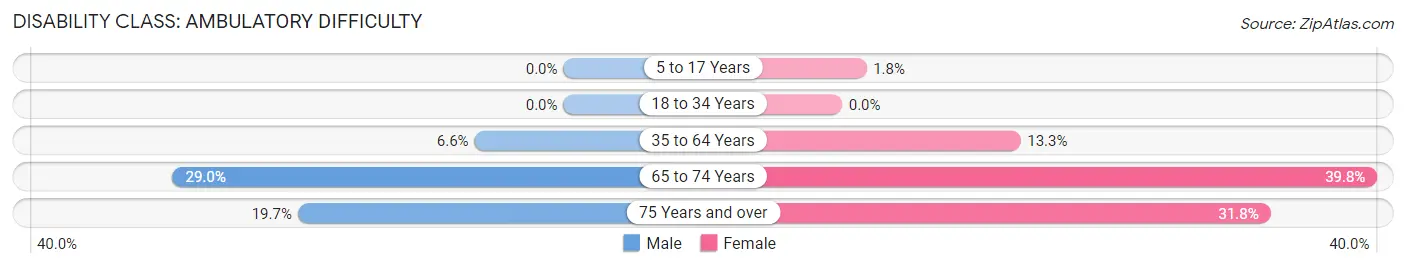
| Age Bracket | Male | Female |
| 5 to 17 Years | 0 (0.0%) | 14 (1.8%) |
| 18 to 34 Years | 0 (0.0%) | 0 (0.0%) |
| 35 to 64 Years | 127 (6.6%) | 271 (13.3%) |
| 65 to 74 Years | 103 (29.0%) | 128 (39.8%) |
| 75 Years and over | 43 (19.7%) | 92 (31.8%) |
Disability Class: Self-Care Difficulty
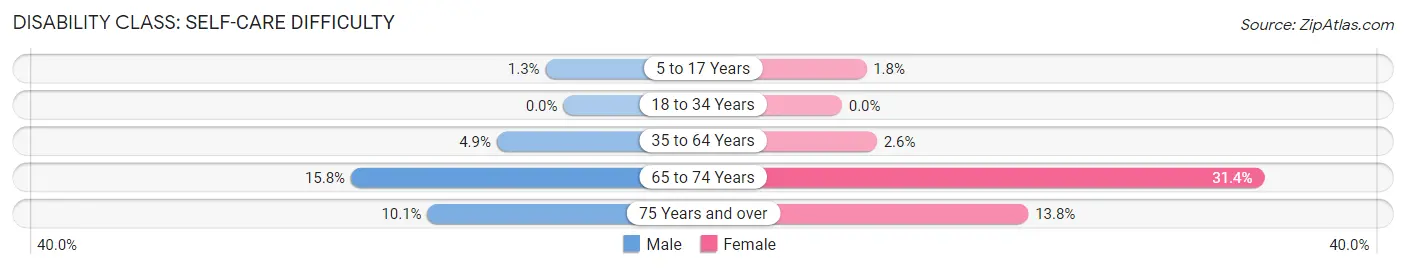
| Age Bracket | Male | Female |
| 5 to 17 Years | 14 (1.3%) | 14 (1.8%) |
| 18 to 34 Years | 0 (0.0%) | 0 (0.0%) |
| 35 to 64 Years | 95 (4.9%) | 53 (2.6%) |
| 65 to 74 Years | 56 (15.8%) | 101 (31.4%) |
| 75 Years and over | 22 (10.1%) | 40 (13.8%) |
Technology Access in Jacinto City
Computing Device Access in Jacinto City
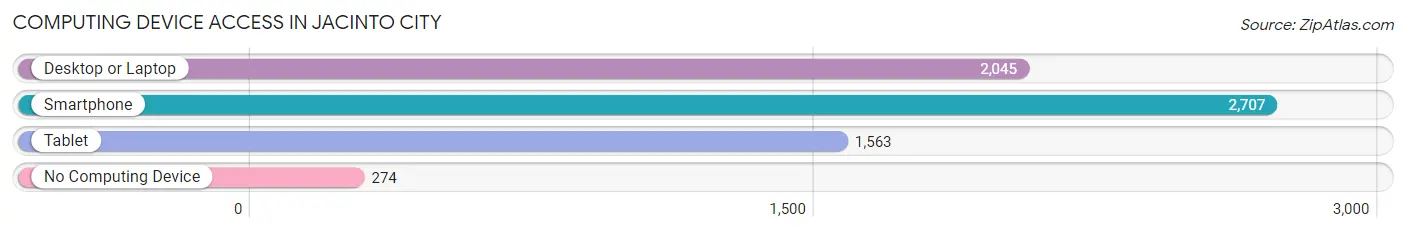
| Device Type | # Households | % Households |
| Desktop or Laptop | 2,045 | 66.3% |
| Smartphone | 2,707 | 87.8% |
| Tablet | 1,563 | 50.7% |
| No Computing Device | 274 | 8.9% |
| Total | 3,084 | 100.0% |
Internet Access in Jacinto City
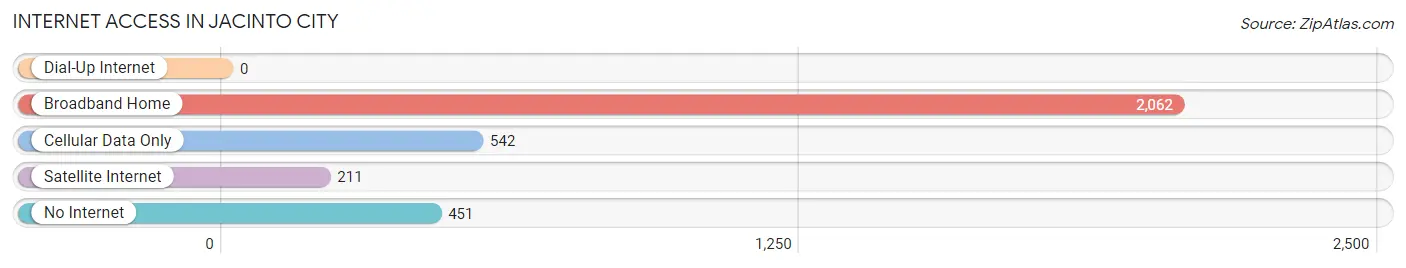
| Internet Type | # Households | % Households |
| Dial-Up Internet | 0 | 0.0% |
| Broadband Home | 2,062 | 66.9% |
| Cellular Data Only | 542 | 17.6% |
| Satellite Internet | 211 | 6.8% |
| No Internet | 451 | 14.6% |
| Total | 3,084 | 100.0% |
Jacinto City Summary
Jacinto City is a city located in Harris County, Texas, United States. It is a suburb of Houston and is part of the Houston–The Woodlands–Sugar Land metropolitan area. The population was 10,302 at the 2010 census.
History
Jacinto City was founded in the early 1940s by the Jacinto City Development Company. The company was formed by a group of investors who wanted to develop a new town on the outskirts of Houston. The town was named after the Battle of San Jacinto, which was fought in 1836 and resulted in the independence of Texas from Mexico.
The first homes in Jacinto City were built in 1941 and the town was officially incorporated in 1945. The town grew rapidly in the 1950s and 1960s, and by the 1970s it had become a thriving community.
Geography
Jacinto City is located at 29°45'25" North, 95°14'45" West (29.756944, -95.245833). It is bordered by Houston to the north, Galena Park to the east, and Sheldon to the south.
The city has a total area of 4 2 square miles all of which is land
Economy
Jacinto City is home to a variety of businesses, including manufacturing, retail, and service industries. The city is also home to several large industrial parks, including the Jacinto City Industrial Park, which is home to several major companies, including ExxonMobil, Chevron, and Shell.
The city is also home to several small businesses, including restaurants, grocery stores, and other retail establishments.
Demographics
As of the 2010 census, there were 10,302 people, 3,717 households, and 2,717 families residing in the city. The population density was 2,450.3 people per square mile. The racial makeup of the city was 63.2% White, 16.2% African American, 0.7% Native American, 0.7% Asian, 0.1% Pacific Islander, 16.2% from other races, and 3.0% from two or more races. Hispanic or Latino of any race were 44.2% of the population.
The median income for a household in the city was $35,945, and the median income for a family was $41,945. Males had a median income of $30,945 versus $25,945 for females. The per capita income for the city was $15,945. About 16.2% of families and 19.2% of the population were below the poverty line, including 25.2% of those under age 18 and 14.2% of those age 65 or over.
Jacinto City is served by the Galena Park Independent School District. The city is also home to several private schools, including St. Mary's Catholic School and Jacinto City Christian Academy.
Common Questions
What is Per Capita Income in Jacinto City?
Per Capita income in Jacinto City is $21,521.
What is the Median Family Income in Jacinto City?
Median Family Income in Jacinto City is $68,029.
What is the Median Household income in Jacinto City?
Median Household Income in Jacinto City is $58,333.
What is Income or Wage Gap in Jacinto City?
Income or Wage Gap in Jacinto City is 29.7%.
Women in Jacinto City earn 70.3 cents for every dollar earned by a man.
What is Family Income Deficit in Jacinto City?
Family Income Deficit in Jacinto City is $12,729.
Families that are below poverty line in Jacinto City earn $12,729 less on average than the poverty threshold level.
What is Inequality or Gini Index in Jacinto City?
Inequality or Gini Index in Jacinto City is 0.37.
What is the Total Population of Jacinto City?
Total Population of Jacinto City is 9,589.
What is the Total Male Population of Jacinto City?
Total Male Population of Jacinto City is 5,042.
What is the Total Female Population of Jacinto City?
Total Female Population of Jacinto City is 4,547.
What is the Ratio of Males per 100 Females in Jacinto City?
There are 110.89 Males per 100 Females in Jacinto City.
What is the Ratio of Females per 100 Males in Jacinto City?
There are 90.18 Females per 100 Males in Jacinto City.
What is the Median Population Age in Jacinto City?
Median Population Age in Jacinto City is 38.9 Years.
What is the Average Family Size in Jacinto City
Average Family Size in Jacinto City is 3.7 People.
What is the Average Household Size in Jacinto City
Average Household Size in Jacinto City is 3.1 People.
How Large is the Labor Force in Jacinto City?
There are 4,627 People in the Labor Forcein in Jacinto City.
What is the Percentage of People in the Labor Force in Jacinto City?
61.7% of People are in the Labor Force in Jacinto City.
What is the Unemployment Rate in Jacinto City?
Unemployment Rate in Jacinto City is 5.6%.