Alvin, TX Map & Demographics
Alvin Map
Alvin Overview
$29,540
PER CAPITA INCOME
$81,890
AVG FAMILY INCOME
$68,266
AVG HOUSEHOLD INCOME
30.8%
WAGE / INCOME GAP [ % ]
69.2¢/ $1
WAGE / INCOME GAP [ $ ]
$10,594
FAMILY INCOME DEFICIT
0.39
INEQUALITY / GINI INDEX
27,325
TOTAL POPULATION
13,122
MALE POPULATION
14,203
FEMALE POPULATION
92.39
MALES / 100 FEMALES
108.24
FEMALES / 100 MALES
33.7
MEDIAN AGE
3.3
AVG FAMILY SIZE
2.6
AVG HOUSEHOLD SIZE
13,711
LABOR FORCE [ PEOPLE ]
66.1%
PERCENT IN LABOR FORCE
3.0%
UNEMPLOYMENT RATE
Alvin Zip Codes
Income in Alvin
Income Overview in Alvin
Per Capita Income in Alvin is $29,540, while median incomes of families and households are $81,890 and $68,266 respectively.
| Characteristic | Number | Measure |
| Per Capita Income | 27,325 | $29,540 |
| Median Family Income | 6,852 | $81,890 |
| Mean Family Income | 6,852 | $90,924 |
| Median Household Income | 10,294 | $68,266 |
| Mean Household Income | 10,294 | $77,938 |
| Income Deficit | 6,852 | $10,594 |
| Wage / Income Gap (%) | 27,325 | 30.76% |
| Wage / Income Gap ($) | 27,325 | 69.24¢ per $1 |
| Gini / Inequality Index | 27,325 | 0.39 |
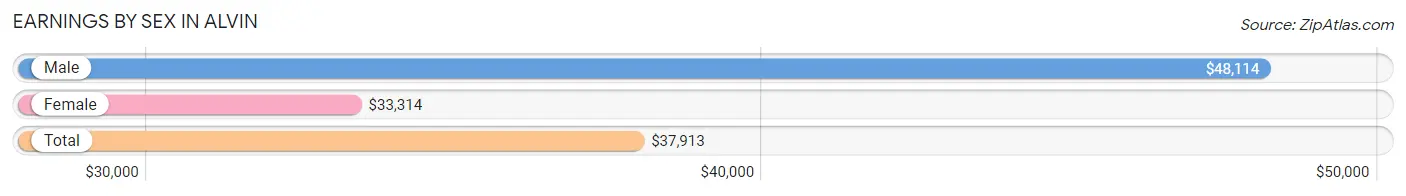
Earnings by Sex in Alvin
Average Earnings in Alvin are $37,913, $48,114 for men and $33,314 for women, a difference of 30.8%.
| Sex | Number | Average Earnings |
| Male | 6,781 (48.3%) | $48,114 |
| Female | 7,262 (51.7%) | $33,314 |
| Total | 14,043 (100.0%) | $37,913 |
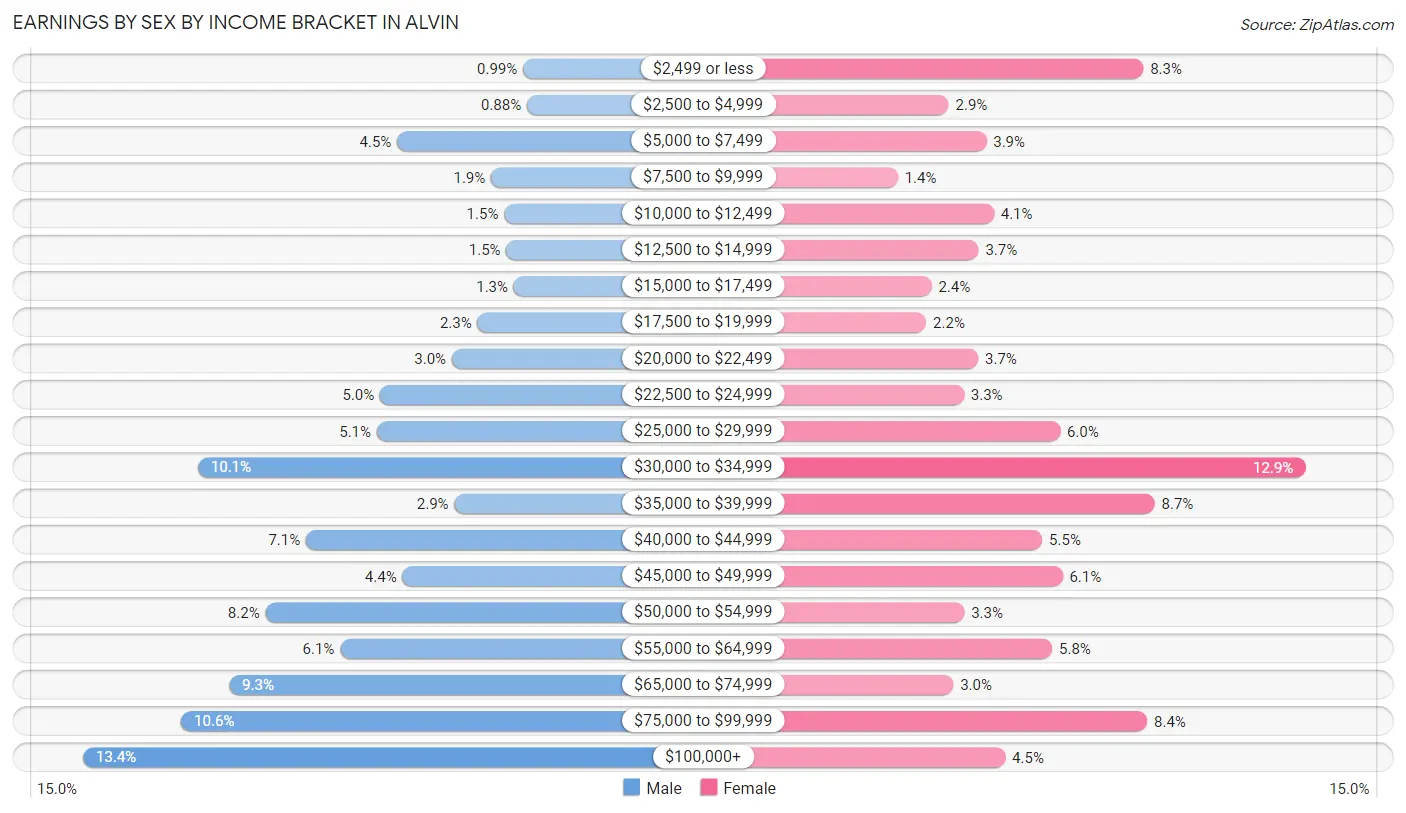
Earnings by Sex by Income Bracket in Alvin
The most common earnings brackets in Alvin are $100,000+ for men (906 | 13.4%) and $30,000 to $34,999 for women (935 | 12.9%).
| Income | Male | Female |
| $2,499 or less | 67 (1.0%) | 605 (8.3%) |
| $2,500 to $4,999 | 60 (0.9%) | 208 (2.9%) |
| $5,000 to $7,499 | 307 (4.5%) | 285 (3.9%) |
| $7,500 to $9,999 | 128 (1.9%) | 104 (1.4%) |
| $10,000 to $12,499 | 103 (1.5%) | 300 (4.1%) |
| $12,500 to $14,999 | 99 (1.5%) | 269 (3.7%) |
| $15,000 to $17,499 | 85 (1.3%) | 173 (2.4%) |
| $17,500 to $19,999 | 154 (2.3%) | 162 (2.2%) |
| $20,000 to $22,499 | 203 (3.0%) | 268 (3.7%) |
| $22,500 to $24,999 | 340 (5.0%) | 239 (3.3%) |
| $25,000 to $29,999 | 346 (5.1%) | 435 (6.0%) |
| $30,000 to $34,999 | 687 (10.1%) | 935 (12.9%) |
| $35,000 to $39,999 | 198 (2.9%) | 628 (8.6%) |
| $40,000 to $44,999 | 481 (7.1%) | 399 (5.5%) |
| $45,000 to $49,999 | 297 (4.4%) | 440 (6.1%) |
| $50,000 to $54,999 | 558 (8.2%) | 240 (3.3%) |
| $55,000 to $64,999 | 416 (6.1%) | 419 (5.8%) |
| $65,000 to $74,999 | 627 (9.2%) | 217 (3.0%) |
| $75,000 to $99,999 | 719 (10.6%) | 613 (8.4%) |
| $100,000+ | 906 (13.4%) | 323 (4.4%) |
| Total | 6,781 (100.0%) | 7,262 (100.0%) |
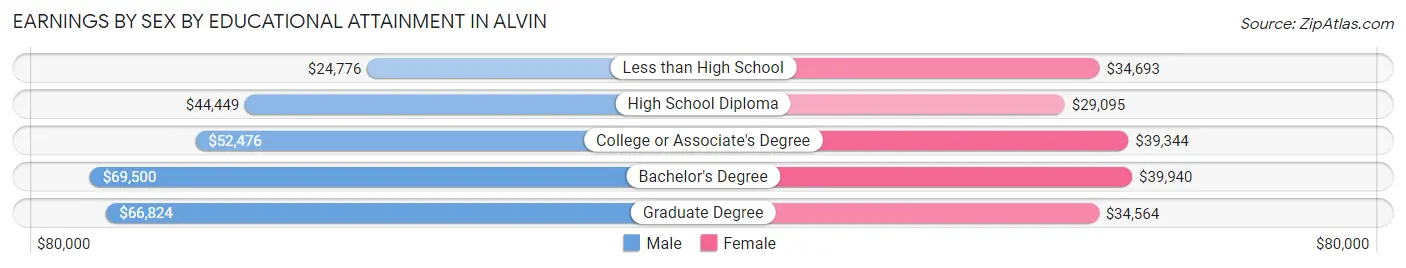
Earnings by Sex by Educational Attainment in Alvin
Average earnings in Alvin are $50,998 for men and $36,445 for women, a difference of 28.5%. Men with an educational attainment of bachelor's degree enjoy the highest average annual earnings of $69,500, while those with less than high school education earn the least with $24,776. Women with an educational attainment of bachelor's degree earn the most with the average annual earnings of $39,940, while those with high school diploma education have the smallest earnings of $29,095.
| Educational Attainment | Male Income | Female Income |
| Less than High School | $24,776 | $34,693 |
| High School Diploma | $44,449 | $29,095 |
| College or Associate's Degree | $52,476 | $39,344 |
| Bachelor's Degree | $69,500 | $39,940 |
| Graduate Degree | $66,824 | $34,564 |
| Total | $50,998 | $36,445 |
Family Income in Alvin
Family Income Brackets in Alvin
According to the Alvin family income data, there are 1,384 families falling into the $75,000 to $99,999 income range, which is the most common income bracket and makes up 20.2% of all families. Conversely, the $10,000 to $14,999 income bracket is the least frequent group with only 14 families (0.2%) belonging to this category.
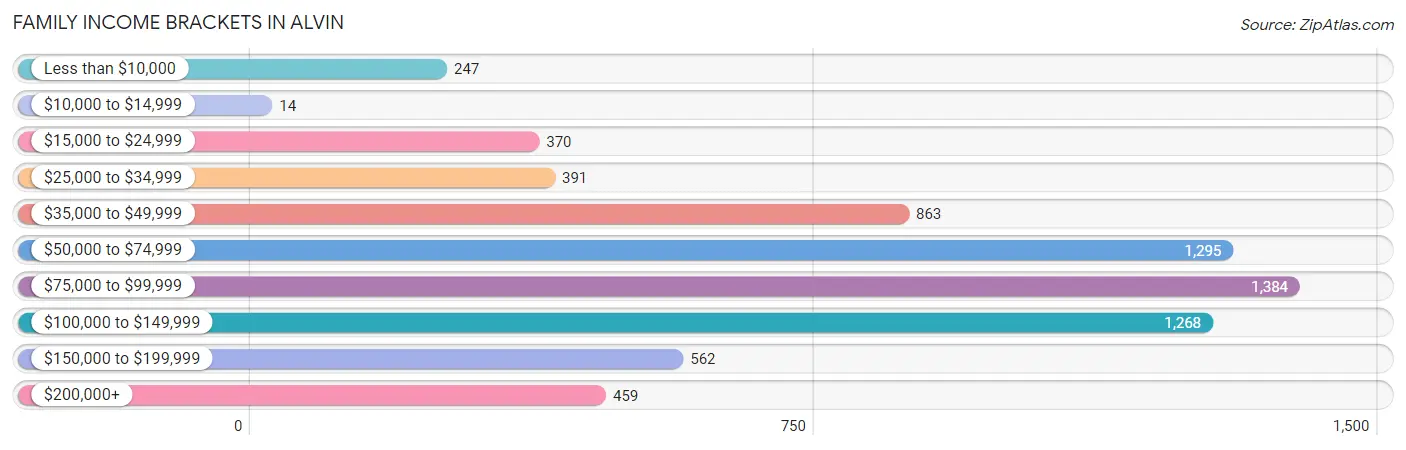
| Income Bracket | # Families | % Families |
| Less than $10,000 | 247 | 3.6% |
| $10,000 to $14,999 | 14 | 0.2% |
| $15,000 to $24,999 | 370 | 5.4% |
| $25,000 to $34,999 | 391 | 5.7% |
| $35,000 to $49,999 | 863 | 12.6% |
| $50,000 to $74,999 | 1,295 | 18.9% |
| $75,000 to $99,999 | 1,384 | 20.2% |
| $100,000 to $149,999 | 1,268 | 18.5% |
| $150,000 to $199,999 | 562 | 8.2% |
| $200,000+ | 459 | 6.7% |
Family Income by Famaliy Size in Alvin
6-person families (341 | 5.0%) account for the highest median family income in Alvin with $141,488 per family, while 2-person families (2,542 | 37.1%) have the highest median income of $33,229 per family member.
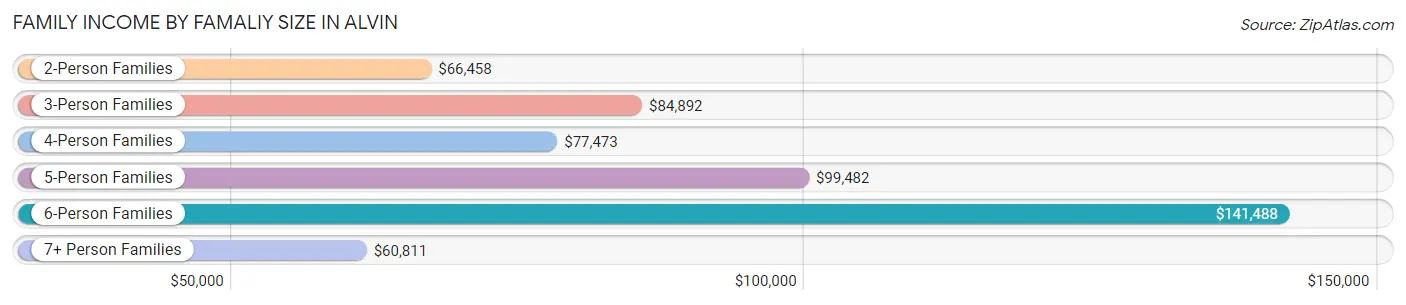
| Income Bracket | # Families | Median Income |
| 2-Person Families | 2,542 (37.1%) | $66,458 |
| 3-Person Families | 1,929 (28.1%) | $84,892 |
| 4-Person Families | 1,195 (17.4%) | $77,473 |
| 5-Person Families | 781 (11.4%) | $99,482 |
| 6-Person Families | 341 (5.0%) | $141,488 |
| 7+ Person Families | 64 (0.9%) | $60,811 |
| Total | 6,852 (100.0%) | $81,890 |
Family Income by Number of Earners in Alvin
The median family income in Alvin is $81,890, with families comprising 3+ earners (958) having the highest median family income of $109,000, while families with no earners (835) have the lowest median family income of $41,954, accounting for 14.0% and 12.2% of families, respectively.
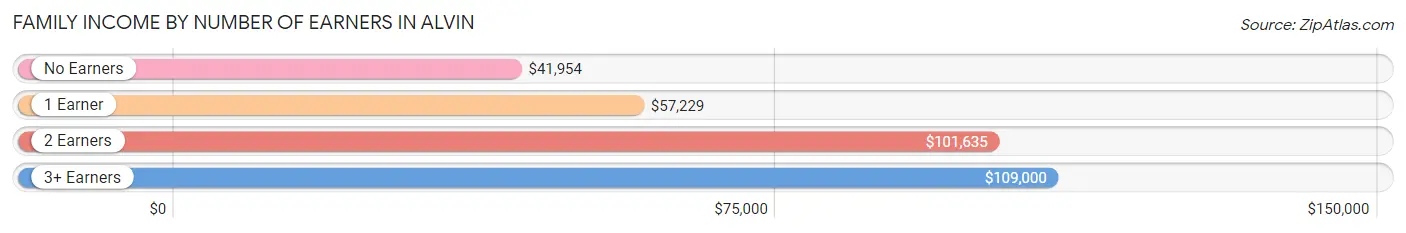
| Number of Earners | # Families | Median Income |
| No Earners | 835 (12.2%) | $41,954 |
| 1 Earner | 2,644 (38.6%) | $57,229 |
| 2 Earners | 2,415 (35.2%) | $101,635 |
| 3+ Earners | 958 (14.0%) | $109,000 |
| Total | 6,852 (100.0%) | $81,890 |
Household Income in Alvin
Household Income Brackets in Alvin
With 1,997 households falling in the category, the $50,000 to $74,999 income range is the most frequent in Alvin, accounting for 19.4% of all households. In contrast, only 401 households (3.9%) fall into the less than $10,000 income bracket, making it the least populous group.
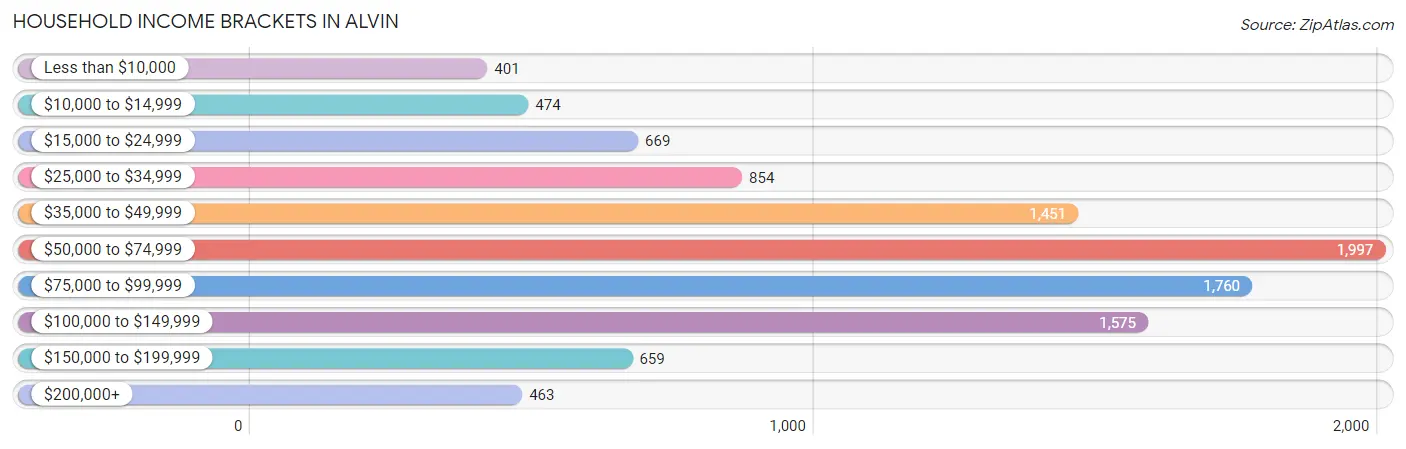
| Income Bracket | # Households | % Households |
| Less than $10,000 | 401 | 3.9% |
| $10,000 to $14,999 | 474 | 4.6% |
| $15,000 to $24,999 | 669 | 6.5% |
| $25,000 to $34,999 | 854 | 8.3% |
| $35,000 to $49,999 | 1,451 | 14.1% |
| $50,000 to $74,999 | 1,997 | 19.4% |
| $75,000 to $99,999 | 1,760 | 17.1% |
| $100,000 to $149,999 | 1,575 | 15.3% |
| $150,000 to $199,999 | 659 | 6.4% |
| $200,000+ | 463 | 4.5% |
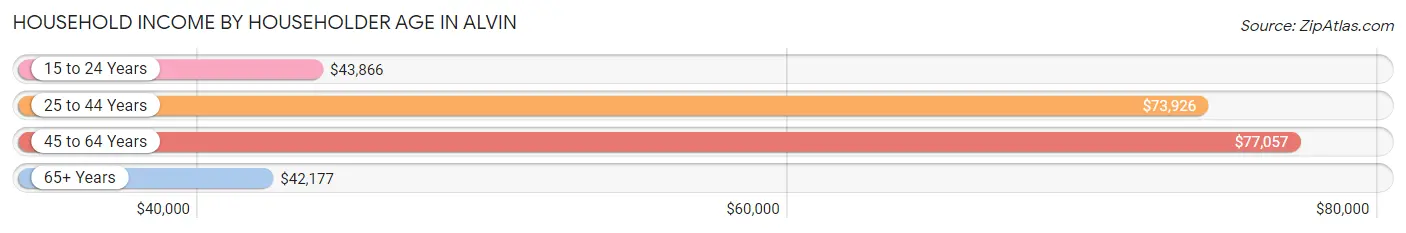
Household Income by Householder Age in Alvin
The median household income in Alvin is $68,266, with the highest median household income of $77,057 found in the 45 to 64 years age bracket for the primary householder. A total of 3,247 households (31.5%) fall into this category. Meanwhile, the 65+ years age bracket for the primary householder has the lowest median household income of $42,177, with 2,274 households (22.1%) in this group.
| Income Bracket | # Households | Median Income |
| 15 to 24 Years | 657 (6.4%) | $43,866 |
| 25 to 44 Years | 4,116 (40.0%) | $73,926 |
| 45 to 64 Years | 3,247 (31.5%) | $77,057 |
| 65+ Years | 2,274 (22.1%) | $42,177 |
| Total | 10,294 (100.0%) | $68,266 |
Poverty in Alvin
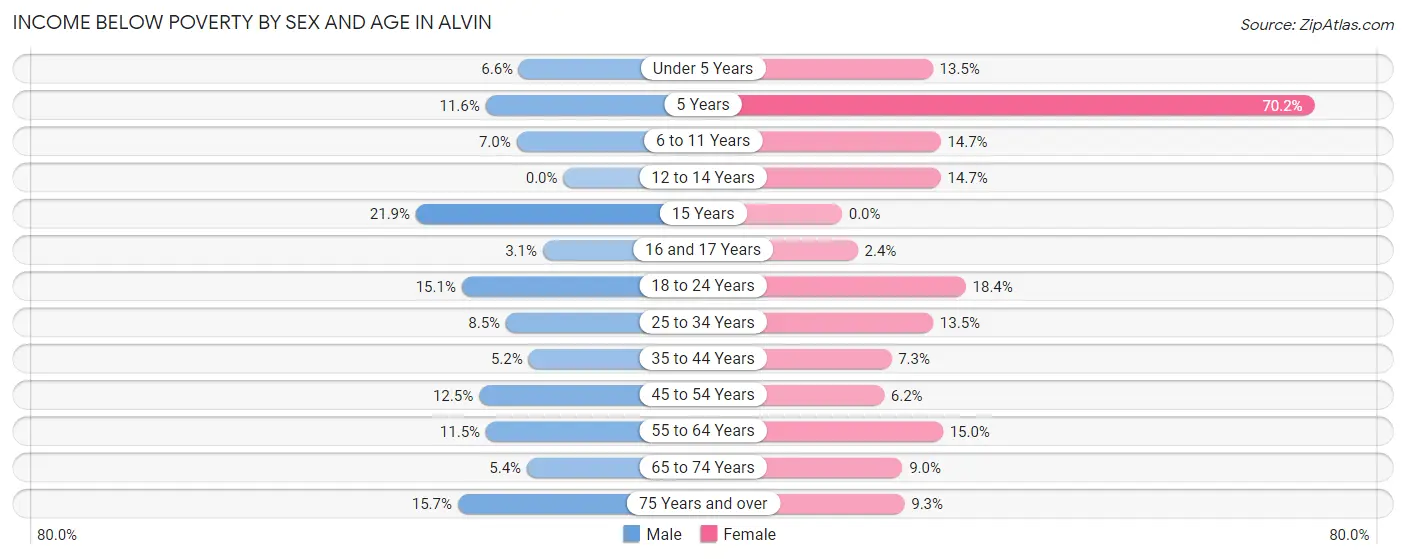
Income Below Poverty by Sex and Age in Alvin
With 8.8% poverty level for males and 11.9% for females among the residents of Alvin, 15 year old males and 5 year old females are the most vulnerable to poverty, with 30 males (21.9%) and 80 females (70.2%) in their respective age groups living below the poverty level.
| Age Bracket | Male | Female |
| Under 5 Years | 67 (6.6%) | 158 (13.5%) |
| 5 Years | 26 (11.6%) | 80 (70.2%) |
| 6 to 11 Years | 114 (7.0%) | 143 (14.6%) |
| 12 to 14 Years | 0 (0.0%) | 74 (14.7%) |
| 15 Years | 30 (21.9%) | 0 (0.0%) |
| 16 and 17 Years | 9 (3.0%) | 11 (2.4%) |
| 18 to 24 Years | 186 (15.1%) | 287 (18.4%) |
| 25 to 34 Years | 177 (8.5%) | 291 (13.5%) |
| 35 to 44 Years | 93 (5.2%) | 134 (7.3%) |
| 45 to 54 Years | 136 (12.5%) | 104 (6.2%) |
| 55 to 64 Years | 171 (11.5%) | 203 (15.0%) |
| 65 to 74 Years | 44 (5.4%) | 114 (9.0%) |
| 75 Years and over | 102 (15.7%) | 86 (9.3%) |
| Total | 1,155 (8.8%) | 1,685 (11.9%) |
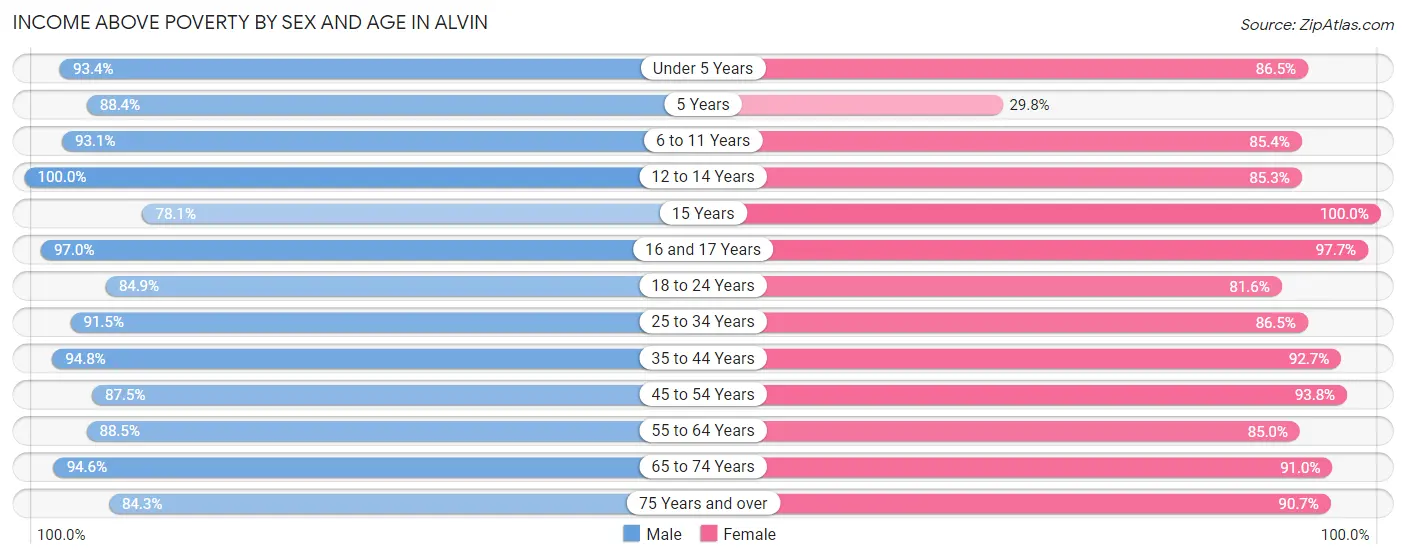
Income Above Poverty by Sex and Age in Alvin
According to the poverty statistics in Alvin, males aged 12 to 14 years and females aged 15 years are the age groups that are most secure financially, with 100.0% of males and 100.0% of females in these age groups living above the poverty line.
| Age Bracket | Male | Female |
| Under 5 Years | 948 (93.4%) | 1,013 (86.5%) |
| 5 Years | 199 (88.4%) | 34 (29.8%) |
| 6 to 11 Years | 1,526 (93.0%) | 833 (85.4%) |
| 12 to 14 Years | 614 (100.0%) | 430 (85.3%) |
| 15 Years | 107 (78.1%) | 138 (100.0%) |
| 16 and 17 Years | 286 (97.0%) | 457 (97.7%) |
| 18 to 24 Years | 1,047 (84.9%) | 1,274 (81.6%) |
| 25 to 34 Years | 1,897 (91.5%) | 1,859 (86.5%) |
| 35 to 44 Years | 1,705 (94.8%) | 1,692 (92.7%) |
| 45 to 54 Years | 949 (87.5%) | 1,563 (93.8%) |
| 55 to 64 Years | 1,316 (88.5%) | 1,152 (85.0%) |
| 65 to 74 Years | 770 (94.6%) | 1,157 (91.0%) |
| 75 Years and over | 549 (84.3%) | 841 (90.7%) |
| Total | 11,913 (91.2%) | 12,443 (88.1%) |
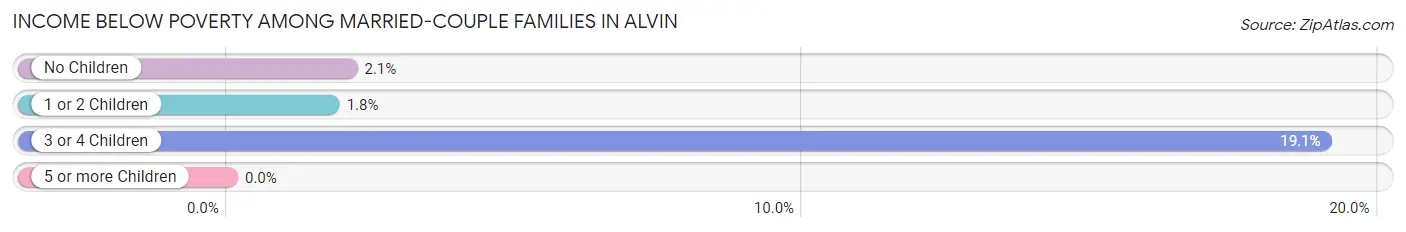
Income Below Poverty Among Married-Couple Families in Alvin
The poverty statistics for married-couple families in Alvin show that 3.0% or 136 of the total 4,517 families live below the poverty line. Families with 3 or 4 children have the highest poverty rate of 19.1%, comprising of 56 families. On the other hand, families with 5 or more children have the lowest poverty rate of 0.0%, which includes 0 families.
| Children | Above Poverty | Below Poverty |
| No Children | 1,931 (97.9%) | 41 (2.1%) |
| 1 or 2 Children | 2,168 (98.2%) | 39 (1.8%) |
| 3 or 4 Children | 238 (80.9%) | 56 (19.1%) |
| 5 or more Children | 44 (100.0%) | 0 (0.0%) |
| Total | 4,381 (97.0%) | 136 (3.0%) |
Income Below Poverty Among Single-Parent Households in Alvin
According to the poverty data in Alvin, 17.5% or 106 single-father households and 14.0% or 242 single-mother households are living below the poverty line. Among single-father households, those with 1 or 2 children have the highest poverty rate, with 75 households (22.1%) experiencing poverty. Likewise, among single-mother households, those with 3 or 4 children have the highest poverty rate, with 45 households (33.3%) falling below the poverty line.
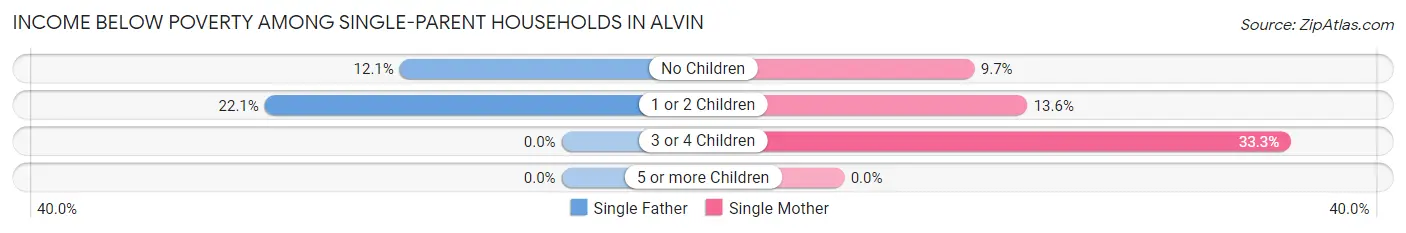
| Children | Single Father | Single Mother |
| No Children | 31 (12.1%) | 48 (9.7%) |
| 1 or 2 Children | 75 (22.1%) | 149 (13.6%) |
| 3 or 4 Children | 0 (0.0%) | 45 (33.3%) |
| 5 or more Children | 0 (0.0%) | 0 (0.0%) |
| Total | 106 (17.5%) | 242 (14.0%) |
Income Below Poverty Among Married-Couple vs Single-Parent Households in Alvin
The poverty data for Alvin shows that 136 of the married-couple family households (3.0%) and 348 of the single-parent households (14.9%) are living below the poverty level. Within the married-couple family households, those with 3 or 4 children have the highest poverty rate, with 56 households (19.1%) falling below the poverty line. Among the single-parent households, those with 3 or 4 children have the highest poverty rate, with 45 household (31.5%) living below poverty.
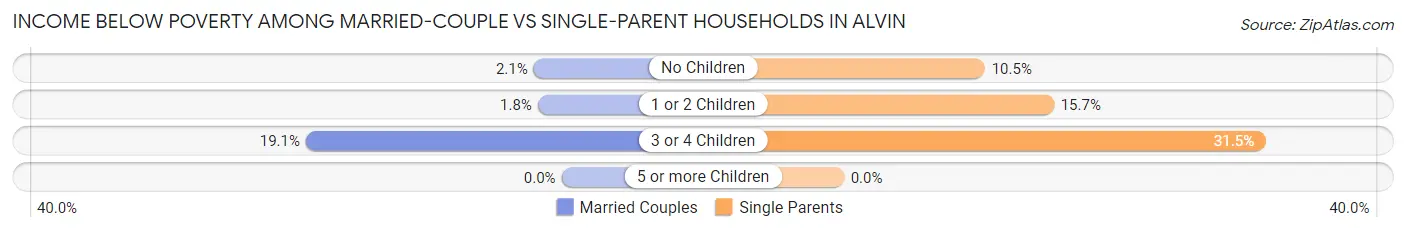
| Children | Married-Couple Families | Single-Parent Households |
| No Children | 41 (2.1%) | 79 (10.5%) |
| 1 or 2 Children | 39 (1.8%) | 224 (15.7%) |
| 3 or 4 Children | 56 (19.1%) | 45 (31.5%) |
| 5 or more Children | 0 (0.0%) | 0 (0.0%) |
| Total | 136 (3.0%) | 348 (14.9%) |
Race in Alvin
The most populous races in Alvin are White / Caucasian (19,070 | 69.8%), Hispanic or Latino (12,443 | 45.5%), and Two or more Races (4,371 | 16.0%).
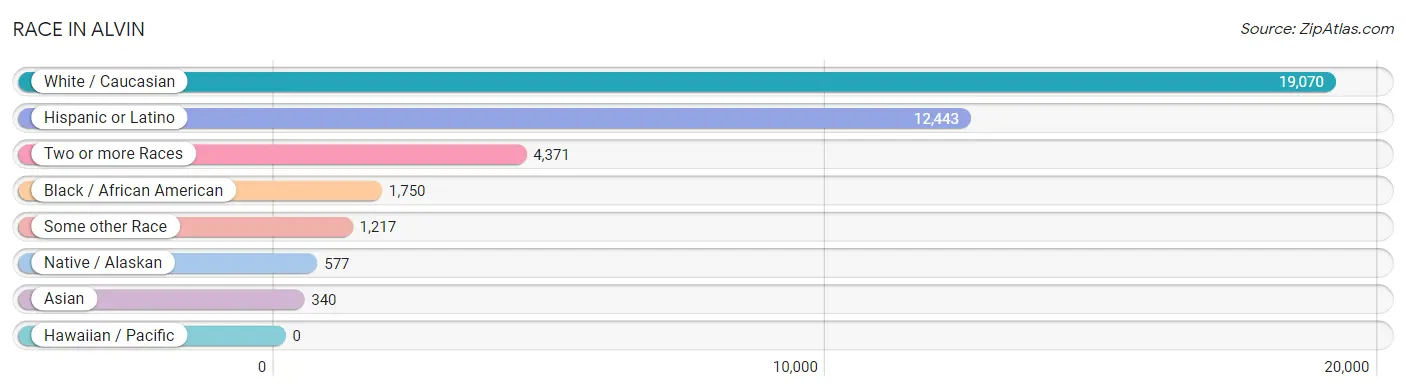
| Race | # Population | % Population |
| Asian | 340 | 1.2% |
| Black / African American | 1,750 | 6.4% |
| Hawaiian / Pacific | 0 | 0.0% |
| Hispanic or Latino | 12,443 | 45.5% |
| Native / Alaskan | 577 | 2.1% |
| White / Caucasian | 19,070 | 69.8% |
| Two or more Races | 4,371 | 16.0% |
| Some other Race | 1,217 | 4.4% |
| Total | 27,325 | 100.0% |
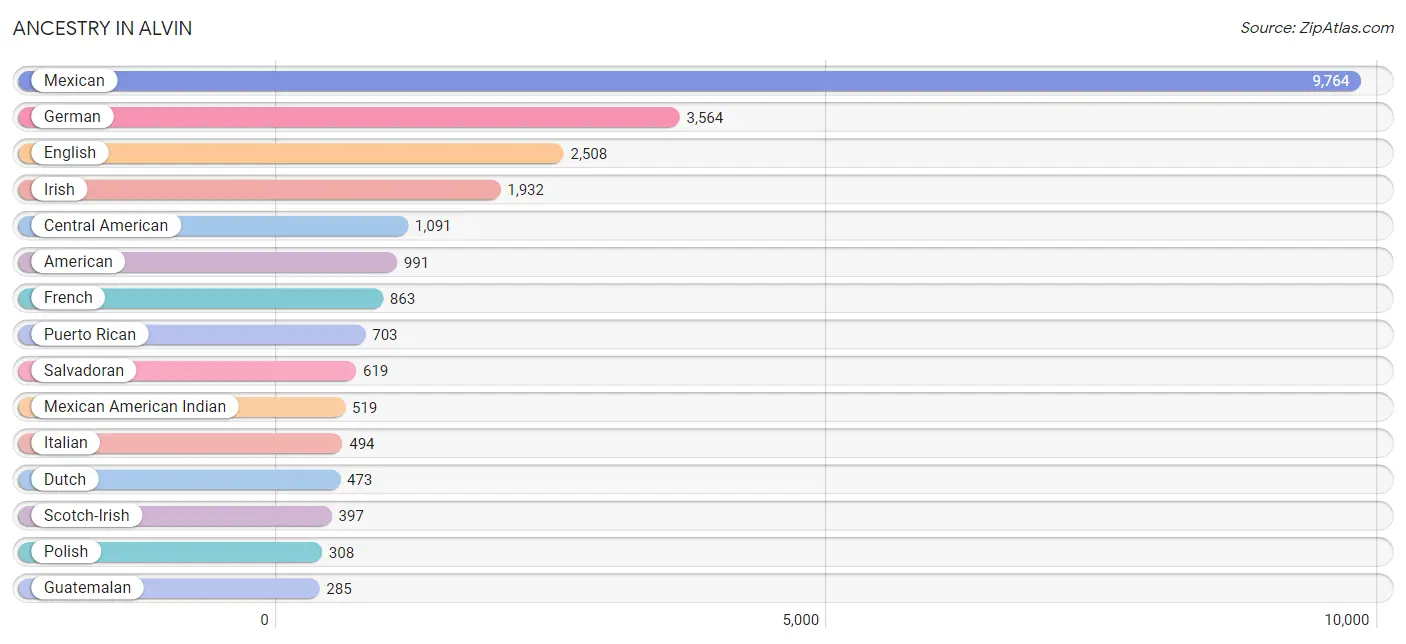
Ancestry in Alvin
The most populous ancestries reported in Alvin are Mexican (9,764 | 35.7%), German (3,564 | 13.0%), English (2,508 | 9.2%), Irish (1,932 | 7.1%), and Central American (1,091 | 4.0%), together accounting for 69.0% of all Alvin residents.
| Ancestry | # Population | % Population |
| African | 76 | 0.3% |
| American | 991 | 3.6% |
| Apache | 22 | 0.1% |
| Austrian | 25 | 0.1% |
| Bhutanese | 9 | 0.0% |
| British | 213 | 0.8% |
| Burmese | 2 | 0.0% |
| Canadian | 31 | 0.1% |
| Central American | 1,091 | 4.0% |
| Cherokee | 75 | 0.3% |
| Chickasaw | 25 | 0.1% |
| Choctaw | 5 | 0.0% |
| Colombian | 33 | 0.1% |
| Cuban | 90 | 0.3% |
| Czech | 283 | 1.0% |
| Czechoslovakian | 10 | 0.0% |
| Danish | 10 | 0.0% |
| Dominican | 51 | 0.2% |
| Dutch | 473 | 1.7% |
| Ecuadorian | 26 | 0.1% |
| English | 2,508 | 9.2% |
| European | 229 | 0.8% |
| French | 863 | 3.2% |
| French Canadian | 60 | 0.2% |
| German | 3,564 | 13.0% |
| Greek | 93 | 0.3% |
| Guatemalan | 285 | 1.0% |
| Honduran | 124 | 0.4% |
| Hungarian | 21 | 0.1% |
| Indian (Asian) | 56 | 0.2% |
| Indonesian | 34 | 0.1% |
| Irish | 1,932 | 7.1% |
| Italian | 494 | 1.8% |
| Korean | 100 | 0.4% |
| Lithuanian | 60 | 0.2% |
| Mexican | 9,764 | 35.7% |
| Mexican American Indian | 519 | 1.9% |
| Native Hawaiian | 47 | 0.2% |
| Norwegian | 129 | 0.5% |
| Panamanian | 63 | 0.2% |
| Polish | 308 | 1.1% |
| Portuguese | 56 | 0.2% |
| Puerto Rican | 703 | 2.6% |
| Russian | 18 | 0.1% |
| Salvadoran | 619 | 2.3% |
| Scandinavian | 64 | 0.2% |
| Scotch-Irish | 397 | 1.5% |
| Scottish | 136 | 0.5% |
| Slovak | 9 | 0.0% |
| South African | 29 | 0.1% |
| South American | 123 | 0.4% |
| Sri Lankan | 214 | 0.8% |
| Subsaharan African | 105 | 0.4% |
| Swedish | 154 | 0.6% |
| Swiss | 9 | 0.0% |
| Ukrainian | 18 | 0.1% |
| Venezuelan | 64 | 0.2% |
| Vietnamese | 28 | 0.1% |
| Welsh | 158 | 0.6% | View All 59 Rows |
Immigrants in Alvin
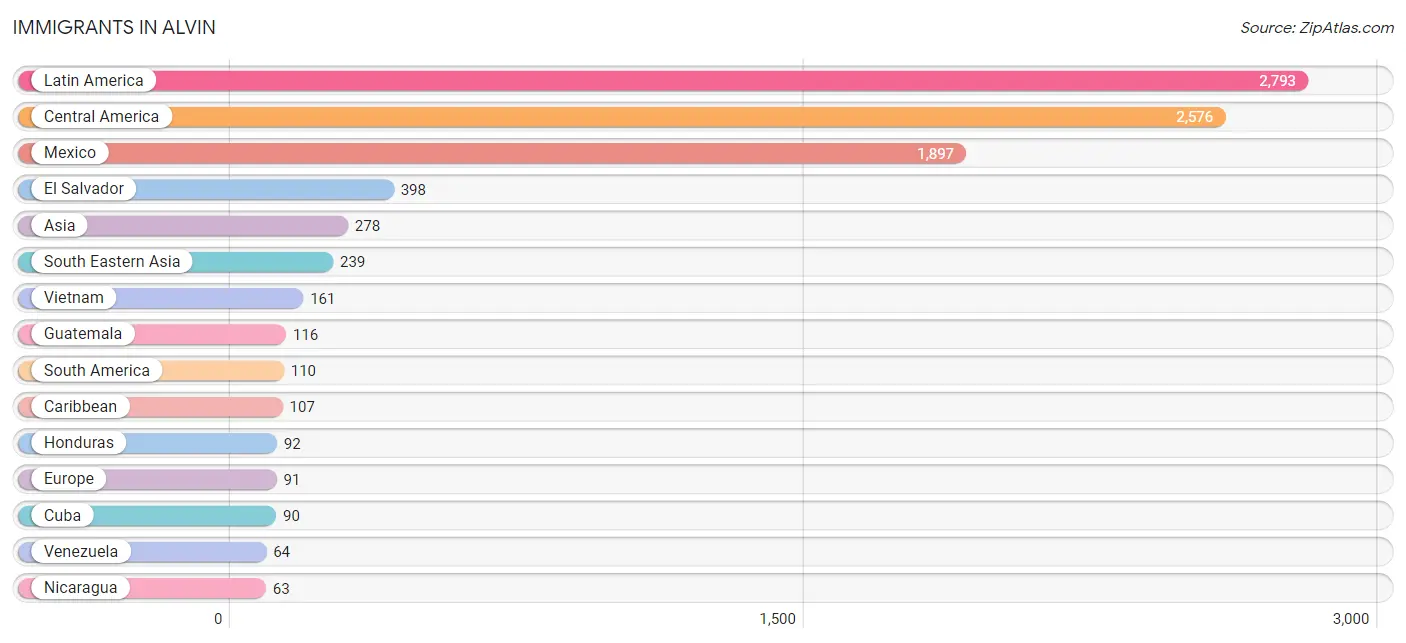
The most numerous immigrant groups reported in Alvin came from Latin America (2,793 | 10.2%), Central America (2,576 | 9.4%), Mexico (1,897 | 6.9%), El Salvador (398 | 1.5%), and Asia (278 | 1.0%), together accounting for 29.1% of all Alvin residents.
| Immigration Origin | # Population | % Population |
| Asia | 278 | 1.0% |
| Bangladesh | 28 | 0.1% |
| Caribbean | 107 | 0.4% |
| Central America | 2,576 | 9.4% |
| China | 9 | 0.0% |
| Colombia | 33 | 0.1% |
| Cuba | 90 | 0.3% |
| Dominican Republic | 17 | 0.1% |
| Eastern Asia | 11 | 0.0% |
| Eastern Europe | 21 | 0.1% |
| Ecuador | 13 | 0.1% |
| El Salvador | 398 | 1.5% |
| Europe | 91 | 0.3% |
| Germany | 9 | 0.0% |
| Guatemala | 116 | 0.4% |
| Honduras | 92 | 0.3% |
| Hungary | 21 | 0.1% |
| Italy | 19 | 0.1% |
| Korea | 2 | 0.0% |
| Latin America | 2,793 | 10.2% |
| Mexico | 1,897 | 6.9% |
| Nicaragua | 63 | 0.2% |
| Northern Europe | 42 | 0.2% |
| Panama | 10 | 0.0% |
| Philippines | 44 | 0.2% |
| South America | 110 | 0.4% |
| South Central Asia | 28 | 0.1% |
| South Eastern Asia | 239 | 0.9% |
| Southern Europe | 19 | 0.1% |
| Venezuela | 64 | 0.2% |
| Vietnam | 161 | 0.6% |
| Western Europe | 9 | 0.0% | View All 32 Rows |
Sex and Age in Alvin
Sex and Age in Alvin
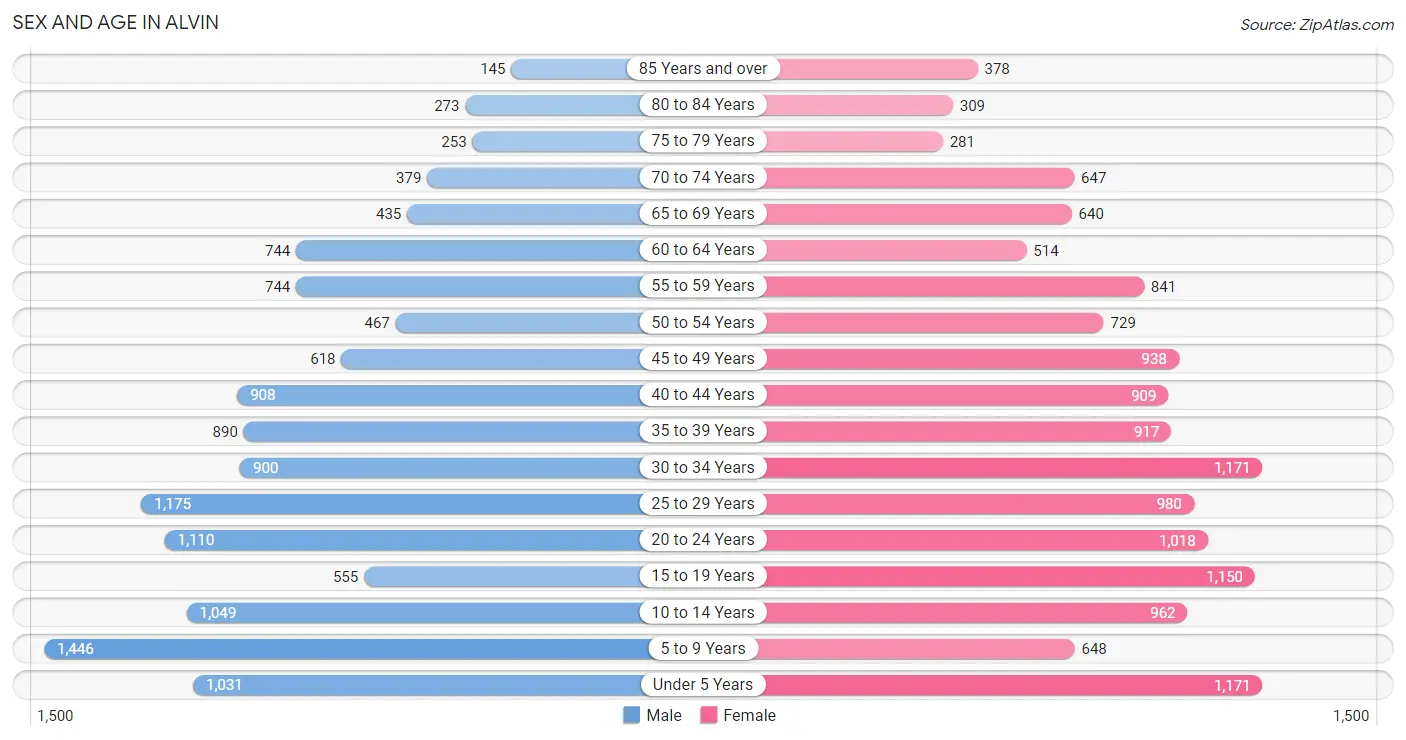
The most populous age groups in Alvin are 5 to 9 Years (1,446 | 11.0%) for men and Under 5 Years (1,171 | 8.2%) for women.
| Age Bracket | Male | Female |
| Under 5 Years | 1,031 (7.9%) | 1,171 (8.2%) |
| 5 to 9 Years | 1,446 (11.0%) | 648 (4.6%) |
| 10 to 14 Years | 1,049 (8.0%) | 962 (6.8%) |
| 15 to 19 Years | 555 (4.2%) | 1,150 (8.1%) |
| 20 to 24 Years | 1,110 (8.5%) | 1,018 (7.2%) |
| 25 to 29 Years | 1,175 (8.9%) | 980 (6.9%) |
| 30 to 34 Years | 900 (6.9%) | 1,171 (8.2%) |
| 35 to 39 Years | 890 (6.8%) | 917 (6.5%) |
| 40 to 44 Years | 908 (6.9%) | 909 (6.4%) |
| 45 to 49 Years | 618 (4.7%) | 938 (6.6%) |
| 50 to 54 Years | 467 (3.6%) | 729 (5.1%) |
| 55 to 59 Years | 744 (5.7%) | 841 (5.9%) |
| 60 to 64 Years | 744 (5.7%) | 514 (3.6%) |
| 65 to 69 Years | 435 (3.3%) | 640 (4.5%) |
| 70 to 74 Years | 379 (2.9%) | 647 (4.6%) |
| 75 to 79 Years | 253 (1.9%) | 281 (2.0%) |
| 80 to 84 Years | 273 (2.1%) | 309 (2.2%) |
| 85 Years and over | 145 (1.1%) | 378 (2.7%) |
| Total | 13,122 (100.0%) | 14,203 (100.0%) |
Families and Households in Alvin
Median Family Size in Alvin
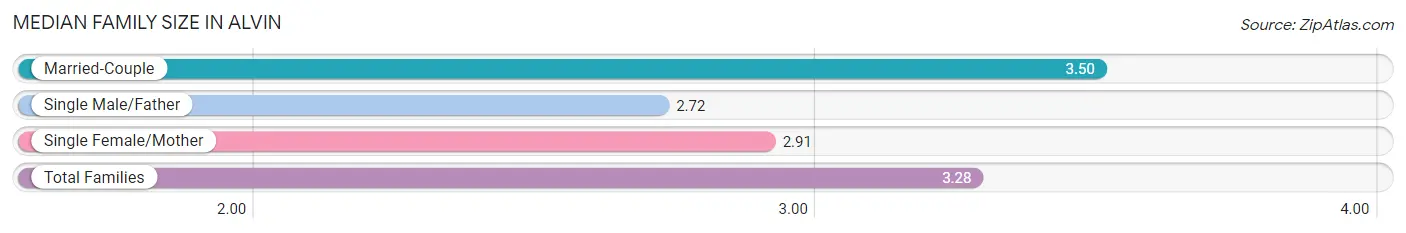
The median family size in Alvin is 3.28 persons per family, with married-couple families (4,517 | 65.9%) accounting for the largest median family size of 3.5 persons per family. On the other hand, single male/father families (604 | 8.8%) represent the smallest median family size with 2.72 persons per family.
| Family Type | # Families | Family Size |
| Married-Couple | 4,517 (65.9%) | 3.50 |
| Single Male/Father | 604 (8.8%) | 2.72 |
| Single Female/Mother | 1,731 (25.3%) | 2.91 |
| Total Families | 6,852 (100.0%) | 3.28 |
Median Household Size in Alvin
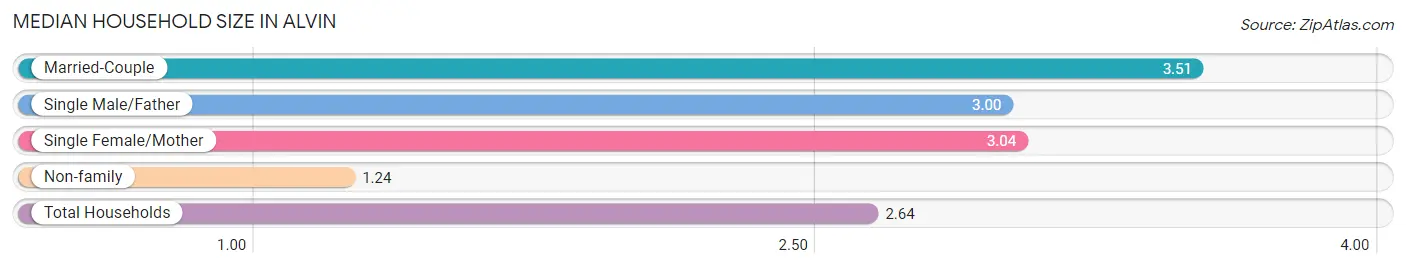
The median household size in Alvin is 2.64 persons per household, with married-couple households (4,517 | 43.9%) accounting for the largest median household size of 3.51 persons per household. non-family households (3,442 | 33.4%) represent the smallest median household size with 1.24 persons per household.
| Household Type | # Households | Household Size |
| Married-Couple | 4,517 (43.9%) | 3.51 |
| Single Male/Father | 604 (5.9%) | 3.00 |
| Single Female/Mother | 1,731 (16.8%) | 3.04 |
| Non-family | 3,442 (33.4%) | 1.24 |
| Total Households | 10,294 (100.0%) | 2.64 |
Household Size by Marriage Status in Alvin
Out of a total of 10,294 households in Alvin, 6,852 (66.6%) are family households, while 3,442 (33.4%) are nonfamily households. The most numerous type of family households are 2-person households, comprising 2,337, and the most common type of nonfamily households are 1-person households, comprising 2,732.
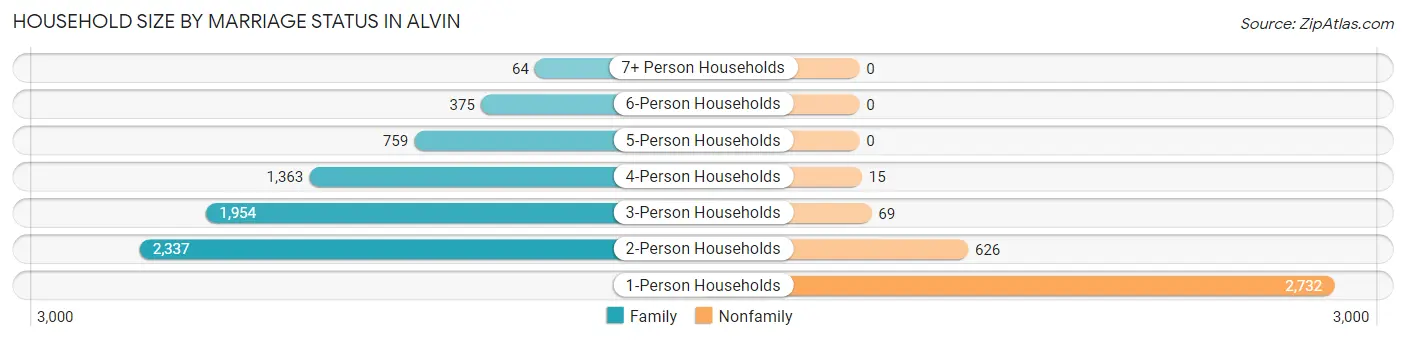
| Household Size | Family Households | Nonfamily Households |
| 1-Person Households | - | 2,732 (26.5%) |
| 2-Person Households | 2,337 (22.7%) | 626 (6.1%) |
| 3-Person Households | 1,954 (19.0%) | 69 (0.7%) |
| 4-Person Households | 1,363 (13.2%) | 15 (0.2%) |
| 5-Person Households | 759 (7.4%) | 0 (0.0%) |
| 6-Person Households | 375 (3.6%) | 0 (0.0%) |
| 7+ Person Households | 64 (0.6%) | 0 (0.0%) |
| Total | 6,852 (66.6%) | 3,442 (33.4%) |
Female Fertility in Alvin
Fertility by Age in Alvin
Average fertility rate in Alvin is 37.0 births per 1,000 women. Women in the age bracket of 20 to 34 years have the highest fertility rate with 86.0 births per 1,000 women. Women in the age bracket of 20 to 34 years acount for 100.0% of all women with births.
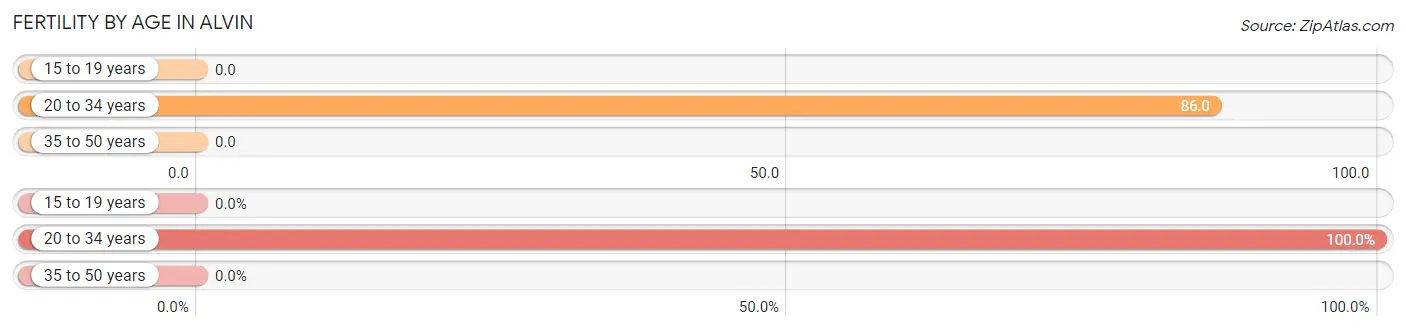
| Age Bracket | Women with Births | Births / 1,000 Women |
| 15 to 19 years | 0 (0.0%) | 0.0 |
| 20 to 34 years | 271 (100.0%) | 86.0 |
| 35 to 50 years | 0 (0.0%) | 0.0 |
| Total | 271 (100.0%) | 37.0 |
Fertility by Age by Marriage Status in Alvin
77.1% of women with births (271) in Alvin are married. The highest percentage of unmarried women with births falls into 20 to 34 years age bracket with 22.9% of them unmarried at the time of birth, while the lowest percentage of unmarried women with births belong to 20 to 34 years age bracket with 22.9% of them unmarried.
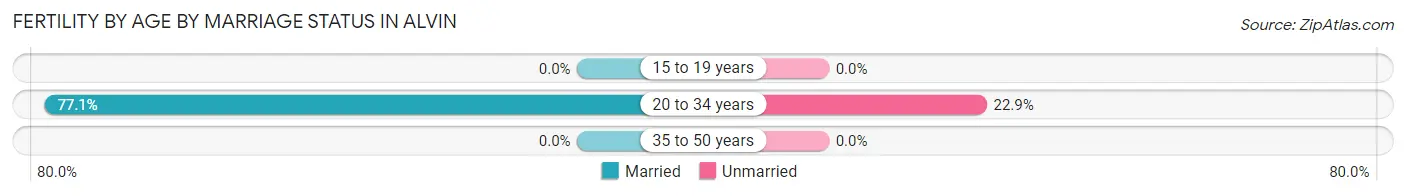
| Age Bracket | Married | Unmarried |
| 15 to 19 years | 0 (0.0%) | 0 (0.0%) |
| 20 to 34 years | 209 (77.1%) | 62 (22.9%) |
| 35 to 50 years | 0 (0.0%) | 0 (0.0%) |
| Total | 209 (77.1%) | 62 (22.9%) |
Fertility by Education in Alvin
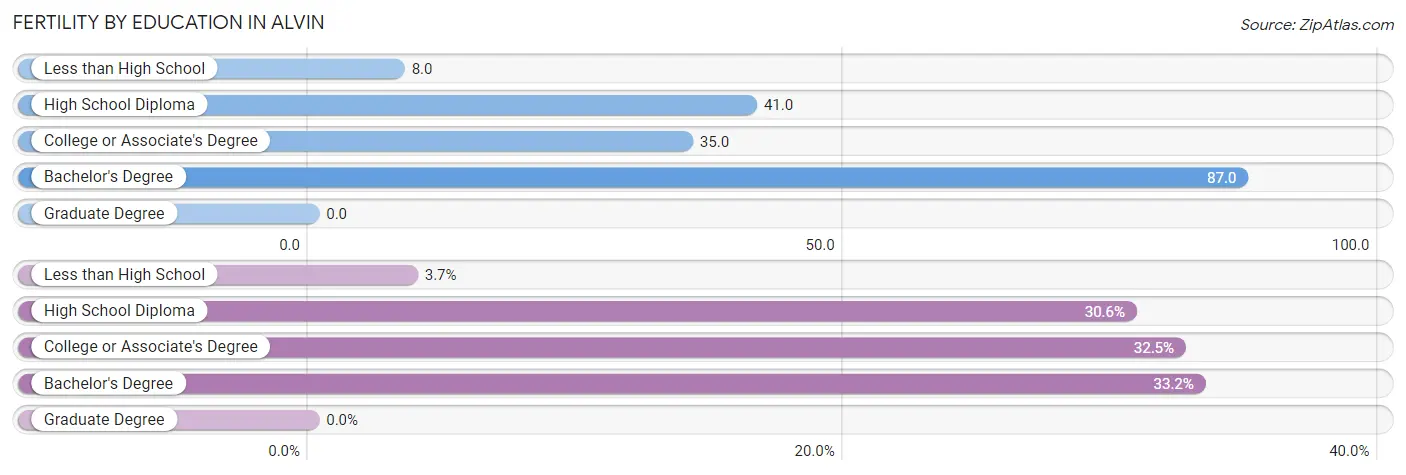
| Educational Attainment | Women with Births | Births / 1,000 Women |
| Less than High School | 10 (3.7%) | 8.0 |
| High School Diploma | 83 (30.6%) | 41.0 |
| College or Associate's Degree | 88 (32.5%) | 35.0 |
| Bachelor's Degree | 90 (33.2%) | 87.0 |
| Graduate Degree | 0 (0.0%) | 0.0 |
| Total | 271 (100.0%) | 37.0 |
Fertility by Education by Marriage Status in Alvin
22.9% of women with births in Alvin are unmarried. Women with the educational attainment of college or associate's degree are most likely to be married with 100.0% of them married at childbirth, while women with the educational attainment of less than high school are least likely to be married with 100.0% of them unmarried at childbirth.
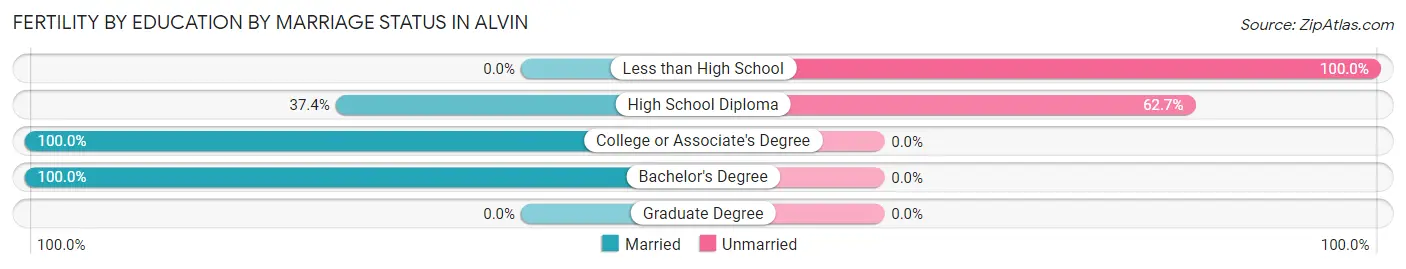
| Educational Attainment | Married | Unmarried |
| Less than High School | 0 (0.0%) | 10 (100.0%) |
| High School Diploma | 31 (37.3%) | 52 (62.6%) |
| College or Associate's Degree | 88 (100.0%) | 0 (0.0%) |
| Bachelor's Degree | 90 (100.0%) | 0 (0.0%) |
| Graduate Degree | 0 (0.0%) | 0 (0.0%) |
| Total | 209 (77.1%) | 62 (22.9%) |
Employment Characteristics in Alvin
Employment by Class of Employer in Alvin
Among the 13,278 employed individuals in Alvin, private company employees (9,943 | 74.9%), local government employees (1,018 | 7.7%), and not-for-profit organizations (690 | 5.2%) make up the most common classes of employment.
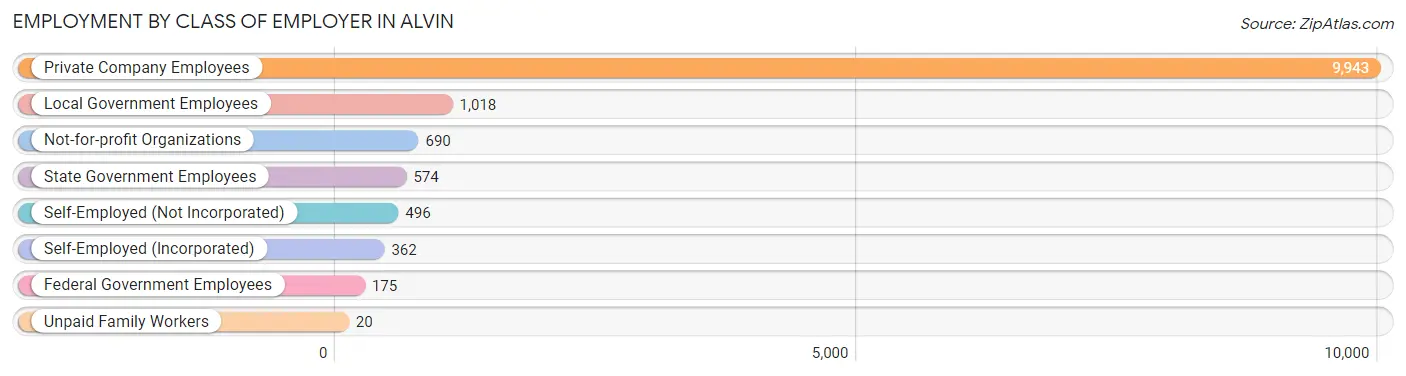
| Employer Class | # Employees | % Employees |
| Private Company Employees | 9,943 | 74.9% |
| Self-Employed (Incorporated) | 362 | 2.7% |
| Self-Employed (Not Incorporated) | 496 | 3.7% |
| Not-for-profit Organizations | 690 | 5.2% |
| Local Government Employees | 1,018 | 7.7% |
| State Government Employees | 574 | 4.3% |
| Federal Government Employees | 175 | 1.3% |
| Unpaid Family Workers | 20 | 0.2% |
| Total | 13,278 | 100.0% |
Employment Status by Age in Alvin
According to the labor force statistics for Alvin, out of the total population over 16 years of age (20,743), 66.1% or 13,711 individuals are in the labor force, with 3.0% or 411 of them unemployed. The age group with the highest labor force participation rate is 30 to 34 years, with 89.3% or 1,849 individuals in the labor force. Within the labor force, the 16 to 19 years age range has the highest percentage of unemployed individuals, with 25.0% or 166 of them being unemployed.
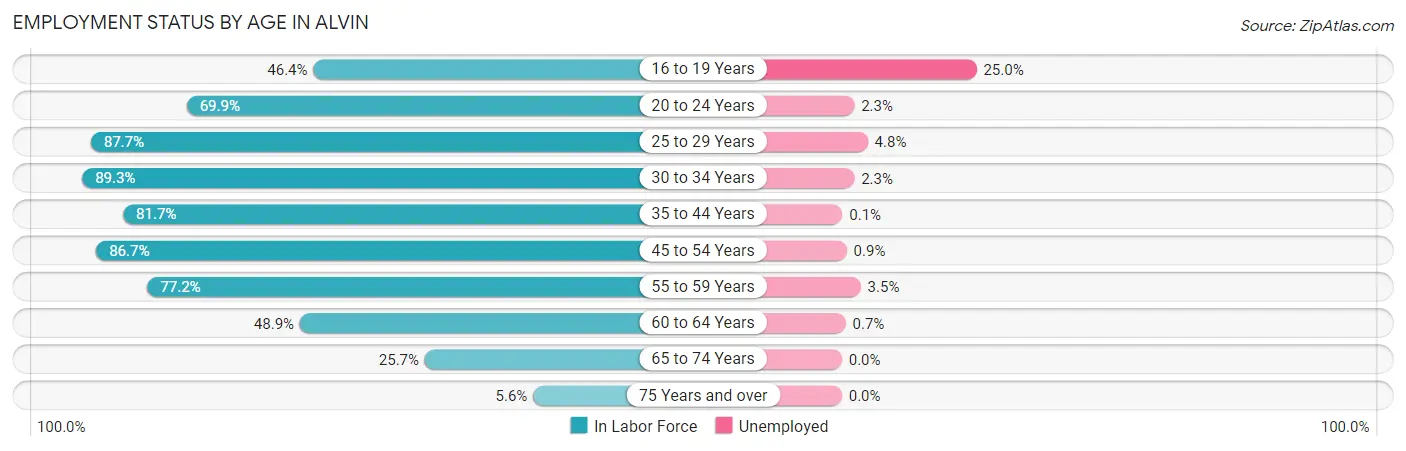
| Age Bracket | In Labor Force | Unemployed |
| 16 to 19 Years | 664 (46.4%) | 166 (25.0%) |
| 20 to 24 Years | 1,487 (69.9%) | 34 (2.3%) |
| 25 to 29 Years | 1,890 (87.7%) | 91 (4.8%) |
| 30 to 34 Years | 1,849 (89.3%) | 43 (2.3%) |
| 35 to 44 Years | 2,961 (81.7%) | 3 (0.1%) |
| 45 to 54 Years | 2,386 (86.7%) | 21 (0.9%) |
| 55 to 59 Years | 1,224 (77.2%) | 43 (3.5%) |
| 60 to 64 Years | 615 (48.9%) | 4 (0.7%) |
| 65 to 74 Years | 540 (25.7%) | 0 (0.0%) |
| 75 Years and over | 92 (5.6%) | 0 (0.0%) |
| Total | 13,711 (66.1%) | 411 (3.0%) |
Employment Status by Educational Attainment in Alvin
According to labor force statistics for Alvin, 81.3% of individuals (10,931) out of the total population between 25 and 64 years of age (13,445) are in the labor force, with 1.9% or 208 of them being unemployed. The group with the highest labor force participation rate are those with the educational attainment of bachelor's degree or higher, with 92.3% or 2,164 individuals in the labor force. Within the labor force, individuals with less than high school education have the highest percentage of unemployment, with 8.9% or 117 of them being unemployed.
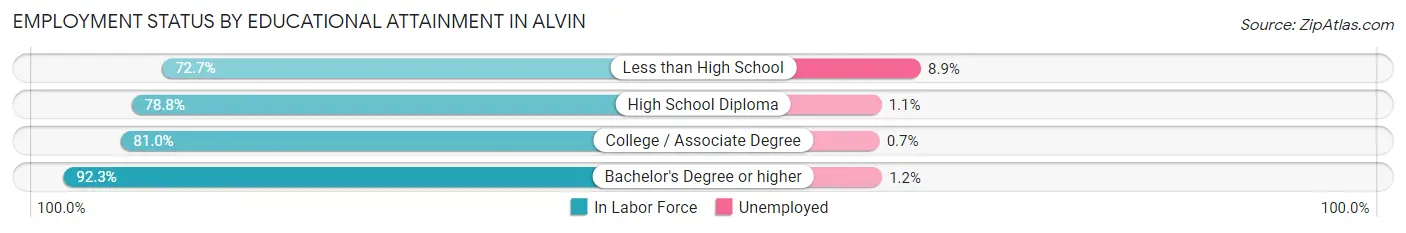
| Educational Attainment | In Labor Force | Unemployed |
| Less than High School | 1,314 (72.7%) | 161 (8.9%) |
| High School Diploma | 2,812 (78.8%) | 39 (1.1%) |
| College / Associate Degree | 4,636 (81.0%) | 40 (0.7%) |
| Bachelor's Degree or higher | 2,164 (92.3%) | 28 (1.2%) |
| Total | 10,931 (81.3%) | 255 (1.9%) |
Employment Occupations by Sex in Alvin
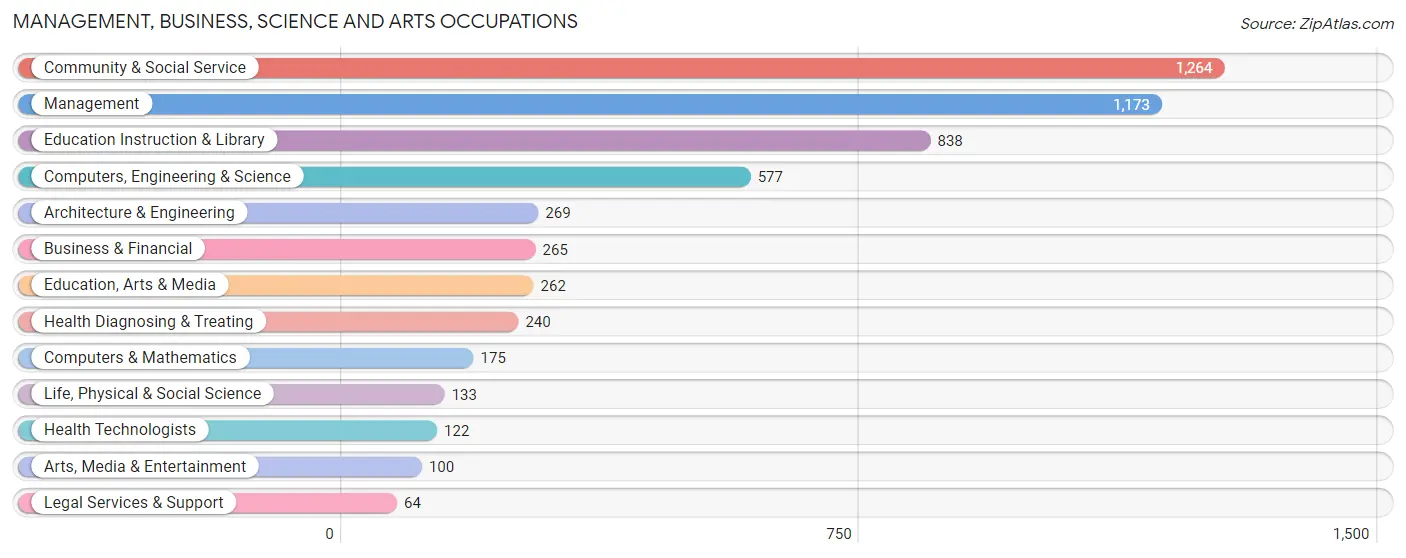
Management, Business, Science and Arts Occupations
The most common Management, Business, Science and Arts occupations in Alvin are Community & Social Service (1,264 | 9.5%), Management (1,173 | 8.8%), Education Instruction & Library (838 | 6.3%), Computers, Engineering & Science (577 | 4.3%), and Architecture & Engineering (269 | 2.0%).
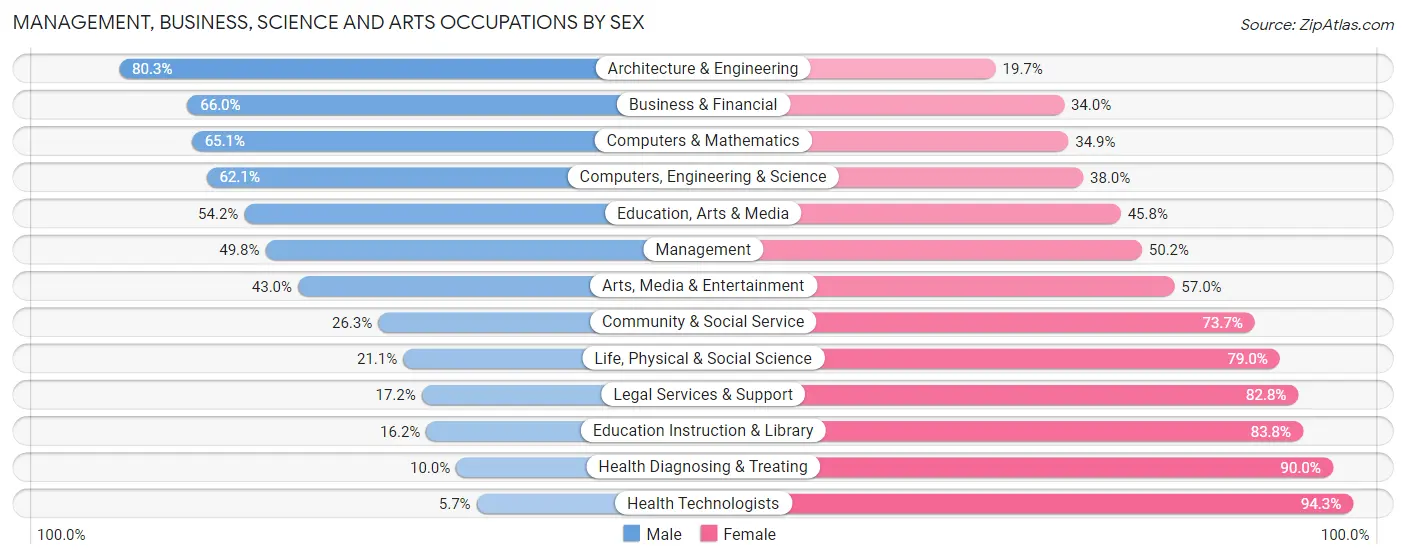
Management, Business, Science and Arts Occupations by Sex
Within the Management, Business, Science and Arts occupations in Alvin, the most male-oriented occupations are Architecture & Engineering (80.3%), Business & Financial (66.0%), and Computers & Mathematics (65.1%), while the most female-oriented occupations are Health Technologists (94.3%), Health Diagnosing & Treating (90.0%), and Education Instruction & Library (83.8%).
| Occupation | Male | Female |
| Management | 584 (49.8%) | 589 (50.2%) |
| Business & Financial | 175 (66.0%) | 90 (34.0%) |
| Computers, Engineering & Science | 358 (62.1%) | 219 (38.0%) |
| Computers & Mathematics | 114 (65.1%) | 61 (34.9%) |
| Architecture & Engineering | 216 (80.3%) | 53 (19.7%) |
| Life, Physical & Social Science | 28 (21.0%) | 105 (78.9%) |
| Community & Social Service | 332 (26.3%) | 932 (73.7%) |
| Education, Arts & Media | 142 (54.2%) | 120 (45.8%) |
| Legal Services & Support | 11 (17.2%) | 53 (82.8%) |
| Education Instruction & Library | 136 (16.2%) | 702 (83.8%) |
| Arts, Media & Entertainment | 43 (43.0%) | 57 (57.0%) |
| Health Diagnosing & Treating | 24 (10.0%) | 216 (90.0%) |
| Health Technologists | 7 (5.7%) | 115 (94.3%) |
| Total (Category) | 1,473 (41.9%) | 2,046 (58.1%) |
| Total (Overall) | 6,491 (48.8%) | 6,813 (51.2%) |
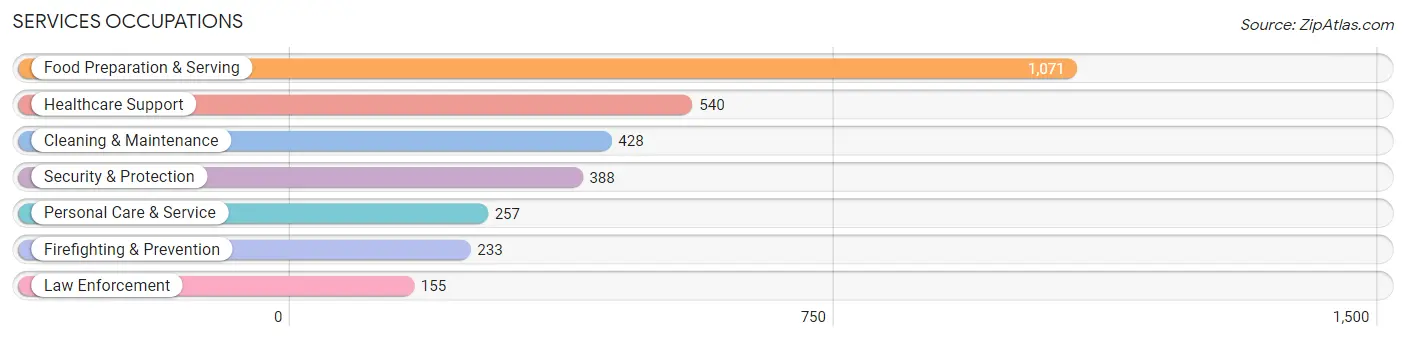
Services Occupations
The most common Services occupations in Alvin are Food Preparation & Serving (1,071 | 8.1%), Healthcare Support (540 | 4.1%), Cleaning & Maintenance (428 | 3.2%), Security & Protection (388 | 2.9%), and Personal Care & Service (257 | 1.9%).
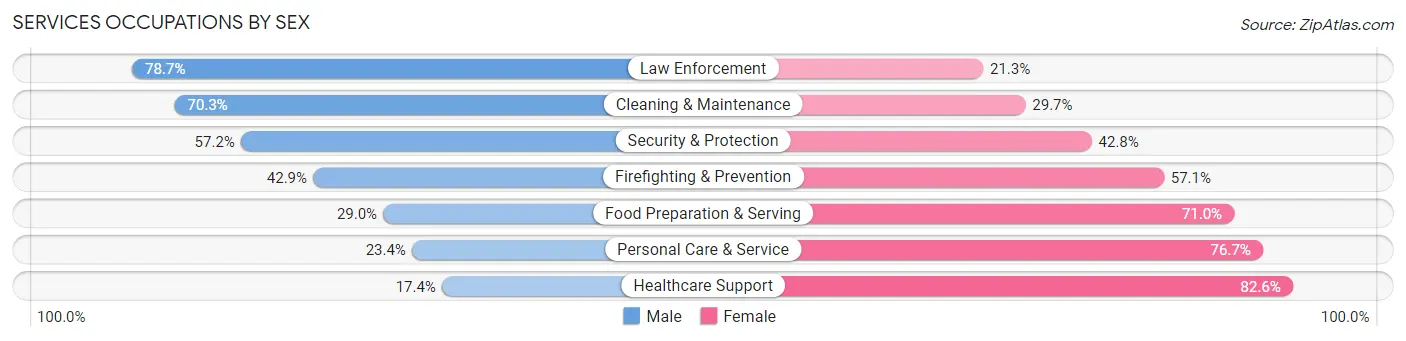
Services Occupations by Sex
Within the Services occupations in Alvin, the most male-oriented occupations are Law Enforcement (78.7%), Cleaning & Maintenance (70.3%), and Security & Protection (57.2%), while the most female-oriented occupations are Healthcare Support (82.6%), Personal Care & Service (76.6%), and Food Preparation & Serving (71.0%).
| Occupation | Male | Female |
| Healthcare Support | 94 (17.4%) | 446 (82.6%) |
| Security & Protection | 222 (57.2%) | 166 (42.8%) |
| Firefighting & Prevention | 100 (42.9%) | 133 (57.1%) |
| Law Enforcement | 122 (78.7%) | 33 (21.3%) |
| Food Preparation & Serving | 311 (29.0%) | 760 (71.0%) |
| Cleaning & Maintenance | 301 (70.3%) | 127 (29.7%) |
| Personal Care & Service | 60 (23.4%) | 197 (76.6%) |
| Total (Category) | 988 (36.8%) | 1,696 (63.2%) |
| Total (Overall) | 6,491 (48.8%) | 6,813 (51.2%) |
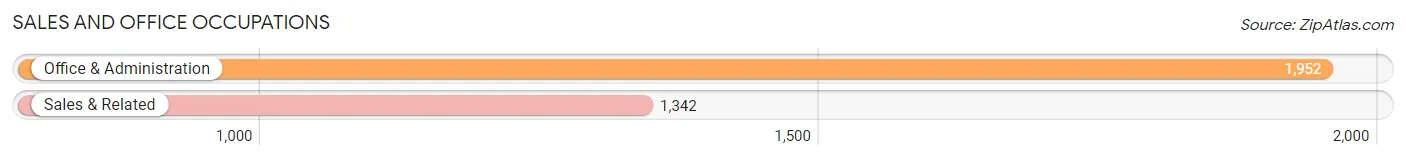
Sales and Office Occupations
The most common Sales and Office occupations in Alvin are Office & Administration (1,952 | 14.7%), and Sales & Related (1,342 | 10.1%).
Sales and Office Occupations by Sex
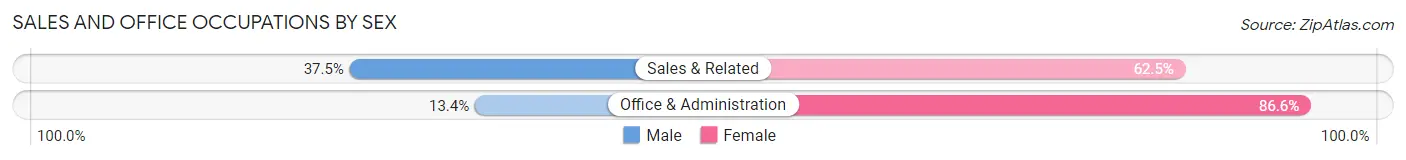
| Occupation | Male | Female |
| Sales & Related | 503 (37.5%) | 839 (62.5%) |
| Office & Administration | 261 (13.4%) | 1,691 (86.6%) |
| Total (Category) | 764 (23.2%) | 2,530 (76.8%) |
| Total (Overall) | 6,491 (48.8%) | 6,813 (51.2%) |
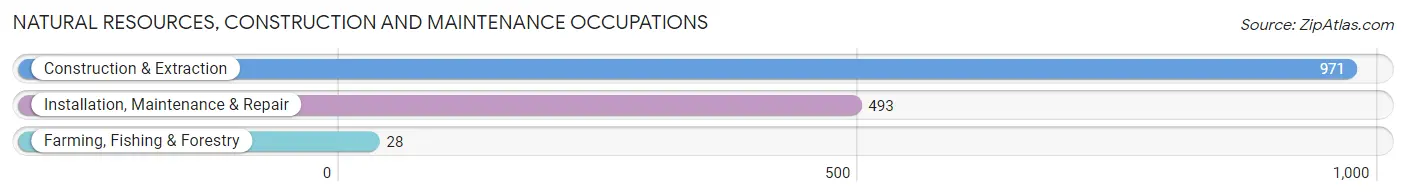
Natural Resources, Construction and Maintenance Occupations
The most common Natural Resources, Construction and Maintenance occupations in Alvin are Construction & Extraction (971 | 7.3%), Installation, Maintenance & Repair (493 | 3.7%), and Farming, Fishing & Forestry (28 | 0.2%).
Natural Resources, Construction and Maintenance Occupations by Sex
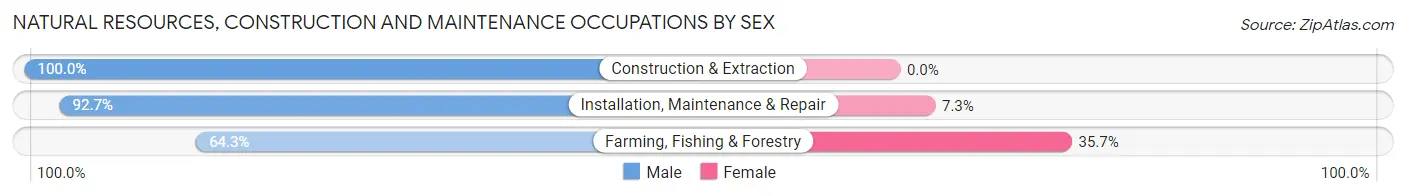
| Occupation | Male | Female |
| Farming, Fishing & Forestry | 18 (64.3%) | 10 (35.7%) |
| Construction & Extraction | 971 (100.0%) | 0 (0.0%) |
| Installation, Maintenance & Repair | 457 (92.7%) | 36 (7.3%) |
| Total (Category) | 1,446 (96.9%) | 46 (3.1%) |
| Total (Overall) | 6,491 (48.8%) | 6,813 (51.2%) |
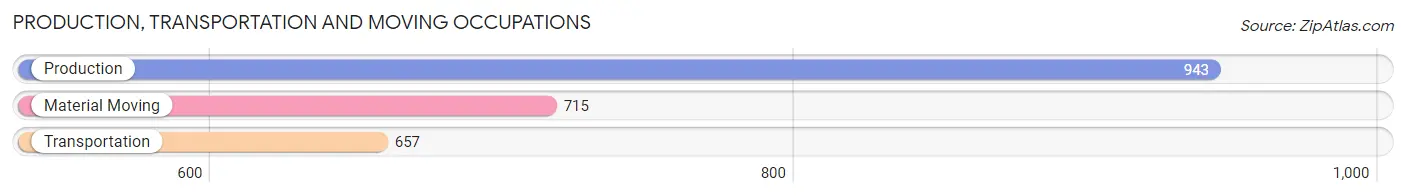
Production, Transportation and Moving Occupations
The most common Production, Transportation and Moving occupations in Alvin are Production (943 | 7.1%), Material Moving (715 | 5.4%), and Transportation (657 | 4.9%).
Production, Transportation and Moving Occupations by Sex
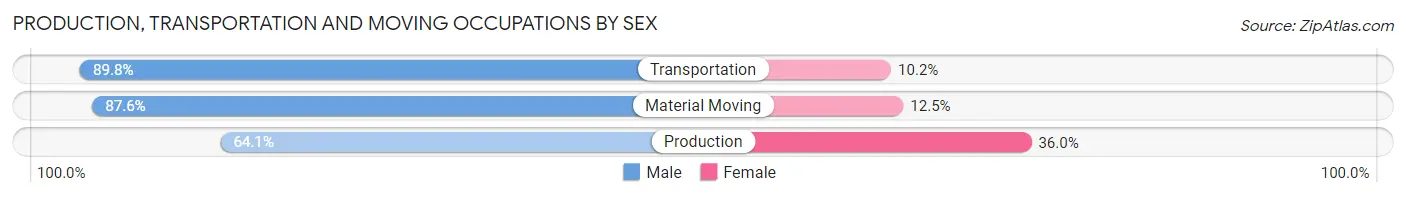
| Occupation | Male | Female |
| Production | 604 (64.0%) | 339 (35.9%) |
| Transportation | 590 (89.8%) | 67 (10.2%) |
| Material Moving | 626 (87.5%) | 89 (12.4%) |
| Total (Category) | 1,820 (78.6%) | 495 (21.4%) |
| Total (Overall) | 6,491 (48.8%) | 6,813 (51.2%) |
Employment Industries by Sex in Alvin
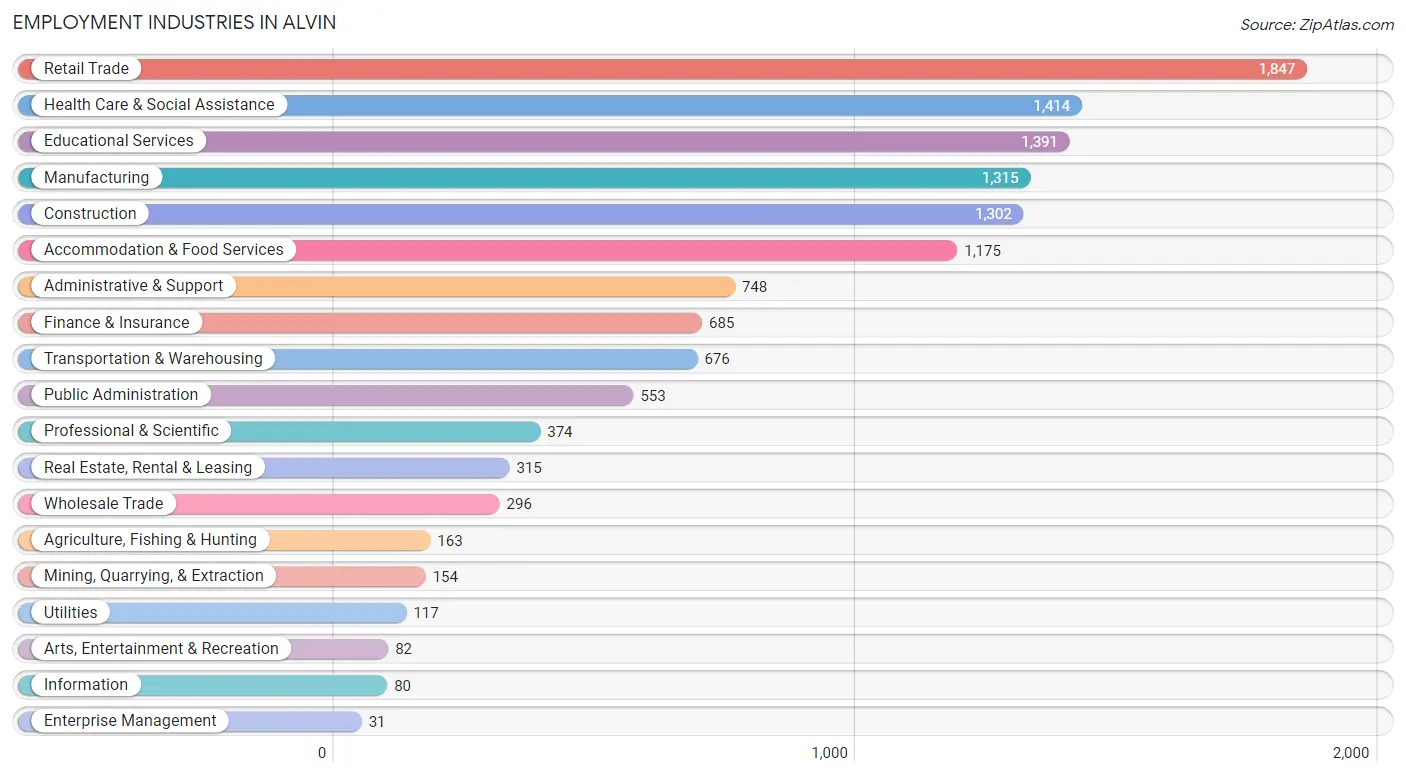
Employment Industries in Alvin
The major employment industries in Alvin include Retail Trade (1,847 | 13.9%), Health Care & Social Assistance (1,414 | 10.6%), Educational Services (1,391 | 10.5%), Manufacturing (1,315 | 9.9%), and Construction (1,302 | 9.8%).
Employment Industries by Sex in Alvin
The Alvin industries that see more men than women are Mining, Quarrying, & Extraction (100.0%), Utilities (100.0%), and Information (90.0%), whereas the industries that tend to have a higher number of women are Enterprise Management (100.0%), Agriculture, Fishing & Hunting (91.4%), and Educational Services (89.1%).
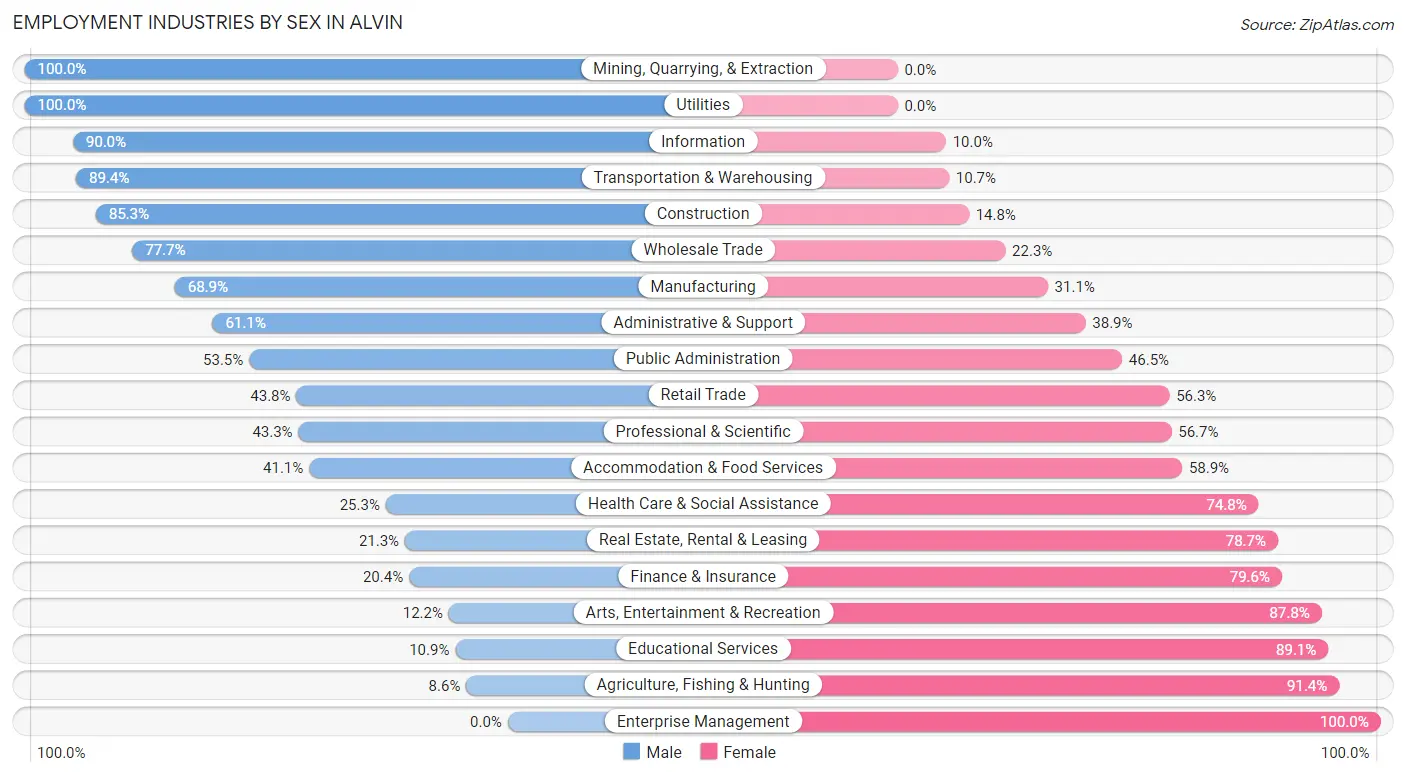
| Industry | Male | Female |
| Agriculture, Fishing & Hunting | 14 (8.6%) | 149 (91.4%) |
| Mining, Quarrying, & Extraction | 154 (100.0%) | 0 (0.0%) |
| Construction | 1,110 (85.3%) | 192 (14.7%) |
| Manufacturing | 906 (68.9%) | 409 (31.1%) |
| Wholesale Trade | 230 (77.7%) | 66 (22.3%) |
| Retail Trade | 808 (43.8%) | 1,039 (56.2%) |
| Transportation & Warehousing | 604 (89.3%) | 72 (10.6%) |
| Utilities | 117 (100.0%) | 0 (0.0%) |
| Information | 72 (90.0%) | 8 (10.0%) |
| Finance & Insurance | 140 (20.4%) | 545 (79.6%) |
| Real Estate, Rental & Leasing | 67 (21.3%) | 248 (78.7%) |
| Professional & Scientific | 162 (43.3%) | 212 (56.7%) |
| Enterprise Management | 0 (0.0%) | 31 (100.0%) |
| Administrative & Support | 457 (61.1%) | 291 (38.9%) |
| Educational Services | 151 (10.9%) | 1,240 (89.1%) |
| Health Care & Social Assistance | 357 (25.3%) | 1,057 (74.8%) |
| Arts, Entertainment & Recreation | 10 (12.2%) | 72 (87.8%) |
| Accommodation & Food Services | 483 (41.1%) | 692 (58.9%) |
| Public Administration | 296 (53.5%) | 257 (46.5%) |
| Total | 6,491 (48.8%) | 6,813 (51.2%) |
Education in Alvin
School Enrollment in Alvin
The most common levels of schooling among the 7,185 students in Alvin are middle school (1,699 | 23.6%), elementary school (1,660 | 23.1%), and college / undergraduate (1,526 | 21.2%).
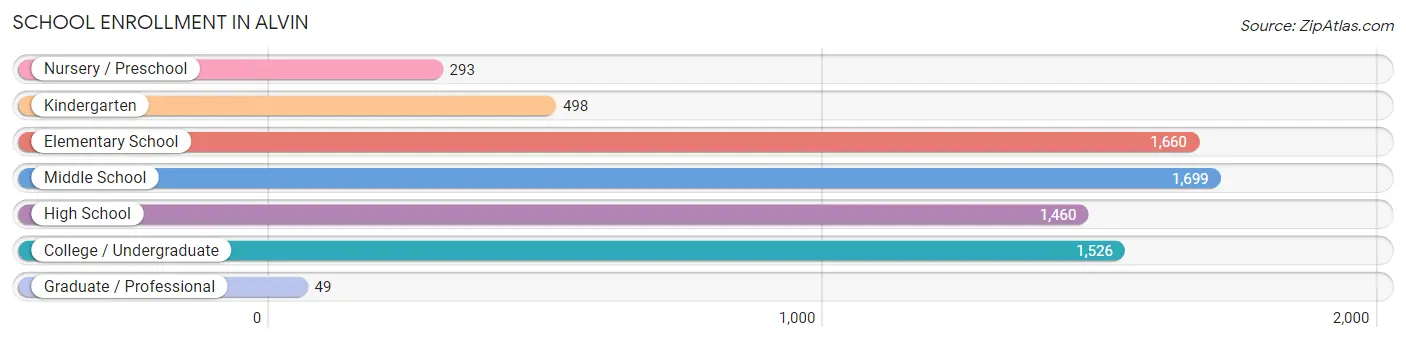
| School Level | # Students | % Students |
| Nursery / Preschool | 293 | 4.1% |
| Kindergarten | 498 | 6.9% |
| Elementary School | 1,660 | 23.1% |
| Middle School | 1,699 | 23.6% |
| High School | 1,460 | 20.3% |
| College / Undergraduate | 1,526 | 21.2% |
| Graduate / Professional | 49 | 0.7% |
| Total | 7,185 | 100.0% |
School Enrollment by Age by Funding Source in Alvin
Out of a total of 7,185 students who are enrolled in schools in Alvin, 366 (5.1%) attend a private institution, while the remaining 6,819 (94.9%) are enrolled in public schools. The age group of 3 to 4 year olds has the highest likelihood of being enrolled in private schools, with 107 (39.5% in the age bracket) enrolled. Conversely, the age group of 25 to 34 year olds has the lowest likelihood of being enrolled in a private school, with 195 (100.0% in the age bracket) attending a public institution.
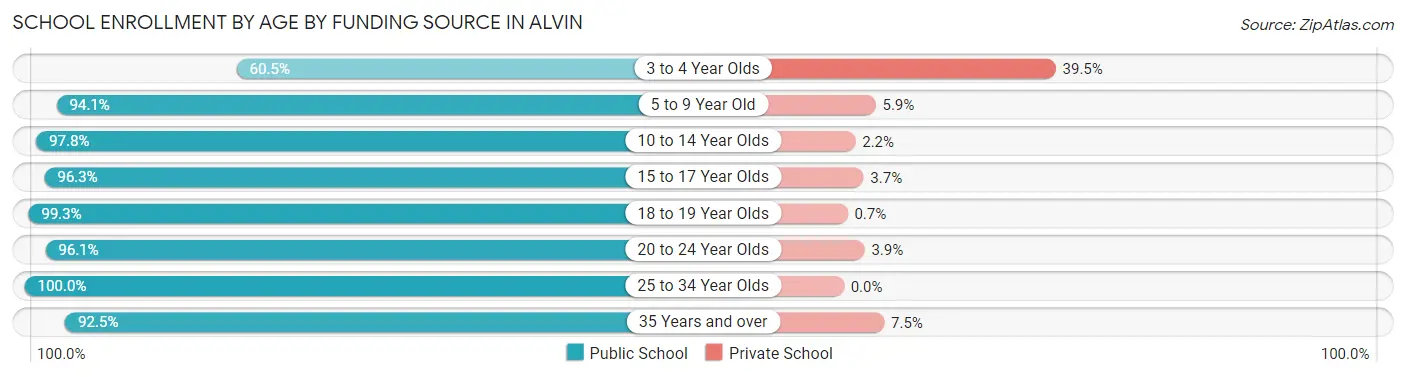
| Age Bracket | Public School | Private School |
| 3 to 4 Year Olds | 164 (60.5%) | 107 (39.5%) |
| 5 to 9 Year Old | 1,946 (94.1%) | 123 (5.9%) |
| 10 to 14 Year Olds | 1,948 (97.8%) | 43 (2.2%) |
| 15 to 17 Year Olds | 943 (96.3%) | 36 (3.7%) |
| 18 to 19 Year Olds | 568 (99.3%) | 4 (0.7%) |
| 20 to 24 Year Olds | 695 (96.1%) | 28 (3.9%) |
| 25 to 34 Year Olds | 195 (100.0%) | 0 (0.0%) |
| 35 Years and over | 356 (92.5%) | 29 (7.5%) |
| Total | 6,819 (94.9%) | 366 (5.1%) |
Educational Attainment by Field of Study in Alvin
Business (574 | 17.0%), science & technology (566 | 16.7%), psychology (373 | 11.0%), education (316 | 9.3%), and arts & humanities (239 | 7.1%) are the most common fields of study among 3,383 individuals in Alvin who have obtained a bachelor's degree or higher.
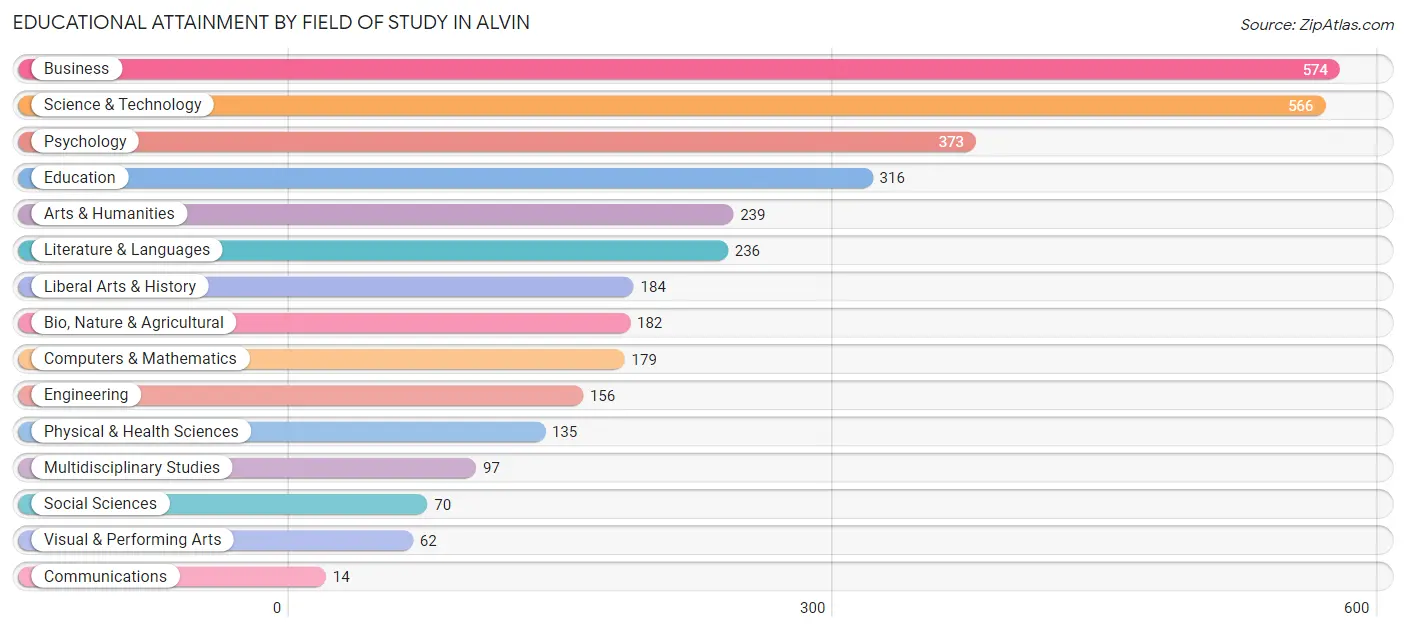
| Field of Study | # Graduates | % Graduates |
| Computers & Mathematics | 179 | 5.3% |
| Bio, Nature & Agricultural | 182 | 5.4% |
| Physical & Health Sciences | 135 | 4.0% |
| Psychology | 373 | 11.0% |
| Social Sciences | 70 | 2.1% |
| Engineering | 156 | 4.6% |
| Multidisciplinary Studies | 97 | 2.9% |
| Science & Technology | 566 | 16.7% |
| Business | 574 | 17.0% |
| Education | 316 | 9.3% |
| Literature & Languages | 236 | 7.0% |
| Liberal Arts & History | 184 | 5.4% |
| Visual & Performing Arts | 62 | 1.8% |
| Communications | 14 | 0.4% |
| Arts & Humanities | 239 | 7.1% |
| Total | 3,383 | 100.0% |
Transportation & Commute in Alvin
Vehicle Availability by Sex in Alvin
The most prevalent vehicle ownership categories in Alvin are males with 2 vehicles (2,971, accounting for 45.9%) and females with 2 vehicles (2,702, making up 43.7%).
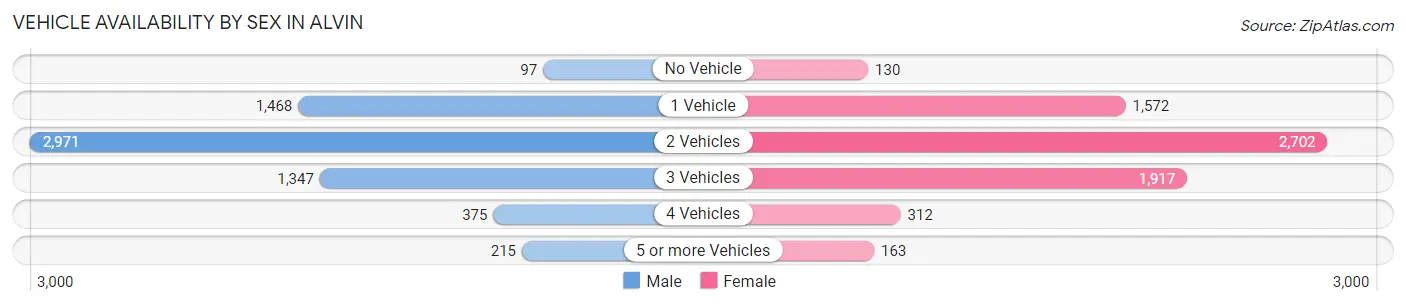
| Vehicles Available | Male | Female |
| No Vehicle | 97 (1.5%) | 130 (1.9%) |
| 1 Vehicle | 1,468 (22.7%) | 1,572 (23.1%) |
| 2 Vehicles | 2,971 (45.9%) | 2,702 (39.8%) |
| 3 Vehicles | 1,347 (20.8%) | 1,917 (28.2%) |
| 4 Vehicles | 375 (5.8%) | 312 (4.6%) |
| 5 or more Vehicles | 215 (3.3%) | 163 (2.4%) |
| Total | 6,473 (100.0%) | 6,796 (100.0%) |
Commute Time in Alvin
The most frequently occuring commute durations in Alvin are 45 to 59 minutes (1,890 commuters, 14.7%), 10 to 14 minutes (1,881 commuters, 14.7%), and 30 to 34 minutes (1,747 commuters, 13.6%).
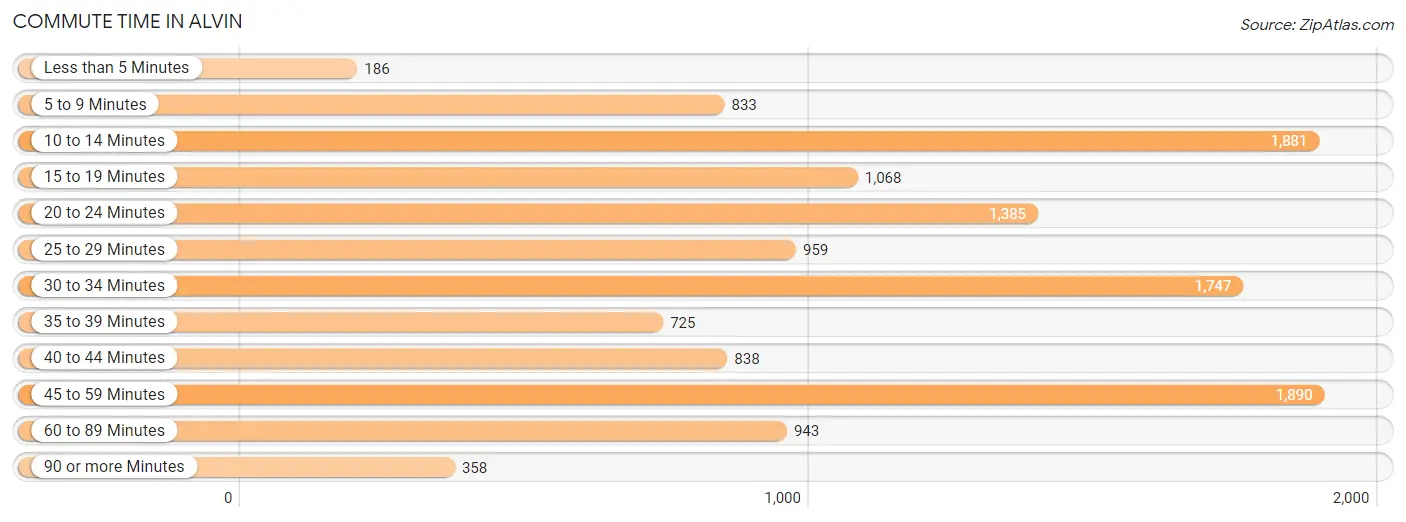
| Commute Time | # Commuters | % Commuters |
| Less than 5 Minutes | 186 | 1.5% |
| 5 to 9 Minutes | 833 | 6.5% |
| 10 to 14 Minutes | 1,881 | 14.7% |
| 15 to 19 Minutes | 1,068 | 8.3% |
| 20 to 24 Minutes | 1,385 | 10.8% |
| 25 to 29 Minutes | 959 | 7.5% |
| 30 to 34 Minutes | 1,747 | 13.6% |
| 35 to 39 Minutes | 725 | 5.7% |
| 40 to 44 Minutes | 838 | 6.5% |
| 45 to 59 Minutes | 1,890 | 14.7% |
| 60 to 89 Minutes | 943 | 7.4% |
| 90 or more Minutes | 358 | 2.8% |
Commute Time by Sex in Alvin
The most common commute times in Alvin are 45 to 59 minutes (1,185 commuters, 18.7%) for males and 10 to 14 minutes (1,143 commuters, 17.6%) for females.
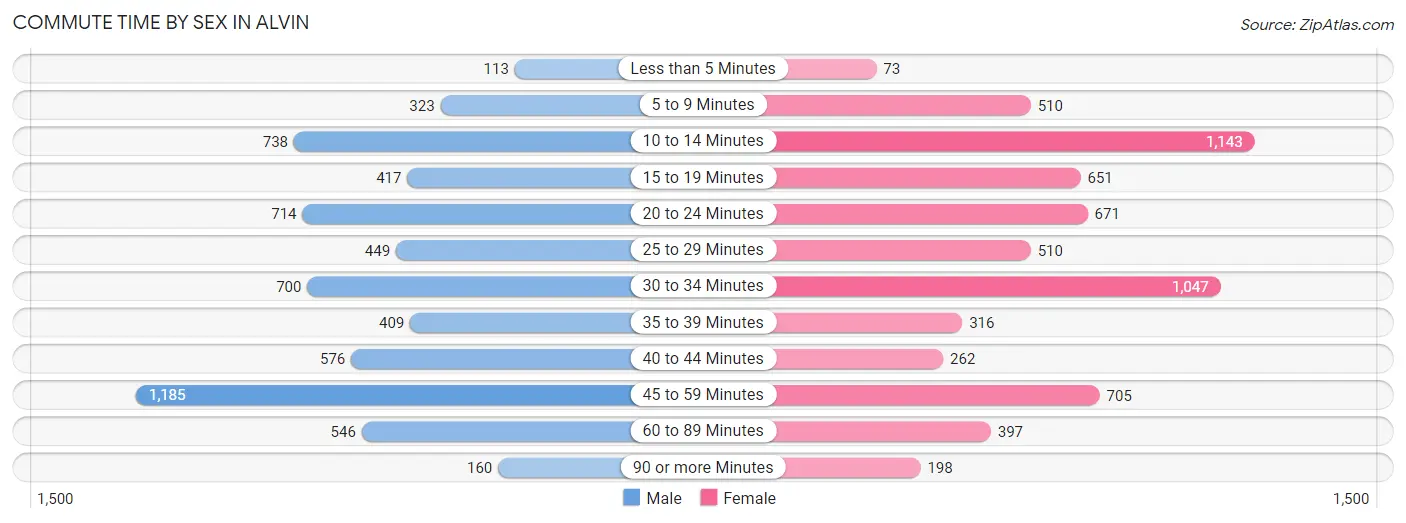
| Commute Time | Male | Female |
| Less than 5 Minutes | 113 (1.8%) | 73 (1.1%) |
| 5 to 9 Minutes | 323 (5.1%) | 510 (7.9%) |
| 10 to 14 Minutes | 738 (11.7%) | 1,143 (17.6%) |
| 15 to 19 Minutes | 417 (6.6%) | 651 (10.0%) |
| 20 to 24 Minutes | 714 (11.3%) | 671 (10.3%) |
| 25 to 29 Minutes | 449 (7.1%) | 510 (7.9%) |
| 30 to 34 Minutes | 700 (11.1%) | 1,047 (16.2%) |
| 35 to 39 Minutes | 409 (6.5%) | 316 (4.9%) |
| 40 to 44 Minutes | 576 (9.1%) | 262 (4.0%) |
| 45 to 59 Minutes | 1,185 (18.7%) | 705 (10.9%) |
| 60 to 89 Minutes | 546 (8.6%) | 397 (6.1%) |
| 90 or more Minutes | 160 (2.5%) | 198 (3.0%) |
Time of Departure to Work by Sex in Alvin
The most frequent times of departure to work in Alvin are 6:00 AM to 6:29 AM (1,369, 21.6%) for males and 7:30 AM to 7:59 AM (1,055, 16.3%) for females.
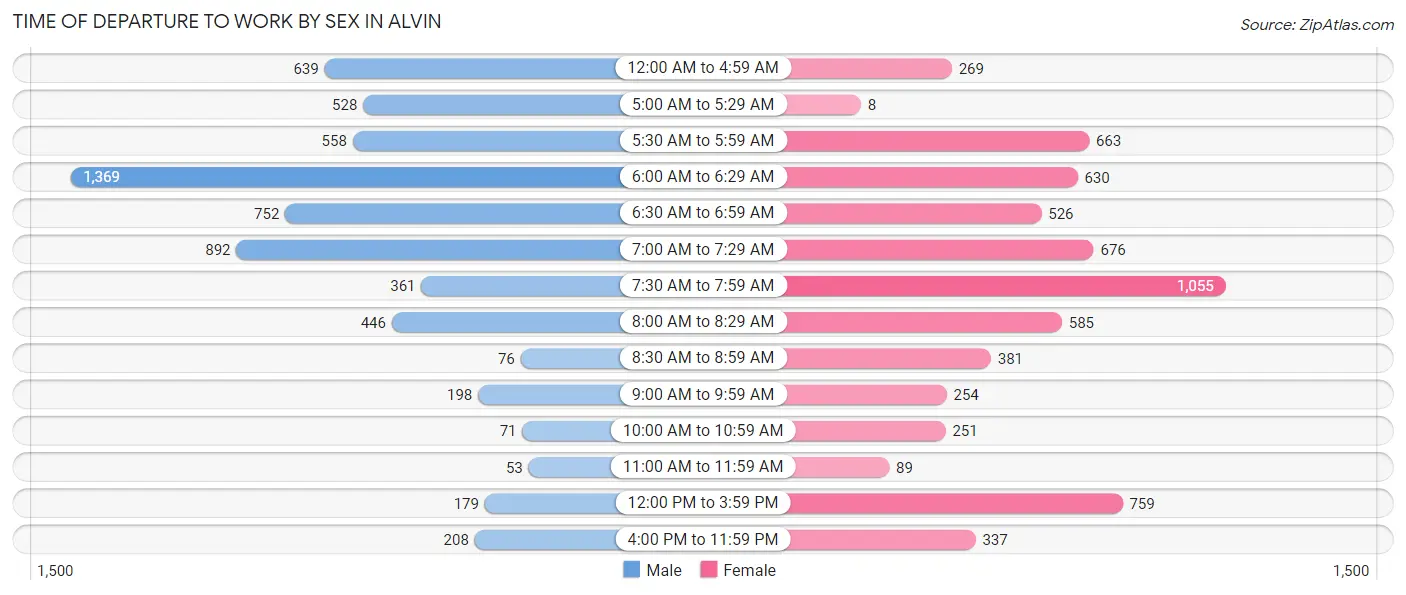
| Time of Departure | Male | Female |
| 12:00 AM to 4:59 AM | 639 (10.1%) | 269 (4.2%) |
| 5:00 AM to 5:29 AM | 528 (8.3%) | 8 (0.1%) |
| 5:30 AM to 5:59 AM | 558 (8.8%) | 663 (10.2%) |
| 6:00 AM to 6:29 AM | 1,369 (21.6%) | 630 (9.7%) |
| 6:30 AM to 6:59 AM | 752 (11.9%) | 526 (8.1%) |
| 7:00 AM to 7:29 AM | 892 (14.1%) | 676 (10.4%) |
| 7:30 AM to 7:59 AM | 361 (5.7%) | 1,055 (16.3%) |
| 8:00 AM to 8:29 AM | 446 (7.0%) | 585 (9.0%) |
| 8:30 AM to 8:59 AM | 76 (1.2%) | 381 (5.9%) |
| 9:00 AM to 9:59 AM | 198 (3.1%) | 254 (3.9%) |
| 10:00 AM to 10:59 AM | 71 (1.1%) | 251 (3.9%) |
| 11:00 AM to 11:59 AM | 53 (0.8%) | 89 (1.4%) |
| 12:00 PM to 3:59 PM | 179 (2.8%) | 759 (11.7%) |
| 4:00 PM to 11:59 PM | 208 (3.3%) | 337 (5.2%) |
| Total | 6,330 (100.0%) | 6,483 (100.0%) |
Housing Occupancy in Alvin
Occupancy by Ownership in Alvin
Of the total 10,294 dwellings in Alvin, owner-occupied units account for 5,869 (57.0%), while renter-occupied units make up 4,425 (43.0%).
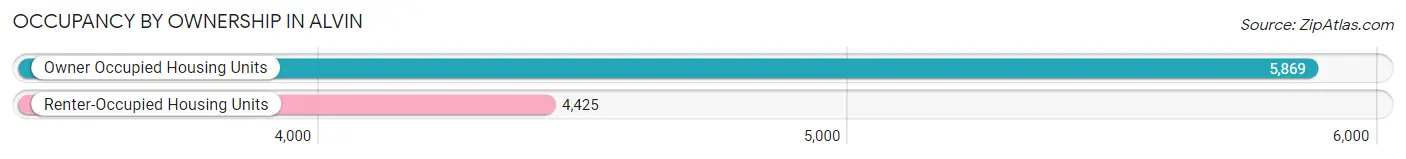
| Occupancy | # Housing Units | % Housing Units |
| Owner Occupied Housing Units | 5,869 | 57.0% |
| Renter-Occupied Housing Units | 4,425 | 43.0% |
| Total Occupied Housing Units | 10,294 | 100.0% |
Occupancy by Household Size in Alvin
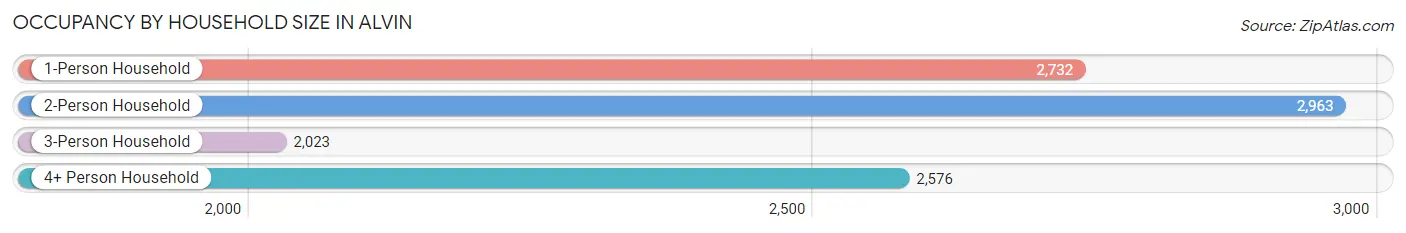
| Household Size | # Housing Units | % Housing Units |
| 1-Person Household | 2,732 | 26.5% |
| 2-Person Household | 2,963 | 28.8% |
| 3-Person Household | 2,023 | 19.7% |
| 4+ Person Household | 2,576 | 25.0% |
| Total Housing Units | 10,294 | 100.0% |
Occupancy by Ownership by Household Size in Alvin
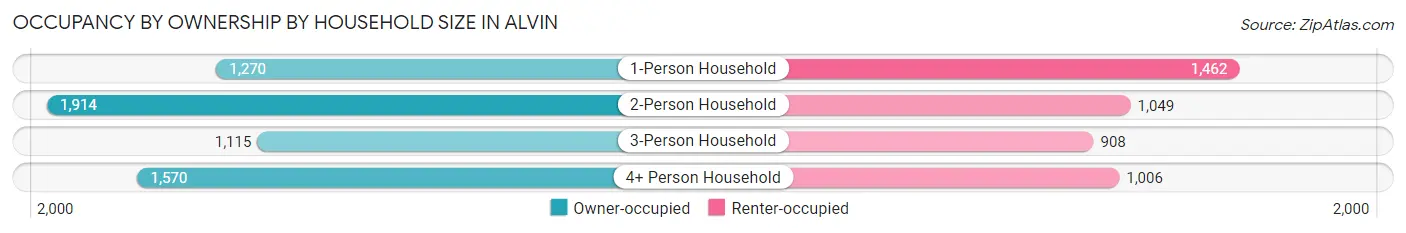
| Household Size | Owner-occupied | Renter-occupied |
| 1-Person Household | 1,270 (46.5%) | 1,462 (53.5%) |
| 2-Person Household | 1,914 (64.6%) | 1,049 (35.4%) |
| 3-Person Household | 1,115 (55.1%) | 908 (44.9%) |
| 4+ Person Household | 1,570 (61.0%) | 1,006 (39.1%) |
| Total Housing Units | 5,869 (57.0%) | 4,425 (43.0%) |
Occupancy by Educational Attainment in Alvin
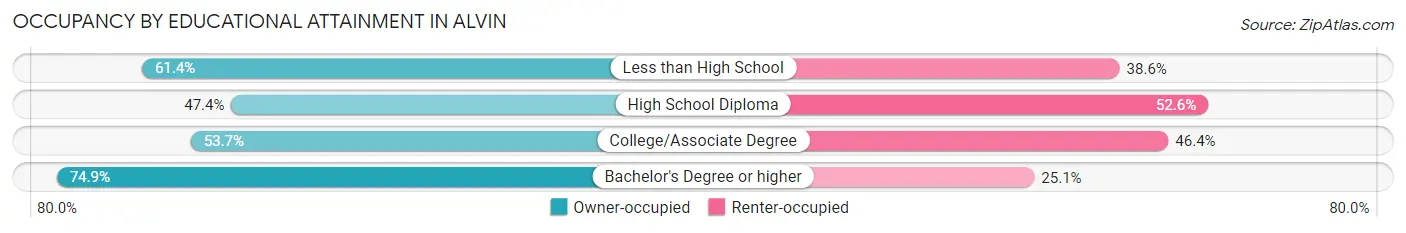
| Household Size | Owner-occupied | Renter-occupied |
| Less than High School | 704 (61.4%) | 443 (38.6%) |
| High School Diploma | 1,172 (47.4%) | 1,302 (52.6%) |
| College/Associate Degree | 2,537 (53.6%) | 2,192 (46.4%) |
| Bachelor's Degree or higher | 1,456 (74.9%) | 488 (25.1%) |
Occupancy by Age of Householder in Alvin
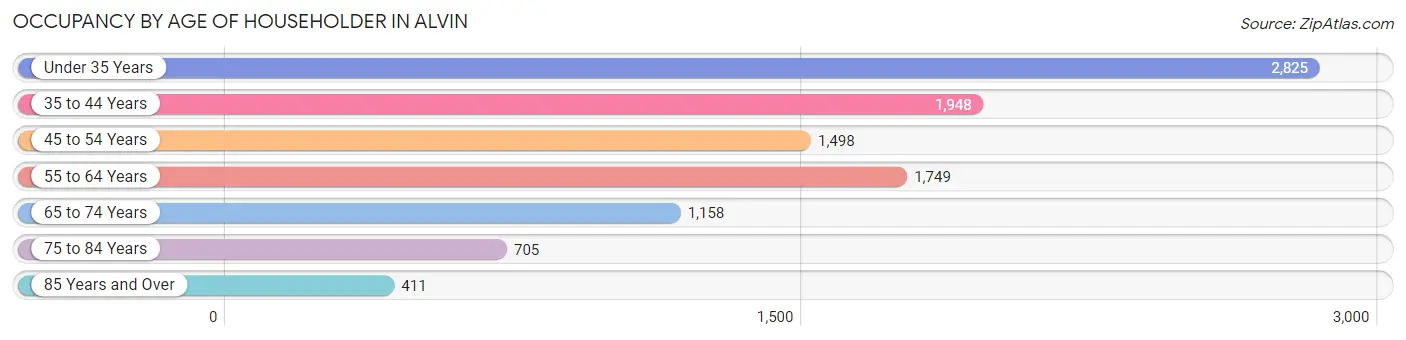
| Age Bracket | # Households | % Households |
| Under 35 Years | 2,825 | 27.4% |
| 35 to 44 Years | 1,948 | 18.9% |
| 45 to 54 Years | 1,498 | 14.5% |
| 55 to 64 Years | 1,749 | 17.0% |
| 65 to 74 Years | 1,158 | 11.3% |
| 75 to 84 Years | 705 | 6.9% |
| 85 Years and Over | 411 | 4.0% |
| Total | 10,294 | 100.0% |
Housing Finances in Alvin
Median Income by Occupancy in Alvin
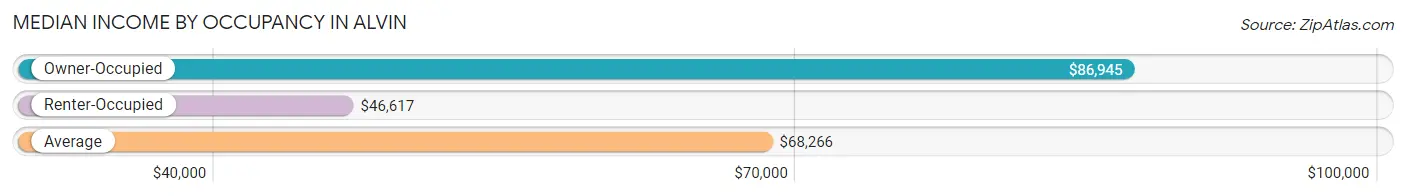
| Occupancy Type | # Households | Median Income |
| Owner-Occupied | 5,869 (57.0%) | $86,945 |
| Renter-Occupied | 4,425 (43.0%) | $46,617 |
| Average | 10,294 (100.0%) | $68,266 |
Occupancy by Householder Income Bracket in Alvin
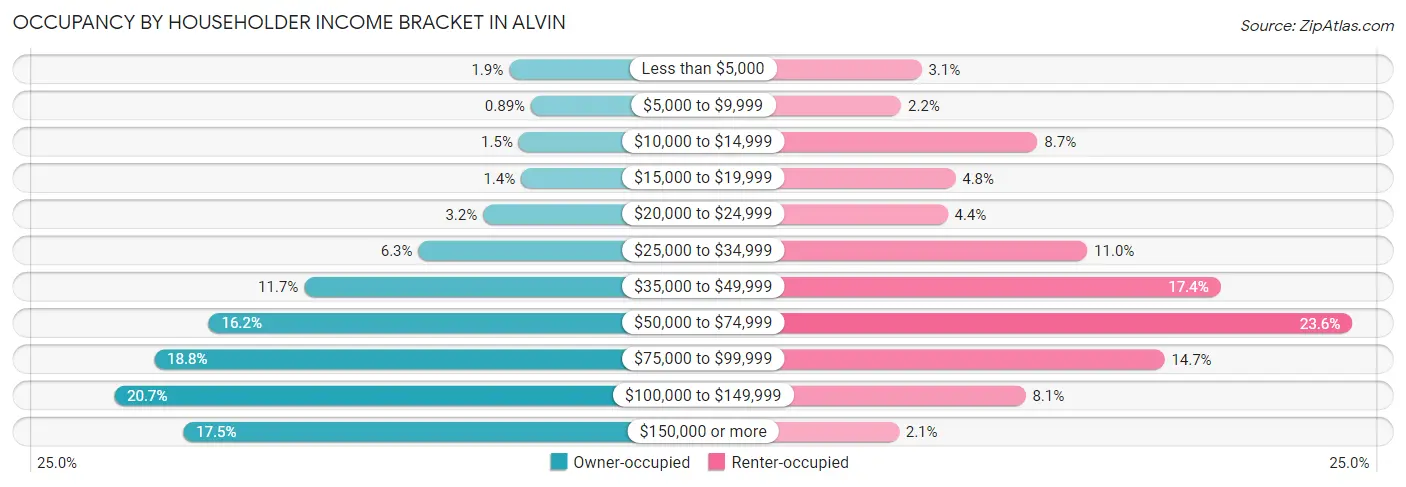
| Income Bracket | Owner-occupied | Renter-occupied |
| Less than $5,000 | 113 (1.9%) | 139 (3.1%) |
| $5,000 to $9,999 | 52 (0.9%) | 96 (2.2%) |
| $10,000 to $14,999 | 86 (1.5%) | 383 (8.7%) |
| $15,000 to $19,999 | 80 (1.4%) | 210 (4.8%) |
| $20,000 to $24,999 | 186 (3.2%) | 194 (4.4%) |
| $25,000 to $34,999 | 367 (6.2%) | 488 (11.0%) |
| $35,000 to $49,999 | 686 (11.7%) | 769 (17.4%) |
| $50,000 to $74,999 | 953 (16.2%) | 1,046 (23.6%) |
| $75,000 to $99,999 | 1,105 (18.8%) | 651 (14.7%) |
| $100,000 to $149,999 | 1,217 (20.7%) | 358 (8.1%) |
| $150,000 or more | 1,024 (17.4%) | 91 (2.1%) |
| Total | 5,869 (100.0%) | 4,425 (100.0%) |
Monthly Housing Cost Tiers in Alvin
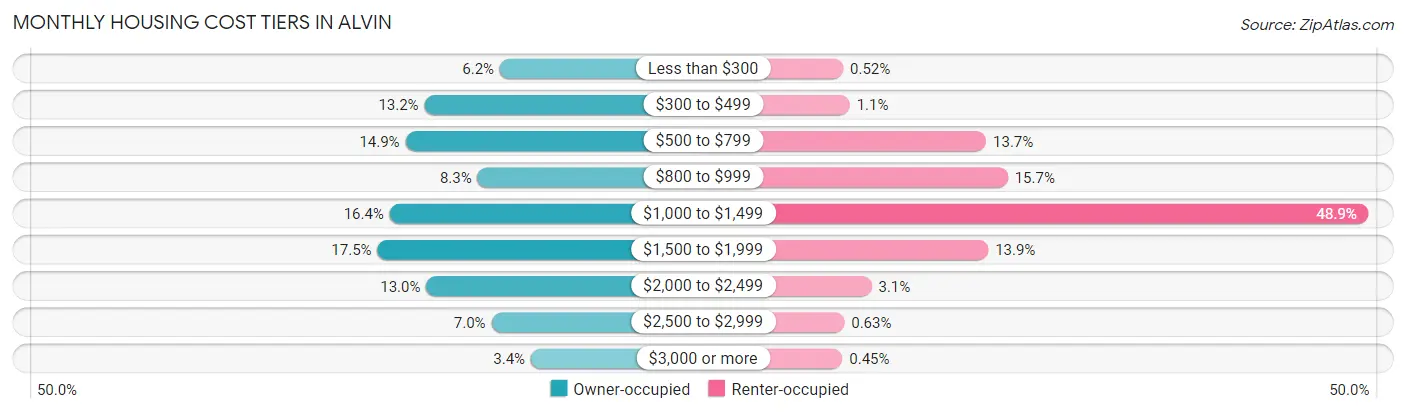
| Monthly Cost | Owner-occupied | Renter-occupied |
| Less than $300 | 366 (6.2%) | 23 (0.5%) |
| $300 to $499 | 774 (13.2%) | 50 (1.1%) |
| $500 to $799 | 877 (14.9%) | 606 (13.7%) |
| $800 to $999 | 487 (8.3%) | 694 (15.7%) |
| $1,000 to $1,499 | 962 (16.4%) | 2,164 (48.9%) |
| $1,500 to $1,999 | 1,028 (17.5%) | 614 (13.9%) |
| $2,000 to $2,499 | 764 (13.0%) | 139 (3.1%) |
| $2,500 to $2,999 | 412 (7.0%) | 28 (0.6%) |
| $3,000 or more | 199 (3.4%) | 20 (0.4%) |
| Total | 5,869 (100.0%) | 4,425 (100.0%) |
Physical Housing Characteristics in Alvin
Housing Structures in Alvin
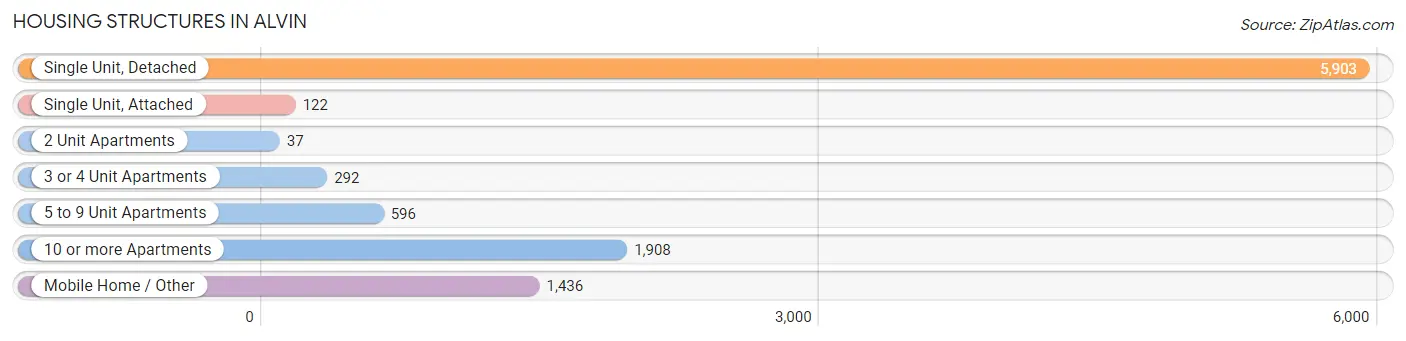
| Structure Type | # Housing Units | % Housing Units |
| Single Unit, Detached | 5,903 | 57.3% |
| Single Unit, Attached | 122 | 1.2% |
| 2 Unit Apartments | 37 | 0.4% |
| 3 or 4 Unit Apartments | 292 | 2.8% |
| 5 to 9 Unit Apartments | 596 | 5.8% |
| 10 or more Apartments | 1,908 | 18.5% |
| Mobile Home / Other | 1,436 | 14.0% |
| Total | 10,294 | 100.0% |
Housing Structures by Occupancy in Alvin
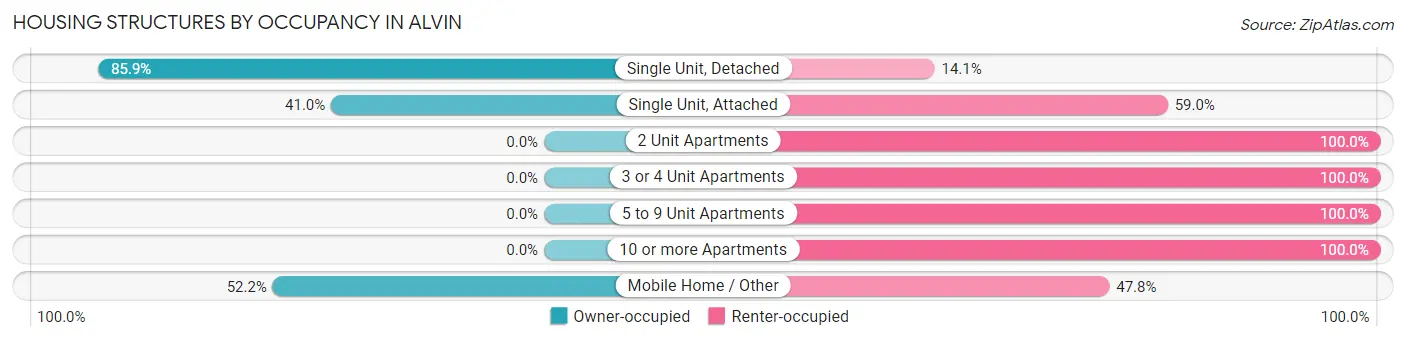
| Structure Type | Owner-occupied | Renter-occupied |
| Single Unit, Detached | 5,069 (85.9%) | 834 (14.1%) |
| Single Unit, Attached | 50 (41.0%) | 72 (59.0%) |
| 2 Unit Apartments | 0 (0.0%) | 37 (100.0%) |
| 3 or 4 Unit Apartments | 0 (0.0%) | 292 (100.0%) |
| 5 to 9 Unit Apartments | 0 (0.0%) | 596 (100.0%) |
| 10 or more Apartments | 0 (0.0%) | 1,908 (100.0%) |
| Mobile Home / Other | 750 (52.2%) | 686 (47.8%) |
| Total | 5,869 (57.0%) | 4,425 (43.0%) |
Housing Structures by Number of Rooms in Alvin
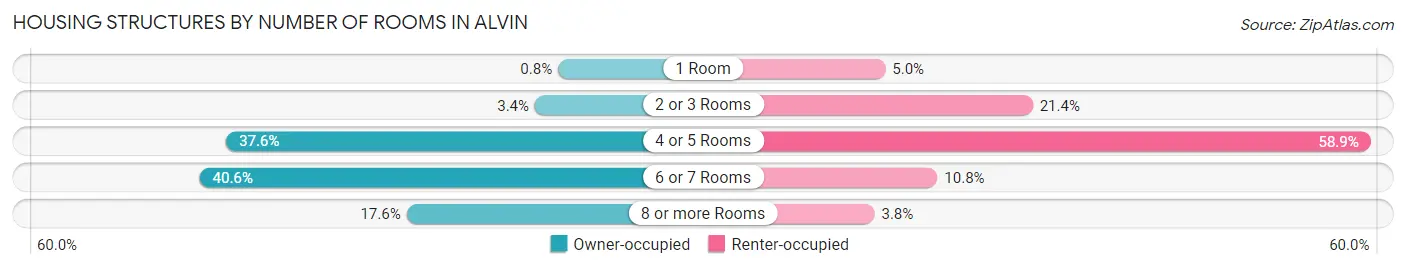
| Number of Rooms | Owner-occupied | Renter-occupied |
| 1 Room | 47 (0.8%) | 223 (5.0%) |
| 2 or 3 Rooms | 198 (3.4%) | 947 (21.4%) |
| 4 or 5 Rooms | 2,209 (37.6%) | 2,606 (58.9%) |
| 6 or 7 Rooms | 2,381 (40.6%) | 479 (10.8%) |
| 8 or more Rooms | 1,034 (17.6%) | 170 (3.8%) |
| Total | 5,869 (100.0%) | 4,425 (100.0%) |
Housing Structure by Heating Type in Alvin
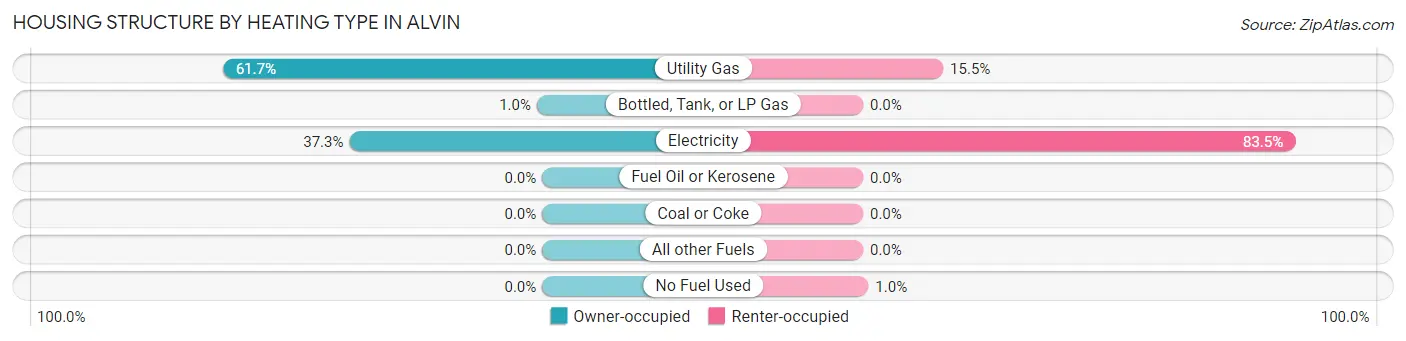
| Heating Type | Owner-occupied | Renter-occupied |
| Utility Gas | 3,622 (61.7%) | 685 (15.5%) |
| Bottled, Tank, or LP Gas | 60 (1.0%) | 0 (0.0%) |
| Electricity | 2,187 (37.3%) | 3,694 (83.5%) |
| Fuel Oil or Kerosene | 0 (0.0%) | 0 (0.0%) |
| Coal or Coke | 0 (0.0%) | 0 (0.0%) |
| All other Fuels | 0 (0.0%) | 0 (0.0%) |
| No Fuel Used | 0 (0.0%) | 46 (1.0%) |
| Total | 5,869 (100.0%) | 4,425 (100.0%) |
Household Vehicle Usage in Alvin
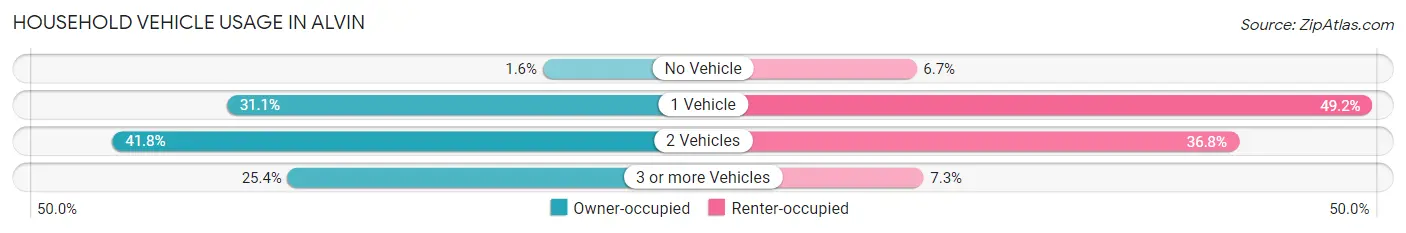
| Vehicles per Household | Owner-occupied | Renter-occupied |
| No Vehicle | 95 (1.6%) | 295 (6.7%) |
| 1 Vehicle | 1,827 (31.1%) | 2,179 (49.2%) |
| 2 Vehicles | 2,454 (41.8%) | 1,627 (36.8%) |
| 3 or more Vehicles | 1,493 (25.4%) | 324 (7.3%) |
| Total | 5,869 (100.0%) | 4,425 (100.0%) |
Real Estate & Mortgages in Alvin
Real Estate and Mortgage Overview in Alvin
| Characteristic | Without Mortgage | With Mortgage |
| Housing Units | 2,570 | 3,299 |
| Median Property Value | $144,400 | $219,600 |
| Median Household Income | $54,350 | $790 |
| Monthly Housing Costs | $568 | $189 |
| Real Estate Taxes | $2,164 | $143 |
Property Value by Mortgage Status in Alvin
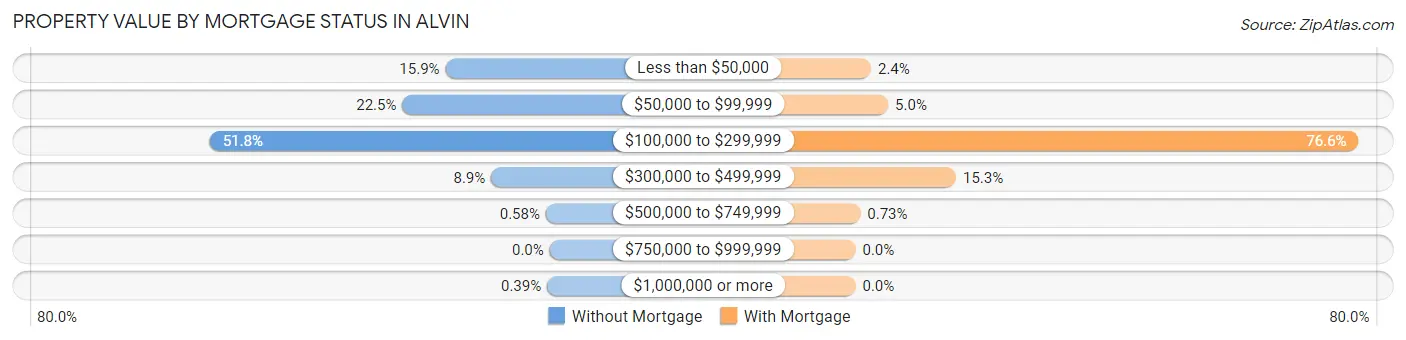
| Property Value | Without Mortgage | With Mortgage |
| Less than $50,000 | 408 (15.9%) | 78 (2.4%) |
| $50,000 to $99,999 | 577 (22.5%) | 164 (5.0%) |
| $100,000 to $299,999 | 1,331 (51.8%) | 2,528 (76.6%) |
| $300,000 to $499,999 | 229 (8.9%) | 505 (15.3%) |
| $500,000 to $749,999 | 15 (0.6%) | 24 (0.7%) |
| $750,000 to $999,999 | 0 (0.0%) | 0 (0.0%) |
| $1,000,000 or more | 10 (0.4%) | 0 (0.0%) |
| Total | 2,570 (100.0%) | 3,299 (100.0%) |
Household Income by Mortgage Status in Alvin
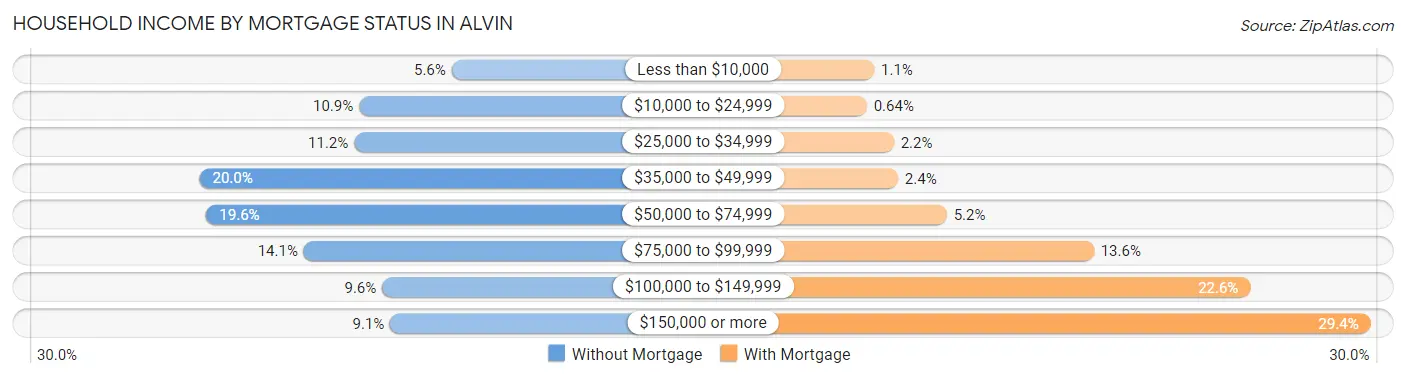
| Household Income | Without Mortgage | With Mortgage |
| Less than $10,000 | 144 (5.6%) | 35 (1.1%) |
| $10,000 to $24,999 | 280 (10.9%) | 21 (0.6%) |
| $25,000 to $34,999 | 287 (11.2%) | 72 (2.2%) |
| $35,000 to $49,999 | 514 (20.0%) | 80 (2.4%) |
| $50,000 to $74,999 | 504 (19.6%) | 172 (5.2%) |
| $75,000 to $99,999 | 361 (14.1%) | 449 (13.6%) |
| $100,000 to $149,999 | 246 (9.6%) | 744 (22.6%) |
| $150,000 or more | 234 (9.1%) | 971 (29.4%) |
| Total | 2,570 (100.0%) | 3,299 (100.0%) |
Property Value to Household Income Ratio in Alvin
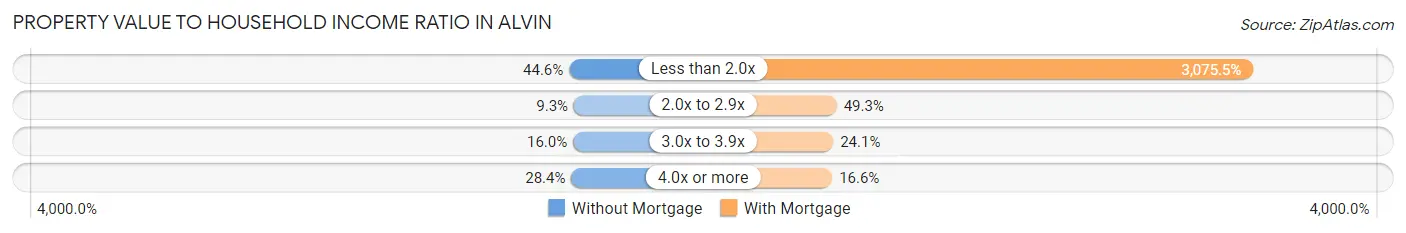
| Value-to-Income Ratio | Without Mortgage | With Mortgage |
| Less than 2.0x | 1,145 (44.6%) | 101,459 (3,075.5%) |
| 2.0x to 2.9x | 239 (9.3%) | 1,625 (49.3%) |
| 3.0x to 3.9x | 412 (16.0%) | 796 (24.1%) |
| 4.0x or more | 730 (28.4%) | 546 (16.6%) |
| Total | 2,570 (100.0%) | 3,299 (100.0%) |
Real Estate Taxes by Mortgage Status in Alvin
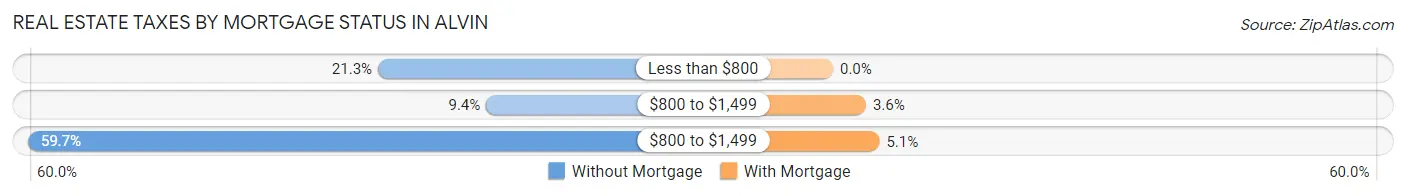
| Property Taxes | Without Mortgage | With Mortgage |
| Less than $800 | 547 (21.3%) | 0 (0.0%) |
| $800 to $1,499 | 242 (9.4%) | 119 (3.6%) |
| $800 to $1,499 | 1,533 (59.7%) | 168 (5.1%) |
| Total | 2,570 (100.0%) | 3,299 (100.0%) |
Health & Disability in Alvin
Health Insurance Coverage by Age in Alvin
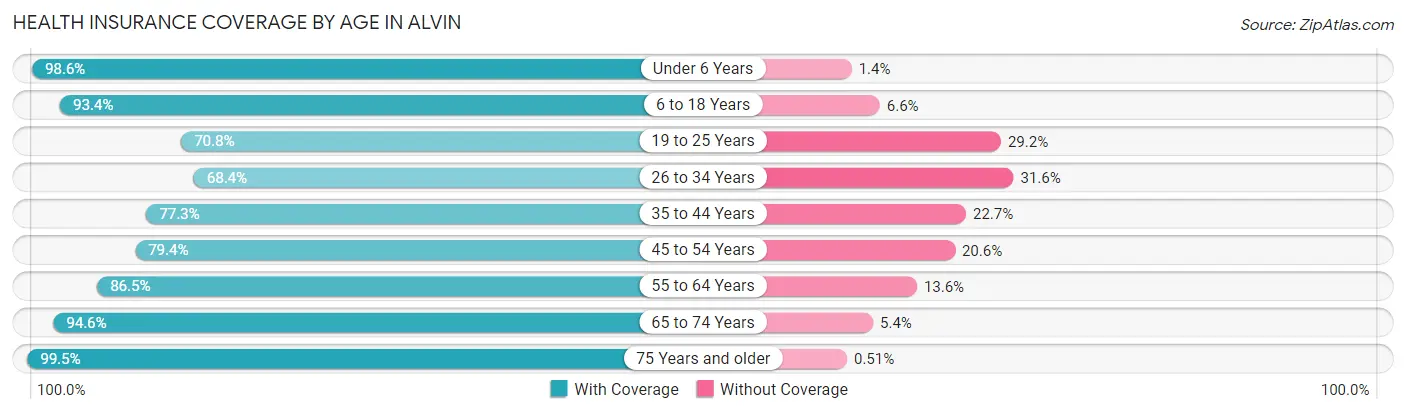
| Age Bracket | With Coverage | Without Coverage |
| Under 6 Years | 2,506 (98.6%) | 35 (1.4%) |
| 6 to 18 Years | 4,961 (93.4%) | 352 (6.6%) |
| 19 to 25 Years | 2,042 (70.8%) | 843 (29.2%) |
| 26 to 34 Years | 2,480 (68.4%) | 1,144 (31.6%) |
| 35 to 44 Years | 2,801 (77.3%) | 823 (22.7%) |
| 45 to 54 Years | 2,184 (79.4%) | 568 (20.6%) |
| 55 to 64 Years | 2,457 (86.5%) | 385 (13.6%) |
| 65 to 74 Years | 1,973 (94.6%) | 112 (5.4%) |
| 75 Years and older | 1,570 (99.5%) | 8 (0.5%) |
| Total | 22,974 (84.3%) | 4,270 (15.7%) |
Health Insurance Coverage by Citizenship Status in Alvin
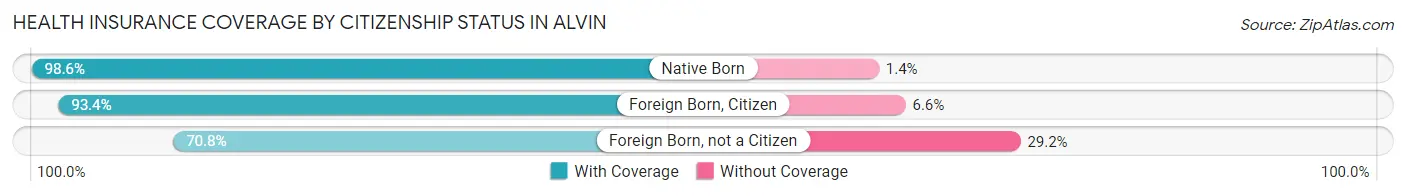
| Citizenship Status | With Coverage | Without Coverage |
| Native Born | 2,506 (98.6%) | 35 (1.4%) |
| Foreign Born, Citizen | 4,961 (93.4%) | 352 (6.6%) |
| Foreign Born, not a Citizen | 2,042 (70.8%) | 843 (29.2%) |
Health Insurance Coverage by Household Income in Alvin
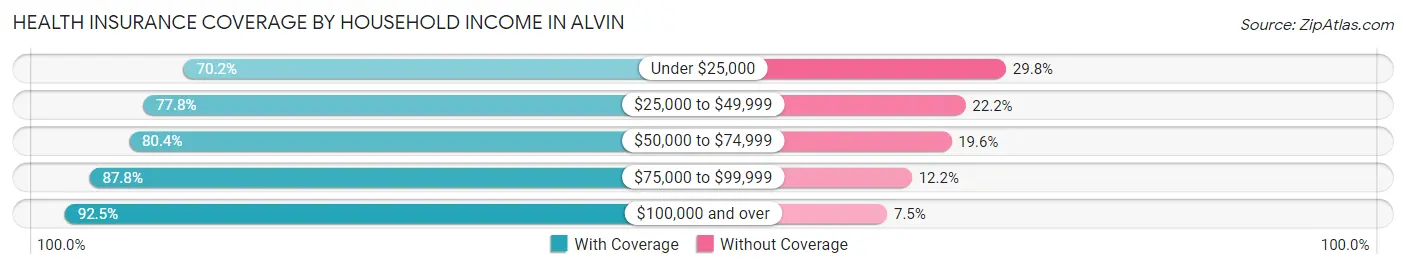
| Household Income | With Coverage | Without Coverage |
| Under $25,000 | 1,910 (70.2%) | 811 (29.8%) |
| $25,000 to $49,999 | 3,545 (77.8%) | 1,013 (22.2%) |
| $50,000 to $74,999 | 4,828 (80.4%) | 1,174 (19.6%) |
| $75,000 to $99,999 | 4,048 (87.8%) | 561 (12.2%) |
| $100,000 and over | 8,616 (92.5%) | 703 (7.5%) |
Public vs Private Health Insurance Coverage by Age in Alvin
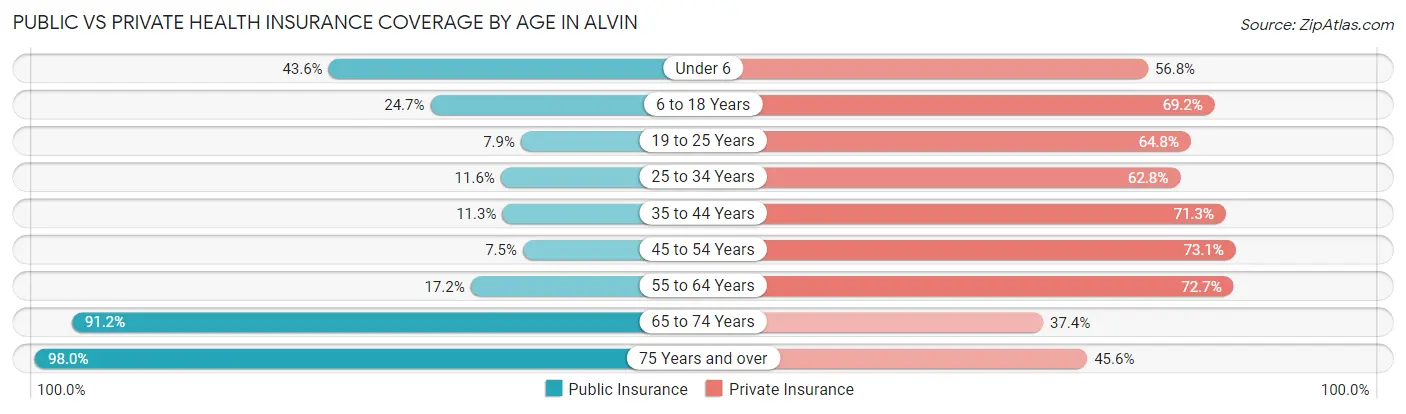
| Age Bracket | Public Insurance | Private Insurance |
| Under 6 | 1,108 (43.6%) | 1,444 (56.8%) |
| 6 to 18 Years | 1,312 (24.7%) | 3,677 (69.2%) |
| 19 to 25 Years | 228 (7.9%) | 1,869 (64.8%) |
| 25 to 34 Years | 422 (11.6%) | 2,275 (62.8%) |
| 35 to 44 Years | 411 (11.3%) | 2,583 (71.3%) |
| 45 to 54 Years | 207 (7.5%) | 2,012 (73.1%) |
| 55 to 64 Years | 490 (17.2%) | 2,066 (72.7%) |
| 65 to 74 Years | 1,902 (91.2%) | 779 (37.4%) |
| 75 Years and over | 1,547 (98.0%) | 719 (45.6%) |
| Total | 7,627 (28.0%) | 17,424 (64.0%) |
Disability Status by Sex by Age in Alvin
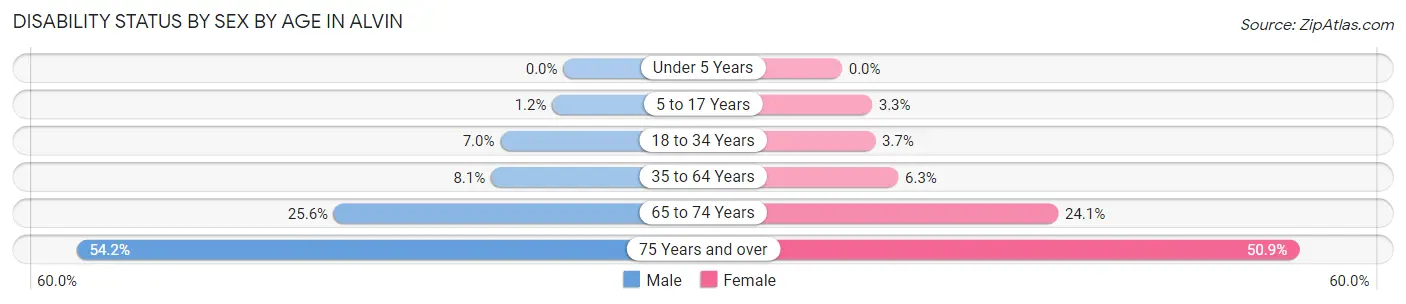
| Age Bracket | Male | Female |
| Under 5 Years | 0 (0.0%) | 0 (0.0%) |
| 5 to 17 Years | 36 (1.2%) | 74 (3.3%) |
| 18 to 34 Years | 232 (7.0%) | 137 (3.7%) |
| 35 to 64 Years | 352 (8.1%) | 304 (6.3%) |
| 65 to 74 Years | 208 (25.6%) | 306 (24.1%) |
| 75 Years and over | 353 (54.2%) | 472 (50.9%) |
Disability Class by Sex by Age in Alvin
Disability Class: Hearing Difficulty
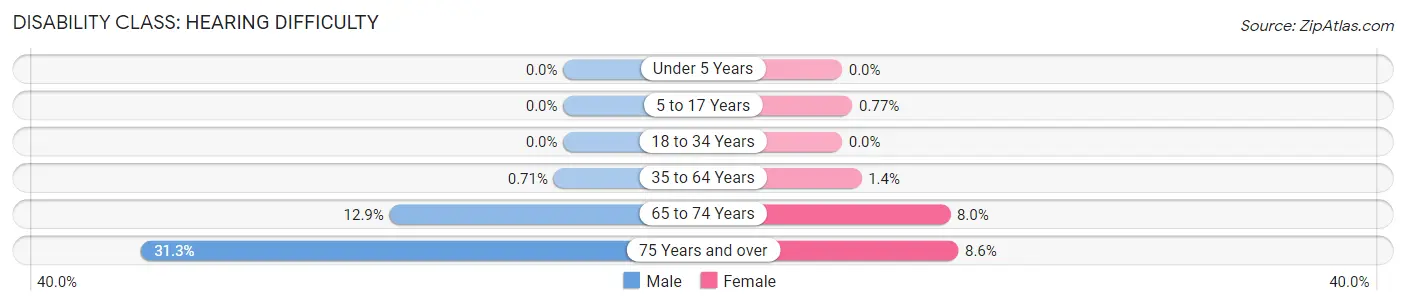
| Age Bracket | Male | Female |
| Under 5 Years | 0 (0.0%) | 0 (0.0%) |
| 5 to 17 Years | 0 (0.0%) | 17 (0.8%) |
| 18 to 34 Years | 0 (0.0%) | 0 (0.0%) |
| 35 to 64 Years | 31 (0.7%) | 70 (1.4%) |
| 65 to 74 Years | 105 (12.9%) | 102 (8.0%) |
| 75 Years and over | 204 (31.3%) | 80 (8.6%) |
Disability Class: Vision Difficulty
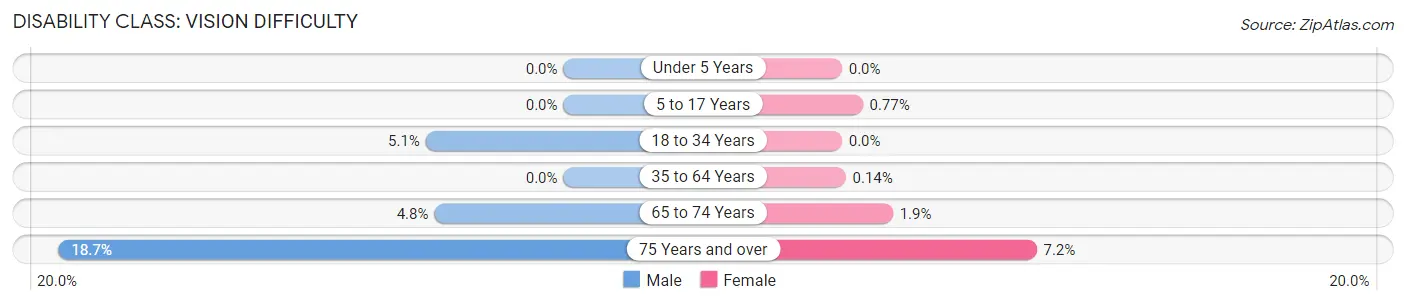
| Age Bracket | Male | Female |
| Under 5 Years | 0 (0.0%) | 0 (0.0%) |
| 5 to 17 Years | 0 (0.0%) | 17 (0.8%) |
| 18 to 34 Years | 169 (5.1%) | 0 (0.0%) |
| 35 to 64 Years | 0 (0.0%) | 7 (0.1%) |
| 65 to 74 Years | 39 (4.8%) | 24 (1.9%) |
| 75 Years and over | 122 (18.7%) | 67 (7.2%) |
Disability Class: Cognitive Difficulty
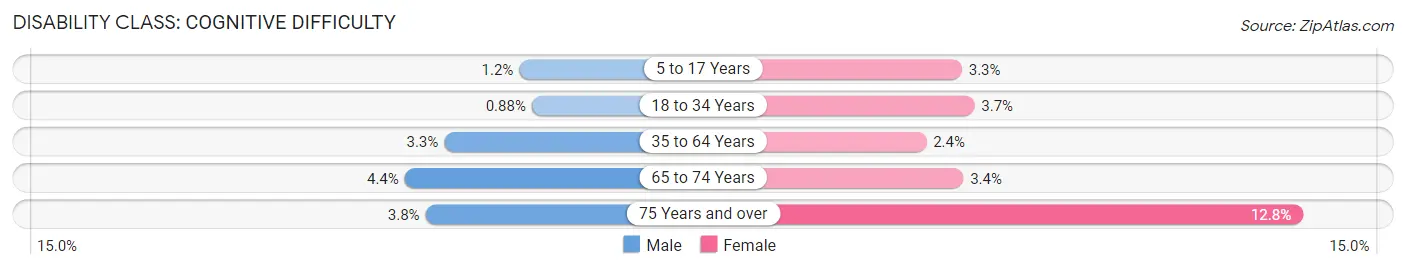
| Age Bracket | Male | Female |
| 5 to 17 Years | 36 (1.2%) | 74 (3.3%) |
| 18 to 34 Years | 29 (0.9%) | 137 (3.7%) |
| 35 to 64 Years | 145 (3.3%) | 114 (2.4%) |
| 65 to 74 Years | 36 (4.4%) | 43 (3.4%) |
| 75 Years and over | 25 (3.8%) | 119 (12.8%) |
Disability Class: Ambulatory Difficulty
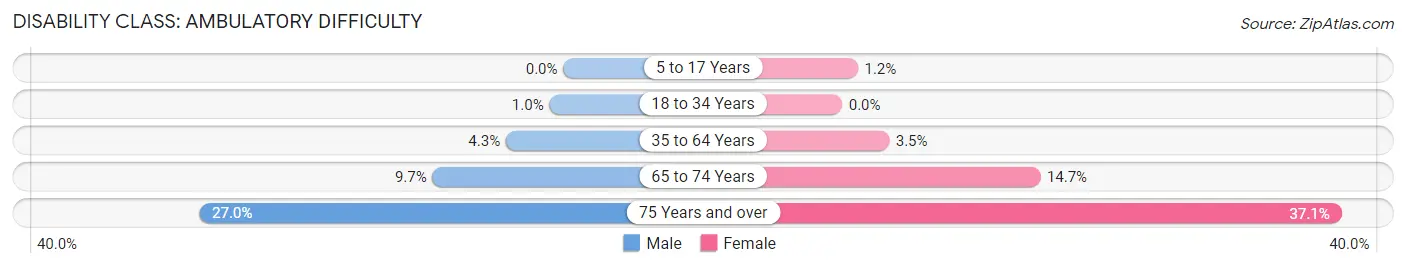
| Age Bracket | Male | Female |
| 5 to 17 Years | 0 (0.0%) | 26 (1.2%) |
| 18 to 34 Years | 34 (1.0%) | 0 (0.0%) |
| 35 to 64 Years | 186 (4.3%) | 169 (3.5%) |
| 65 to 74 Years | 79 (9.7%) | 187 (14.7%) |
| 75 Years and over | 176 (27.0%) | 344 (37.1%) |
Disability Class: Self-Care Difficulty
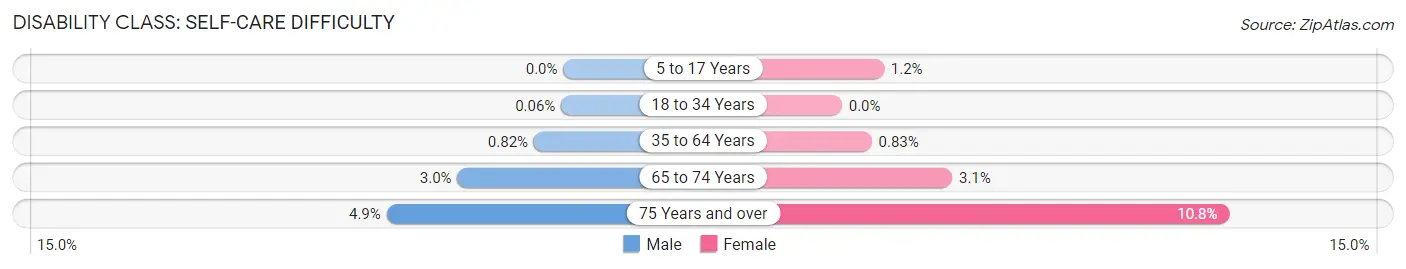
| Age Bracket | Male | Female |
| 5 to 17 Years | 0 (0.0%) | 26 (1.2%) |
| 18 to 34 Years | 2 (0.1%) | 0 (0.0%) |
| 35 to 64 Years | 36 (0.8%) | 40 (0.8%) |
| 65 to 74 Years | 24 (2.9%) | 39 (3.1%) |
| 75 Years and over | 32 (4.9%) | 100 (10.8%) |
Technology Access in Alvin
Computing Device Access in Alvin
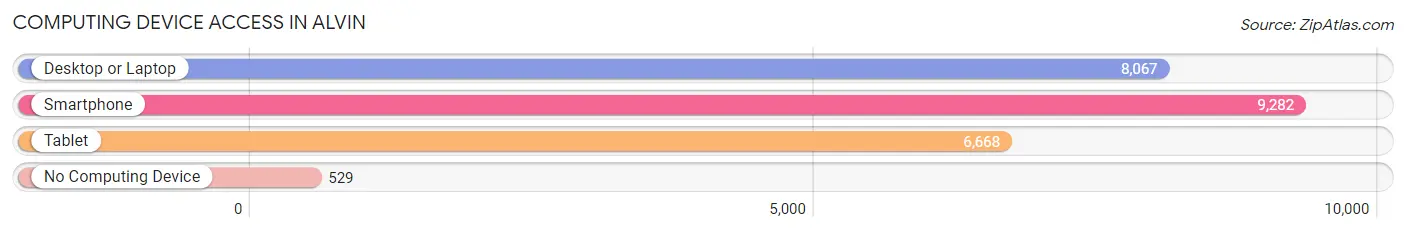
| Device Type | # Households | % Households |
| Desktop or Laptop | 8,067 | 78.4% |
| Smartphone | 9,282 | 90.2% |
| Tablet | 6,668 | 64.8% |
| No Computing Device | 529 | 5.1% |
| Total | 10,294 | 100.0% |
Internet Access in Alvin
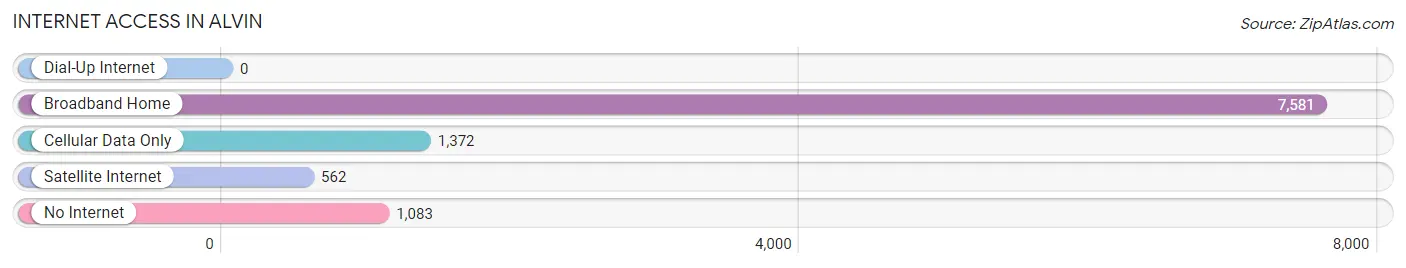
| Internet Type | # Households | % Households |
| Dial-Up Internet | 0 | 0.0% |
| Broadband Home | 7,581 | 73.6% |
| Cellular Data Only | 1,372 | 13.3% |
| Satellite Internet | 562 | 5.5% |
| No Internet | 1,083 | 10.5% |
| Total | 10,294 | 100.0% |
Alvin Summary
Alvin, Texas is a city located in Brazoria County, Texas, United States. It is located within the Houston–The Woodlands–Sugar Land metropolitan area. As of the 2010 census, the city population was 24,236.
History
Alvin was founded in 1873 by a group of settlers from Kentucky and named after Alvin Morgan, the son of one of the settlers. The town was incorporated in 1893 and was the first city in Brazoria County to have electricity.
In the early 1900s, Alvin was a thriving agricultural community, with cotton, corn, and sugar cane being the main crops. The town also had a number of businesses, including a bank, a hotel, a drug store, and a blacksmith shop.
In the 1920s, the town began to experience a population boom, as oil was discovered in the area. This led to an influx of new residents and businesses, and the town began to grow rapidly.
In the 1950s, Alvin began to experience a decline in population, as many of the oil fields in the area had been depleted. However, the town was able to rebound in the 1960s, when the Alvin Community College was established.
Geography
Alvin is located in southeastern Brazoria County, approximately 30 miles south of Houston. The city is situated on the Gulf Coastal Plain, and is bordered by the cities of Pearland, Manvel, and Friendswood.
The city has a total area of 16.2 square miles, of which 16.1 square miles is land and 0.1 square miles is water.
Economy
Alvin’s economy is largely based on the oil and gas industry, as well as agriculture. The city is home to several oil and gas companies, including Chevron, Shell, and ExxonMobil.
Agriculture is also an important part of the local economy, with cotton, corn, and sugar cane being the main crops. The city is also home to several manufacturing companies, including a paper mill and a plastics plant.
Demographics
As of the 2010 census, the city had a population of 24,236. The racial makeup of the city was 73.3% White, 11.3% African American, 0.7% Native American, 1.2% Asian, 0.1% Pacific Islander, 11.2% from other races, and 2.2% from two or more races. Hispanic or Latino of any race were 24.3% of the population.
The median income for a household in the city was $45,945, and the median income for a family was $51,945. The per capita income for the city was $20,945. About 11.3% of families and 14.2% of the population were below the poverty line, including 19.2% of those under age 18 and 8.2% of those age 65 or over.
Common Questions
What is Per Capita Income in Alvin?
Per Capita income in Alvin is $29,540.
What is the Median Family Income in Alvin?
Median Family Income in Alvin is $81,890.
What is the Median Household income in Alvin?
Median Household Income in Alvin is $68,266.
What is Income or Wage Gap in Alvin?
Income or Wage Gap in Alvin is 30.8%.
Women in Alvin earn 69.2 cents for every dollar earned by a man.
What is Family Income Deficit in Alvin?
Family Income Deficit in Alvin is $10,594.
Families that are below poverty line in Alvin earn $10,594 less on average than the poverty threshold level.
What is Inequality or Gini Index in Alvin?
Inequality or Gini Index in Alvin is 0.39.
What is the Total Population of Alvin?
Total Population of Alvin is 27,325.
What is the Total Male Population of Alvin?
Total Male Population of Alvin is 13,122.
What is the Total Female Population of Alvin?
Total Female Population of Alvin is 14,203.
What is the Ratio of Males per 100 Females in Alvin?
There are 92.39 Males per 100 Females in Alvin.
What is the Ratio of Females per 100 Males in Alvin?
There are 108.24 Females per 100 Males in Alvin.
What is the Median Population Age in Alvin?
Median Population Age in Alvin is 33.7 Years.
What is the Average Family Size in Alvin
Average Family Size in Alvin is 3.3 People.
What is the Average Household Size in Alvin
Average Household Size in Alvin is 2.6 People.
How Large is the Labor Force in Alvin?
There are 13,711 People in the Labor Forcein in Alvin.
What is the Percentage of People in the Labor Force in Alvin?
66.1% of People are in the Labor Force in Alvin.
What is the Unemployment Rate in Alvin?
Unemployment Rate in Alvin is 3.0%.