South Alamo, TX Map & Demographics
South Alamo Map
South Alamo Overview
$21,748
PER CAPITA INCOME
$35,742
AVG HOUSEHOLD INCOME
64.1%
WAGE / INCOME GAP [ % ]
35.9¢/ $1
WAGE / INCOME GAP [ $ ]
0.52
INEQUALITY / GINI INDEX
3,433
TOTAL POPULATION
1,849
MALE POPULATION
1,584
FEMALE POPULATION
116.73
MALES / 100 FEMALES
85.67
FEMALES / 100 MALES
29.9
MEDIAN AGE
4.5
AVG FAMILY SIZE
3.7
AVG HOUSEHOLD SIZE
1,526
LABOR FORCE [ PEOPLE ]
60.5%
PERCENT IN LABOR FORCE
9.3%
UNEMPLOYMENT RATE
Income in South Alamo
Income Overview in South Alamo
| Characteristic | Number | Measure |
| Per Capita Income | 3,433 | $21,748 |
| Median Family Income | 696 | $0 |
| Mean Family Income | 696 | $85,640 |
| Median Household Income | 931 | $35,742 |
| Mean Household Income | 931 | $72,309 |
| Income Deficit | 696 | $0 |
| Wage / Income Gap (%) | 3,433 | 64.08% |
| Wage / Income Gap ($) | 3,433 | 35.92¢ per $1 |
| Gini / Inequality Index | 3,433 | 0.52 |
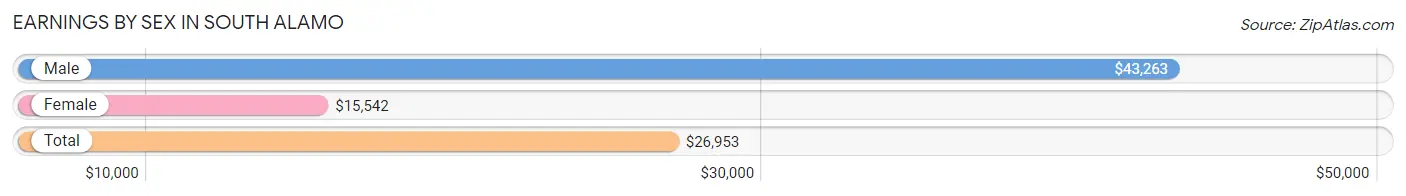
Earnings by Sex in South Alamo
Average Earnings in South Alamo are $26,953, $43,263 for men and $15,542 for women, a difference of 64.1%.
| Sex | Number | Average Earnings |
| Male | 1,078 (64.2%) | $43,263 |
| Female | 602 (35.8%) | $15,542 |
| Total | 1,680 (100.0%) | $26,953 |
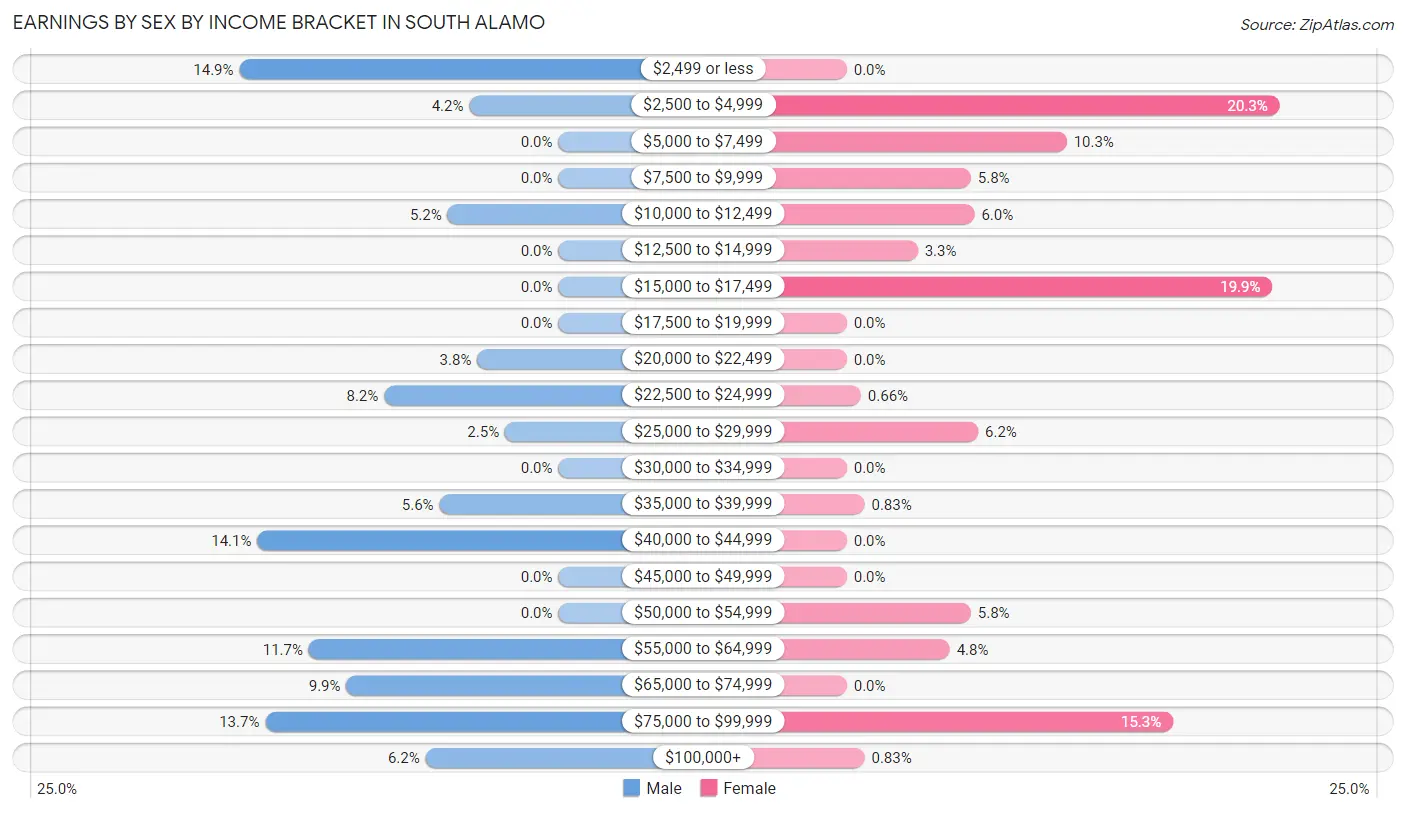
Earnings by Sex by Income Bracket in South Alamo
The most common earnings brackets in South Alamo are $2,499 or less for men (161 | 14.9%) and $2,500 to $4,999 for women (122 | 20.3%).
| Income | Male | Female |
| $2,499 or less | 161 (14.9%) | 0 (0.0%) |
| $2,500 to $4,999 | 45 (4.2%) | 122 (20.3%) |
| $5,000 to $7,499 | 0 (0.0%) | 62 (10.3%) |
| $7,500 to $9,999 | 0 (0.0%) | 35 (5.8%) |
| $10,000 to $12,499 | 56 (5.2%) | 36 (6.0%) |
| $12,500 to $14,999 | 0 (0.0%) | 20 (3.3%) |
| $15,000 to $17,499 | 0 (0.0%) | 120 (19.9%) |
| $17,500 to $19,999 | 0 (0.0%) | 0 (0.0%) |
| $20,000 to $22,499 | 41 (3.8%) | 0 (0.0%) |
| $22,500 to $24,999 | 88 (8.2%) | 4 (0.7%) |
| $25,000 to $29,999 | 27 (2.5%) | 37 (6.1%) |
| $30,000 to $34,999 | 0 (0.0%) | 0 (0.0%) |
| $35,000 to $39,999 | 60 (5.6%) | 5 (0.8%) |
| $40,000 to $44,999 | 152 (14.1%) | 0 (0.0%) |
| $45,000 to $49,999 | 0 (0.0%) | 0 (0.0%) |
| $50,000 to $54,999 | 0 (0.0%) | 35 (5.8%) |
| $55,000 to $64,999 | 126 (11.7%) | 29 (4.8%) |
| $65,000 to $74,999 | 107 (9.9%) | 0 (0.0%) |
| $75,000 to $99,999 | 148 (13.7%) | 92 (15.3%) |
| $100,000+ | 67 (6.2%) | 5 (0.8%) |
| Total | 1,078 (100.0%) | 602 (100.0%) |
Earnings by Sex by Educational Attainment in South Alamo
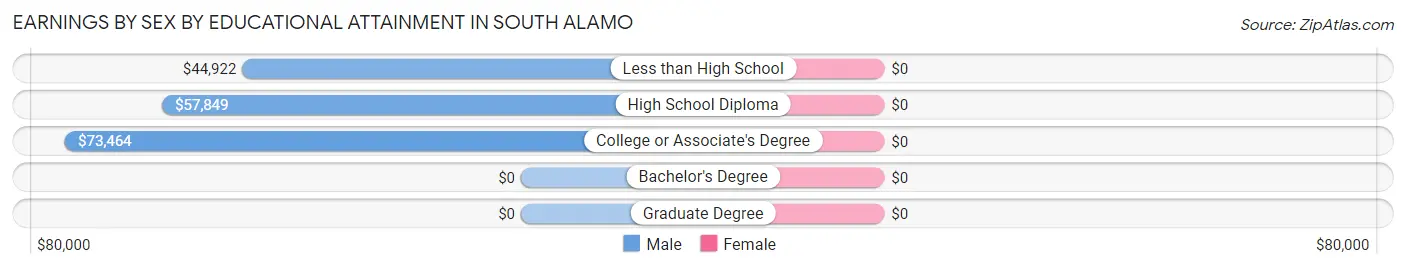
| Educational Attainment | Male Income | Female Income |
| Less than High School | $44,922 | $0 |
| High School Diploma | $57,849 | $0 |
| College or Associate's Degree | $73,464 | $0 |
| Bachelor's Degree | - | - |
| Graduate Degree | - | - |
| Total | $57,475 | $0 |
Family Income in South Alamo
Family Income Brackets in South Alamo
According to the South Alamo family income data, there are 181 families falling into the $25,000 to $34,999 income range, which is the most common income bracket and makes up 26.0% of all families.
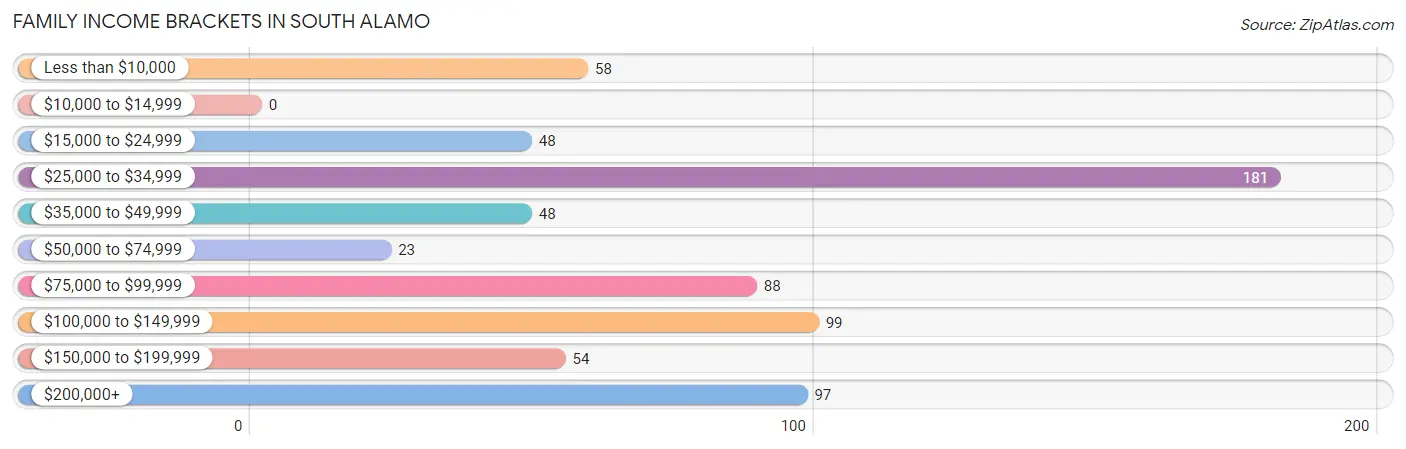
| Income Bracket | # Families | % Families |
| Less than $10,000 | 58 | 8.3% |
| $10,000 to $14,999 | 0 | 0.0% |
| $15,000 to $24,999 | 48 | 6.9% |
| $25,000 to $34,999 | 181 | 26.0% |
| $35,000 to $49,999 | 48 | 6.9% |
| $50,000 to $74,999 | 23 | 3.3% |
| $75,000 to $99,999 | 88 | 12.6% |
| $100,000 to $149,999 | 99 | 14.2% |
| $150,000 to $199,999 | 54 | 7.8% |
| $200,000+ | 97 | 13.9% |
Family Income by Famaliy Size in South Alamo
4-person families (143 | 20.5%) account for the highest median family income in South Alamo with $233,057 per family, while 4-person families (143 | 20.5%) have the highest median income of $58,264 per family member.
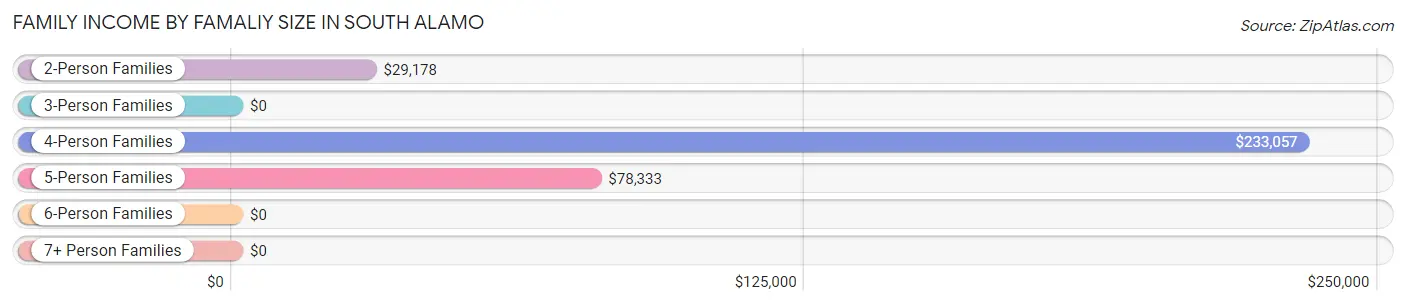
| Income Bracket | # Families | Median Income |
| 2-Person Families | 182 (26.2%) | $29,178 |
| 3-Person Families | 167 (24.0%) | $0 |
| 4-Person Families | 143 (20.5%) | $233,057 |
| 5-Person Families | 54 (7.8%) | $78,333 |
| 6-Person Families | 81 (11.6%) | $0 |
| 7+ Person Families | 69 (9.9%) | $0 |
| Total | 696 (100.0%) | $0 |
Family Income by Number of Earners in South Alamo
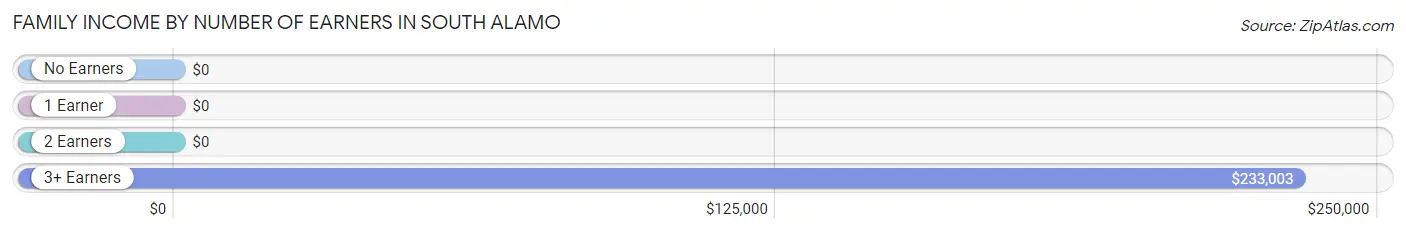
| Number of Earners | # Families | Median Income |
| No Earners | 112 (16.1%) | $0 |
| 1 Earner | 56 (8.1%) | $0 |
| 2 Earners | 381 (54.7%) | $0 |
| 3+ Earners | 147 (21.1%) | $233,003 |
| Total | 696 (100.0%) | $0 |
Household Income in South Alamo
Household Income Brackets in South Alamo
With 181 households falling in the category, the $25,000 to $34,999 income range is the most frequent in South Alamo, accounting for 19.4% of all households. In contrast, only 39 households (4.2%) fall into the $50,000 to $74,999 income bracket, making it the least populous group.
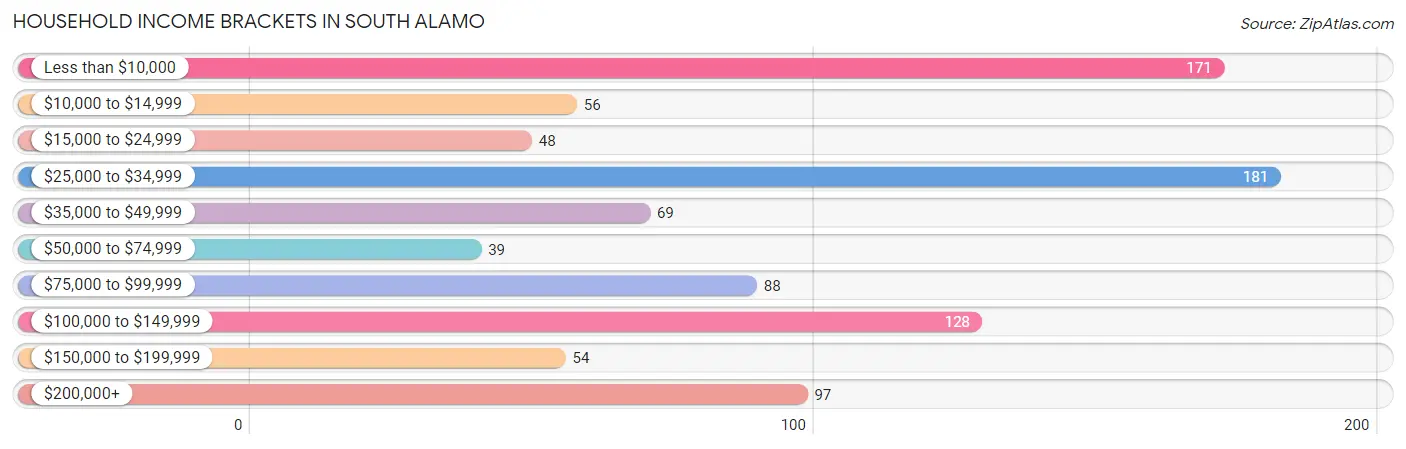
| Income Bracket | # Households | % Households |
| Less than $10,000 | 171 | 18.4% |
| $10,000 to $14,999 | 56 | 6.0% |
| $15,000 to $24,999 | 48 | 5.2% |
| $25,000 to $34,999 | 181 | 19.4% |
| $35,000 to $49,999 | 69 | 7.4% |
| $50,000 to $74,999 | 39 | 4.2% |
| $75,000 to $99,999 | 88 | 9.5% |
| $100,000 to $149,999 | 128 | 13.7% |
| $150,000 to $199,999 | 54 | 5.8% |
| $200,000+ | 97 | 10.4% |
Household Income by Householder Age in South Alamo
The median household income in South Alamo is $35,742, with the highest median household income of $79,199 found in the 45 to 64 years age bracket for the primary householder. A total of 435 households (46.7%) fall into this category.
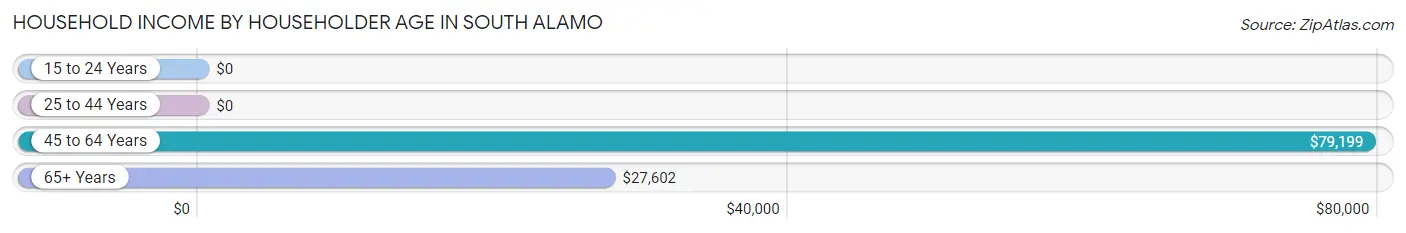
| Income Bracket | # Households | Median Income |
| 15 to 24 Years | 0 (0.0%) | $0 |
| 25 to 44 Years | 241 (25.9%) | $0 |
| 45 to 64 Years | 435 (46.7%) | $79,199 |
| 65+ Years | 255 (27.4%) | $27,602 |
| Total | 931 (100.0%) | $35,742 |
Poverty in South Alamo
Income Below Poverty by Sex and Age in South Alamo
With 22.9% poverty level for males and 28.8% for females among the residents of South Alamo, 16 and 17 year old males and 35 to 44 year old females are the most vulnerable to poverty, with 8 males (100.0%) and 83 females (94.3%) in their respective age groups living below the poverty level.
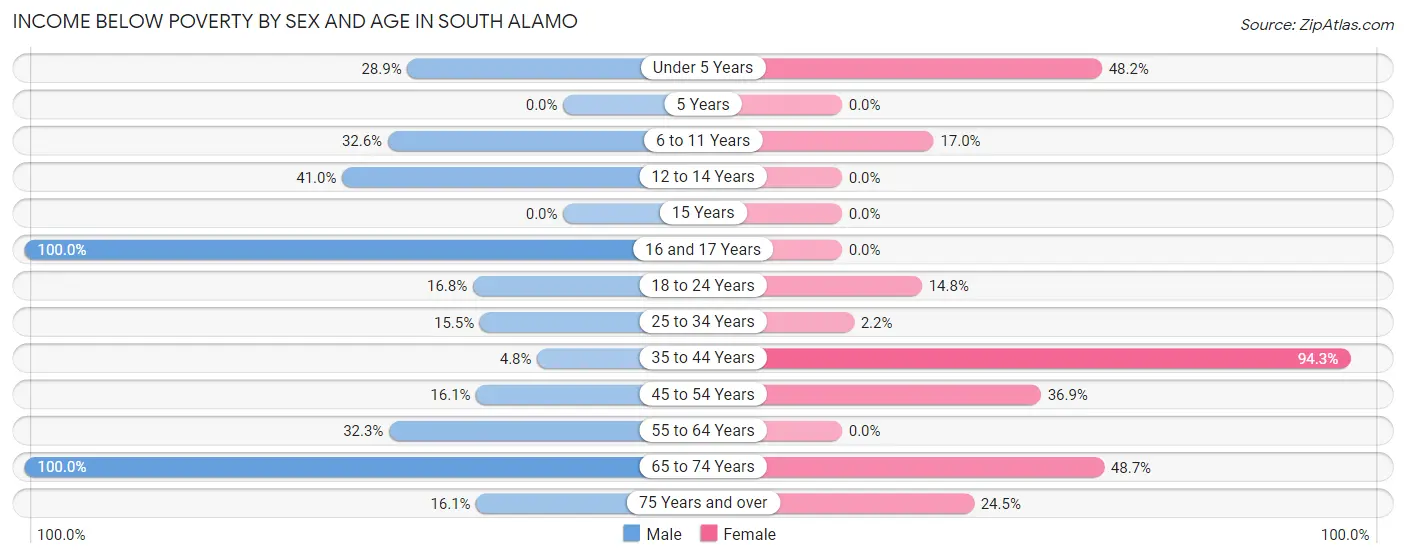
| Age Bracket | Male | Female |
| Under 5 Years | 57 (28.9%) | 96 (48.2%) |
| 5 Years | 0 (0.0%) | 0 (0.0%) |
| 6 to 11 Years | 14 (32.6%) | 33 (17.0%) |
| 12 to 14 Years | 112 (41.0%) | 0 (0.0%) |
| 15 Years | 0 (0.0%) | 0 (0.0%) |
| 16 and 17 Years | 8 (100.0%) | 0 (0.0%) |
| 18 to 24 Years | 52 (16.8%) | 42 (14.8%) |
| 25 to 34 Years | 45 (15.5%) | 4 (2.2%) |
| 35 to 44 Years | 8 (4.8%) | 83 (94.3%) |
| 45 to 54 Years | 41 (16.1%) | 96 (36.9%) |
| 55 to 64 Years | 43 (32.3%) | 0 (0.0%) |
| 65 to 74 Years | 19 (100.0%) | 90 (48.6%) |
| 75 Years and over | 25 (16.1%) | 12 (24.5%) |
| Total | 424 (22.9%) | 456 (28.8%) |
Income Above Poverty by Sex and Age in South Alamo
According to the poverty statistics in South Alamo, males aged 35 to 44 years and females aged 5 years are the age groups that are most secure financially, with 95.2% of males and 100.0% of females in these age groups living above the poverty line.
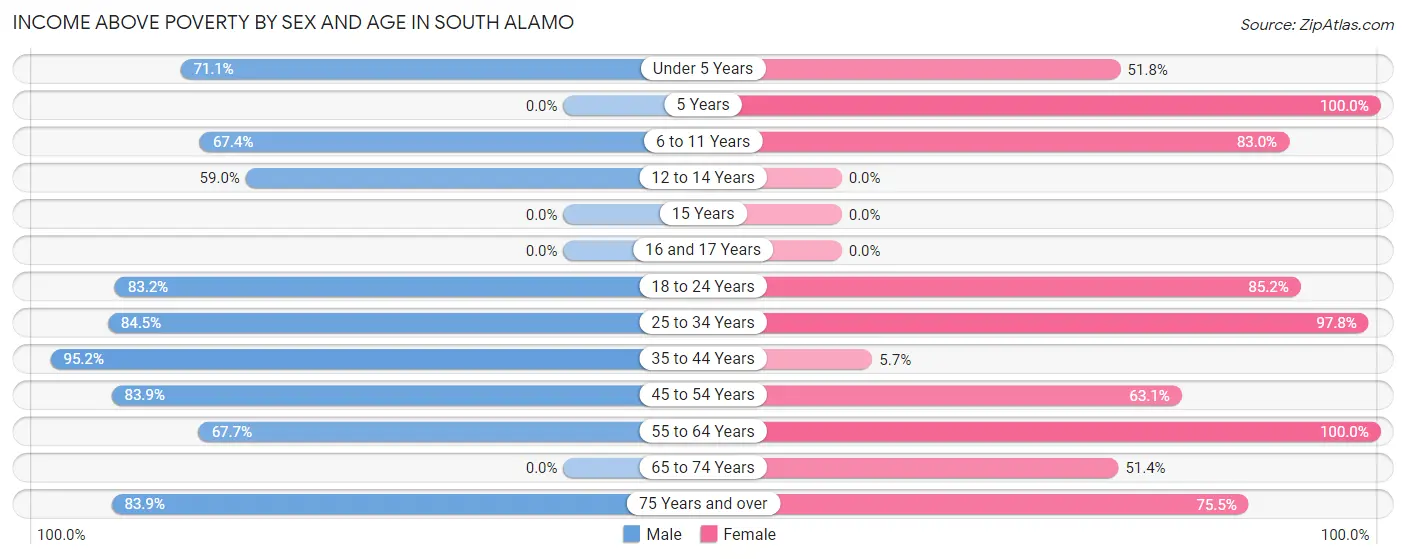
| Age Bracket | Male | Female |
| Under 5 Years | 140 (71.1%) | 103 (51.8%) |
| 5 Years | 0 (0.0%) | 4 (100.0%) |
| 6 to 11 Years | 29 (67.4%) | 161 (83.0%) |
| 12 to 14 Years | 161 (59.0%) | 0 (0.0%) |
| 15 Years | 0 (0.0%) | 0 (0.0%) |
| 16 and 17 Years | 0 (0.0%) | 0 (0.0%) |
| 18 to 24 Years | 258 (83.2%) | 241 (85.2%) |
| 25 to 34 Years | 246 (84.5%) | 177 (97.8%) |
| 35 to 44 Years | 158 (95.2%) | 5 (5.7%) |
| 45 to 54 Years | 213 (83.9%) | 164 (63.1%) |
| 55 to 64 Years | 90 (67.7%) | 141 (100.0%) |
| 65 to 74 Years | 0 (0.0%) | 95 (51.3%) |
| 75 Years and over | 130 (83.9%) | 37 (75.5%) |
| Total | 1,425 (77.1%) | 1,128 (71.2%) |
Income Below Poverty Among Married-Couple Families in South Alamo
The poverty statistics for married-couple families in South Alamo show that 5.8% or 30 of the total 514 families live below the poverty line. Families with 3 or 4 children have the highest poverty rate of 28.9%, comprising of 22 families. On the other hand, families with no children have the lowest poverty rate of 0.0%, which includes 0 families.
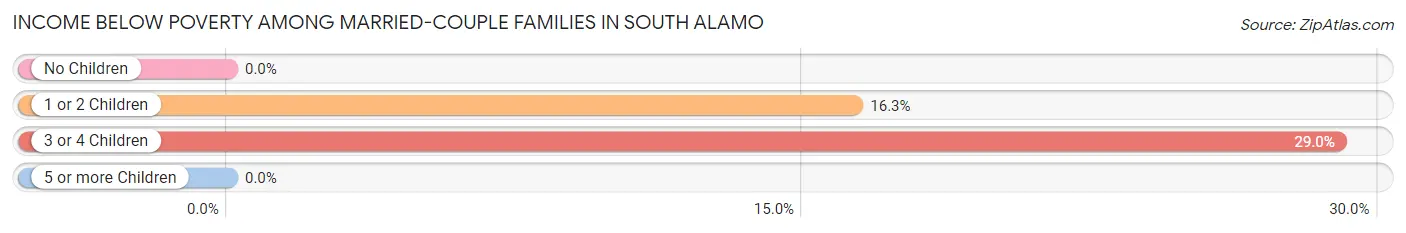
| Children | Above Poverty | Below Poverty |
| No Children | 389 (100.0%) | 0 (0.0%) |
| 1 or 2 Children | 41 (83.7%) | 8 (16.3%) |
| 3 or 4 Children | 54 (71.1%) | 22 (28.9%) |
| 5 or more Children | 0 (0.0%) | 0 (0.0%) |
| Total | 484 (94.2%) | 30 (5.8%) |
Income Below Poverty Among Single-Parent Households in South Alamo
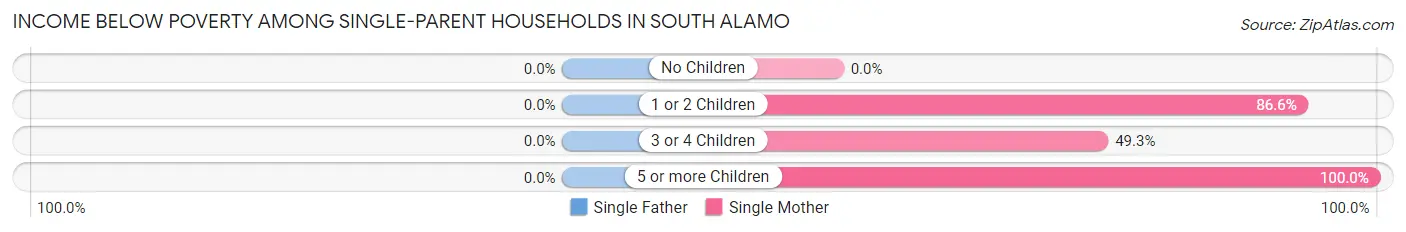
| Children | Single Father | Single Mother |
| No Children | 0 (0.0%) | 0 (0.0%) |
| 1 or 2 Children | 0 (0.0%) | 58 (86.6%) |
| 3 or 4 Children | 0 (0.0%) | 34 (49.3%) |
| 5 or more Children | 0 (0.0%) | 5 (100.0%) |
| Total | 0 (0.0%) | 97 (60.6%) |
Income Below Poverty Among Married-Couple vs Single-Parent Households in South Alamo
The poverty data for South Alamo shows that 30 of the married-couple family households (5.8%) and 97 of the single-parent households (53.3%) are living below the poverty level. Within the married-couple family households, those with 3 or 4 children have the highest poverty rate, with 22 households (28.9%) falling below the poverty line. Among the single-parent households, those with 5 or more children have the highest poverty rate, with 5 household (100.0%) living below poverty.
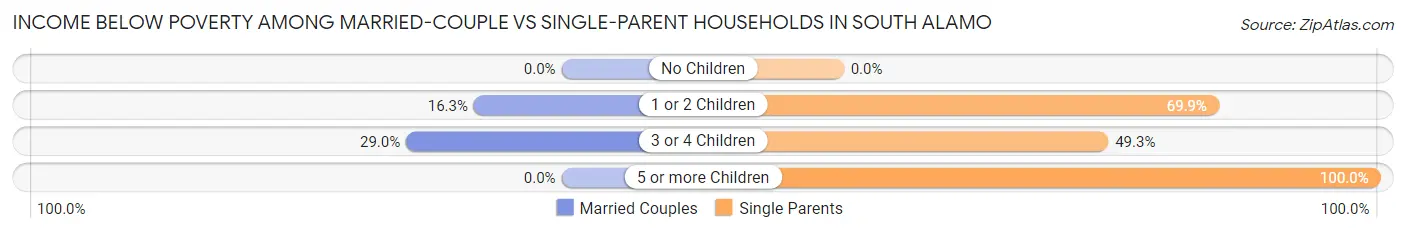
| Children | Married-Couple Families | Single-Parent Households |
| No Children | 0 (0.0%) | 0 (0.0%) |
| 1 or 2 Children | 8 (16.3%) | 58 (69.9%) |
| 3 or 4 Children | 22 (28.9%) | 34 (49.3%) |
| 5 or more Children | 0 (0.0%) | 5 (100.0%) |
| Total | 30 (5.8%) | 97 (53.3%) |
Race in South Alamo
The most populous races in South Alamo are Hispanic or Latino (3,301 | 96.2%), White / Caucasian (1,664 | 48.5%), and Two or more Races (1,458 | 42.5%).
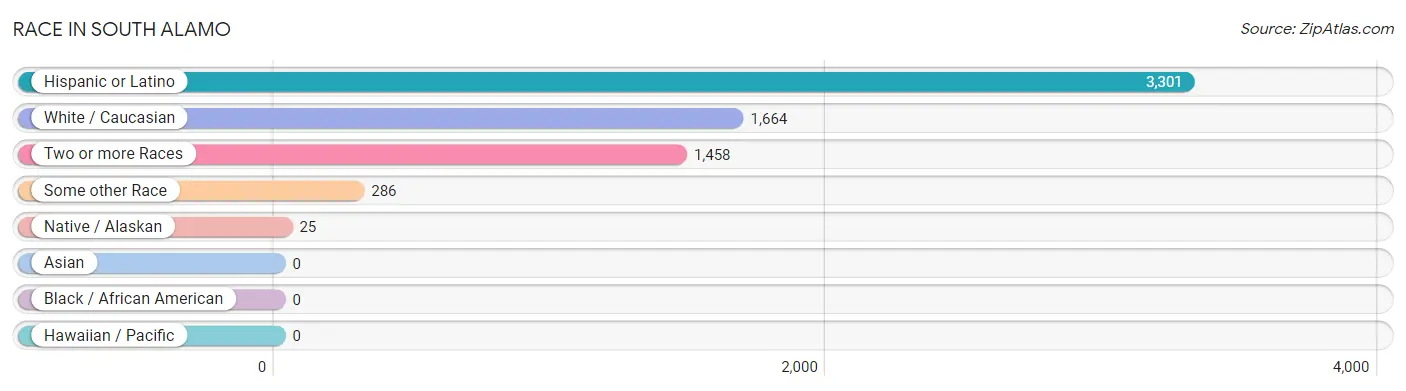
| Race | # Population | % Population |
| Asian | 0 | 0.0% |
| Black / African American | 0 | 0.0% |
| Hawaiian / Pacific | 0 | 0.0% |
| Hispanic or Latino | 3,301 | 96.2% |
| Native / Alaskan | 25 | 0.7% |
| White / Caucasian | 1,664 | 48.5% |
| Two or more Races | 1,458 | 42.5% |
| Some other Race | 286 | 8.3% |
| Total | 3,433 | 100.0% |
Ancestry in South Alamo
The most populous ancestries reported in South Alamo are Mexican (3,169 | 92.3%), Italian (331 | 9.6%), English (97 | 2.8%), German (97 | 2.8%), and American (36 | 1.1%), together accounting for 108.7% of all South Alamo residents.
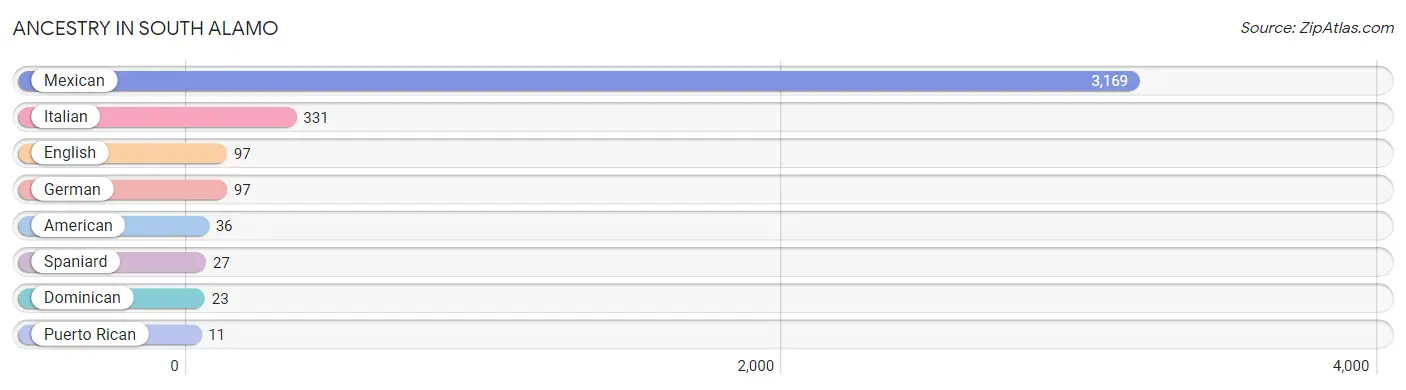
| Ancestry | # Population | % Population |
| American | 36 | 1.1% |
| Dominican | 23 | 0.7% |
| English | 97 | 2.8% |
| German | 97 | 2.8% |
| Italian | 331 | 9.6% |
| Mexican | 3,169 | 92.3% |
| Puerto Rican | 11 | 0.3% |
| Spaniard | 27 | 0.8% | View All 8 Rows |
Immigrants in South Alamo
The most numerous immigrant groups reported in South Alamo came from Central America (1,232 | 35.9%), Latin America (1,232 | 35.9%), Mexico (1,196 | 34.8%), and Guatemala (36 | 1.1%), together accounting for 107.7% of all South Alamo residents.
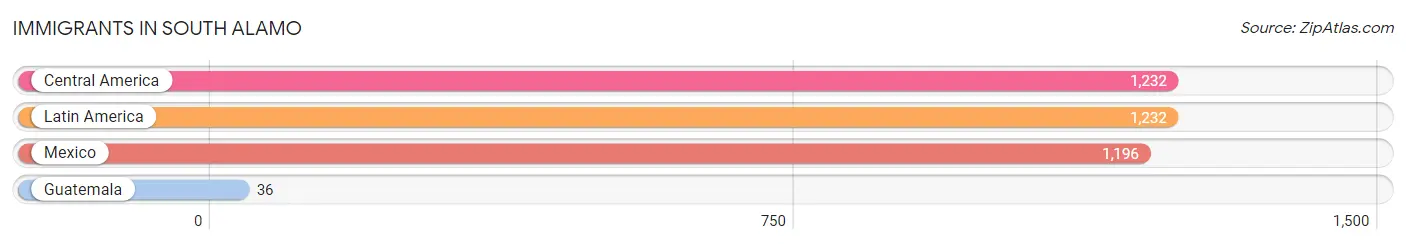
| Immigration Origin | # Population | % Population |
| Central America | 1,232 | 35.9% |
| Guatemala | 36 | 1.1% |
| Latin America | 1,232 | 35.9% |
| Mexico | 1,196 | 34.8% | View All 4 Rows |
Sex and Age in South Alamo
Sex and Age in South Alamo
The most populous age groups in South Alamo are 10 to 14 Years (293 | 15.9%) for men and 45 to 49 Years (260 | 16.4%) for women.
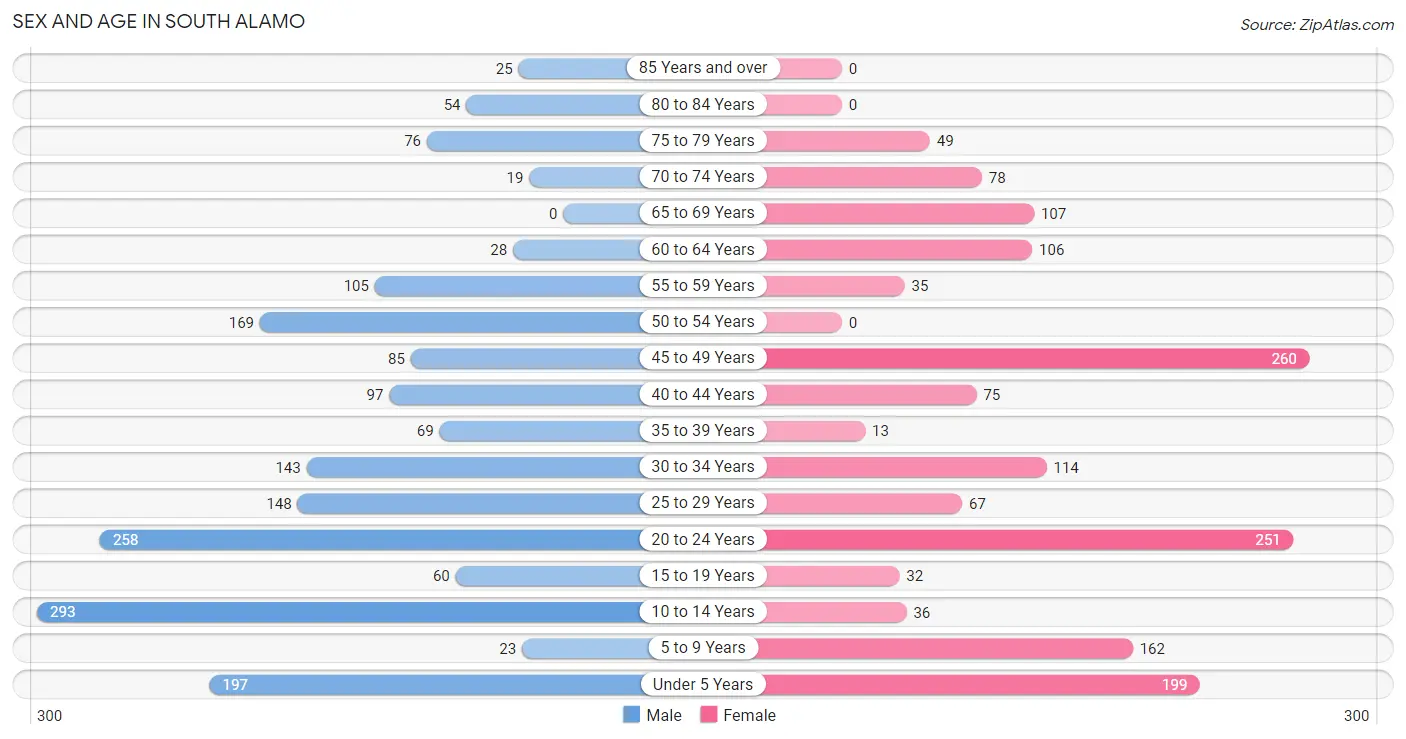
| Age Bracket | Male | Female |
| Under 5 Years | 197 (10.6%) | 199 (12.6%) |
| 5 to 9 Years | 23 (1.2%) | 162 (10.2%) |
| 10 to 14 Years | 293 (15.9%) | 36 (2.3%) |
| 15 to 19 Years | 60 (3.2%) | 32 (2.0%) |
| 20 to 24 Years | 258 (14.0%) | 251 (15.9%) |
| 25 to 29 Years | 148 (8.0%) | 67 (4.2%) |
| 30 to 34 Years | 143 (7.7%) | 114 (7.2%) |
| 35 to 39 Years | 69 (3.7%) | 13 (0.8%) |
| 40 to 44 Years | 97 (5.2%) | 75 (4.7%) |
| 45 to 49 Years | 85 (4.6%) | 260 (16.4%) |
| 50 to 54 Years | 169 (9.1%) | 0 (0.0%) |
| 55 to 59 Years | 105 (5.7%) | 35 (2.2%) |
| 60 to 64 Years | 28 (1.5%) | 106 (6.7%) |
| 65 to 69 Years | 0 (0.0%) | 107 (6.8%) |
| 70 to 74 Years | 19 (1.0%) | 78 (4.9%) |
| 75 to 79 Years | 76 (4.1%) | 49 (3.1%) |
| 80 to 84 Years | 54 (2.9%) | 0 (0.0%) |
| 85 Years and over | 25 (1.3%) | 0 (0.0%) |
| Total | 1,849 (100.0%) | 1,584 (100.0%) |
Families and Households in South Alamo
Median Family Size in South Alamo
The median family size in South Alamo is 4.51 persons per family, with single female/mother families (160 | 23.0%) accounting for the largest median family size of 6.45 persons per family. On the other hand, married-couple families (514 | 73.9%) represent the smallest median family size with 3.89 persons per family.
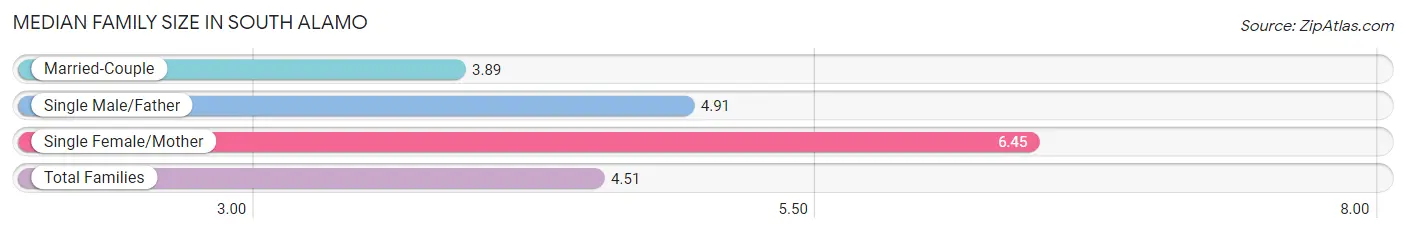
| Family Type | # Families | Family Size |
| Married-Couple | 514 (73.9%) | 3.89 |
| Single Male/Father | 22 (3.2%) | 4.91 |
| Single Female/Mother | 160 (23.0%) | 6.45 |
| Total Families | 696 (100.0%) | 4.51 |
Median Household Size in South Alamo
The median household size in South Alamo is 3.69 persons per household, with single female/mother households (160 | 17.2%) accounting for the largest median household size of 6.49 persons per household. non-family households (235 | 25.2%) represent the smallest median household size with 1.23 persons per household.
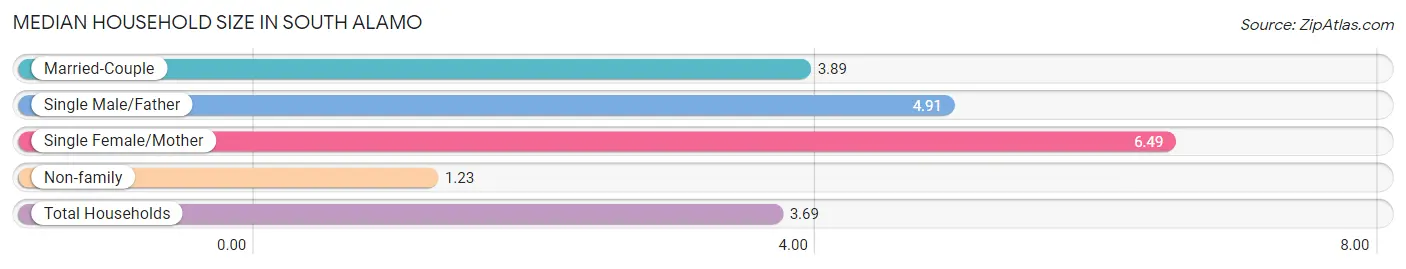
| Household Type | # Households | Household Size |
| Married-Couple | 514 (55.2%) | 3.89 |
| Single Male/Father | 22 (2.4%) | 4.91 |
| Single Female/Mother | 160 (17.2%) | 6.49 |
| Non-family | 235 (25.2%) | 1.23 |
| Total Households | 931 (100.0%) | 3.69 |
Household Size by Marriage Status in South Alamo
Out of a total of 931 households in South Alamo, 696 (74.8%) are family households, while 235 (25.2%) are nonfamily households. The most numerous type of family households are 2-person households, comprising 182, and the most common type of nonfamily households are 1-person households, comprising 190.
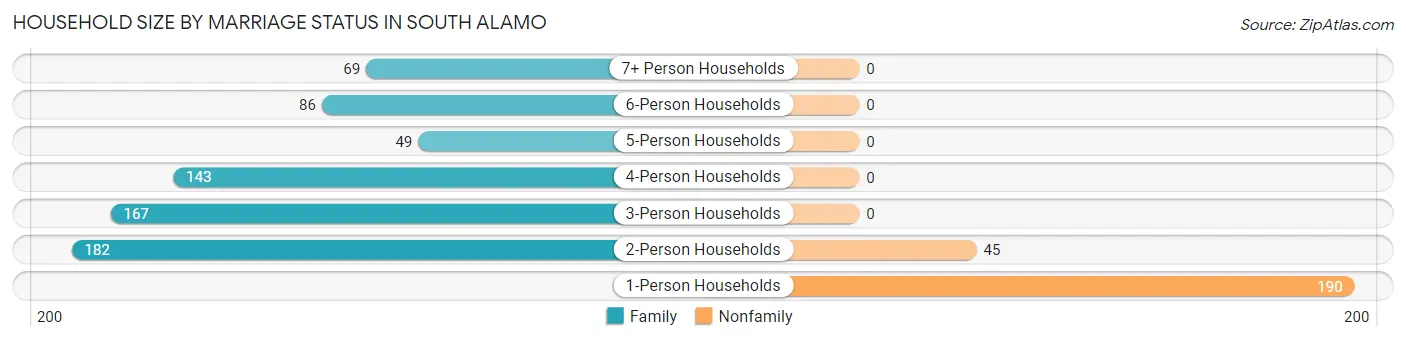
| Household Size | Family Households | Nonfamily Households |
| 1-Person Households | - | 190 (20.4%) |
| 2-Person Households | 182 (19.6%) | 45 (4.8%) |
| 3-Person Households | 167 (17.9%) | 0 (0.0%) |
| 4-Person Households | 143 (15.4%) | 0 (0.0%) |
| 5-Person Households | 49 (5.3%) | 0 (0.0%) |
| 6-Person Households | 86 (9.2%) | 0 (0.0%) |
| 7+ Person Households | 69 (7.4%) | 0 (0.0%) |
| Total | 696 (74.8%) | 235 (25.2%) |
Female Fertility in South Alamo
Fertility by Age in South Alamo
Average fertility rate in South Alamo is 255.0 births per 1,000 women. Women in the age bracket of 20 to 34 years have the highest fertility rate with 479.0 births per 1,000 women. Women in the age bracket of 20 to 34 years acount for 100.0% of all women with births.
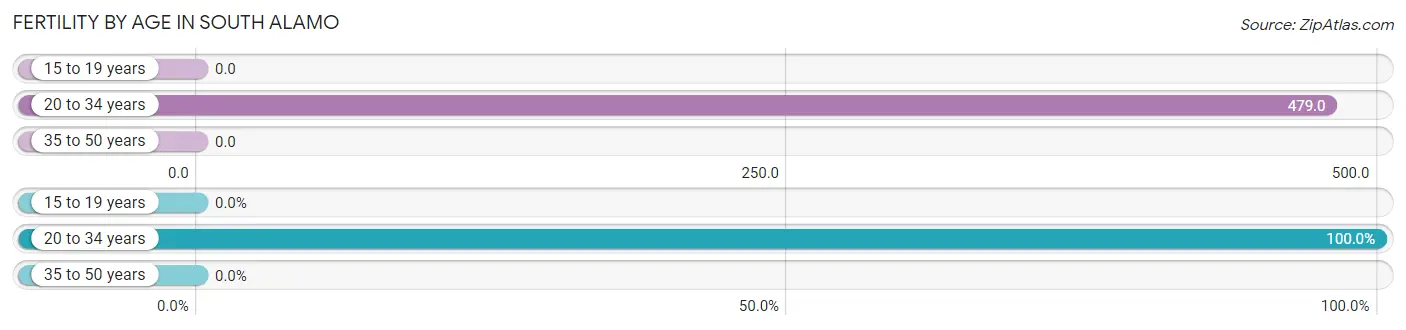
| Age Bracket | Women with Births | Births / 1,000 Women |
| 15 to 19 years | 0 (0.0%) | 0.0 |
| 20 to 34 years | 207 (100.0%) | 479.0 |
| 35 to 50 years | 0 (0.0%) | 0.0 |
| Total | 207 (100.0%) | 255.0 |
Fertility by Age by Marriage Status in South Alamo
40.1% of women with births (207) in South Alamo are married. The highest percentage of unmarried women with births falls into 20 to 34 years age bracket with 59.9% of them unmarried at the time of birth, while the lowest percentage of unmarried women with births belong to 20 to 34 years age bracket with 59.9% of them unmarried.
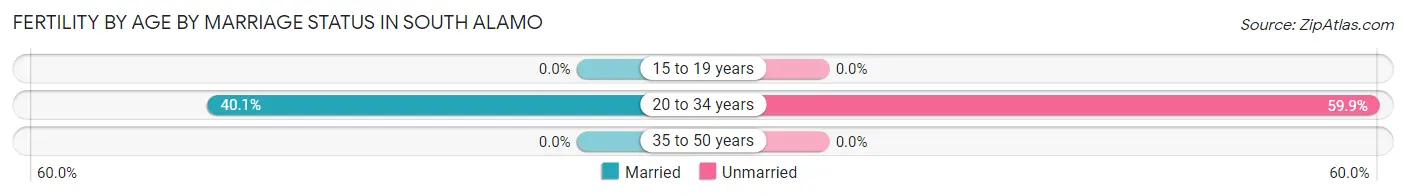
| Age Bracket | Married | Unmarried |
| 15 to 19 years | 0 (0.0%) | 0 (0.0%) |
| 20 to 34 years | 83 (40.1%) | 124 (59.9%) |
| 35 to 50 years | 0 (0.0%) | 0 (0.0%) |
| Total | 83 (40.1%) | 124 (59.9%) |
Fertility by Education in South Alamo
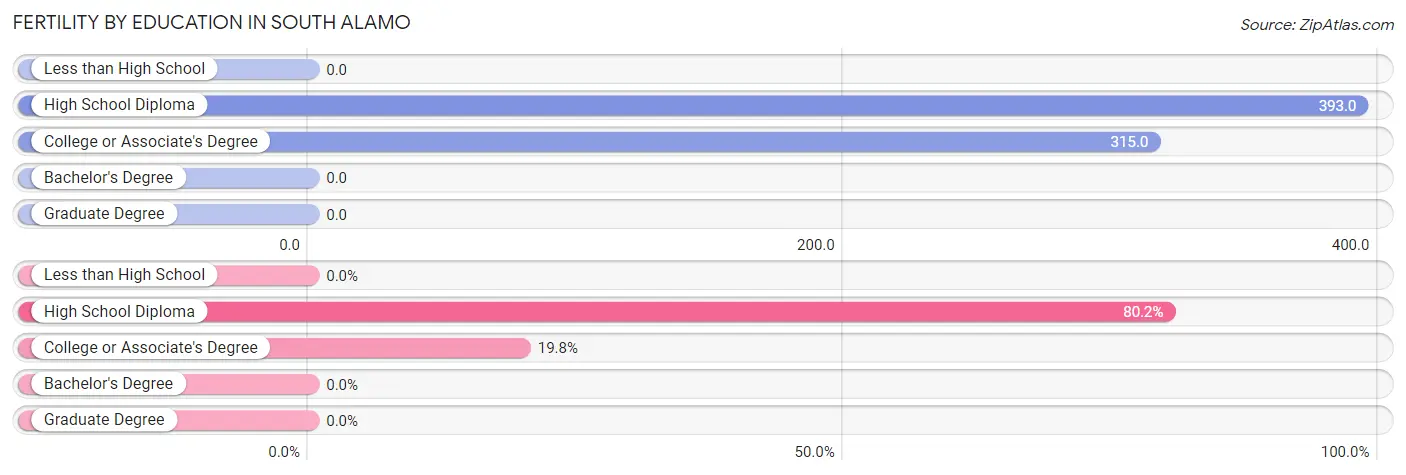
| Educational Attainment | Women with Births | Births / 1,000 Women |
| Less than High School | 0 (0.0%) | 0.0 |
| High School Diploma | 166 (80.2%) | 393.0 |
| College or Associate's Degree | 41 (19.8%) | 315.0 |
| Bachelor's Degree | 0 (0.0%) | 0.0 |
| Graduate Degree | 0 (0.0%) | 0.0 |
| Total | 207 (100.0%) | 255.0 |
Fertility by Education by Marriage Status in South Alamo
59.9% of women with births in South Alamo are unmarried. Women with the educational attainment of college or associate's degree are most likely to be married with 100.0% of them married at childbirth, while women with the educational attainment of high school diploma are least likely to be married with 74.7% of them unmarried at childbirth.
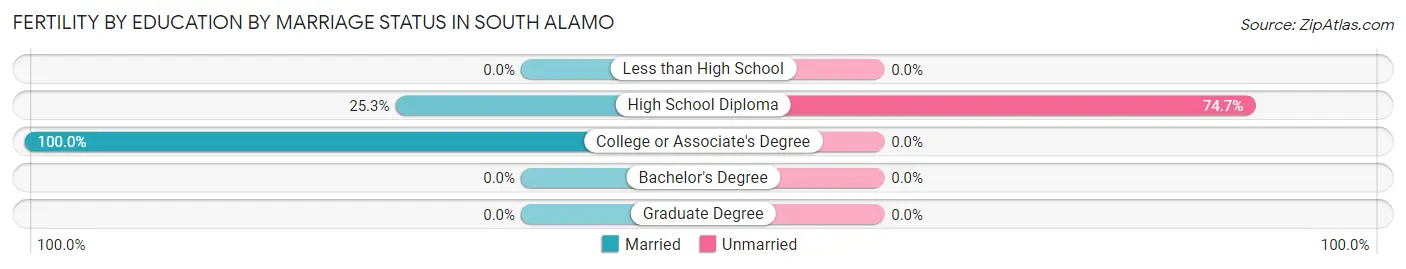
| Educational Attainment | Married | Unmarried |
| Less than High School | 0 (0.0%) | 0 (0.0%) |
| High School Diploma | 42 (25.3%) | 124 (74.7%) |
| College or Associate's Degree | 41 (100.0%) | 0 (0.0%) |
| Bachelor's Degree | 0 (0.0%) | 0 (0.0%) |
| Graduate Degree | 0 (0.0%) | 0 (0.0%) |
| Total | 83 (40.1%) | 124 (59.9%) |
Employment Characteristics in South Alamo
Employment by Class of Employer in South Alamo
Among the 1,385 employed individuals in South Alamo, private company employees (1,081 | 78.0%), self-employed (not incorporated) (222 | 16.0%), and local government employees (53 | 3.8%) make up the most common classes of employment.
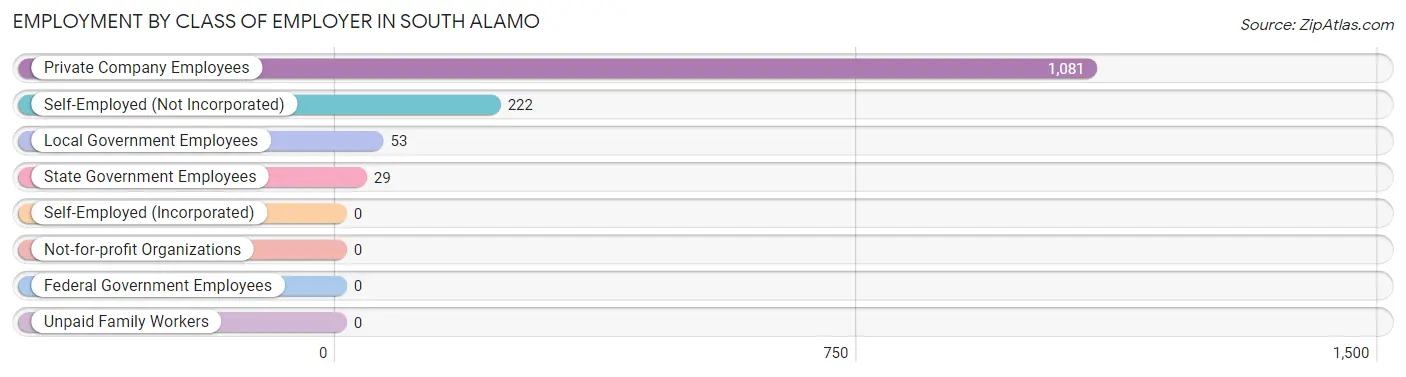
| Employer Class | # Employees | % Employees |
| Private Company Employees | 1,081 | 78.0% |
| Self-Employed (Incorporated) | 0 | 0.0% |
| Self-Employed (Not Incorporated) | 222 | 16.0% |
| Not-for-profit Organizations | 0 | 0.0% |
| Local Government Employees | 53 | 3.8% |
| State Government Employees | 29 | 2.1% |
| Federal Government Employees | 0 | 0.0% |
| Unpaid Family Workers | 0 | 0.0% |
| Total | 1,385 | 100.0% |
Employment Status by Age in South Alamo
According to the labor force statistics for South Alamo, out of the total population over 16 years of age (2,523), 60.5% or 1,526 individuals are in the labor force, with 9.3% or 142 of them unemployed. The age group with the highest labor force participation rate is 35 to 44 years, with 90.6% or 230 individuals in the labor force. Within the labor force, the 16 to 19 years age range has the highest percentage of unemployed individuals, with 92.9% or 52 of them being unemployed.
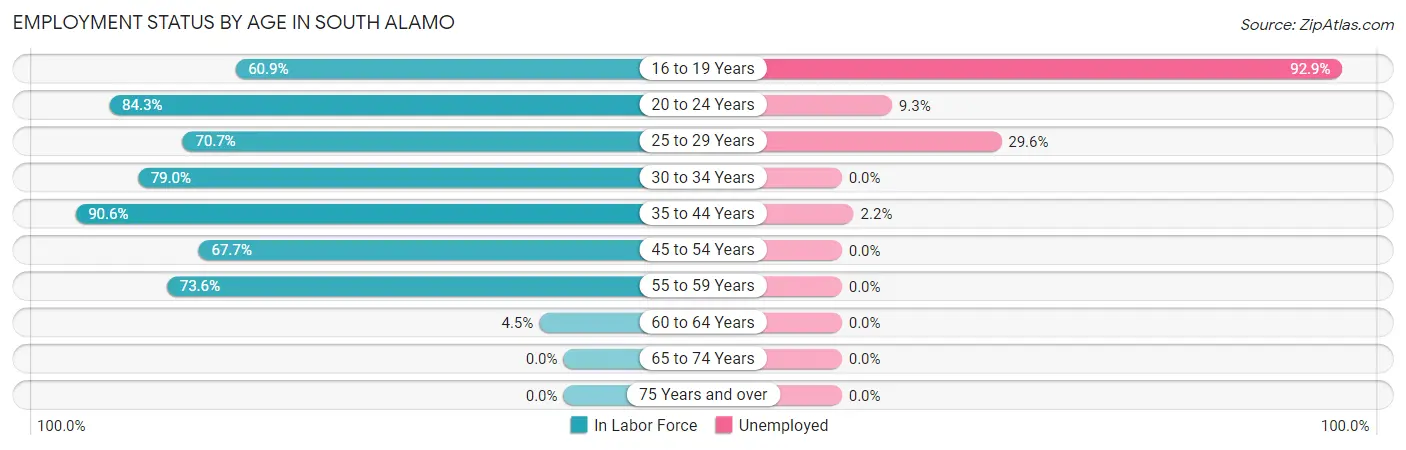
| Age Bracket | In Labor Force | Unemployed |
| 16 to 19 Years | 56 (60.9%) | 52 (92.9%) |
| 20 to 24 Years | 429 (84.3%) | 40 (9.3%) |
| 25 to 29 Years | 152 (70.7%) | 45 (29.6%) |
| 30 to 34 Years | 203 (79.0%) | 0 (0.0%) |
| 35 to 44 Years | 230 (90.6%) | 5 (2.2%) |
| 45 to 54 Years | 348 (67.7%) | 0 (0.0%) |
| 55 to 59 Years | 103 (73.6%) | 0 (0.0%) |
| 60 to 64 Years | 6 (4.5%) | 0 (0.0%) |
| 65 to 74 Years | 0 (0.0%) | 0 (0.0%) |
| 75 Years and over | 0 (0.0%) | 0 (0.0%) |
| Total | 1,526 (60.5%) | 142 (9.3%) |
Employment Status by Educational Attainment in South Alamo
According to labor force statistics for South Alamo, 68.8% of individuals (1,042) out of the total population between 25 and 64 years of age (1,514) are in the labor force, with 4.8% or 50 of them being unemployed. The group with the highest labor force participation rate are those with the educational attainment of bachelor's degree or higher, with 100.0% or 52 individuals in the labor force. Within the labor force, individuals with college / associate degree education have the highest percentage of unemployment, with 14.6% or 45 of them being unemployed.
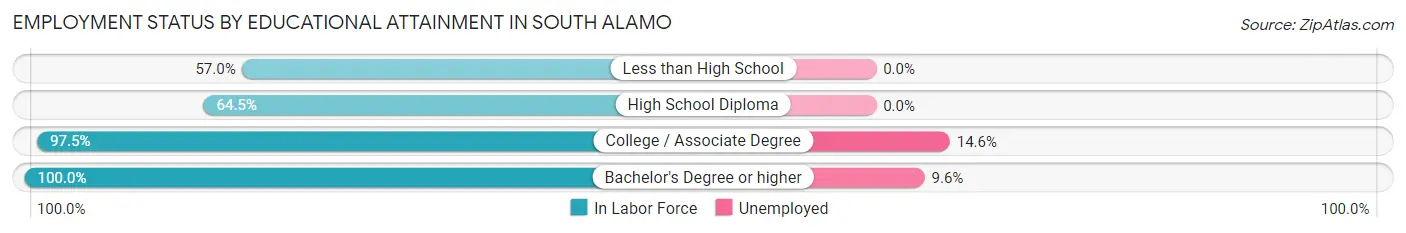
| Educational Attainment | In Labor Force | Unemployed |
| Less than High School | 436 (57.0%) | 0 (0.0%) |
| High School Diploma | 245 (64.5%) | 0 (0.0%) |
| College / Associate Degree | 309 (97.5%) | 46 (14.6%) |
| Bachelor's Degree or higher | 52 (100.0%) | 5 (9.6%) |
| Total | 1,042 (68.8%) | 73 (4.8%) |
Employment Occupations by Sex in South Alamo
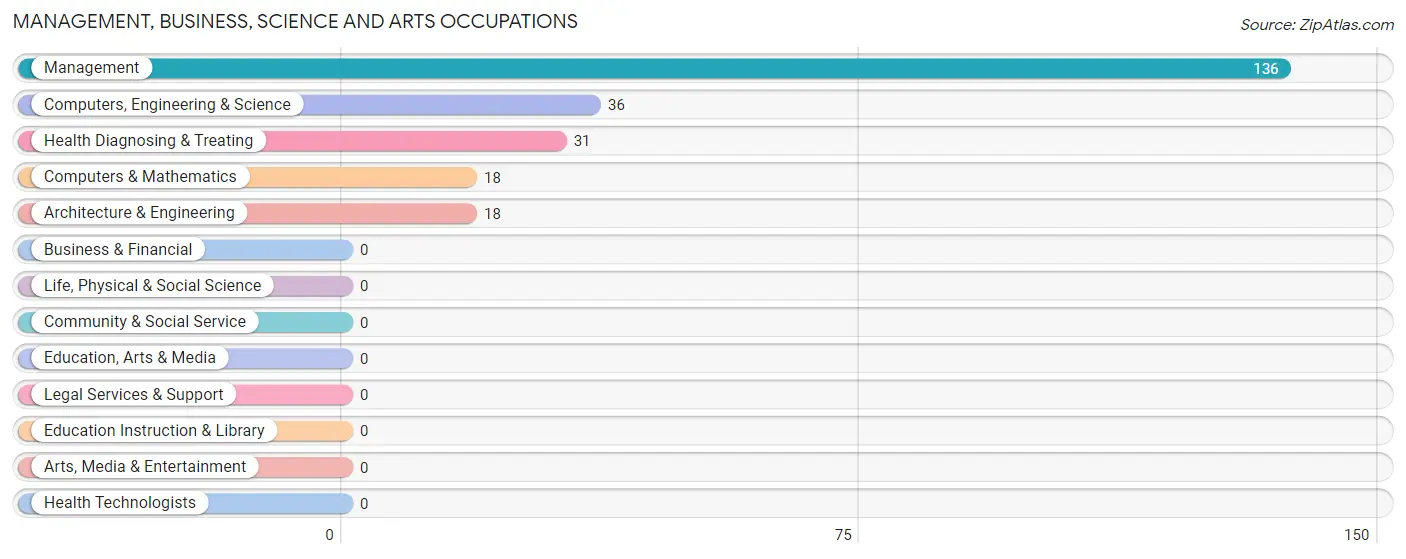
Management, Business, Science and Arts Occupations
The most common Management, Business, Science and Arts occupations in South Alamo are Management (136 | 9.8%), Computers, Engineering & Science (36 | 2.6%), Health Diagnosing & Treating (31 | 2.2%), Computers & Mathematics (18 | 1.3%), and Architecture & Engineering (18 | 1.3%).
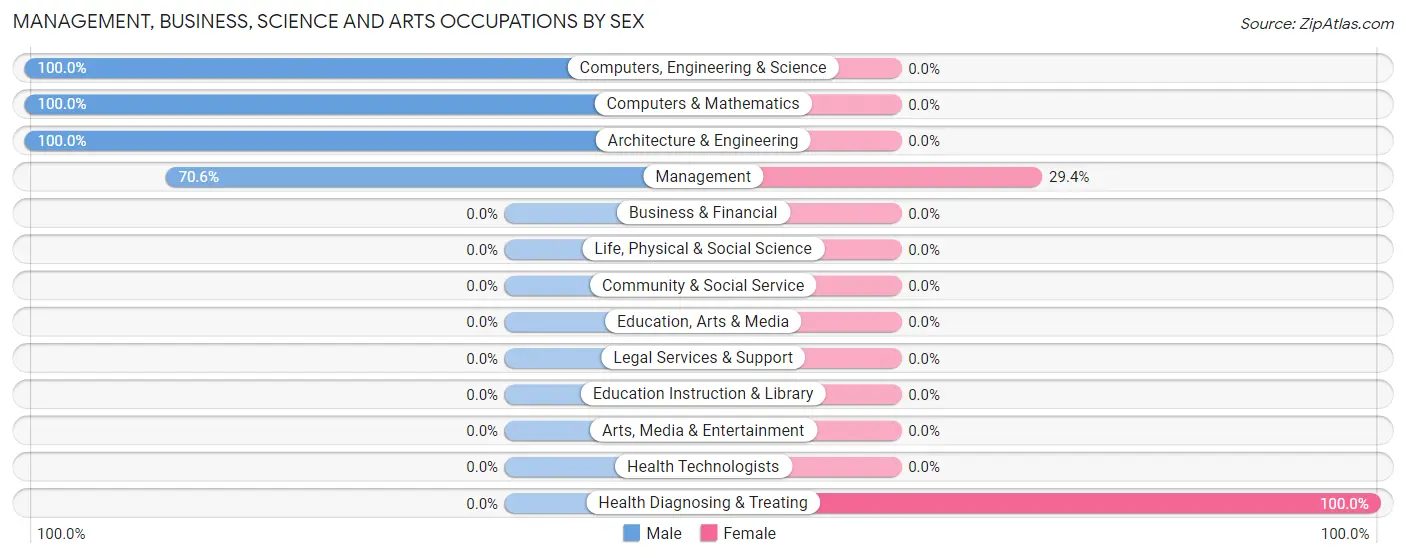
Management, Business, Science and Arts Occupations by Sex
Within the Management, Business, Science and Arts occupations in South Alamo, the most male-oriented occupations are Computers, Engineering & Science (100.0%), Computers & Mathematics (100.0%), and Architecture & Engineering (100.0%), while the most female-oriented occupations are Health Diagnosing & Treating (100.0%), and Management (29.4%).
| Occupation | Male | Female |
| Management | 96 (70.6%) | 40 (29.4%) |
| Business & Financial | 0 (0.0%) | 0 (0.0%) |
| Computers, Engineering & Science | 36 (100.0%) | 0 (0.0%) |
| Computers & Mathematics | 18 (100.0%) | 0 (0.0%) |
| Architecture & Engineering | 18 (100.0%) | 0 (0.0%) |
| Life, Physical & Social Science | 0 (0.0%) | 0 (0.0%) |
| Community & Social Service | 0 (0.0%) | 0 (0.0%) |
| Education, Arts & Media | 0 (0.0%) | 0 (0.0%) |
| Legal Services & Support | 0 (0.0%) | 0 (0.0%) |
| Education Instruction & Library | 0 (0.0%) | 0 (0.0%) |
| Arts, Media & Entertainment | 0 (0.0%) | 0 (0.0%) |
| Health Diagnosing & Treating | 0 (0.0%) | 31 (100.0%) |
| Health Technologists | 0 (0.0%) | 0 (0.0%) |
| Total (Category) | 132 (65.0%) | 71 (35.0%) |
| Total (Overall) | 904 (65.3%) | 481 (34.7%) |
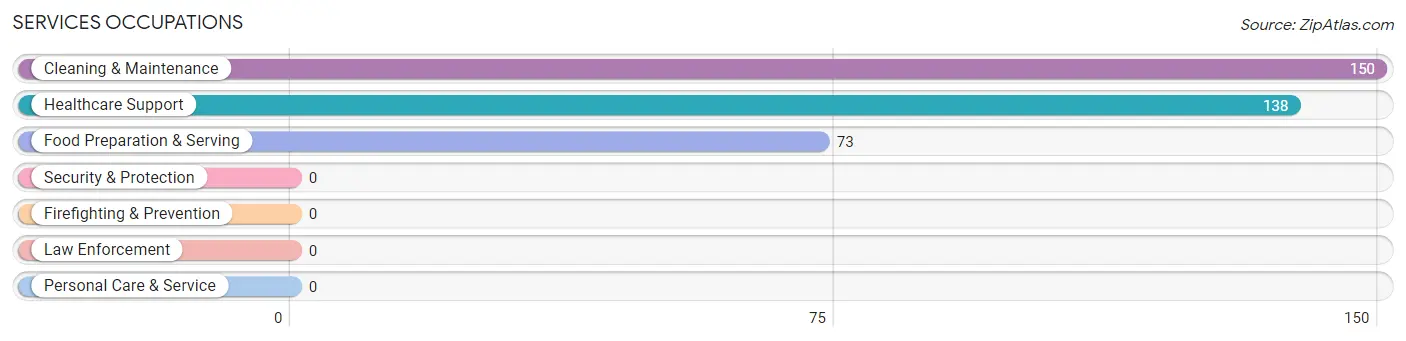
Services Occupations
The most common Services occupations in South Alamo are Cleaning & Maintenance (150 | 10.8%), Healthcare Support (138 | 10.0%), and Food Preparation & Serving (73 | 5.3%).
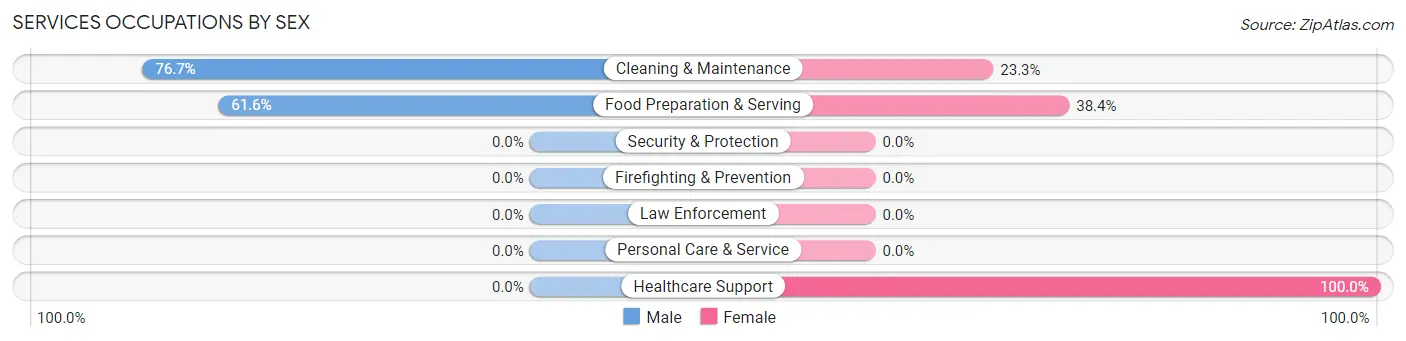
Services Occupations by Sex
Within the Services occupations in South Alamo, the most male-oriented occupations are Cleaning & Maintenance (76.7%), and Food Preparation & Serving (61.6%), while the most female-oriented occupations are Healthcare Support (100.0%), Food Preparation & Serving (38.4%), and Cleaning & Maintenance (23.3%).
| Occupation | Male | Female |
| Healthcare Support | 0 (0.0%) | 138 (100.0%) |
| Security & Protection | 0 (0.0%) | 0 (0.0%) |
| Firefighting & Prevention | 0 (0.0%) | 0 (0.0%) |
| Law Enforcement | 0 (0.0%) | 0 (0.0%) |
| Food Preparation & Serving | 45 (61.6%) | 28 (38.4%) |
| Cleaning & Maintenance | 115 (76.7%) | 35 (23.3%) |
| Personal Care & Service | 0 (0.0%) | 0 (0.0%) |
| Total (Category) | 160 (44.3%) | 201 (55.7%) |
| Total (Overall) | 904 (65.3%) | 481 (34.7%) |
Sales and Office Occupations
The most common Sales and Office occupations in South Alamo are Sales & Related (254 | 18.3%), and Office & Administration (29 | 2.1%).
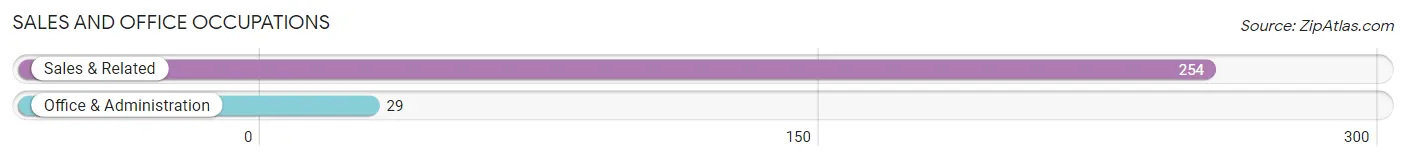
Sales and Office Occupations by Sex
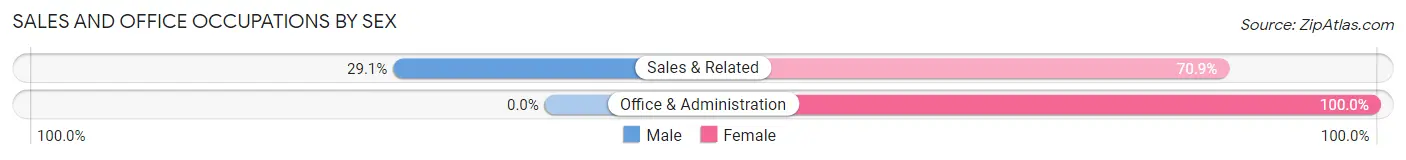
| Occupation | Male | Female |
| Sales & Related | 74 (29.1%) | 180 (70.9%) |
| Office & Administration | 0 (0.0%) | 29 (100.0%) |
| Total (Category) | 74 (26.2%) | 209 (73.9%) |
| Total (Overall) | 904 (65.3%) | 481 (34.7%) |
Natural Resources, Construction and Maintenance Occupations
The most common Natural Resources, Construction and Maintenance occupations in South Alamo are Construction & Extraction (225 | 16.3%), Installation, Maintenance & Repair (21 | 1.5%), and Farming, Fishing & Forestry (6 | 0.4%).
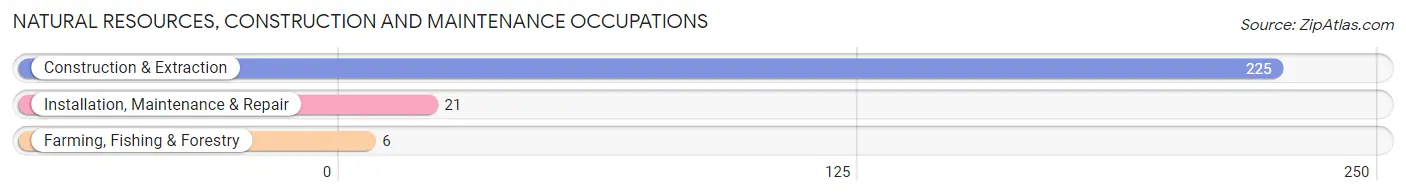
Natural Resources, Construction and Maintenance Occupations by Sex
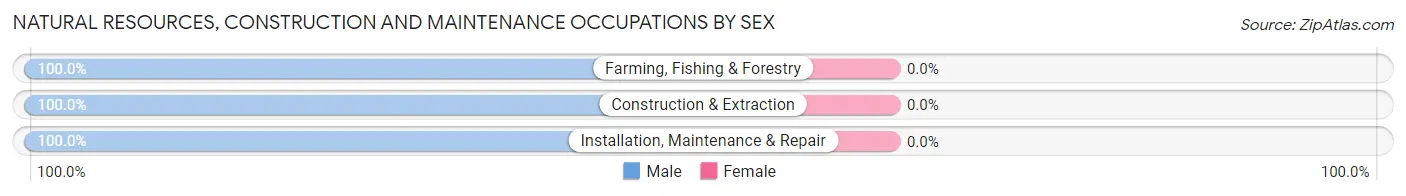
| Occupation | Male | Female |
| Farming, Fishing & Forestry | 6 (100.0%) | 0 (0.0%) |
| Construction & Extraction | 225 (100.0%) | 0 (0.0%) |
| Installation, Maintenance & Repair | 21 (100.0%) | 0 (0.0%) |
| Total (Category) | 252 (100.0%) | 0 (0.0%) |
| Total (Overall) | 904 (65.3%) | 481 (34.7%) |
Production, Transportation and Moving Occupations
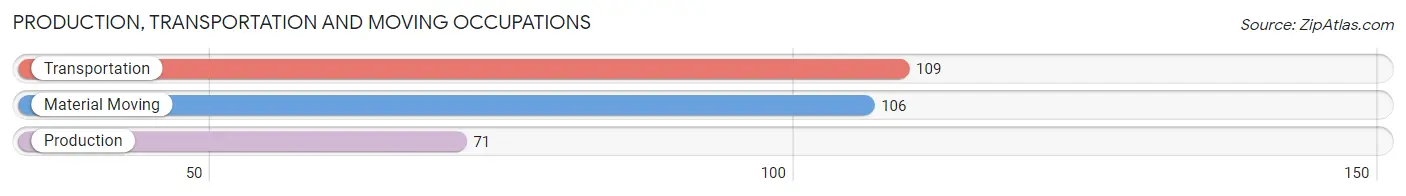
The most common Production, Transportation and Moving occupations in South Alamo are Transportation (109 | 7.9%), Material Moving (106 | 7.6%), and Production (71 | 5.1%).
Production, Transportation and Moving Occupations by Sex
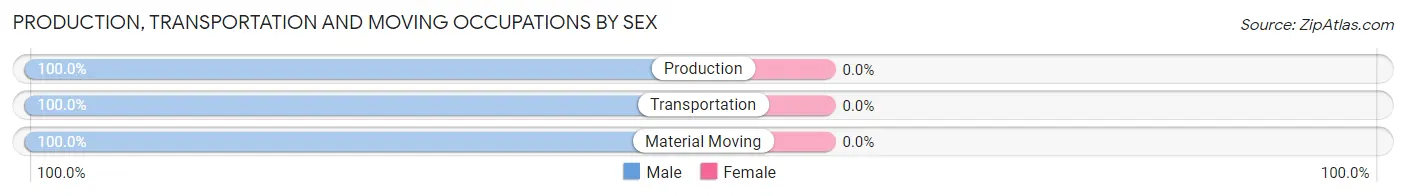
| Occupation | Male | Female |
| Production | 71 (100.0%) | 0 (0.0%) |
| Transportation | 109 (100.0%) | 0 (0.0%) |
| Material Moving | 106 (100.0%) | 0 (0.0%) |
| Total (Category) | 286 (100.0%) | 0 (0.0%) |
| Total (Overall) | 904 (65.3%) | 481 (34.7%) |
Employment Industries by Sex in South Alamo
Employment Industries in South Alamo
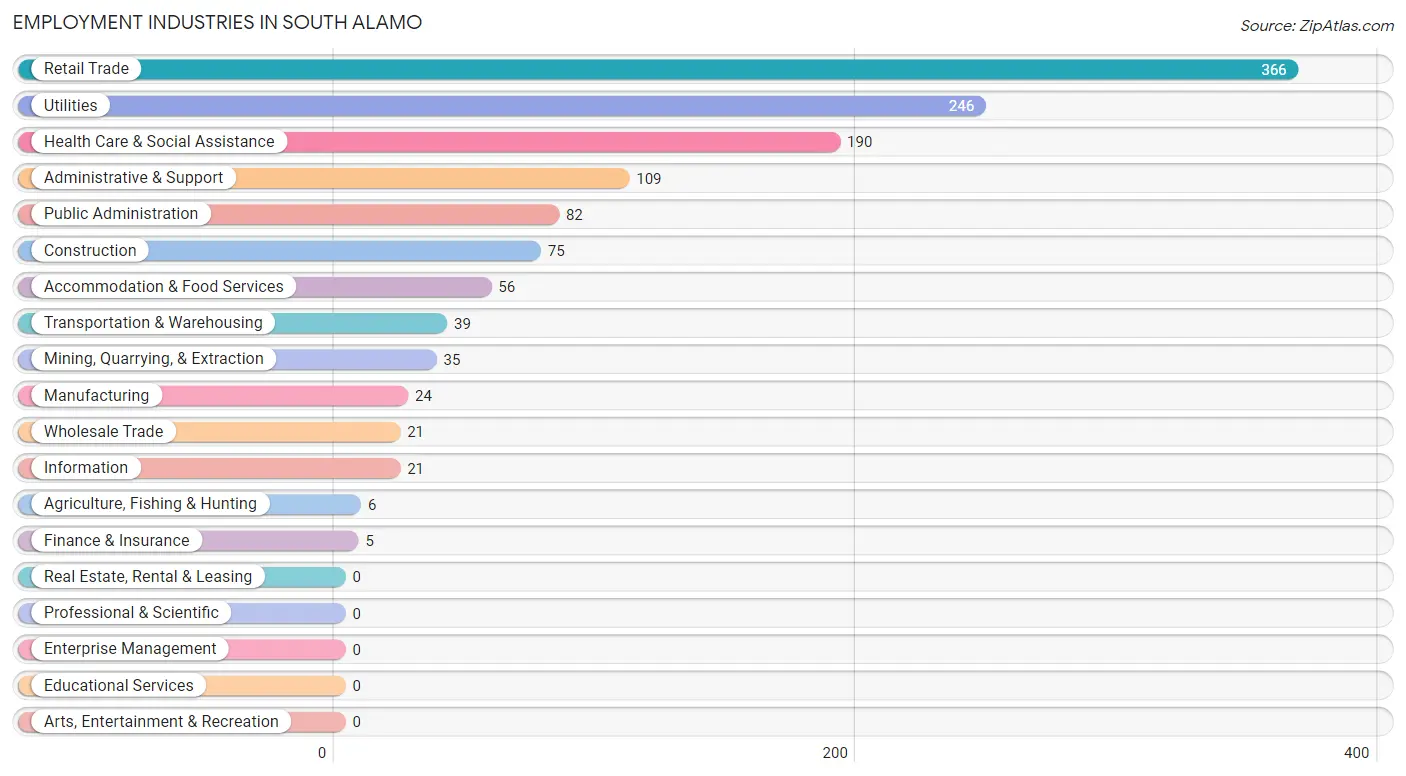
The major employment industries in South Alamo include Retail Trade (366 | 26.4%), Utilities (246 | 17.8%), Health Care & Social Assistance (190 | 13.7%), Administrative & Support (109 | 7.9%), and Public Administration (82 | 5.9%).
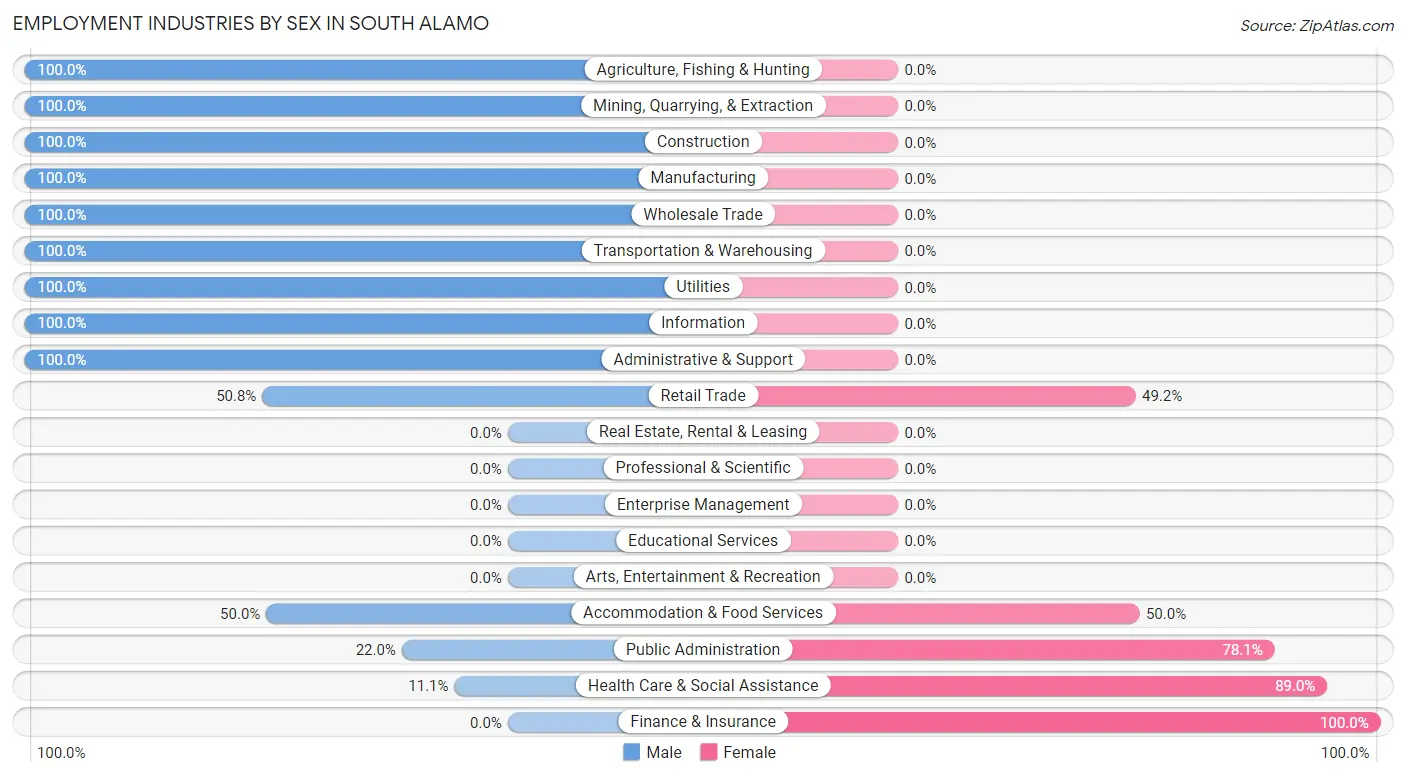
Employment Industries by Sex in South Alamo
The South Alamo industries that see more men than women are Agriculture, Fishing & Hunting (100.0%), Mining, Quarrying, & Extraction (100.0%), and Construction (100.0%), whereas the industries that tend to have a higher number of women are Finance & Insurance (100.0%), Health Care & Social Assistance (88.9%), and Public Administration (78.0%).
| Industry | Male | Female |
| Agriculture, Fishing & Hunting | 6 (100.0%) | 0 (0.0%) |
| Mining, Quarrying, & Extraction | 35 (100.0%) | 0 (0.0%) |
| Construction | 75 (100.0%) | 0 (0.0%) |
| Manufacturing | 24 (100.0%) | 0 (0.0%) |
| Wholesale Trade | 21 (100.0%) | 0 (0.0%) |
| Retail Trade | 186 (50.8%) | 180 (49.2%) |
| Transportation & Warehousing | 39 (100.0%) | 0 (0.0%) |
| Utilities | 246 (100.0%) | 0 (0.0%) |
| Information | 21 (100.0%) | 0 (0.0%) |
| Finance & Insurance | 0 (0.0%) | 5 (100.0%) |
| Real Estate, Rental & Leasing | 0 (0.0%) | 0 (0.0%) |
| Professional & Scientific | 0 (0.0%) | 0 (0.0%) |
| Enterprise Management | 0 (0.0%) | 0 (0.0%) |
| Administrative & Support | 109 (100.0%) | 0 (0.0%) |
| Educational Services | 0 (0.0%) | 0 (0.0%) |
| Health Care & Social Assistance | 21 (11.1%) | 169 (88.9%) |
| Arts, Entertainment & Recreation | 0 (0.0%) | 0 (0.0%) |
| Accommodation & Food Services | 28 (50.0%) | 28 (50.0%) |
| Public Administration | 18 (22.0%) | 64 (78.0%) |
| Total | 904 (65.3%) | 481 (34.7%) |
Education in South Alamo
School Enrollment in South Alamo
The most common levels of schooling among the 764 students in South Alamo are middle school (244 | 31.9%), high school (150 | 19.6%), and elementary school (134 | 17.5%).
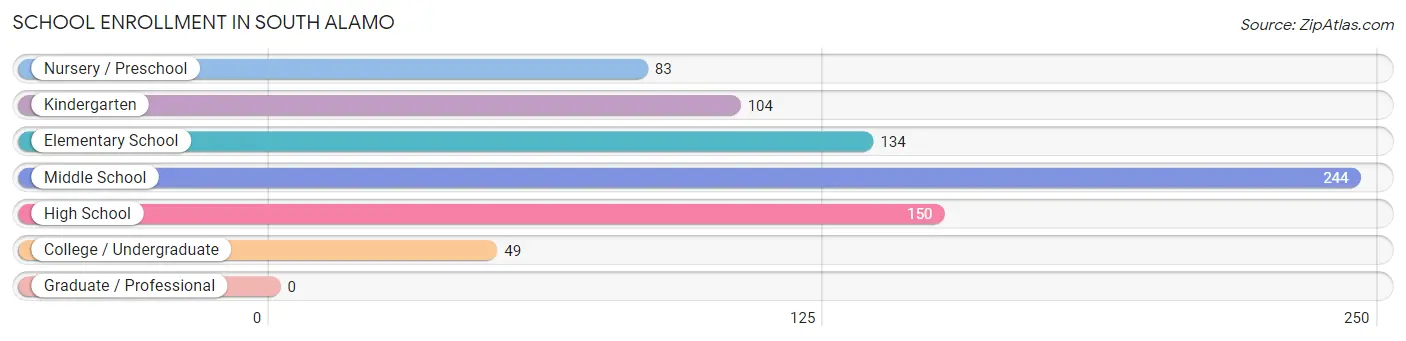
| School Level | # Students | % Students |
| Nursery / Preschool | 83 | 10.9% |
| Kindergarten | 104 | 13.6% |
| Elementary School | 134 | 17.5% |
| Middle School | 244 | 31.9% |
| High School | 150 | 19.6% |
| College / Undergraduate | 49 | 6.4% |
| Graduate / Professional | 0 | 0.0% |
| Total | 764 | 100.0% |
School Enrollment by Age by Funding Source in South Alamo
Out of a total of 764 students who are enrolled in schools in South Alamo, 6 (0.8%) attend a private institution, while the remaining 758 (99.2%) are enrolled in public schools. The age group of 3 to 4 year olds has the highest likelihood of being enrolled in private schools, with 6 (4.8% in the age bracket) enrolled. Conversely, the age group of 5 to 9 year old has the lowest likelihood of being enrolled in a private school, with 176 (100.0% in the age bracket) attending a public institution.
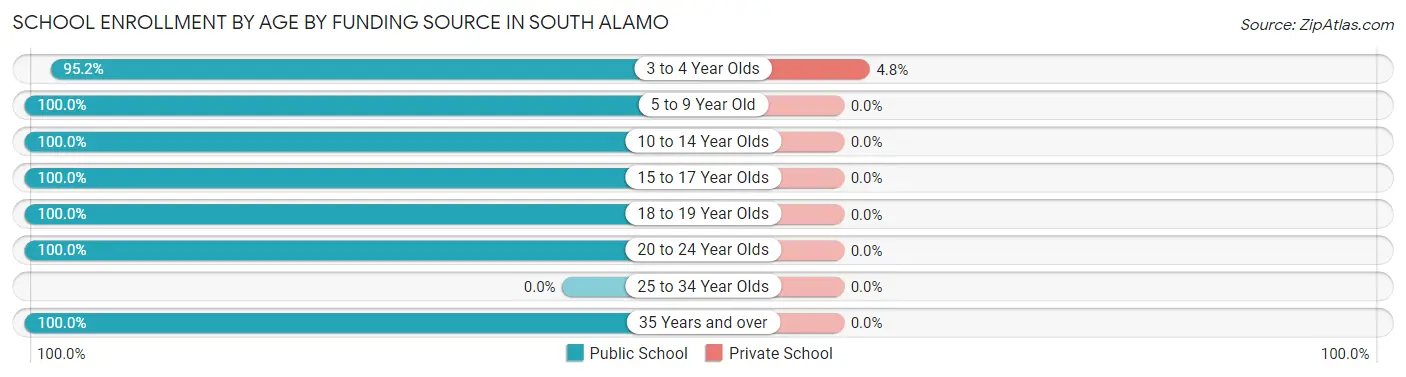
| Age Bracket | Public School | Private School |
| 3 to 4 Year Olds | 119 (95.2%) | 6 (4.8%) |
| 5 to 9 Year Old | 176 (100.0%) | 0 (0.0%) |
| 10 to 14 Year Olds | 329 (100.0%) | 0 (0.0%) |
| 15 to 17 Year Olds | 8 (100.0%) | 0 (0.0%) |
| 18 to 19 Year Olds | 52 (100.0%) | 0 (0.0%) |
| 20 to 24 Year Olds | 49 (100.0%) | 0 (0.0%) |
| 25 to 34 Year Olds | 0 (0.0%) | 0 (0.0%) |
| 35 Years and over | 25 (100.0%) | 0 (0.0%) |
| Total | 758 (99.2%) | 6 (0.8%) |
Educational Attainment by Field of Study in South Alamo
Arts & humanities (29 | 55.8%), engineering (18 | 34.6%), and science & technology (5 | 9.6%) are the most common fields of study among 52 individuals in South Alamo who have obtained a bachelor's degree or higher.
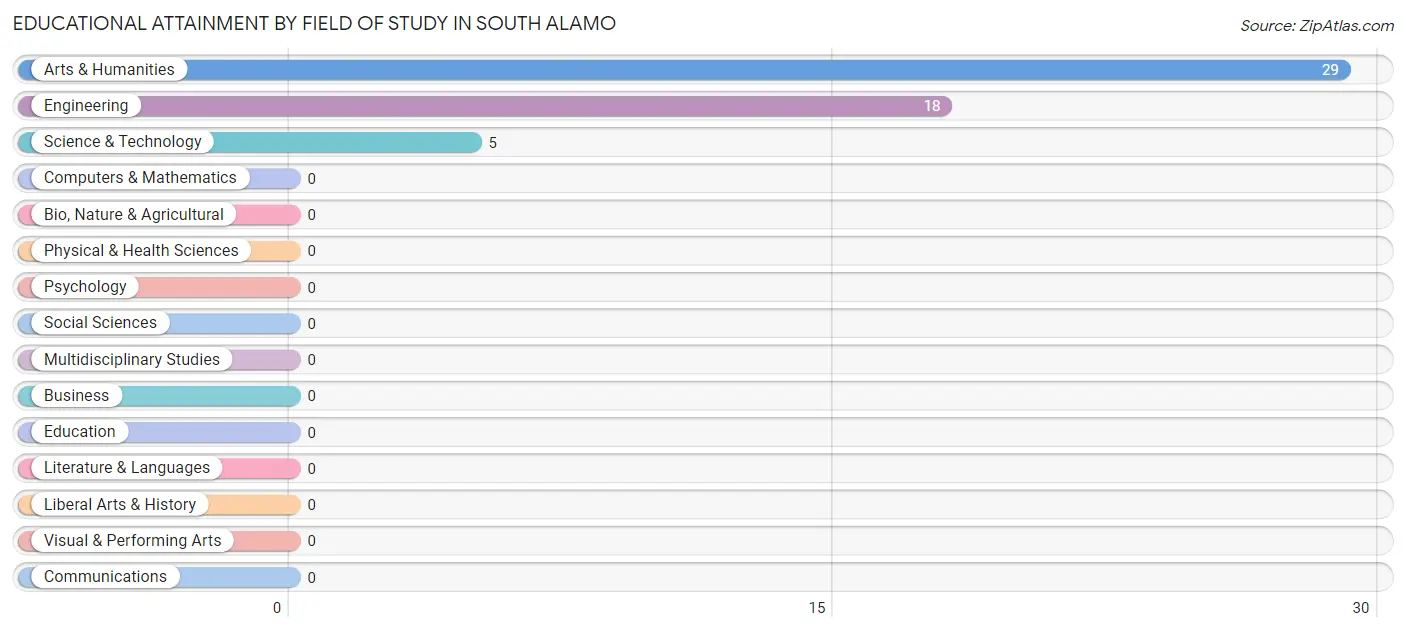
| Field of Study | # Graduates | % Graduates |
| Computers & Mathematics | 0 | 0.0% |
| Bio, Nature & Agricultural | 0 | 0.0% |
| Physical & Health Sciences | 0 | 0.0% |
| Psychology | 0 | 0.0% |
| Social Sciences | 0 | 0.0% |
| Engineering | 18 | 34.6% |
| Multidisciplinary Studies | 0 | 0.0% |
| Science & Technology | 5 | 9.6% |
| Business | 0 | 0.0% |
| Education | 0 | 0.0% |
| Literature & Languages | 0 | 0.0% |
| Liberal Arts & History | 0 | 0.0% |
| Visual & Performing Arts | 0 | 0.0% |
| Communications | 0 | 0.0% |
| Arts & Humanities | 29 | 55.8% |
| Total | 52 | 100.0% |
Transportation & Commute in South Alamo
Vehicle Availability by Sex in South Alamo
The most prevalent vehicle ownership categories in South Alamo are males with 3 vehicles (389, accounting for 43.0%) and females with 3 vehicles (120, making up 80.9%).
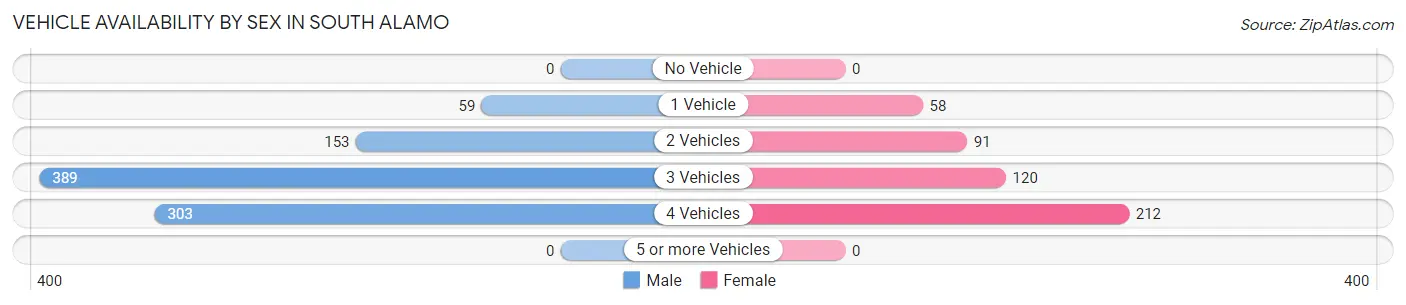
| Vehicles Available | Male | Female |
| No Vehicle | 0 (0.0%) | 0 (0.0%) |
| 1 Vehicle | 59 (6.5%) | 58 (12.1%) |
| 2 Vehicles | 153 (16.9%) | 91 (18.9%) |
| 3 Vehicles | 389 (43.0%) | 120 (24.9%) |
| 4 Vehicles | 303 (33.5%) | 212 (44.1%) |
| 5 or more Vehicles | 0 (0.0%) | 0 (0.0%) |
| Total | 904 (100.0%) | 481 (100.0%) |
Commute Time in South Alamo
The most frequently occuring commute durations in South Alamo are 35 to 39 minutes (331 commuters, 25.0%), 20 to 24 minutes (259 commuters, 19.6%), and 10 to 14 minutes (189 commuters, 14.3%).
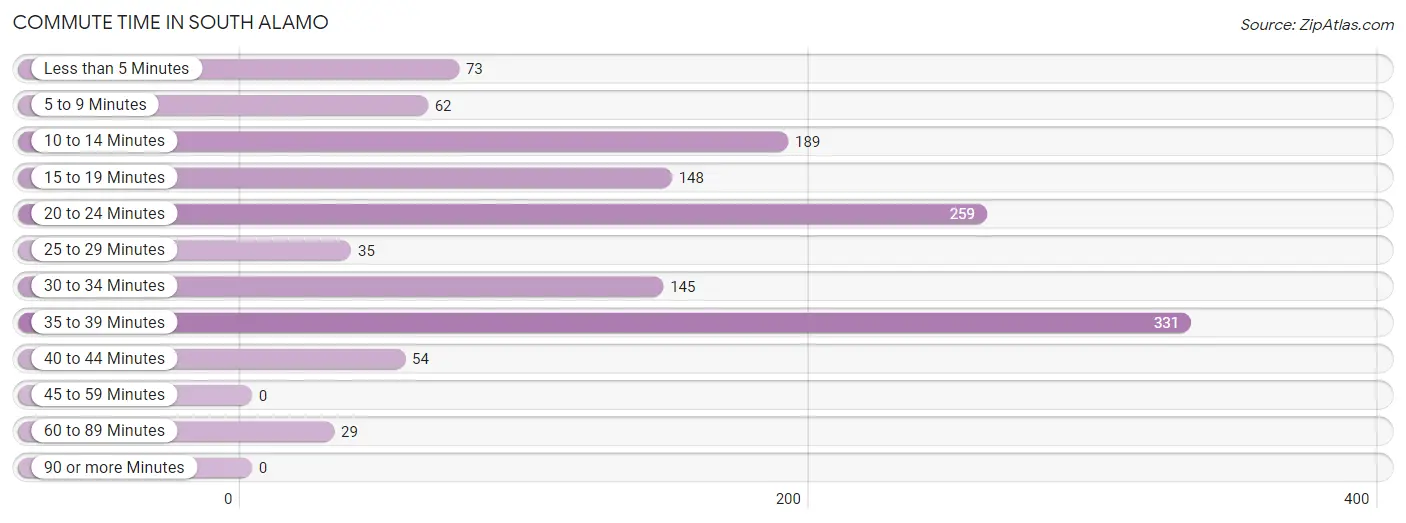
| Commute Time | # Commuters | % Commuters |
| Less than 5 Minutes | 73 | 5.5% |
| 5 to 9 Minutes | 62 | 4.7% |
| 10 to 14 Minutes | 189 | 14.3% |
| 15 to 19 Minutes | 148 | 11.2% |
| 20 to 24 Minutes | 259 | 19.6% |
| 25 to 29 Minutes | 35 | 2.6% |
| 30 to 34 Minutes | 145 | 10.9% |
| 35 to 39 Minutes | 331 | 25.0% |
| 40 to 44 Minutes | 54 | 4.1% |
| 45 to 59 Minutes | 0 | 0.0% |
| 60 to 89 Minutes | 29 | 2.2% |
| 90 or more Minutes | 0 | 0.0% |
Commute Time by Sex in South Alamo
The most common commute times in South Alamo are 20 to 24 minutes (238 commuters, 26.9%) for males and 30 to 34 minutes (127 commuters, 28.9%) for females.
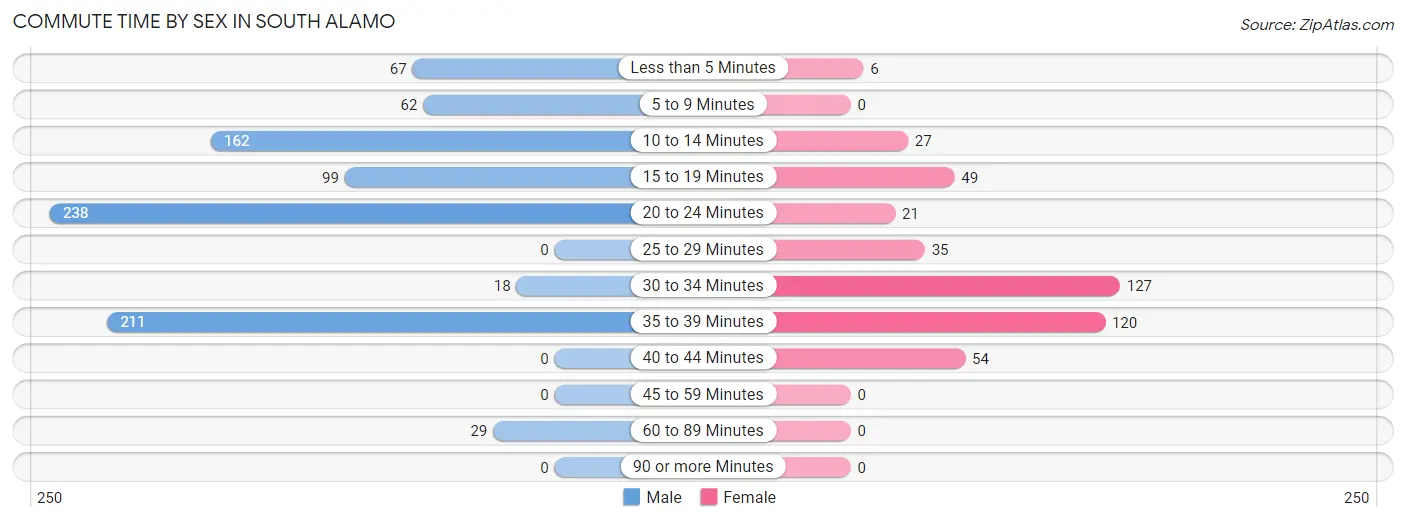
| Commute Time | Male | Female |
| Less than 5 Minutes | 67 (7.6%) | 6 (1.4%) |
| 5 to 9 Minutes | 62 (7.0%) | 0 (0.0%) |
| 10 to 14 Minutes | 162 (18.3%) | 27 (6.1%) |
| 15 to 19 Minutes | 99 (11.2%) | 49 (11.2%) |
| 20 to 24 Minutes | 238 (26.9%) | 21 (4.8%) |
| 25 to 29 Minutes | 0 (0.0%) | 35 (8.0%) |
| 30 to 34 Minutes | 18 (2.0%) | 127 (28.9%) |
| 35 to 39 Minutes | 211 (23.8%) | 120 (27.3%) |
| 40 to 44 Minutes | 0 (0.0%) | 54 (12.3%) |
| 45 to 59 Minutes | 0 (0.0%) | 0 (0.0%) |
| 60 to 89 Minutes | 29 (3.3%) | 0 (0.0%) |
| 90 or more Minutes | 0 (0.0%) | 0 (0.0%) |
Time of Departure to Work by Sex in South Alamo
The most frequent times of departure to work in South Alamo are 7:30 AM to 7:59 AM (159, 17.9%) for males and 4:00 PM to 11:59 PM (212, 48.3%) for females.
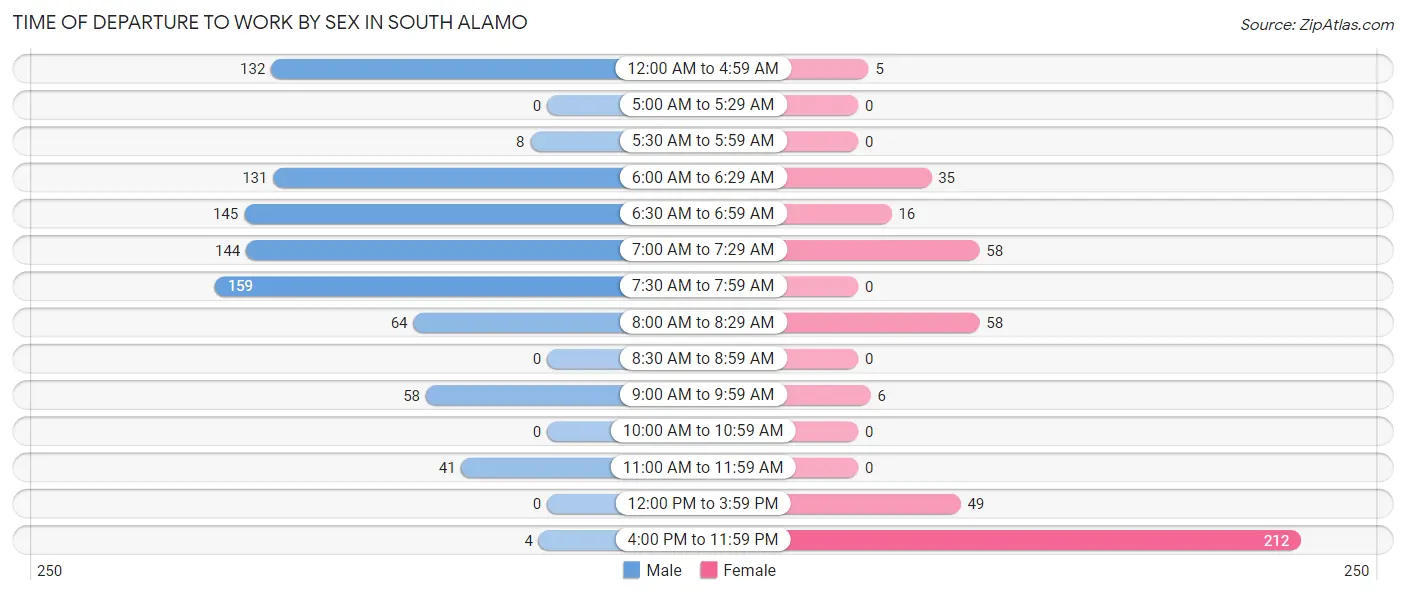
| Time of Departure | Male | Female |
| 12:00 AM to 4:59 AM | 132 (14.9%) | 5 (1.1%) |
| 5:00 AM to 5:29 AM | 0 (0.0%) | 0 (0.0%) |
| 5:30 AM to 5:59 AM | 8 (0.9%) | 0 (0.0%) |
| 6:00 AM to 6:29 AM | 131 (14.8%) | 35 (8.0%) |
| 6:30 AM to 6:59 AM | 145 (16.4%) | 16 (3.6%) |
| 7:00 AM to 7:29 AM | 144 (16.3%) | 58 (13.2%) |
| 7:30 AM to 7:59 AM | 159 (17.9%) | 0 (0.0%) |
| 8:00 AM to 8:29 AM | 64 (7.2%) | 58 (13.2%) |
| 8:30 AM to 8:59 AM | 0 (0.0%) | 0 (0.0%) |
| 9:00 AM to 9:59 AM | 58 (6.6%) | 6 (1.4%) |
| 10:00 AM to 10:59 AM | 0 (0.0%) | 0 (0.0%) |
| 11:00 AM to 11:59 AM | 41 (4.6%) | 0 (0.0%) |
| 12:00 PM to 3:59 PM | 0 (0.0%) | 49 (11.2%) |
| 4:00 PM to 11:59 PM | 4 (0.4%) | 212 (48.3%) |
| Total | 886 (100.0%) | 439 (100.0%) |
Housing Occupancy in South Alamo
Occupancy by Ownership in South Alamo
Of the total 931 dwellings in South Alamo, owner-occupied units account for 869 (93.3%), while renter-occupied units make up 62 (6.7%).
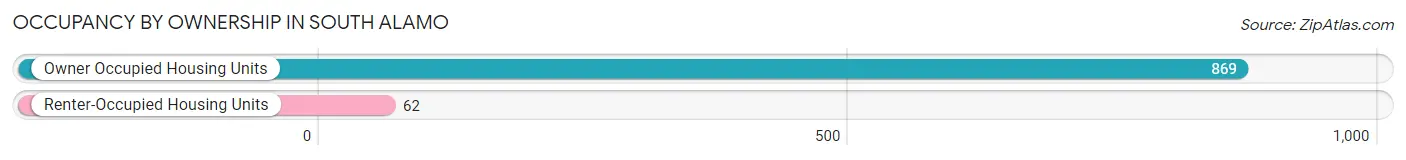
| Occupancy | # Housing Units | % Housing Units |
| Owner Occupied Housing Units | 869 | 93.3% |
| Renter-Occupied Housing Units | 62 | 6.7% |
| Total Occupied Housing Units | 931 | 100.0% |
Occupancy by Household Size in South Alamo
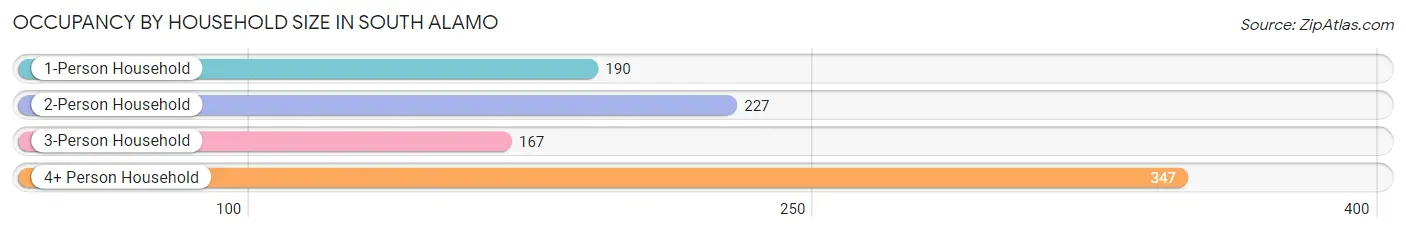
| Household Size | # Housing Units | % Housing Units |
| 1-Person Household | 190 | 20.4% |
| 2-Person Household | 227 | 24.4% |
| 3-Person Household | 167 | 17.9% |
| 4+ Person Household | 347 | 37.3% |
| Total Housing Units | 931 | 100.0% |
Occupancy by Ownership by Household Size in South Alamo
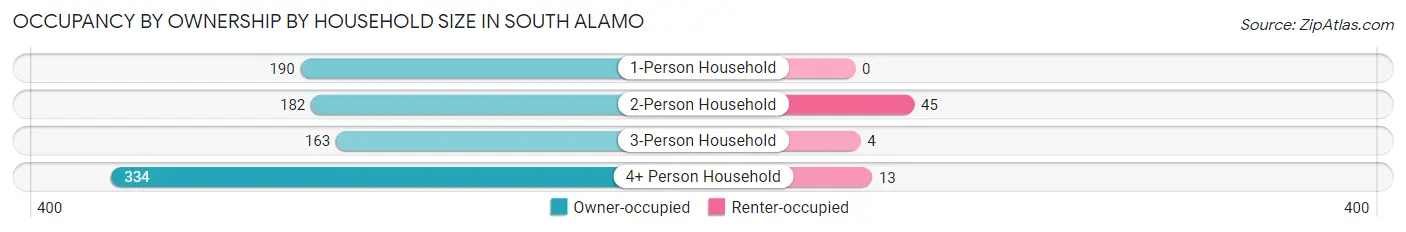
| Household Size | Owner-occupied | Renter-occupied |
| 1-Person Household | 190 (100.0%) | 0 (0.0%) |
| 2-Person Household | 182 (80.2%) | 45 (19.8%) |
| 3-Person Household | 163 (97.6%) | 4 (2.4%) |
| 4+ Person Household | 334 (96.3%) | 13 (3.7%) |
| Total Housing Units | 869 (93.3%) | 62 (6.7%) |
Occupancy by Educational Attainment in South Alamo
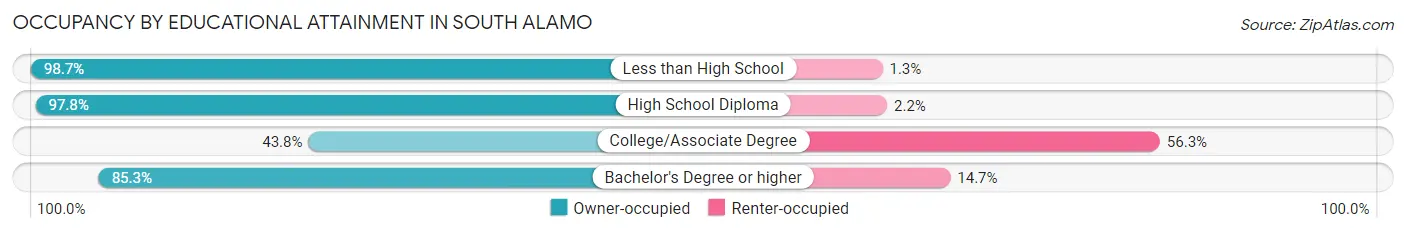
| Household Size | Owner-occupied | Renter-occupied |
| Less than High School | 625 (98.7%) | 8 (1.3%) |
| High School Diploma | 180 (97.8%) | 4 (2.2%) |
| College/Associate Degree | 35 (43.8%) | 45 (56.2%) |
| Bachelor's Degree or higher | 29 (85.3%) | 5 (14.7%) |
Occupancy by Age of Householder in South Alamo
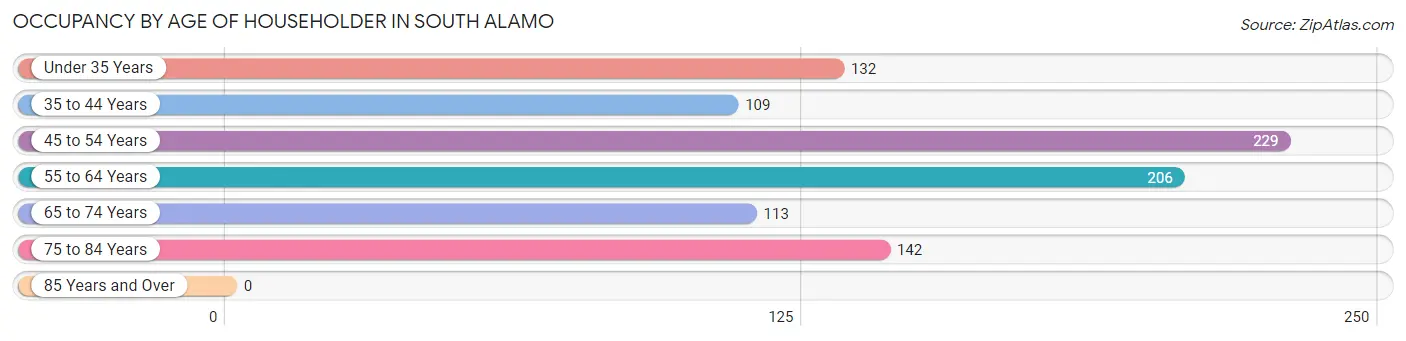
| Age Bracket | # Households | % Households |
| Under 35 Years | 132 | 14.2% |
| 35 to 44 Years | 109 | 11.7% |
| 45 to 54 Years | 229 | 24.6% |
| 55 to 64 Years | 206 | 22.1% |
| 65 to 74 Years | 113 | 12.1% |
| 75 to 84 Years | 142 | 15.2% |
| 85 Years and Over | 0 | 0.0% |
| Total | 931 | 100.0% |
Housing Finances in South Alamo
Median Income by Occupancy in South Alamo
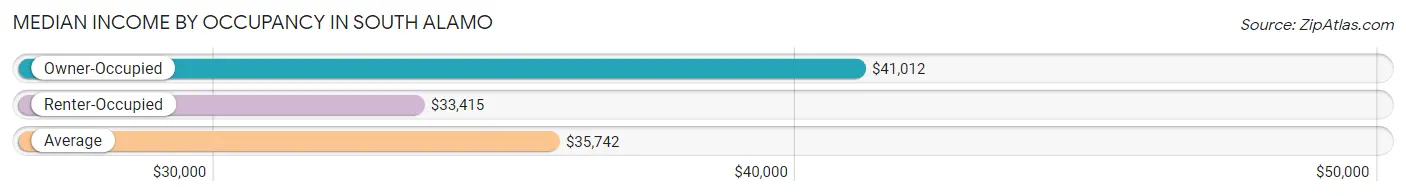
| Occupancy Type | # Households | Median Income |
| Owner-Occupied | 869 (93.3%) | $41,012 |
| Renter-Occupied | 62 (6.7%) | $33,415 |
| Average | 931 (100.0%) | $35,742 |
Occupancy by Householder Income Bracket in South Alamo
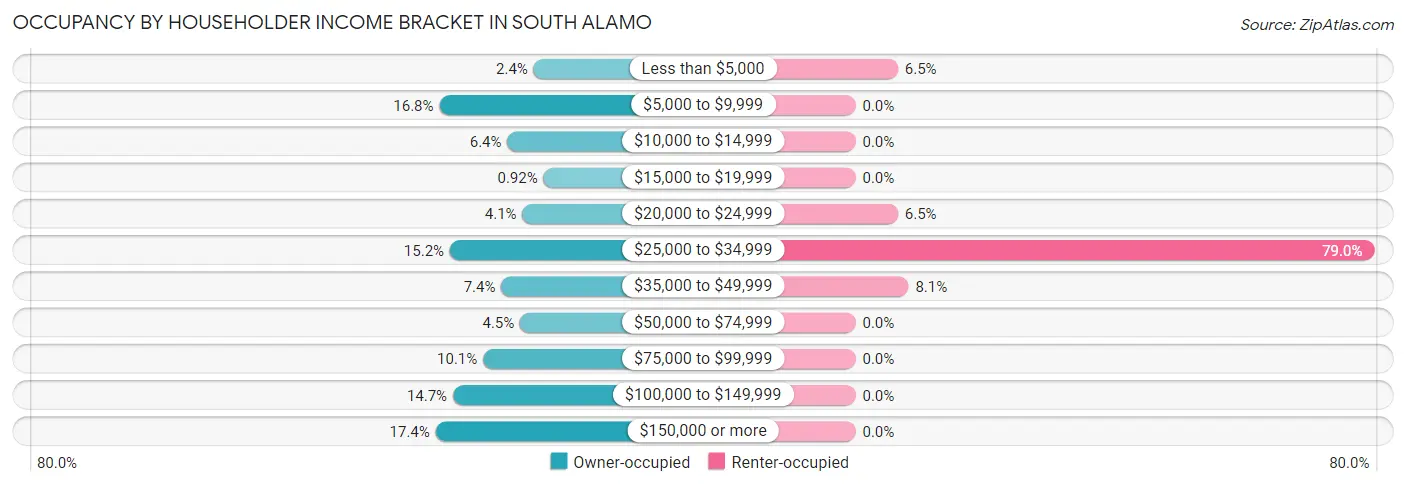
| Income Bracket | Owner-occupied | Renter-occupied |
| Less than $5,000 | 21 (2.4%) | 4 (6.5%) |
| $5,000 to $9,999 | 146 (16.8%) | 0 (0.0%) |
| $10,000 to $14,999 | 56 (6.4%) | 0 (0.0%) |
| $15,000 to $19,999 | 8 (0.9%) | 0 (0.0%) |
| $20,000 to $24,999 | 36 (4.1%) | 4 (6.5%) |
| $25,000 to $34,999 | 132 (15.2%) | 49 (79.0%) |
| $35,000 to $49,999 | 64 (7.4%) | 5 (8.1%) |
| $50,000 to $74,999 | 39 (4.5%) | 0 (0.0%) |
| $75,000 to $99,999 | 88 (10.1%) | 0 (0.0%) |
| $100,000 to $149,999 | 128 (14.7%) | 0 (0.0%) |
| $150,000 or more | 151 (17.4%) | 0 (0.0%) |
| Total | 869 (100.0%) | 62 (100.0%) |
Monthly Housing Cost Tiers in South Alamo
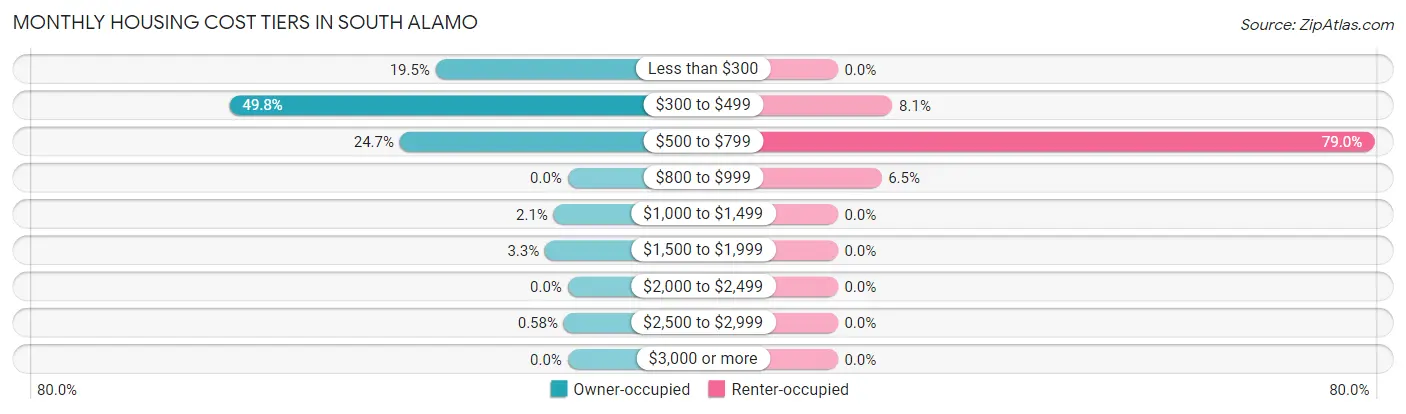
| Monthly Cost | Owner-occupied | Renter-occupied |
| Less than $300 | 169 (19.5%) | 0 (0.0%) |
| $300 to $499 | 433 (49.8%) | 5 (8.1%) |
| $500 to $799 | 215 (24.7%) | 49 (79.0%) |
| $800 to $999 | 0 (0.0%) | 4 (6.5%) |
| $1,000 to $1,499 | 18 (2.1%) | 0 (0.0%) |
| $1,500 to $1,999 | 29 (3.3%) | 0 (0.0%) |
| $2,000 to $2,499 | 0 (0.0%) | 0 (0.0%) |
| $2,500 to $2,999 | 5 (0.6%) | 0 (0.0%) |
| $3,000 or more | 0 (0.0%) | 0 (0.0%) |
| Total | 869 (100.0%) | 62 (100.0%) |
Physical Housing Characteristics in South Alamo
Housing Structures in South Alamo
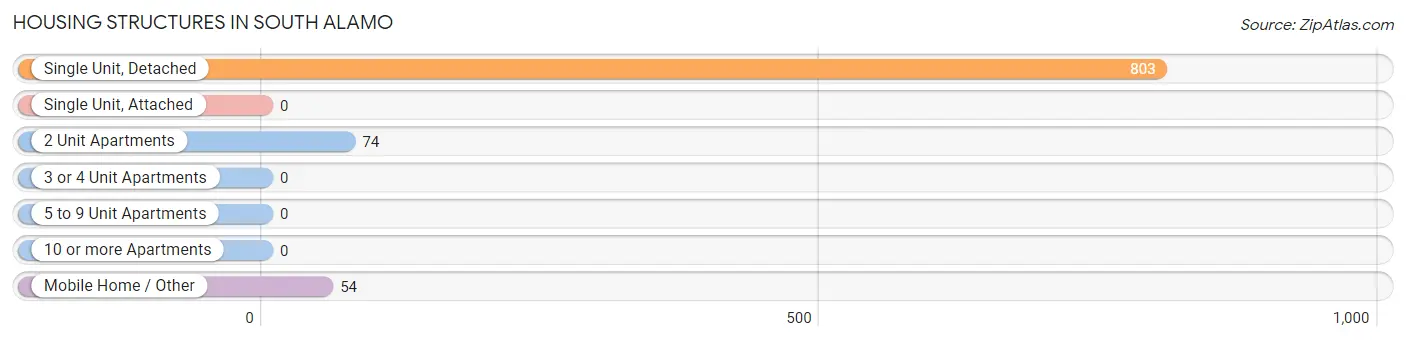
| Structure Type | # Housing Units | % Housing Units |
| Single Unit, Detached | 803 | 86.3% |
| Single Unit, Attached | 0 | 0.0% |
| 2 Unit Apartments | 74 | 8.0% |
| 3 or 4 Unit Apartments | 0 | 0.0% |
| 5 to 9 Unit Apartments | 0 | 0.0% |
| 10 or more Apartments | 0 | 0.0% |
| Mobile Home / Other | 54 | 5.8% |
| Total | 931 | 100.0% |
Housing Structures by Occupancy in South Alamo
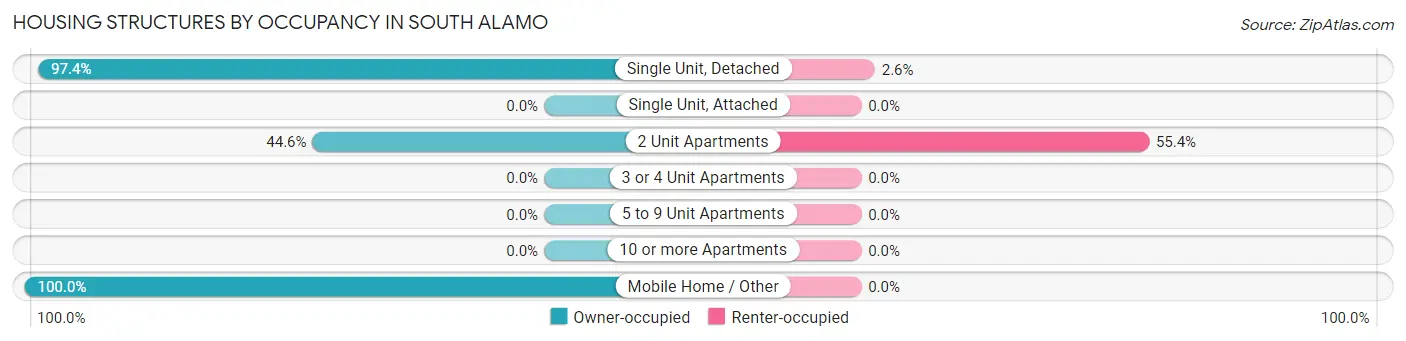
| Structure Type | Owner-occupied | Renter-occupied |
| Single Unit, Detached | 782 (97.4%) | 21 (2.6%) |
| Single Unit, Attached | 0 (0.0%) | 0 (0.0%) |
| 2 Unit Apartments | 33 (44.6%) | 41 (55.4%) |
| 3 or 4 Unit Apartments | 0 (0.0%) | 0 (0.0%) |
| 5 to 9 Unit Apartments | 0 (0.0%) | 0 (0.0%) |
| 10 or more Apartments | 0 (0.0%) | 0 (0.0%) |
| Mobile Home / Other | 54 (100.0%) | 0 (0.0%) |
| Total | 869 (93.3%) | 62 (6.7%) |
Housing Structures by Number of Rooms in South Alamo
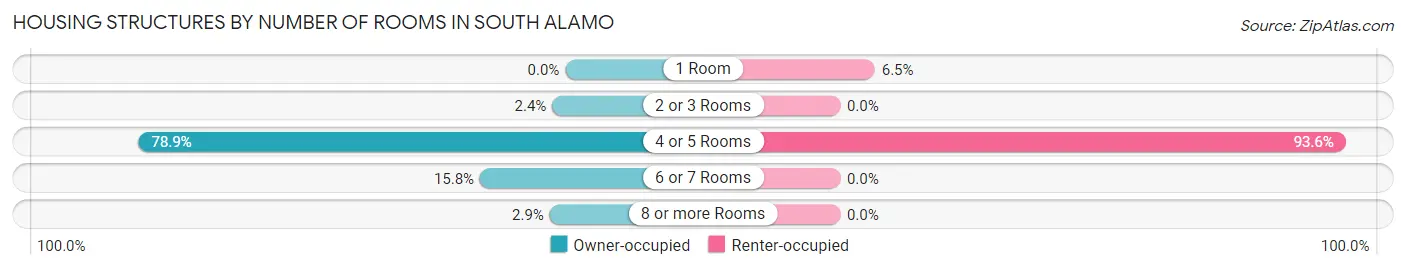
| Number of Rooms | Owner-occupied | Renter-occupied |
| 1 Room | 0 (0.0%) | 4 (6.5%) |
| 2 or 3 Rooms | 21 (2.4%) | 0 (0.0%) |
| 4 or 5 Rooms | 686 (78.9%) | 58 (93.5%) |
| 6 or 7 Rooms | 137 (15.8%) | 0 (0.0%) |
| 8 or more Rooms | 25 (2.9%) | 0 (0.0%) |
| Total | 869 (100.0%) | 62 (100.0%) |
Housing Structure by Heating Type in South Alamo
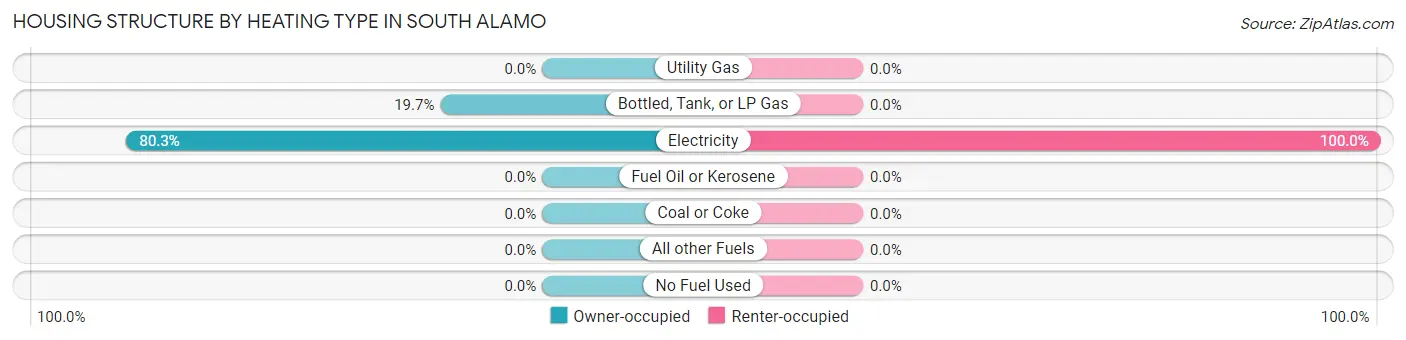
| Heating Type | Owner-occupied | Renter-occupied |
| Utility Gas | 0 (0.0%) | 0 (0.0%) |
| Bottled, Tank, or LP Gas | 171 (19.7%) | 0 (0.0%) |
| Electricity | 698 (80.3%) | 62 (100.0%) |
| Fuel Oil or Kerosene | 0 (0.0%) | 0 (0.0%) |
| Coal or Coke | 0 (0.0%) | 0 (0.0%) |
| All other Fuels | 0 (0.0%) | 0 (0.0%) |
| No Fuel Used | 0 (0.0%) | 0 (0.0%) |
| Total | 869 (100.0%) | 62 (100.0%) |
Household Vehicle Usage in South Alamo
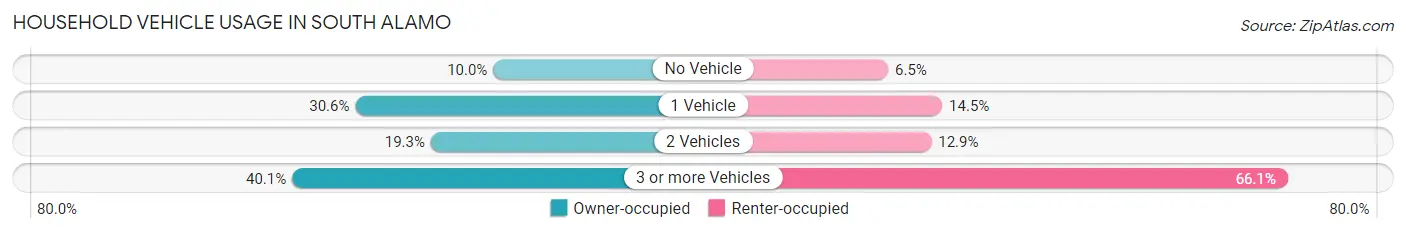
| Vehicles per Household | Owner-occupied | Renter-occupied |
| No Vehicle | 87 (10.0%) | 4 (6.5%) |
| 1 Vehicle | 266 (30.6%) | 9 (14.5%) |
| 2 Vehicles | 168 (19.3%) | 8 (12.9%) |
| 3 or more Vehicles | 348 (40.1%) | 41 (66.1%) |
| Total | 869 (100.0%) | 62 (100.0%) |
Real Estate & Mortgages in South Alamo
Real Estate and Mortgage Overview in South Alamo
| Characteristic | Without Mortgage | With Mortgage |
| Housing Units | 715 | 154 |
| Median Property Value | $71,000 | $55,400 |
| Median Household Income | - | - |
| Monthly Housing Costs | $347 | $0 |
| Real Estate Taxes | $586 | $0 |
Property Value by Mortgage Status in South Alamo
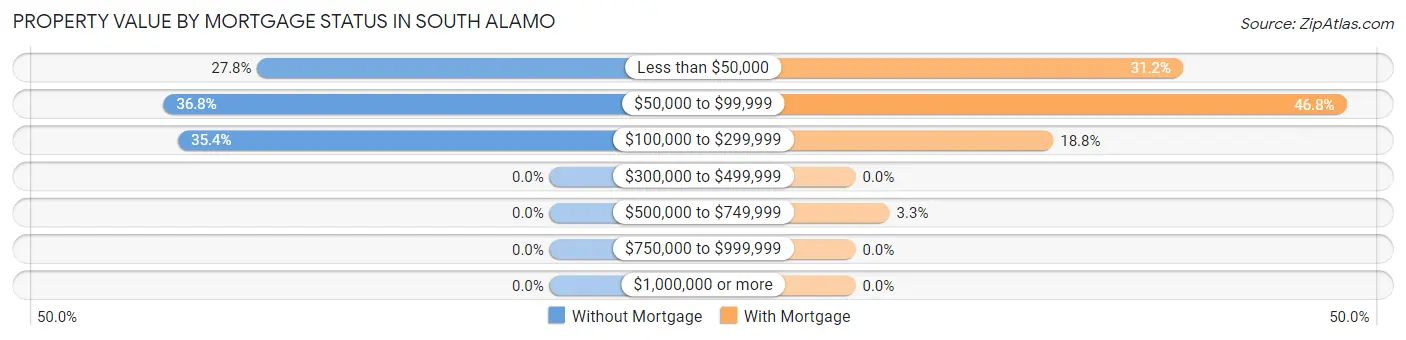
| Property Value | Without Mortgage | With Mortgage |
| Less than $50,000 | 199 (27.8%) | 48 (31.2%) |
| $50,000 to $99,999 | 263 (36.8%) | 72 (46.8%) |
| $100,000 to $299,999 | 253 (35.4%) | 29 (18.8%) |
| $300,000 to $499,999 | 0 (0.0%) | 0 (0.0%) |
| $500,000 to $749,999 | 0 (0.0%) | 5 (3.3%) |
| $750,000 to $999,999 | 0 (0.0%) | 0 (0.0%) |
| $1,000,000 or more | 0 (0.0%) | 0 (0.0%) |
| Total | 715 (100.0%) | 154 (100.0%) |
Household Income by Mortgage Status in South Alamo
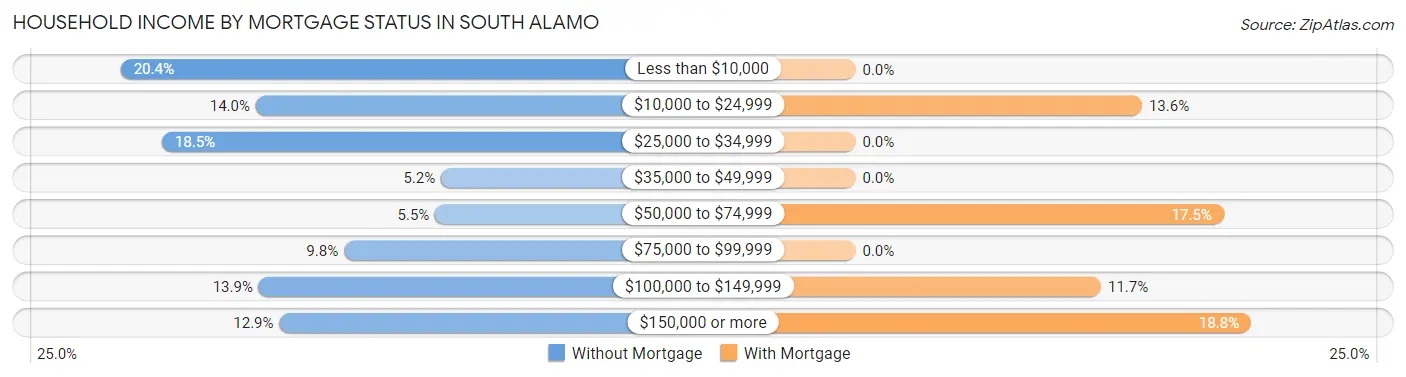
| Household Income | Without Mortgage | With Mortgage |
| Less than $10,000 | 146 (20.4%) | 0 (0.0%) |
| $10,000 to $24,999 | 100 (14.0%) | 21 (13.6%) |
| $25,000 to $34,999 | 132 (18.5%) | 0 (0.0%) |
| $35,000 to $49,999 | 37 (5.2%) | 0 (0.0%) |
| $50,000 to $74,999 | 39 (5.4%) | 27 (17.5%) |
| $75,000 to $99,999 | 70 (9.8%) | 0 (0.0%) |
| $100,000 to $149,999 | 99 (13.9%) | 18 (11.7%) |
| $150,000 or more | 92 (12.9%) | 29 (18.8%) |
| Total | 715 (100.0%) | 154 (100.0%) |
Property Value to Household Income Ratio in South Alamo
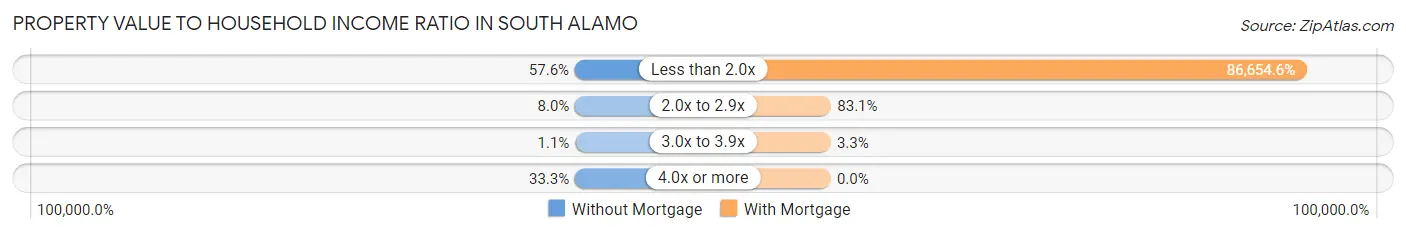
| Value-to-Income Ratio | Without Mortgage | With Mortgage |
| Less than 2.0x | 412 (57.6%) | 133,448 (86,654.5%) |
| 2.0x to 2.9x | 57 (8.0%) | 128 (83.1%) |
| 3.0x to 3.9x | 8 (1.1%) | 5 (3.3%) |
| 4.0x or more | 238 (33.3%) | 0 (0.0%) |
| Total | 715 (100.0%) | 154 (100.0%) |
Real Estate Taxes by Mortgage Status in South Alamo
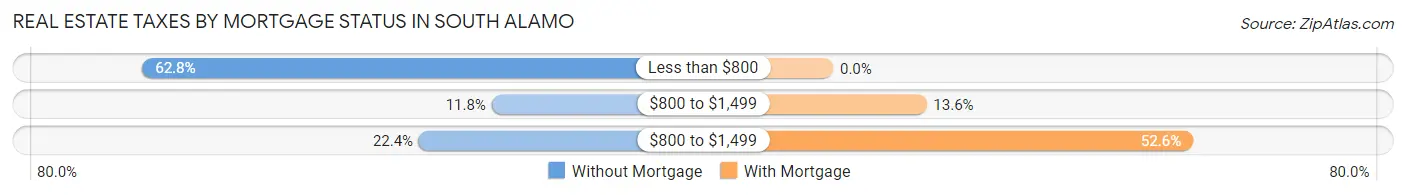
| Property Taxes | Without Mortgage | With Mortgage |
| Less than $800 | 449 (62.8%) | 0 (0.0%) |
| $800 to $1,499 | 84 (11.7%) | 21 (13.6%) |
| $800 to $1,499 | 160 (22.4%) | 81 (52.6%) |
| Total | 715 (100.0%) | 154 (100.0%) |
Health & Disability in South Alamo
Health Insurance Coverage by Age in South Alamo
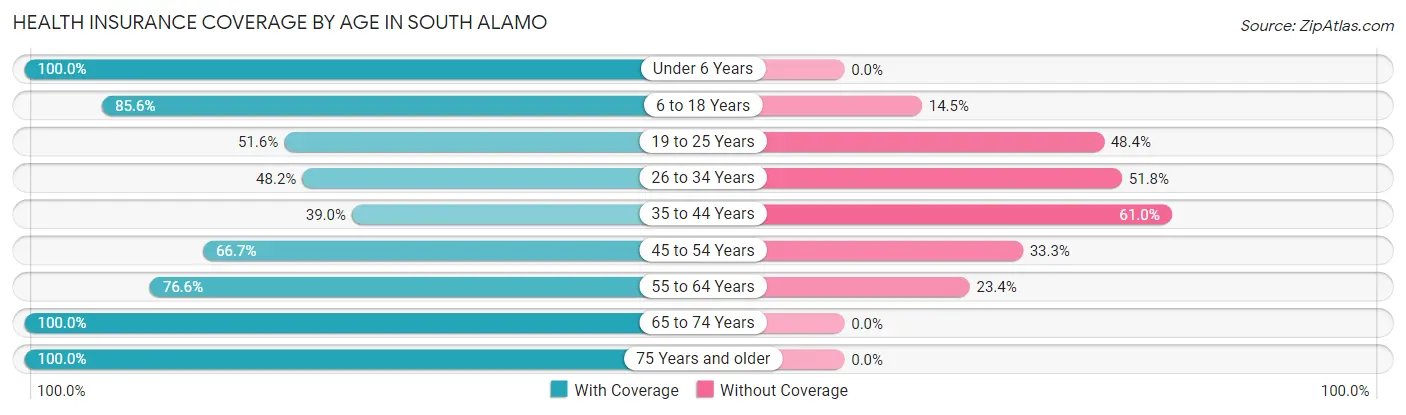
| Age Bracket | With Coverage | Without Coverage |
| Under 6 Years | 400 (100.0%) | 0 (0.0%) |
| 6 to 18 Years | 515 (85.6%) | 87 (14.4%) |
| 19 to 25 Years | 286 (51.6%) | 268 (48.4%) |
| 26 to 34 Years | 206 (48.2%) | 221 (51.8%) |
| 35 to 44 Years | 99 (39.0%) | 155 (61.0%) |
| 45 to 54 Years | 343 (66.7%) | 171 (33.3%) |
| 55 to 64 Years | 210 (76.6%) | 64 (23.4%) |
| 65 to 74 Years | 204 (100.0%) | 0 (0.0%) |
| 75 Years and older | 204 (100.0%) | 0 (0.0%) |
| Total | 2,467 (71.9%) | 966 (28.1%) |
Health Insurance Coverage by Citizenship Status in South Alamo
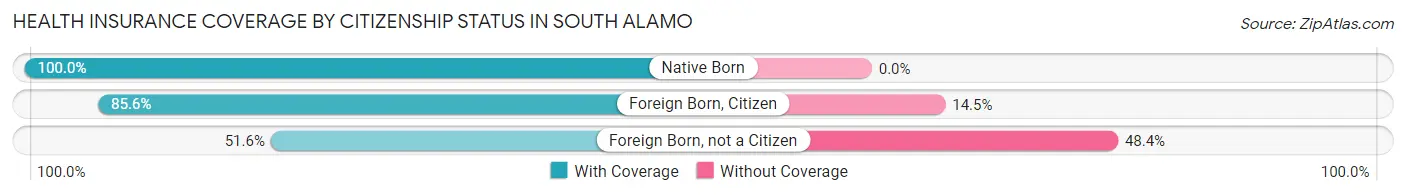
| Citizenship Status | With Coverage | Without Coverage |
| Native Born | 400 (100.0%) | 0 (0.0%) |
| Foreign Born, Citizen | 515 (85.6%) | 87 (14.4%) |
| Foreign Born, not a Citizen | 286 (51.6%) | 268 (48.4%) |
Health Insurance Coverage by Household Income in South Alamo
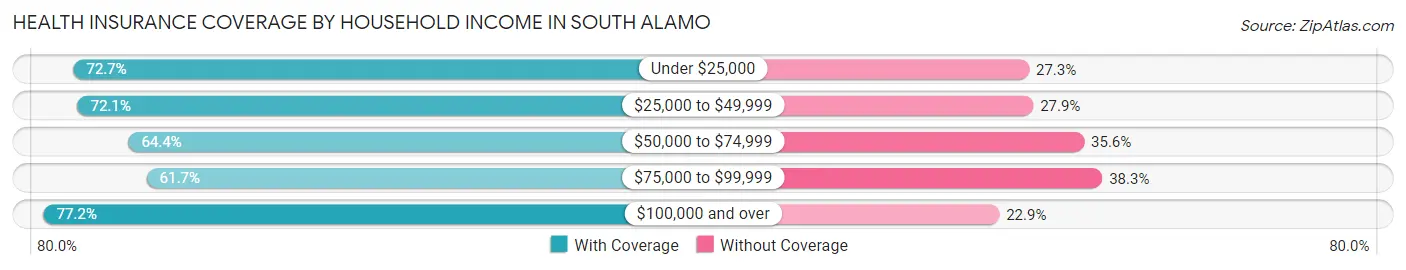
| Household Income | With Coverage | Without Coverage |
| Under $25,000 | 338 (72.7%) | 127 (27.3%) |
| $25,000 to $49,999 | 673 (72.1%) | 261 (27.9%) |
| $50,000 to $74,999 | 163 (64.4%) | 90 (35.6%) |
| $75,000 to $99,999 | 324 (61.7%) | 201 (38.3%) |
| $100,000 and over | 969 (77.1%) | 287 (22.9%) |
Public vs Private Health Insurance Coverage by Age in South Alamo
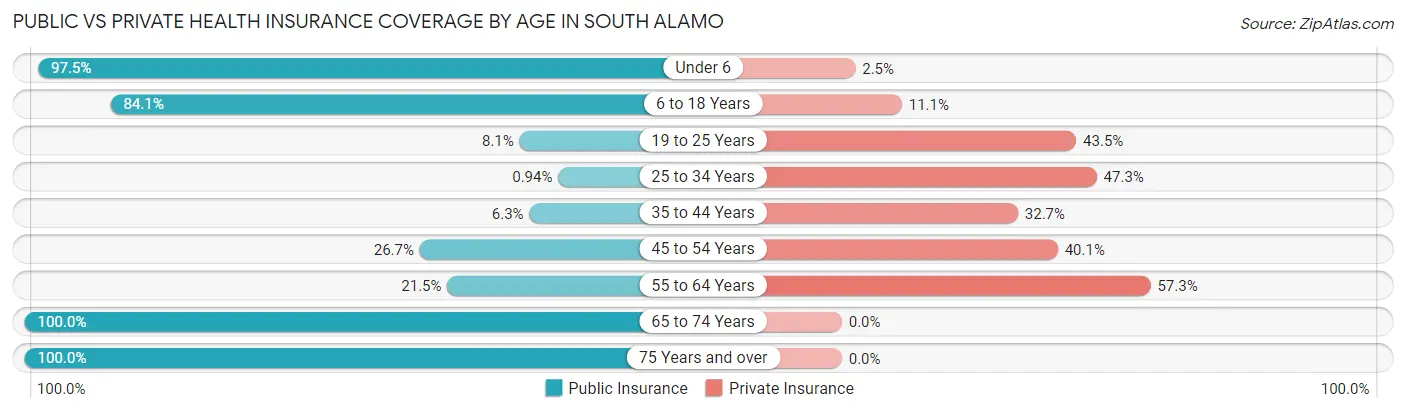
| Age Bracket | Public Insurance | Private Insurance |
| Under 6 | 390 (97.5%) | 10 (2.5%) |
| 6 to 18 Years | 506 (84.1%) | 67 (11.1%) |
| 19 to 25 Years | 45 (8.1%) | 241 (43.5%) |
| 25 to 34 Years | 4 (0.9%) | 202 (47.3%) |
| 35 to 44 Years | 16 (6.3%) | 83 (32.7%) |
| 45 to 54 Years | 137 (26.7%) | 206 (40.1%) |
| 55 to 64 Years | 59 (21.5%) | 157 (57.3%) |
| 65 to 74 Years | 204 (100.0%) | 0 (0.0%) |
| 75 Years and over | 204 (100.0%) | 0 (0.0%) |
| Total | 1,565 (45.6%) | 966 (28.1%) |
Disability Status by Sex by Age in South Alamo
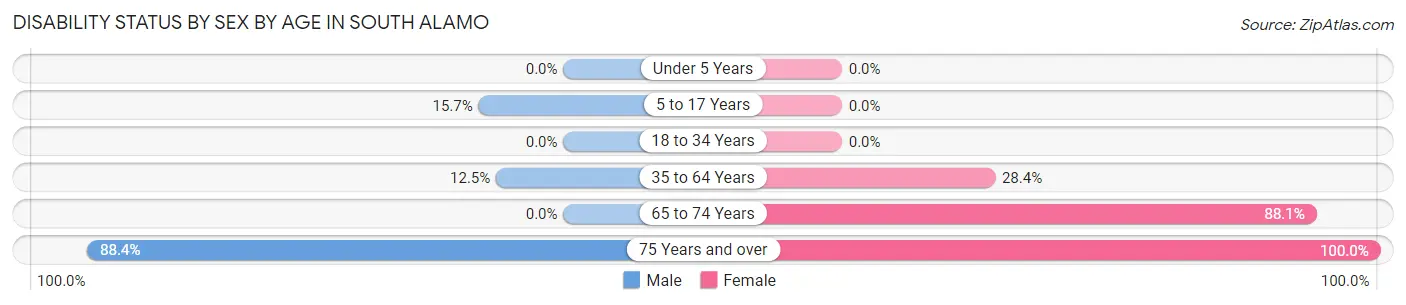
| Age Bracket | Male | Female |
| Under 5 Years | 0 (0.0%) | 0 (0.0%) |
| 5 to 17 Years | 51 (15.7%) | 0 (0.0%) |
| 18 to 34 Years | 0 (0.0%) | 0 (0.0%) |
| 35 to 64 Years | 69 (12.5%) | 139 (28.4%) |
| 65 to 74 Years | 0 (0.0%) | 163 (88.1%) |
| 75 Years and over | 137 (88.4%) | 49 (100.0%) |
Disability Class by Sex by Age in South Alamo
Disability Class: Hearing Difficulty
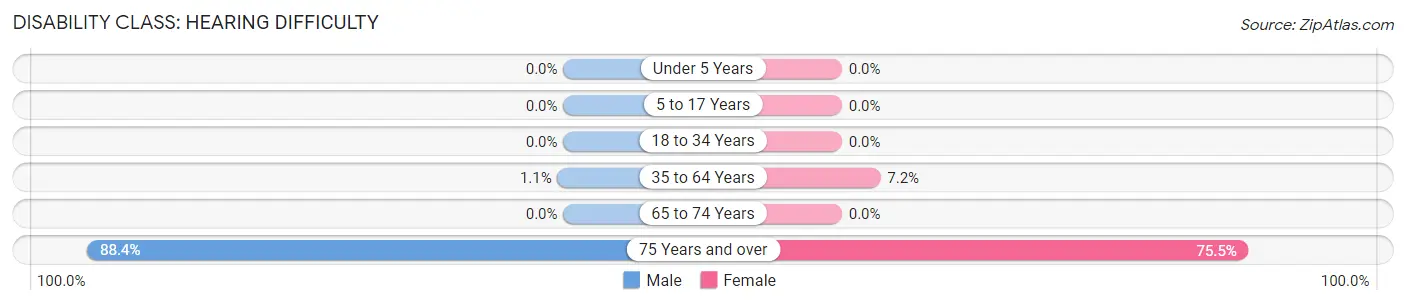
| Age Bracket | Male | Female |
| Under 5 Years | 0 (0.0%) | 0 (0.0%) |
| 5 to 17 Years | 0 (0.0%) | 0 (0.0%) |
| 18 to 34 Years | 0 (0.0%) | 0 (0.0%) |
| 35 to 64 Years | 6 (1.1%) | 35 (7.2%) |
| 65 to 74 Years | 0 (0.0%) | 0 (0.0%) |
| 75 Years and over | 137 (88.4%) | 37 (75.5%) |
Disability Class: Vision Difficulty
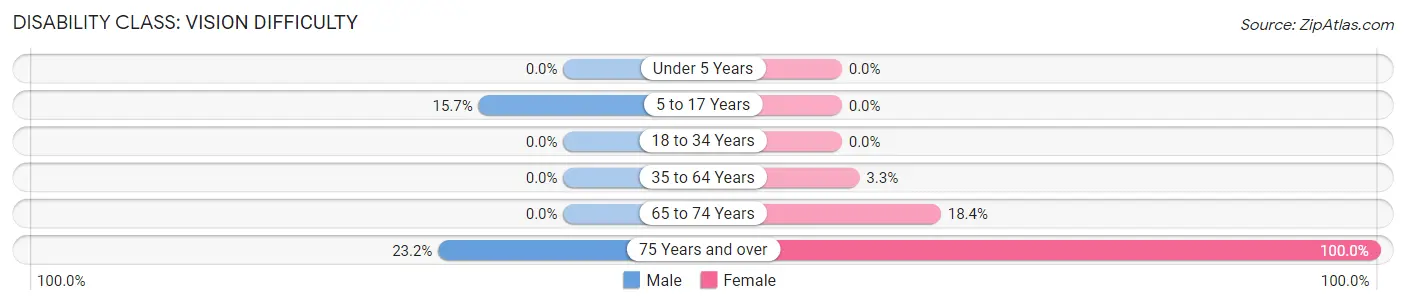
| Age Bracket | Male | Female |
| Under 5 Years | 0 (0.0%) | 0 (0.0%) |
| 5 to 17 Years | 51 (15.7%) | 0 (0.0%) |
| 18 to 34 Years | 0 (0.0%) | 0 (0.0%) |
| 35 to 64 Years | 0 (0.0%) | 16 (3.3%) |
| 65 to 74 Years | 0 (0.0%) | 34 (18.4%) |
| 75 Years and over | 36 (23.2%) | 49 (100.0%) |
Disability Class: Cognitive Difficulty
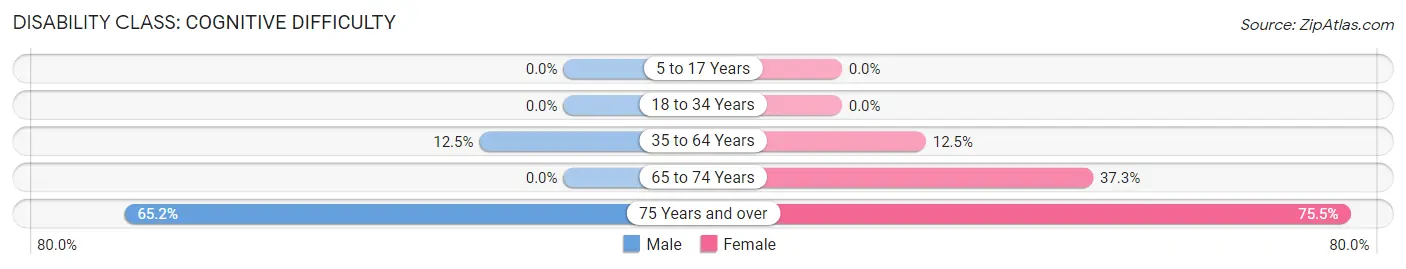
| Age Bracket | Male | Female |
| 5 to 17 Years | 0 (0.0%) | 0 (0.0%) |
| 18 to 34 Years | 0 (0.0%) | 0 (0.0%) |
| 35 to 64 Years | 69 (12.5%) | 61 (12.5%) |
| 65 to 74 Years | 0 (0.0%) | 69 (37.3%) |
| 75 Years and over | 101 (65.2%) | 37 (75.5%) |
Disability Class: Ambulatory Difficulty
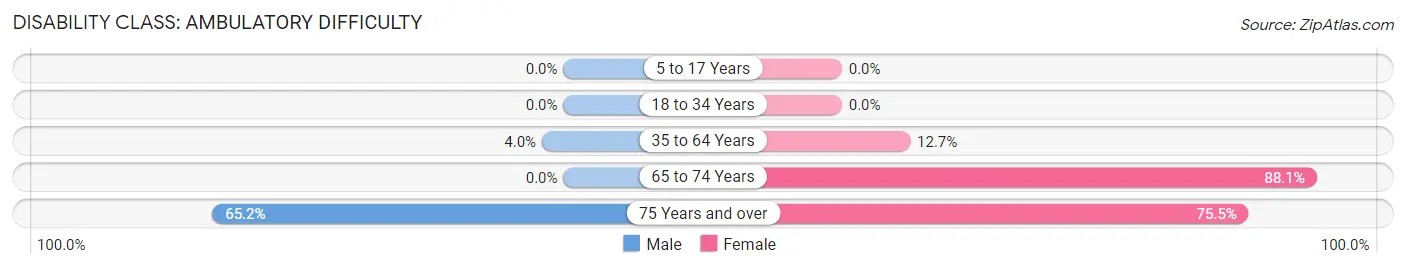
| Age Bracket | Male | Female |
| 5 to 17 Years | 0 (0.0%) | 0 (0.0%) |
| 18 to 34 Years | 0 (0.0%) | 0 (0.0%) |
| 35 to 64 Years | 22 (4.0%) | 62 (12.7%) |
| 65 to 74 Years | 0 (0.0%) | 163 (88.1%) |
| 75 Years and over | 101 (65.2%) | 37 (75.5%) |
Disability Class: Self-Care Difficulty
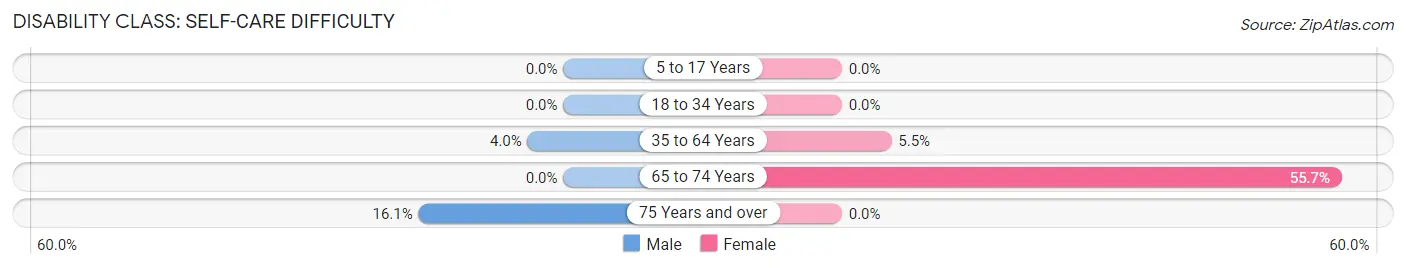
| Age Bracket | Male | Female |
| 5 to 17 Years | 0 (0.0%) | 0 (0.0%) |
| 18 to 34 Years | 0 (0.0%) | 0 (0.0%) |
| 35 to 64 Years | 22 (4.0%) | 27 (5.5%) |
| 65 to 74 Years | 0 (0.0%) | 103 (55.7%) |
| 75 Years and over | 25 (16.1%) | 0 (0.0%) |
Technology Access in South Alamo
Computing Device Access in South Alamo
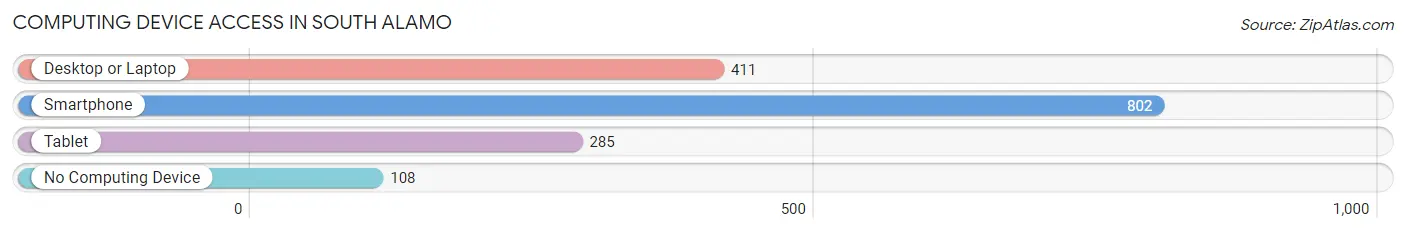
| Device Type | # Households | % Households |
| Desktop or Laptop | 411 | 44.2% |
| Smartphone | 802 | 86.1% |
| Tablet | 285 | 30.6% |
| No Computing Device | 108 | 11.6% |
| Total | 931 | 100.0% |
Internet Access in South Alamo
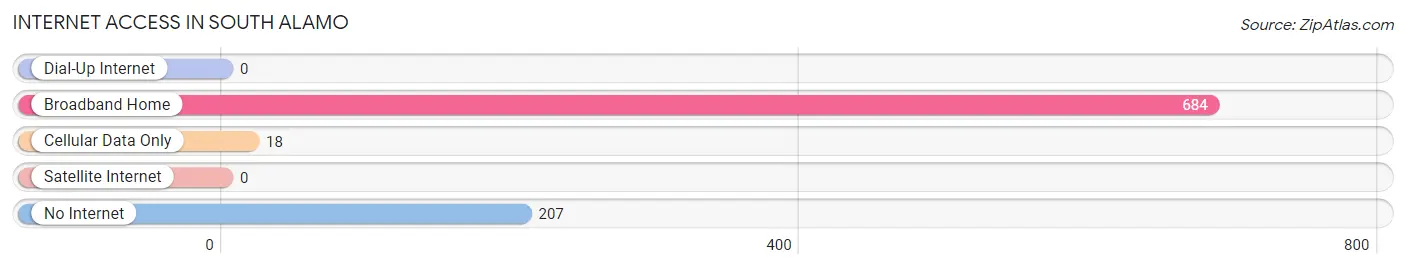
| Internet Type | # Households | % Households |
| Dial-Up Internet | 0 | 0.0% |
| Broadband Home | 684 | 73.5% |
| Cellular Data Only | 18 | 1.9% |
| Satellite Internet | 0 | 0.0% |
| No Internet | 207 | 22.2% |
| Total | 931 | 100.0% |
South Alamo Summary
South Alamo is a small city located in the state of Texas, United States. It is situated in Hidalgo County, near the border with Mexico. The city has a population of approximately 8,000 people and is part of the McAllen-Edinburg-Mission Metropolitan Statistical Area.
Geography
South Alamo is located in the Rio Grande Valley of South Texas, approximately 10 miles south of the city of McAllen. The city is situated on the banks of the Rio Grande River, which forms the border between the United States and Mexico. The city is surrounded by agricultural land, with cotton, corn, and sorghum being the main crops. The climate in South Alamo is subtropical, with hot summers and mild winters.
History
South Alamo was founded in the late 19th century by Mexican immigrants who were looking for a place to settle and farm. The city was originally known as El Ranchito, and was later renamed South Alamo. The city was incorporated in the early 20th century and has since grown to become a small city.
Economy
The economy of South Alamo is largely based on agriculture. The city is home to several large farms, which produce cotton, corn, and sorghum. The city is also home to several small businesses, including restaurants, grocery stores, and retail stores. The city is also home to a number of manufacturing plants, which produce a variety of products, including furniture, clothing, and electronics.
Demographics
As of the 2010 census, the population of South Alamo was 8,000. The racial makeup of the city was 79.3% Hispanic or Latino, 16.2% White, 1.2% African American, 0.7% Native American, 0.3% Asian, and 2.5% from other races. The median household income in South Alamo was $25,000, and the median family income was $30,000.
Conclusion
South Alamo is a small city located in the state of Texas, United States. It is situated in Hidalgo County, near the border with Mexico. The city has a population of approximately 8,000 people and is part of the McAllen-Edinburg-Mission Metropolitan Statistical Area. The economy of South Alamo is largely based on agriculture, with cotton, corn, and sorghum being the main crops. The city is also home to several small businesses, including restaurants, grocery stores, and retail stores. The racial makeup of the city was 79.3% Hispanic or Latino, 16.2% White, 1.2% African American, 0.7% Native American, 0.3% Asian, and 2.5% from other races. South Alamo is a small city with a rich history and culture, and a vibrant economy.
Common Questions
What is Per Capita Income in South Alamo?
Per Capita income in South Alamo is $21,748.
What is the Median Household income in South Alamo?
Median Household Income in South Alamo is $35,742.
What is Income or Wage Gap in South Alamo?
Income or Wage Gap in South Alamo is 64.1%.
Women in South Alamo earn 35.9 cents for every dollar earned by a man.
What is Inequality or Gini Index in South Alamo?
Inequality or Gini Index in South Alamo is 0.52.
What is the Total Population of South Alamo?
Total Population of South Alamo is 3,433.
What is the Total Male Population of South Alamo?
Total Male Population of South Alamo is 1,849.
What is the Total Female Population of South Alamo?
Total Female Population of South Alamo is 1,584.
What is the Ratio of Males per 100 Females in South Alamo?
There are 116.73 Males per 100 Females in South Alamo.
What is the Ratio of Females per 100 Males in South Alamo?
There are 85.67 Females per 100 Males in South Alamo.
What is the Median Population Age in South Alamo?
Median Population Age in South Alamo is 29.9 Years.
What is the Average Family Size in South Alamo
Average Family Size in South Alamo is 4.5 People.
What is the Average Household Size in South Alamo
Average Household Size in South Alamo is 3.7 People.
How Large is the Labor Force in South Alamo?
There are 1,526 People in the Labor Forcein in South Alamo.
What is the Percentage of People in the Labor Force in South Alamo?
60.5% of People are in the Labor Force in South Alamo.
What is the Unemployment Rate in South Alamo?
Unemployment Rate in South Alamo is 9.3%.