Pearsall, TX Map & Demographics
Pearsall Map
Pearsall Overview
$19,519
PER CAPITA INCOME
$46,795
AVG FAMILY INCOME
$41,761
AVG HOUSEHOLD INCOME
33.3%
WAGE / INCOME GAP [ % ]
66.7¢/ $1
WAGE / INCOME GAP [ $ ]
$11,073
FAMILY INCOME DEFICIT
0.49
INEQUALITY / GINI INDEX
8,870
TOTAL POPULATION
5,177
MALE POPULATION
3,693
FEMALE POPULATION
140.18
MALES / 100 FEMALES
71.33
FEMALES / 100 MALES
30.6
MEDIAN AGE
3.8
AVG FAMILY SIZE
3.1
AVG HOUSEHOLD SIZE
3,306
LABOR FORCE [ PEOPLE ]
46.8%
PERCENT IN LABOR FORCE
4.5%
UNEMPLOYMENT RATE
Pearsall Zip Codes
Pearsall Area Codes
Income in Pearsall
Income Overview in Pearsall
Per Capita Income in Pearsall is $19,519, while median incomes of families and households are $46,795 and $41,761 respectively.
| Characteristic | Number | Measure |
| Per Capita Income | 8,870 | $19,519 |
| Median Family Income | 1,711 | $46,795 |
| Mean Family Income | 1,711 | $67,311 |
| Median Household Income | 2,413 | $41,761 |
| Mean Household Income | 2,413 | $60,304 |
| Income Deficit | 1,711 | $11,073 |
| Wage / Income Gap (%) | 8,870 | 33.34% |
| Wage / Income Gap ($) | 8,870 | 66.66¢ per $1 |
| Gini / Inequality Index | 8,870 | 0.49 |
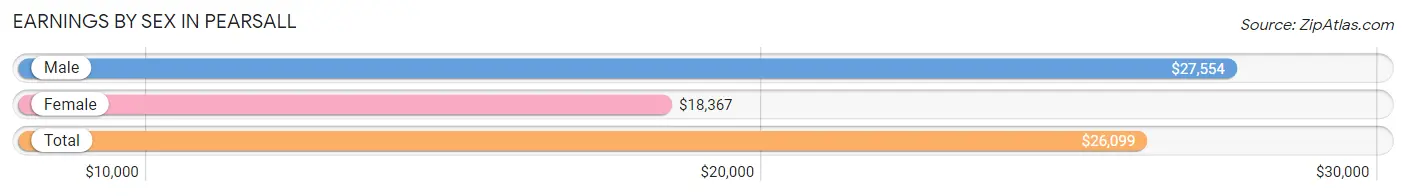
Earnings by Sex in Pearsall
Average Earnings in Pearsall are $26,099, $27,554 for men and $18,367 for women, a difference of 33.3%.
| Sex | Number | Average Earnings |
| Male | 2,563 (64.1%) | $27,554 |
| Female | 1,435 (35.9%) | $18,367 |
| Total | 3,998 (100.0%) | $26,099 |
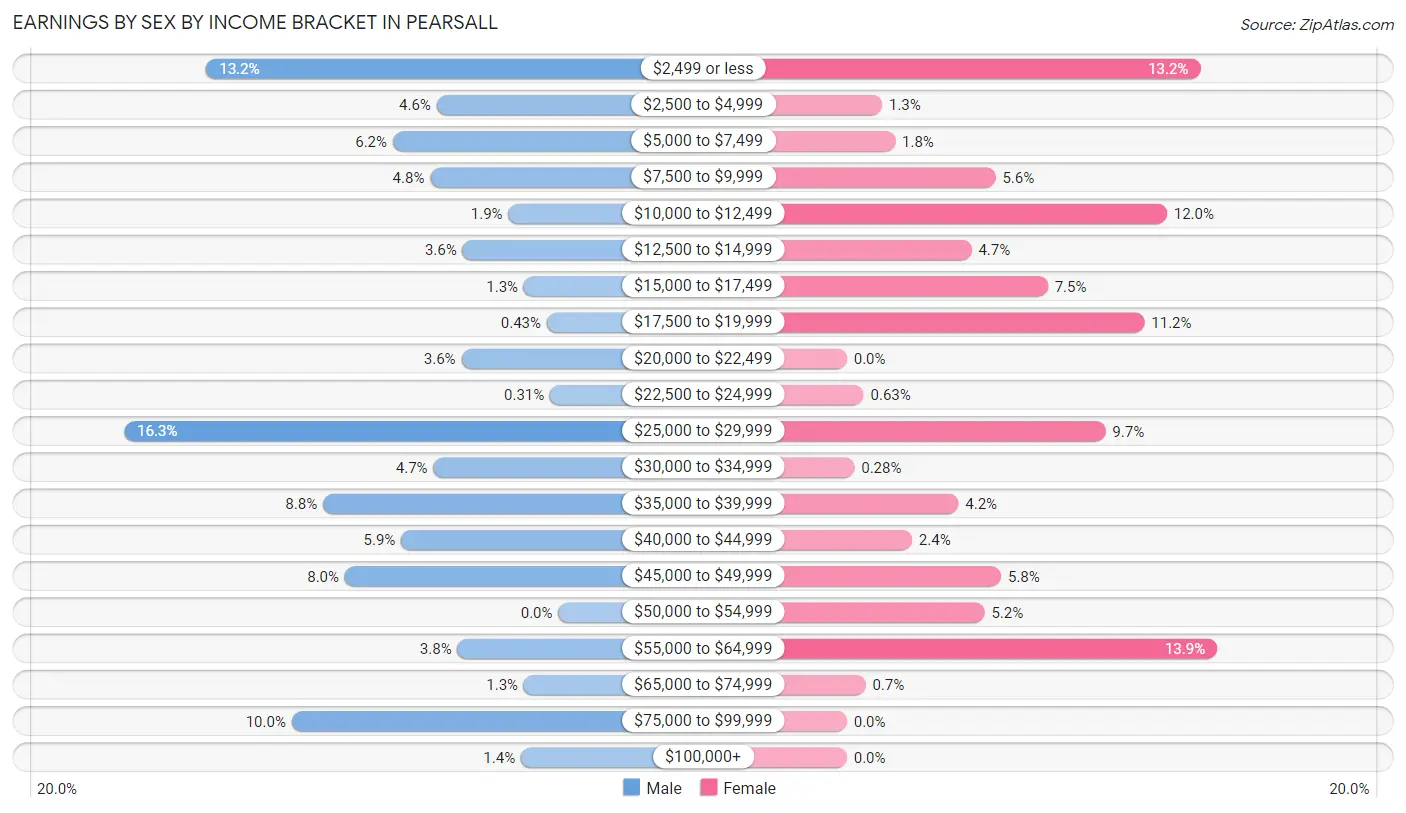
Earnings by Sex by Income Bracket in Pearsall
The most common earnings brackets in Pearsall are $25,000 to $29,999 for men (417 | 16.3%) and $55,000 to $64,999 for women (199 | 13.9%).
| Income | Male | Female |
| $2,499 or less | 338 (13.2%) | 190 (13.2%) |
| $2,500 to $4,999 | 117 (4.6%) | 19 (1.3%) |
| $5,000 to $7,499 | 159 (6.2%) | 26 (1.8%) |
| $7,500 to $9,999 | 123 (4.8%) | 80 (5.6%) |
| $10,000 to $12,499 | 48 (1.9%) | 172 (12.0%) |
| $12,500 to $14,999 | 92 (3.6%) | 67 (4.7%) |
| $15,000 to $17,499 | 33 (1.3%) | 108 (7.5%) |
| $17,500 to $19,999 | 11 (0.4%) | 160 (11.2%) |
| $20,000 to $22,499 | 93 (3.6%) | 0 (0.0%) |
| $22,500 to $24,999 | 8 (0.3%) | 9 (0.6%) |
| $25,000 to $29,999 | 417 (16.3%) | 139 (9.7%) |
| $30,000 to $34,999 | 120 (4.7%) | 4 (0.3%) |
| $35,000 to $39,999 | 226 (8.8%) | 60 (4.2%) |
| $40,000 to $44,999 | 151 (5.9%) | 35 (2.4%) |
| $45,000 to $49,999 | 205 (8.0%) | 83 (5.8%) |
| $50,000 to $54,999 | 0 (0.0%) | 74 (5.2%) |
| $55,000 to $64,999 | 97 (3.8%) | 199 (13.9%) |
| $65,000 to $74,999 | 33 (1.3%) | 10 (0.7%) |
| $75,000 to $99,999 | 256 (10.0%) | 0 (0.0%) |
| $100,000+ | 36 (1.4%) | 0 (0.0%) |
| Total | 2,563 (100.0%) | 1,435 (100.0%) |
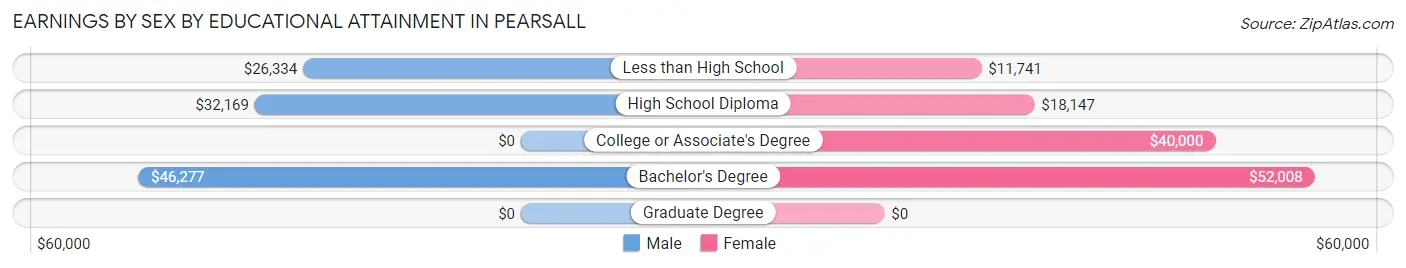
Earnings by Sex by Educational Attainment in Pearsall
Average earnings in Pearsall are $30,848 for men and $19,727 for women, a difference of 36.0%. Men with an educational attainment of bachelor's degree enjoy the highest average annual earnings of $46,277, while those with less than high school education earn the least with $26,334. Women with an educational attainment of bachelor's degree earn the most with the average annual earnings of $52,008, while those with less than high school education have the smallest earnings of $11,741.
| Educational Attainment | Male Income | Female Income |
| Less than High School | $26,334 | $11,741 |
| High School Diploma | $32,169 | $18,147 |
| College or Associate's Degree | - | - |
| Bachelor's Degree | $46,277 | $52,008 |
| Graduate Degree | - | - |
| Total | $30,848 | $19,727 |
Family Income in Pearsall
Family Income Brackets in Pearsall
According to the Pearsall family income data, there are 358 families falling into the $100,000 to $149,999 income range, which is the most common income bracket and makes up 20.9% of all families. Conversely, the $200,000+ income bracket is the least frequent group with only 14 families (0.8%) belonging to this category.
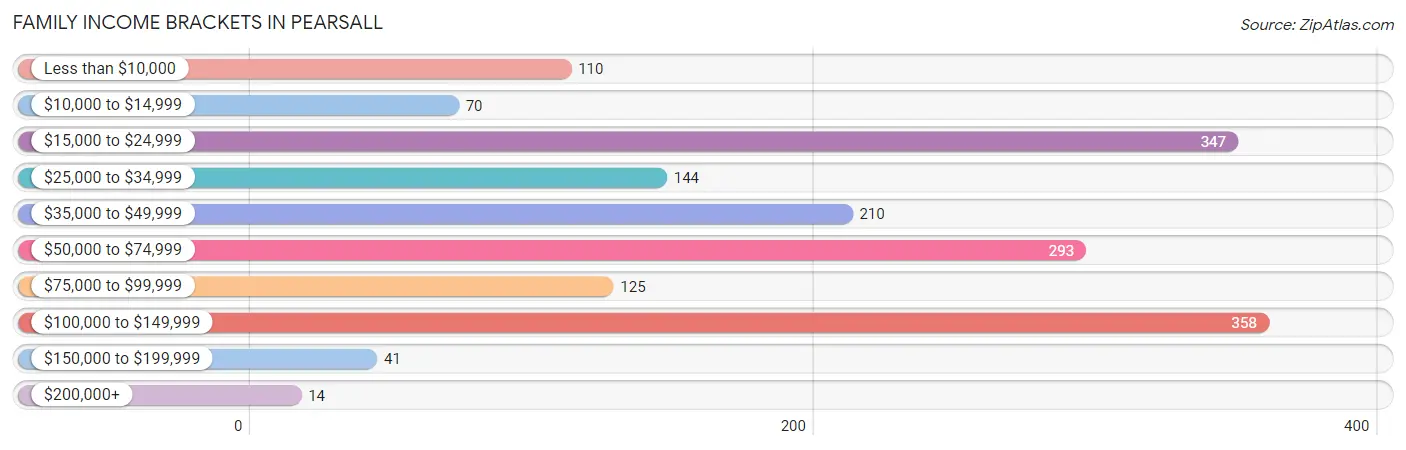
| Income Bracket | # Families | % Families |
| Less than $10,000 | 110 | 6.4% |
| $10,000 to $14,999 | 70 | 4.1% |
| $15,000 to $24,999 | 347 | 20.3% |
| $25,000 to $34,999 | 144 | 8.4% |
| $35,000 to $49,999 | 210 | 12.3% |
| $50,000 to $74,999 | 293 | 17.1% |
| $75,000 to $99,999 | 125 | 7.3% |
| $100,000 to $149,999 | 358 | 20.9% |
| $150,000 to $199,999 | 41 | 2.4% |
| $200,000+ | 14 | 0.8% |
Family Income by Famaliy Size in Pearsall
3-person families (475 | 27.8%) account for the highest median family income in Pearsall with $61,784 per family, while 2-person families (689 | 40.3%) have the highest median income of $23,243 per family member.
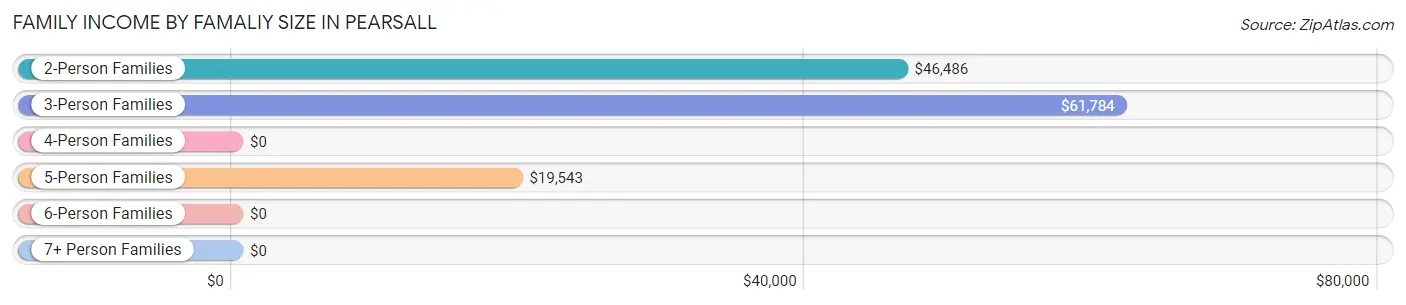
| Income Bracket | # Families | Median Income |
| 2-Person Families | 689 (40.3%) | $46,486 |
| 3-Person Families | 475 (27.8%) | $61,784 |
| 4-Person Families | 239 (14.0%) | $0 |
| 5-Person Families | 237 (13.9%) | $19,543 |
| 6-Person Families | 47 (2.8%) | $0 |
| 7+ Person Families | 24 (1.4%) | $0 |
| Total | 1,711 (100.0%) | $46,795 |
Family Income by Number of Earners in Pearsall
The median family income in Pearsall is $46,795, with families comprising 3+ earners (184) having the highest median family income of $108,021, while families with no earners (272) have the lowest median family income of $23,636, accounting for 10.7% and 15.9% of families, respectively.
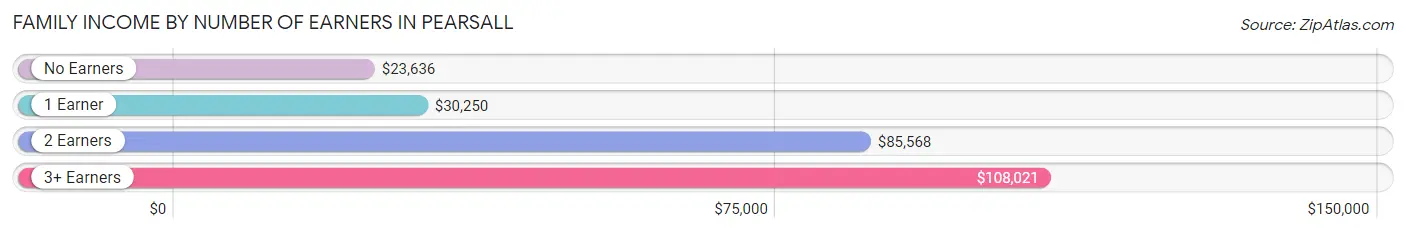
| Number of Earners | # Families | Median Income |
| No Earners | 272 (15.9%) | $23,636 |
| 1 Earner | 876 (51.2%) | $30,250 |
| 2 Earners | 379 (22.2%) | $85,568 |
| 3+ Earners | 184 (10.7%) | $108,021 |
| Total | 1,711 (100.0%) | $46,795 |
Household Income in Pearsall
Household Income Brackets in Pearsall
With 451 households falling in the category, the $100,000 to $149,999 income range is the most frequent in Pearsall, accounting for 18.7% of all households. In contrast, only 12 households (0.5%) fall into the $200,000+ income bracket, making it the least populous group.
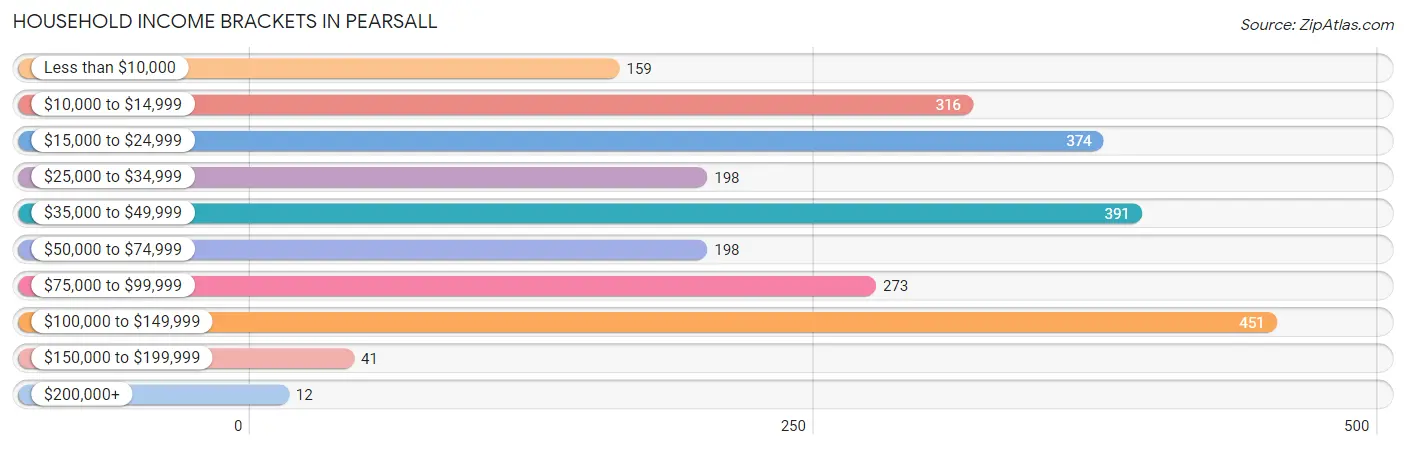
| Income Bracket | # Households | % Households |
| Less than $10,000 | 159 | 6.6% |
| $10,000 to $14,999 | 316 | 13.1% |
| $15,000 to $24,999 | 374 | 15.5% |
| $25,000 to $34,999 | 198 | 8.2% |
| $35,000 to $49,999 | 391 | 16.2% |
| $50,000 to $74,999 | 198 | 8.2% |
| $75,000 to $99,999 | 273 | 11.3% |
| $100,000 to $149,999 | 451 | 18.7% |
| $150,000 to $199,999 | 41 | 1.7% |
| $200,000+ | 12 | 0.5% |
Household Income by Householder Age in Pearsall
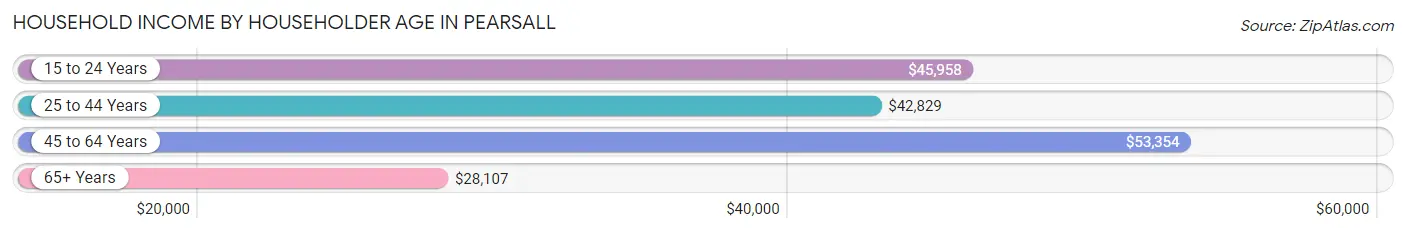
The median household income in Pearsall is $41,761, with the highest median household income of $53,354 found in the 45 to 64 years age bracket for the primary householder. A total of 786 households (32.6%) fall into this category. Meanwhile, the 65+ years age bracket for the primary householder has the lowest median household income of $28,107, with 632 households (26.2%) in this group.
| Income Bracket | # Households | Median Income |
| 15 to 24 Years | 167 (6.9%) | $45,958 |
| 25 to 44 Years | 828 (34.3%) | $42,829 |
| 45 to 64 Years | 786 (32.6%) | $53,354 |
| 65+ Years | 632 (26.2%) | $28,107 |
| Total | 2,413 (100.0%) | $41,761 |
Poverty in Pearsall
Income Below Poverty by Sex and Age in Pearsall
With 21.7% poverty level for males and 35.1% for females among the residents of Pearsall, under 5 year old males and 5 year old females are the most vulnerable to poverty, with 139 males (58.9%) and 21 females (100.0%) in their respective age groups living below the poverty level.
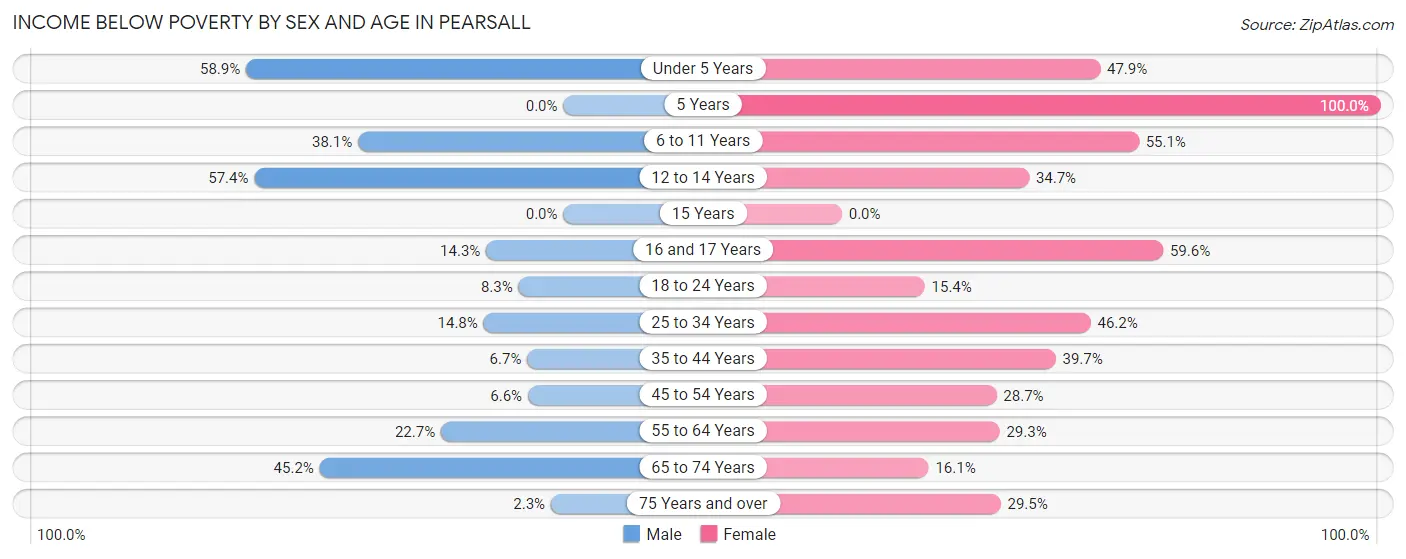
| Age Bracket | Male | Female |
| Under 5 Years | 139 (58.9%) | 186 (47.9%) |
| 5 Years | 0 (0.0%) | 21 (100.0%) |
| 6 to 11 Years | 186 (38.1%) | 221 (55.1%) |
| 12 to 14 Years | 74 (57.4%) | 33 (34.7%) |
| 15 Years | 0 (0.0%) | 0 (0.0%) |
| 16 and 17 Years | 44 (14.3%) | 31 (59.6%) |
| 18 to 24 Years | 64 (8.3%) | 67 (15.4%) |
| 25 to 34 Years | 94 (14.8%) | 223 (46.2%) |
| 35 to 44 Years | 31 (6.7%) | 121 (39.7%) |
| 45 to 54 Years | 14 (6.6%) | 128 (28.7%) |
| 55 to 64 Years | 72 (22.7%) | 108 (29.3%) |
| 65 to 74 Years | 147 (45.2%) | 60 (16.1%) |
| 75 Years and over | 2 (2.3%) | 38 (29.5%) |
| Total | 867 (21.7%) | 1,237 (35.1%) |
Income Above Poverty by Sex and Age in Pearsall
According to the poverty statistics in Pearsall, males aged 15 years and females aged 15 years are the age groups that are most secure financially, with 100.0% of males and 100.0% of females in these age groups living above the poverty line.
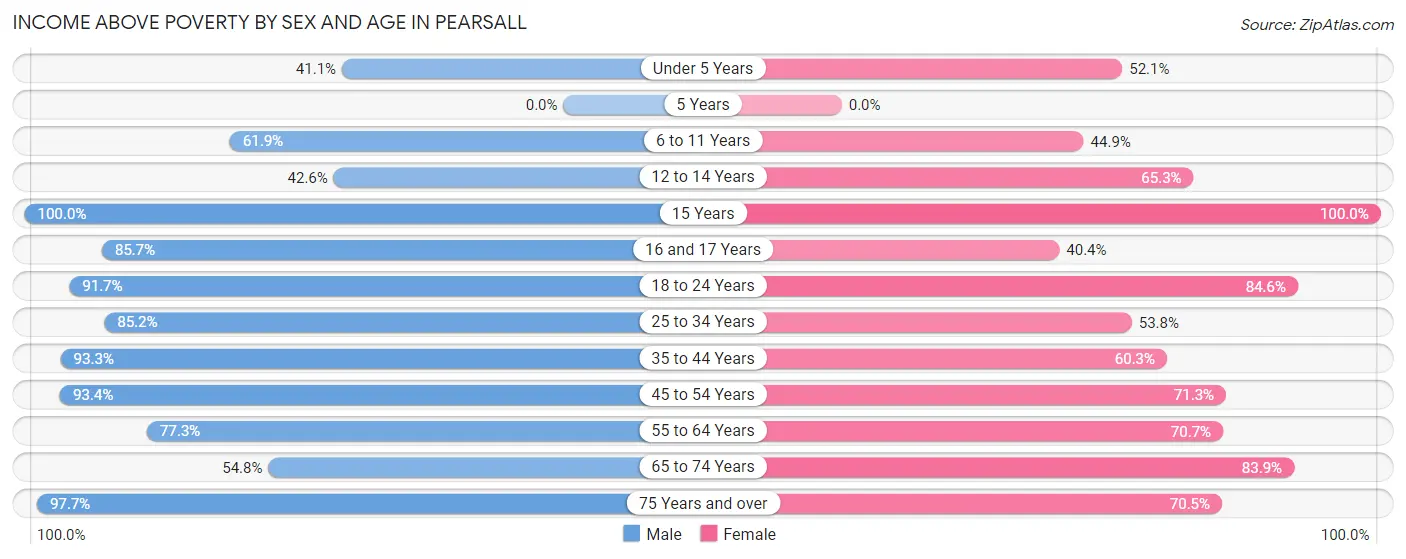
| Age Bracket | Male | Female |
| Under 5 Years | 97 (41.1%) | 202 (52.1%) |
| 5 Years | 0 (0.0%) | 0 (0.0%) |
| 6 to 11 Years | 302 (61.9%) | 180 (44.9%) |
| 12 to 14 Years | 55 (42.6%) | 62 (65.3%) |
| 15 Years | 24 (100.0%) | 24 (100.0%) |
| 16 and 17 Years | 263 (85.7%) | 21 (40.4%) |
| 18 to 24 Years | 706 (91.7%) | 369 (84.6%) |
| 25 to 34 Years | 541 (85.2%) | 260 (53.8%) |
| 35 to 44 Years | 432 (93.3%) | 184 (60.3%) |
| 45 to 54 Years | 199 (93.4%) | 318 (71.3%) |
| 55 to 64 Years | 245 (77.3%) | 261 (70.7%) |
| 65 to 74 Years | 178 (54.8%) | 313 (83.9%) |
| 75 Years and over | 85 (97.7%) | 91 (70.5%) |
| Total | 3,127 (78.3%) | 2,285 (64.9%) |
Income Below Poverty Among Married-Couple Families in Pearsall
The poverty statistics for married-couple families in Pearsall show that 11.0% or 93 of the total 849 families live below the poverty line. Families with 3 or 4 children have the highest poverty rate of 41.4%, comprising of 29 families. On the other hand, families with no children have the lowest poverty rate of 1.9%, which includes 8 families.
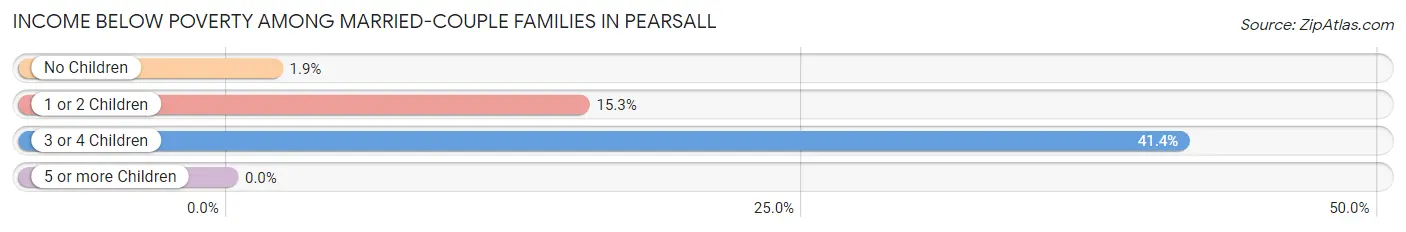
| Children | Above Poverty | Below Poverty |
| No Children | 405 (98.1%) | 8 (1.9%) |
| 1 or 2 Children | 310 (84.7%) | 56 (15.3%) |
| 3 or 4 Children | 41 (58.6%) | 29 (41.4%) |
| 5 or more Children | 0 (0.0%) | 0 (0.0%) |
| Total | 756 (89.0%) | 93 (11.0%) |
Income Below Poverty Among Single-Parent Households in Pearsall
According to the poverty data in Pearsall, 32.7% or 50 single-father households and 49.6% or 352 single-mother households are living below the poverty line. Among single-father households, those with no children have the highest poverty rate, with 6 households (100.0%) experiencing poverty. Likewise, among single-mother households, those with 3 or 4 children have the highest poverty rate, with 145 households (100.0%) falling below the poverty line.
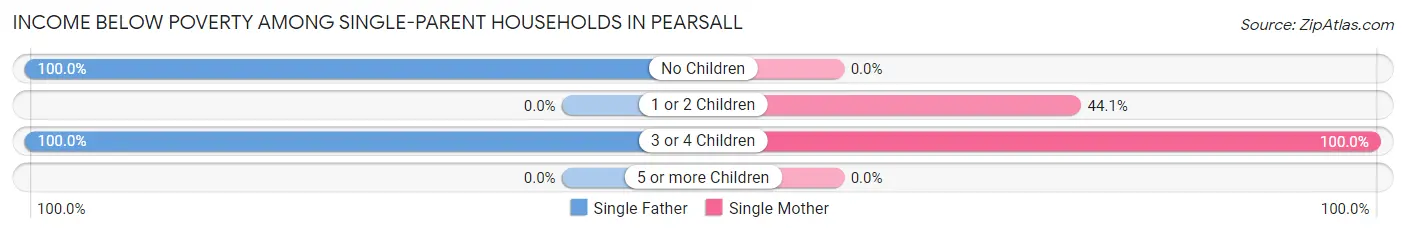
| Children | Single Father | Single Mother |
| No Children | 6 (100.0%) | 0 (0.0%) |
| 1 or 2 Children | 0 (0.0%) | 207 (44.1%) |
| 3 or 4 Children | 44 (100.0%) | 145 (100.0%) |
| 5 or more Children | 0 (0.0%) | 0 (0.0%) |
| Total | 50 (32.7%) | 352 (49.6%) |
Income Below Poverty Among Married-Couple vs Single-Parent Households in Pearsall
The poverty data for Pearsall shows that 93 of the married-couple family households (11.0%) and 402 of the single-parent households (46.6%) are living below the poverty level. Within the married-couple family households, those with 3 or 4 children have the highest poverty rate, with 29 households (41.4%) falling below the poverty line. Among the single-parent households, those with 3 or 4 children have the highest poverty rate, with 189 household (100.0%) living below poverty.
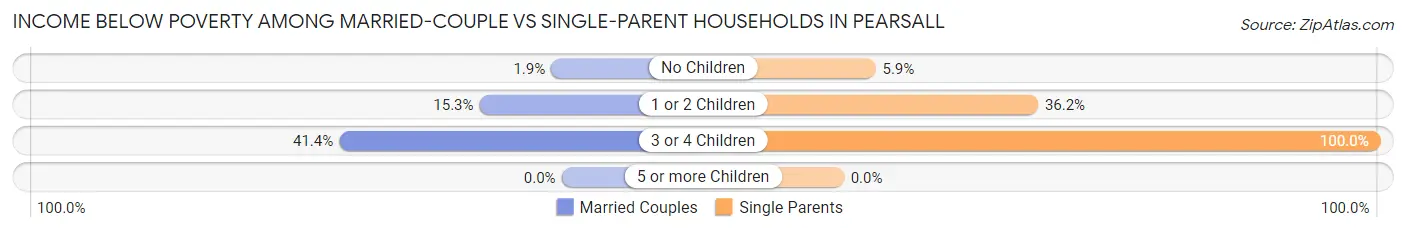
| Children | Married-Couple Families | Single-Parent Households |
| No Children | 8 (1.9%) | 6 (5.9%) |
| 1 or 2 Children | 56 (15.3%) | 207 (36.2%) |
| 3 or 4 Children | 29 (41.4%) | 189 (100.0%) |
| 5 or more Children | 0 (0.0%) | 0 (0.0%) |
| Total | 93 (11.0%) | 402 (46.6%) |
Race in Pearsall
The most populous races in Pearsall are Hispanic or Latino (7,881 | 88.8%), White / Caucasian (5,501 | 62.0%), and Two or more Races (2,605 | 29.4%).
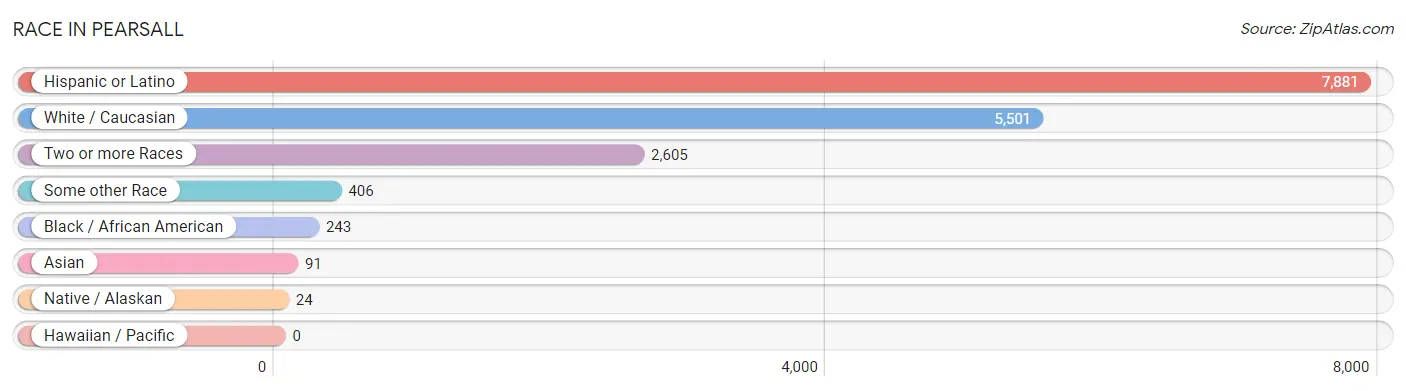
| Race | # Population | % Population |
| Asian | 91 | 1.0% |
| Black / African American | 243 | 2.7% |
| Hawaiian / Pacific | 0 | 0.0% |
| Hispanic or Latino | 7,881 | 88.8% |
| Native / Alaskan | 24 | 0.3% |
| White / Caucasian | 5,501 | 62.0% |
| Two or more Races | 2,605 | 29.4% |
| Some other Race | 406 | 4.6% |
| Total | 8,870 | 100.0% |
Ancestry in Pearsall
The most populous ancestries reported in Pearsall are Mexican (6,471 | 73.0%), Central American (471 | 5.3%), American (308 | 3.5%), Honduran (269 | 3.0%), and Guatemalan (149 | 1.7%), together accounting for 86.4% of all Pearsall residents.
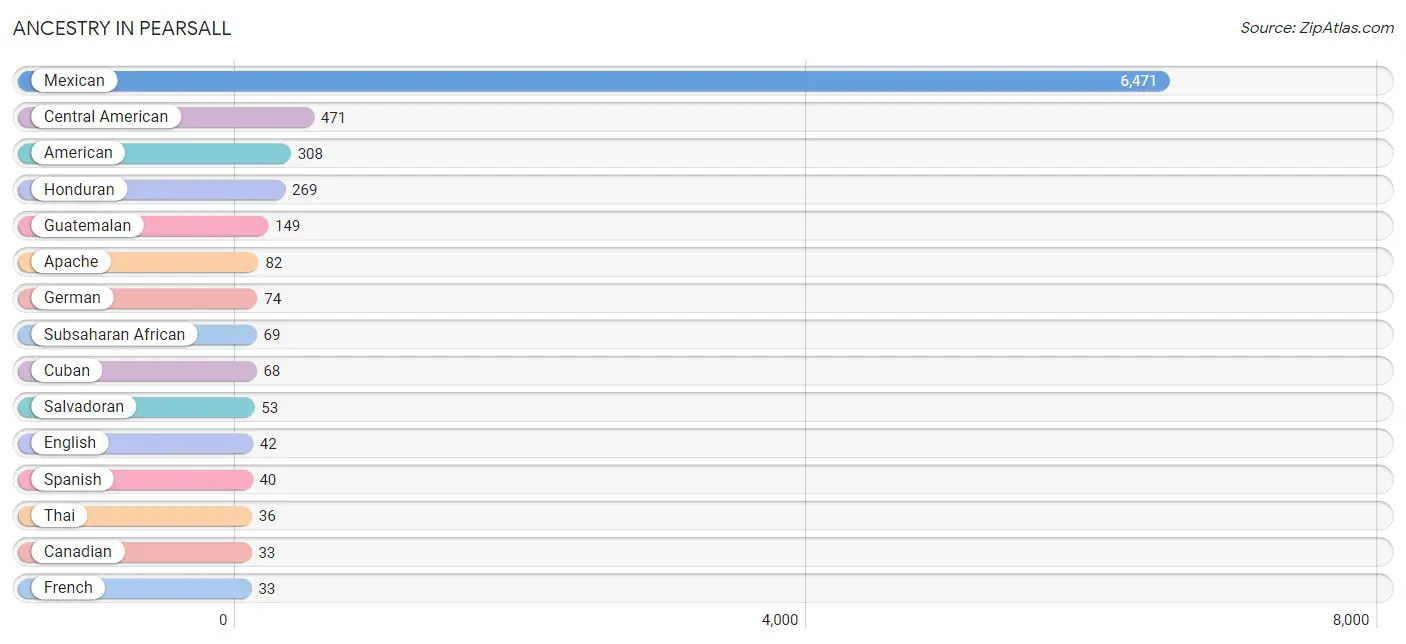
| Ancestry | # Population | % Population |
| African | 28 | 0.3% |
| American | 308 | 3.5% |
| Apache | 82 | 0.9% |
| Bhutanese | 11 | 0.1% |
| Brazilian | 11 | 0.1% |
| British | 10 | 0.1% |
| Canadian | 33 | 0.4% |
| Central American | 471 | 5.3% |
| Central American Indian | 11 | 0.1% |
| Cuban | 68 | 0.8% |
| English | 42 | 0.5% |
| Ethiopian | 11 | 0.1% |
| European | 8 | 0.1% |
| French | 33 | 0.4% |
| German | 74 | 0.8% |
| Guatemalan | 149 | 1.7% |
| Honduran | 269 | 3.0% |
| Indian (Asian) | 17 | 0.2% |
| Irish | 31 | 0.4% |
| Mexican | 6,471 | 73.0% |
| Mexican American Indian | 16 | 0.2% |
| Nigerian | 8 | 0.1% |
| Puerto Rican | 11 | 0.1% |
| Salvadoran | 53 | 0.6% |
| Scottish | 14 | 0.2% |
| Spaniard | 19 | 0.2% |
| Spanish | 40 | 0.4% |
| Subsaharan African | 69 | 0.8% |
| Thai | 36 | 0.4% | View All 29 Rows |
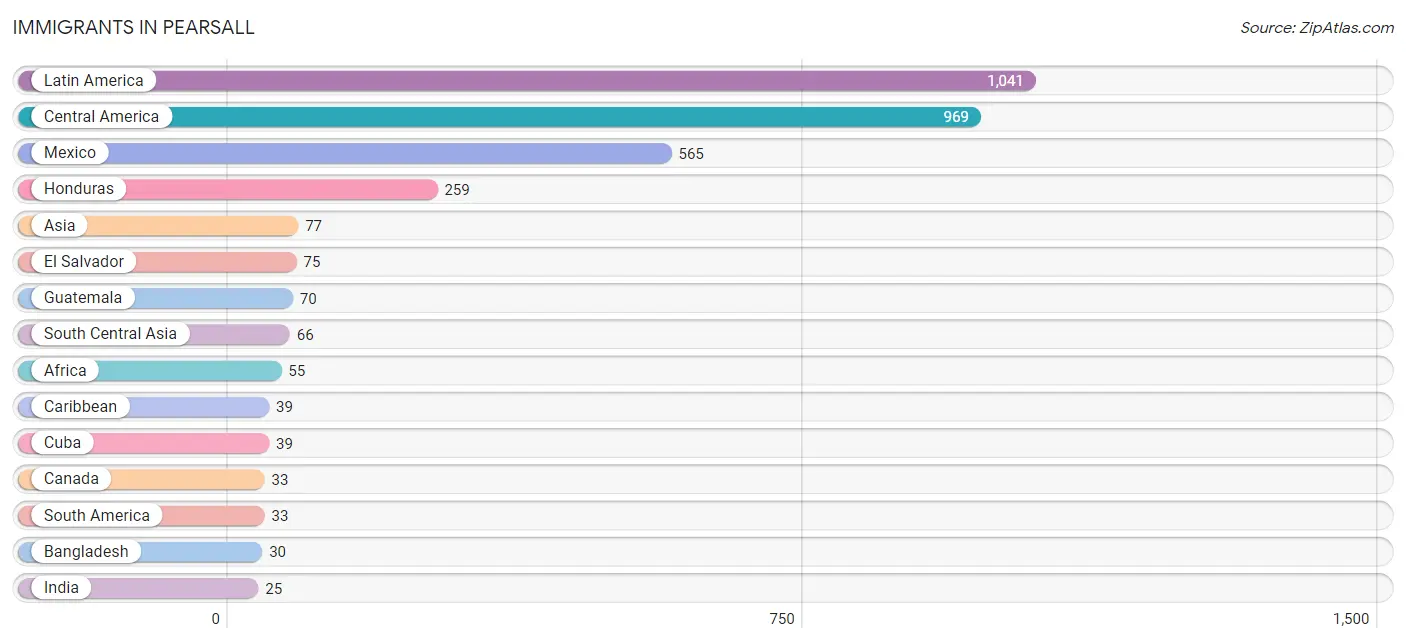
Immigrants in Pearsall
The most numerous immigrant groups reported in Pearsall came from Latin America (1,041 | 11.7%), Central America (969 | 10.9%), Mexico (565 | 6.4%), Honduras (259 | 2.9%), and Asia (77 | 0.9%), together accounting for 32.8% of all Pearsall residents.
| Immigration Origin | # Population | % Population |
| Africa | 55 | 0.6% |
| Asia | 77 | 0.9% |
| Bangladesh | 30 | 0.3% |
| Brazil | 11 | 0.1% |
| Canada | 33 | 0.4% |
| Caribbean | 39 | 0.4% |
| Central America | 969 | 10.9% |
| Congo | 11 | 0.1% |
| Cuba | 39 | 0.4% |
| Eastern Africa | 11 | 0.1% |
| Ecuador | 11 | 0.1% |
| El Salvador | 75 | 0.9% |
| England | 10 | 0.1% |
| Eritrea | 11 | 0.1% |
| Europe | 10 | 0.1% |
| Guatemala | 70 | 0.8% |
| Honduras | 259 | 2.9% |
| India | 25 | 0.3% |
| Latin America | 1,041 | 11.7% |
| Liberia | 11 | 0.1% |
| Mexico | 565 | 6.4% |
| Middle Africa | 22 | 0.3% |
| Northern Europe | 10 | 0.1% |
| Peru | 11 | 0.1% |
| South America | 33 | 0.4% |
| South Central Asia | 66 | 0.7% |
| Sri Lanka | 11 | 0.1% |
| Western Africa | 22 | 0.3% |
| Western Asia | 11 | 0.1% |
| Zaire | 11 | 0.1% | View All 30 Rows |
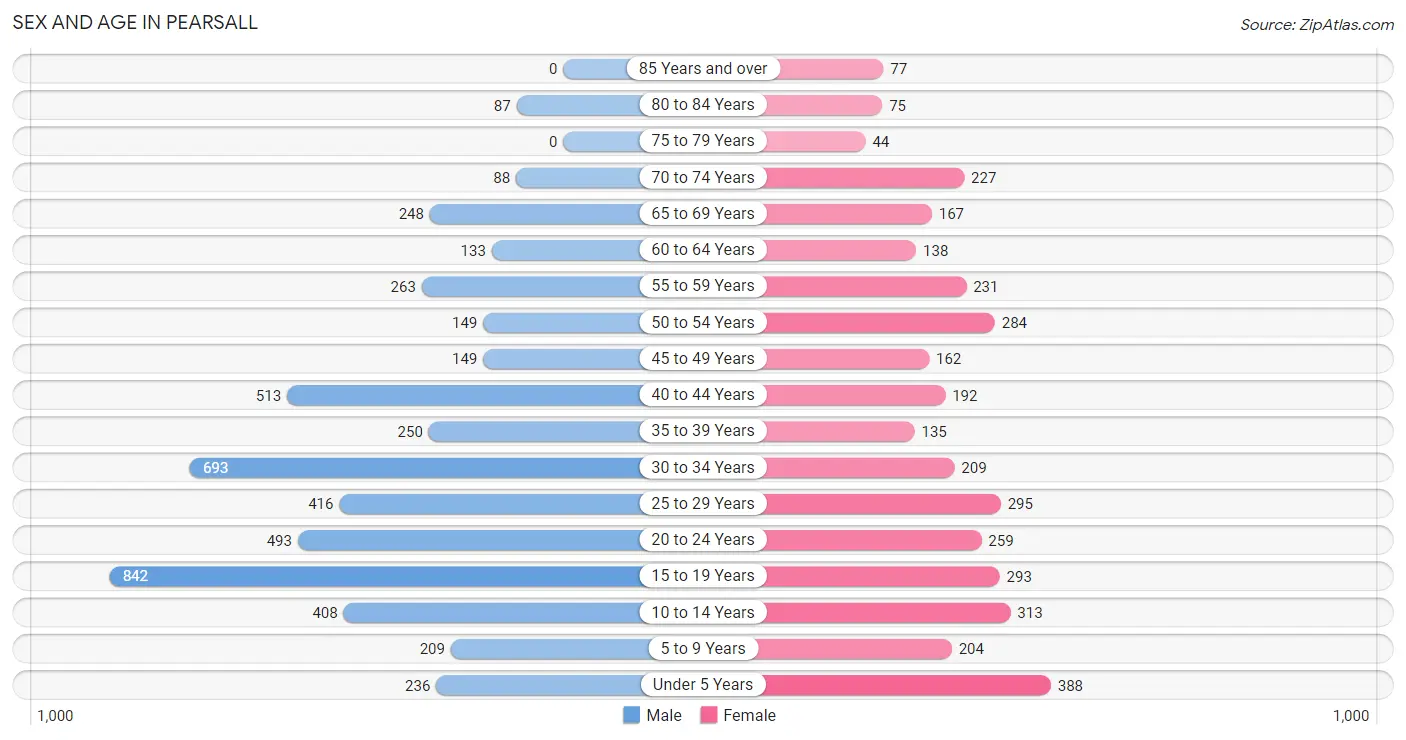
Sex and Age in Pearsall
Sex and Age in Pearsall
The most populous age groups in Pearsall are 15 to 19 Years (842 | 16.3%) for men and Under 5 Years (388 | 10.5%) for women.
| Age Bracket | Male | Female |
| Under 5 Years | 236 (4.6%) | 388 (10.5%) |
| 5 to 9 Years | 209 (4.0%) | 204 (5.5%) |
| 10 to 14 Years | 408 (7.9%) | 313 (8.5%) |
| 15 to 19 Years | 842 (16.3%) | 293 (7.9%) |
| 20 to 24 Years | 493 (9.5%) | 259 (7.0%) |
| 25 to 29 Years | 416 (8.0%) | 295 (8.0%) |
| 30 to 34 Years | 693 (13.4%) | 209 (5.7%) |
| 35 to 39 Years | 250 (4.8%) | 135 (3.7%) |
| 40 to 44 Years | 513 (9.9%) | 192 (5.2%) |
| 45 to 49 Years | 149 (2.9%) | 162 (4.4%) |
| 50 to 54 Years | 149 (2.9%) | 284 (7.7%) |
| 55 to 59 Years | 263 (5.1%) | 231 (6.3%) |
| 60 to 64 Years | 133 (2.6%) | 138 (3.7%) |
| 65 to 69 Years | 248 (4.8%) | 167 (4.5%) |
| 70 to 74 Years | 88 (1.7%) | 227 (6.1%) |
| 75 to 79 Years | 0 (0.0%) | 44 (1.2%) |
| 80 to 84 Years | 87 (1.7%) | 75 (2.0%) |
| 85 Years and over | 0 (0.0%) | 77 (2.1%) |
| Total | 5,177 (100.0%) | 3,693 (100.0%) |
Families and Households in Pearsall
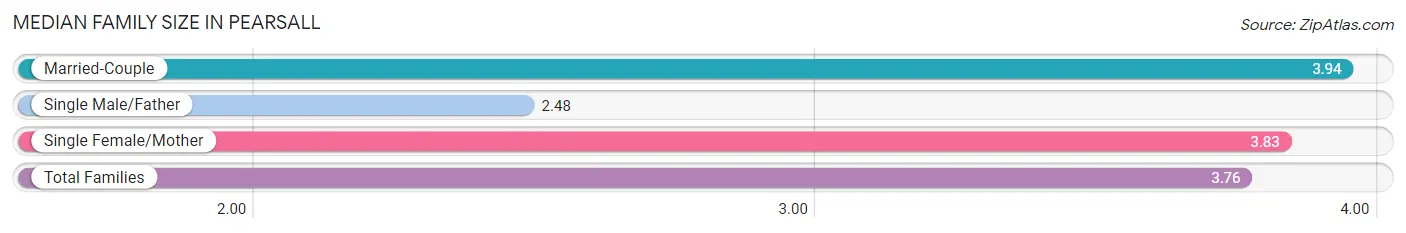
Median Family Size in Pearsall
The median family size in Pearsall is 3.76 persons per family, with married-couple families (849 | 49.6%) accounting for the largest median family size of 3.94 persons per family. On the other hand, single male/father families (153 | 8.9%) represent the smallest median family size with 2.48 persons per family.
| Family Type | # Families | Family Size |
| Married-Couple | 849 (49.6%) | 3.94 |
| Single Male/Father | 153 (8.9%) | 2.48 |
| Single Female/Mother | 709 (41.4%) | 3.83 |
| Total Families | 1,711 (100.0%) | 3.76 |
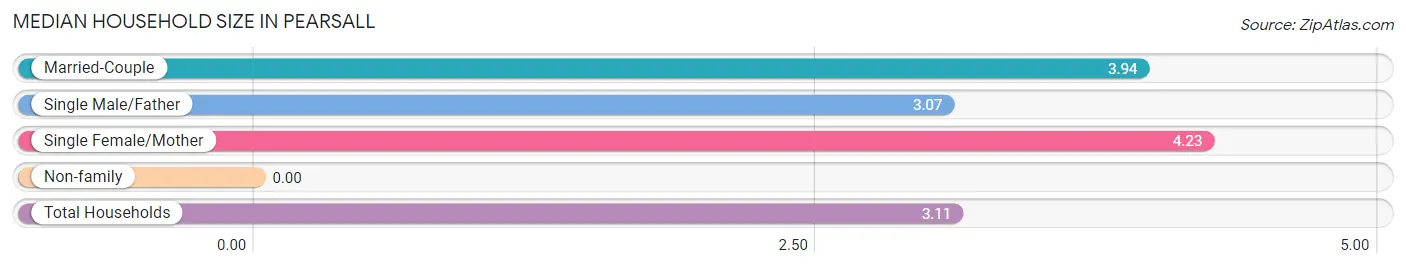
Median Household Size in Pearsall
| Household Type | # Households | Household Size |
| Married-Couple | 849 (35.2%) | 3.94 |
| Single Male/Father | 153 (6.3%) | 3.07 |
| Single Female/Mother | 709 (29.4%) | 4.23 |
| Non-family | 702 (29.1%) | - |
| Total Households | 2,413 (100.0%) | 3.11 |
Household Size by Marriage Status in Pearsall
Out of a total of 2,413 households in Pearsall, 1,711 (70.9%) are family households, while 702 (29.1%) are nonfamily households. The most numerous type of family households are 3-person households, comprising 577, and the most common type of nonfamily households are 1-person households, comprising 702.
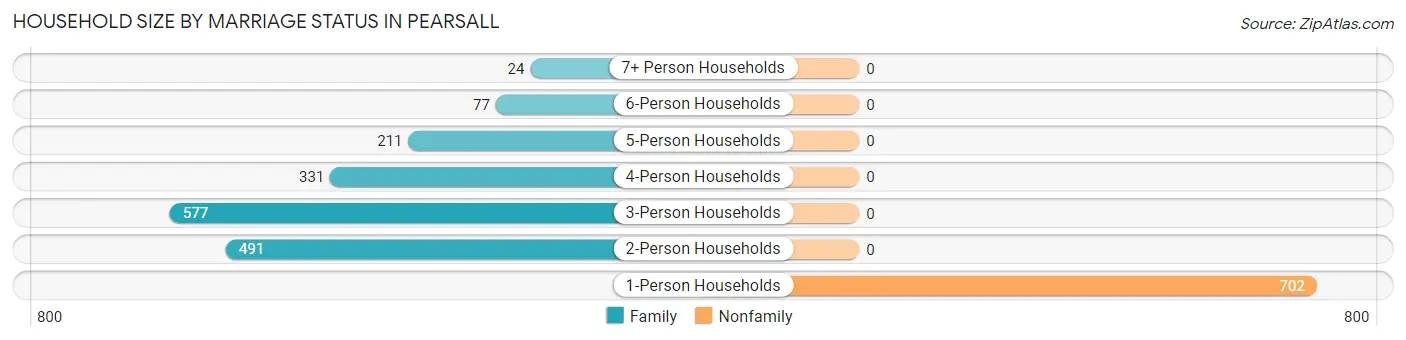
| Household Size | Family Households | Nonfamily Households |
| 1-Person Households | - | 702 (29.1%) |
| 2-Person Households | 491 (20.3%) | 0 (0.0%) |
| 3-Person Households | 577 (23.9%) | 0 (0.0%) |
| 4-Person Households | 331 (13.7%) | 0 (0.0%) |
| 5-Person Households | 211 (8.7%) | 0 (0.0%) |
| 6-Person Households | 77 (3.2%) | 0 (0.0%) |
| 7+ Person Households | 24 (1.0%) | 0 (0.0%) |
| Total | 1,711 (70.9%) | 702 (29.1%) |
Female Fertility in Pearsall
Fertility by Age in Pearsall
Average fertility rate in Pearsall is 54.0 births per 1,000 women. Women in the age bracket of 15 to 19 years have the highest fertility rate with 229.0 births per 1,000 women. Women in the age bracket of 15 to 19 years acount for 74.4% of all women with births.
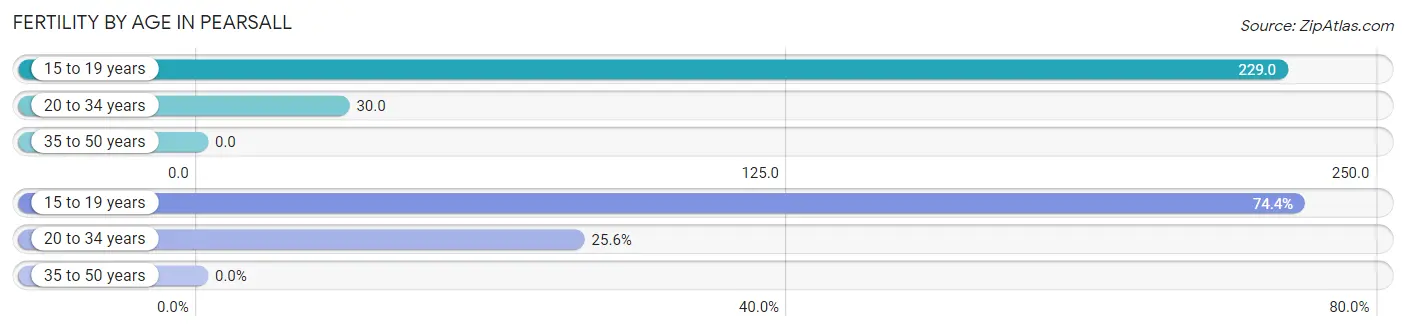
| Age Bracket | Women with Births | Births / 1,000 Women |
| 15 to 19 years | 67 (74.4%) | 229.0 |
| 20 to 34 years | 23 (25.6%) | 30.0 |
| 35 to 50 years | 0 (0.0%) | 0.0 |
| Total | 90 (100.0%) | 54.0 |
Fertility by Age by Marriage Status in Pearsall
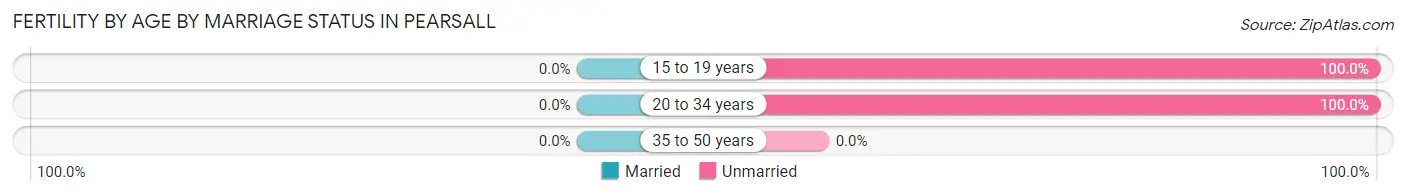
| Age Bracket | Married | Unmarried |
| 15 to 19 years | 0 (0.0%) | 67 (100.0%) |
| 20 to 34 years | 0 (0.0%) | 23 (100.0%) |
| 35 to 50 years | 0 (0.0%) | 0 (0.0%) |
| Total | 0 (0.0%) | 90 (100.0%) |
Fertility by Education in Pearsall
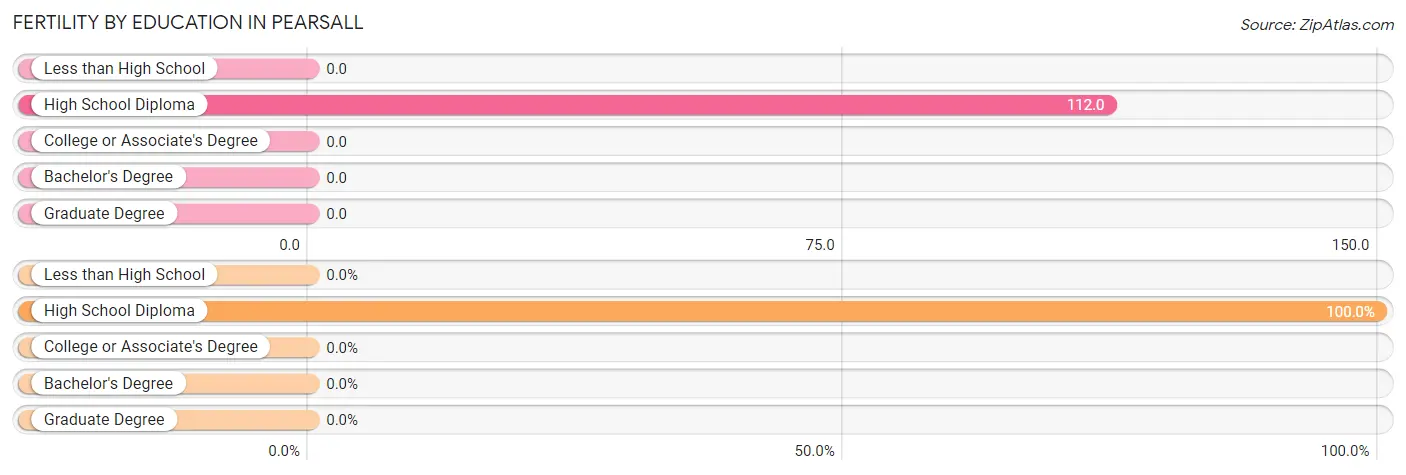
| Educational Attainment | Women with Births | Births / 1,000 Women |
| Less than High School | 0 (0.0%) | 0.0 |
| High School Diploma | 90 (100.0%) | 112.0 |
| College or Associate's Degree | 0 (0.0%) | 0.0 |
| Bachelor's Degree | 0 (0.0%) | 0.0 |
| Graduate Degree | 0 (0.0%) | 0.0 |
| Total | 90 (100.0%) | 54.0 |
Fertility by Education by Marriage Status in Pearsall
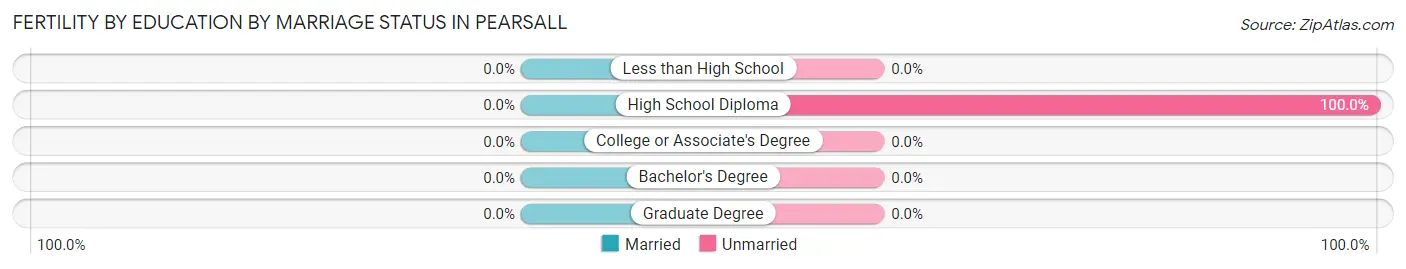
| Educational Attainment | Married | Unmarried |
| Less than High School | 0 (0.0%) | 0 (0.0%) |
| High School Diploma | 0 (0.0%) | 90 (100.0%) |
| College or Associate's Degree | 0 (0.0%) | 0 (0.0%) |
| Bachelor's Degree | 0 (0.0%) | 0 (0.0%) |
| Graduate Degree | 0 (0.0%) | 0 (0.0%) |
| Total | 0 (0.0%) | 90 (100.0%) |
Employment Characteristics in Pearsall
Employment by Class of Employer in Pearsall
Among the 3,084 employed individuals in Pearsall, private company employees (1,951 | 63.3%), local government employees (622 | 20.2%), and not-for-profit organizations (267 | 8.7%) make up the most common classes of employment.
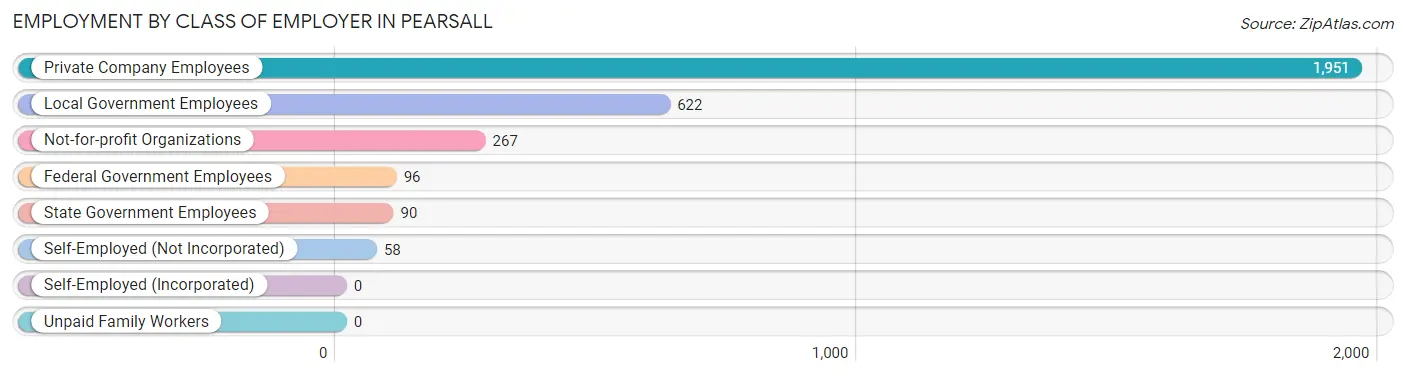
| Employer Class | # Employees | % Employees |
| Private Company Employees | 1,951 | 63.3% |
| Self-Employed (Incorporated) | 0 | 0.0% |
| Self-Employed (Not Incorporated) | 58 | 1.9% |
| Not-for-profit Organizations | 267 | 8.7% |
| Local Government Employees | 622 | 20.2% |
| State Government Employees | 90 | 2.9% |
| Federal Government Employees | 96 | 3.1% |
| Unpaid Family Workers | 0 | 0.0% |
| Total | 3,084 | 100.0% |
Employment Status by Age in Pearsall
According to the labor force statistics for Pearsall, out of the total population over 16 years of age (7,064), 46.8% or 3,306 individuals are in the labor force, with 4.5% or 149 of them unemployed. The age group with the highest labor force participation rate is 45 to 54 years, with 65.6% or 488 individuals in the labor force. Within the labor force, the 55 to 59 years age range has the highest percentage of unemployed individuals, with 46.8% or 103 of them being unemployed.
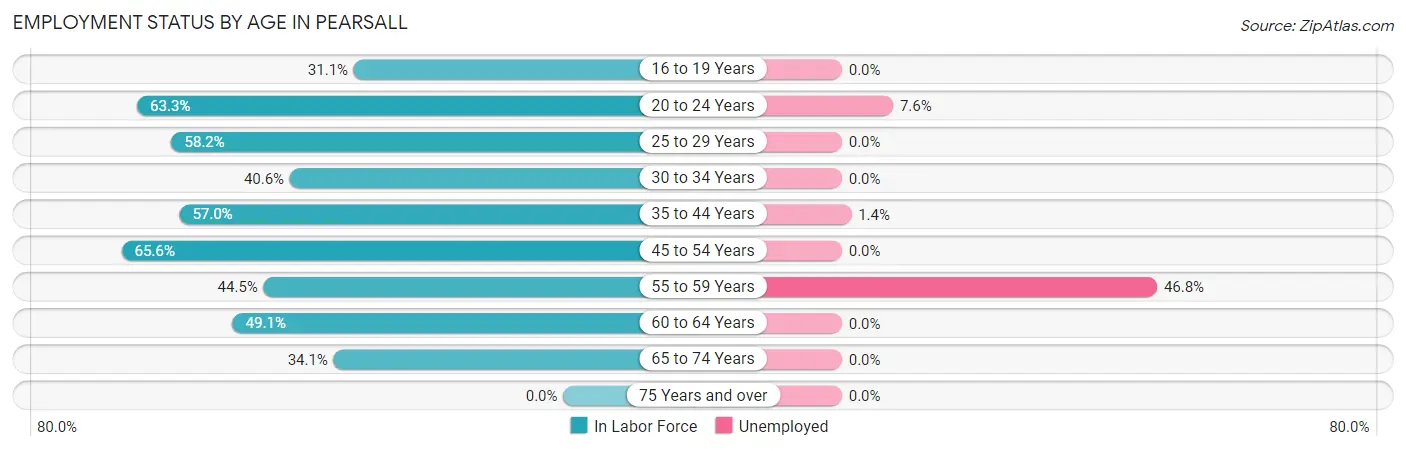
| Age Bracket | In Labor Force | Unemployed |
| 16 to 19 Years | 338 (31.1%) | 0 (0.0%) |
| 20 to 24 Years | 476 (63.3%) | 36 (7.6%) |
| 25 to 29 Years | 414 (58.2%) | 0 (0.0%) |
| 30 to 34 Years | 366 (40.6%) | 0 (0.0%) |
| 35 to 44 Years | 621 (57.0%) | 9 (1.4%) |
| 45 to 54 Years | 488 (65.6%) | 0 (0.0%) |
| 55 to 59 Years | 220 (44.5%) | 103 (46.8%) |
| 60 to 64 Years | 133 (49.1%) | 0 (0.0%) |
| 65 to 74 Years | 249 (34.1%) | 0 (0.0%) |
| 75 Years and over | 0 (0.0%) | 0 (0.0%) |
| Total | 3,306 (46.8%) | 149 (4.5%) |
Employment Status by Educational Attainment in Pearsall
According to labor force statistics for Pearsall, 53.2% of individuals (2,241) out of the total population between 25 and 64 years of age (4,212) are in the labor force, with 5.0% or 112 of them being unemployed. The group with the highest labor force participation rate are those with the educational attainment of high school diploma, with 68.0% or 1,127 individuals in the labor force. Within the labor force, individuals with bachelor's degree or higher education have the highest percentage of unemployment, with 14.5% or 26 of them being unemployed.
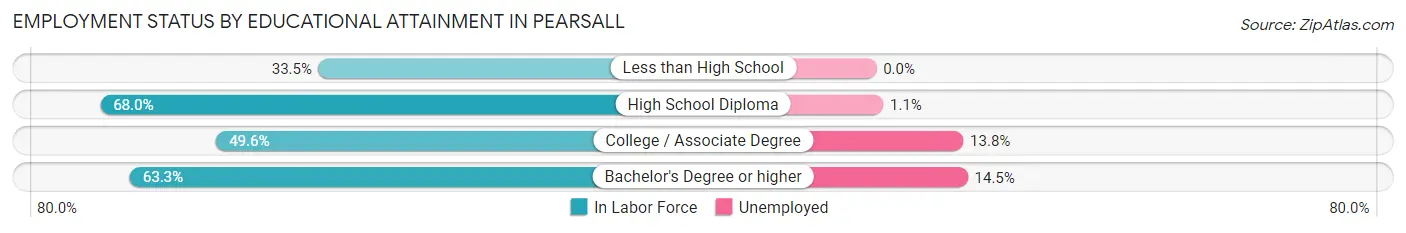
| Educational Attainment | In Labor Force | Unemployed |
| Less than High School | 398 (33.5%) | 0 (0.0%) |
| High School Diploma | 1,127 (68.0%) | 18 (1.1%) |
| College / Associate Degree | 538 (49.6%) | 150 (13.8%) |
| Bachelor's Degree or higher | 179 (63.3%) | 41 (14.5%) |
| Total | 2,241 (53.2%) | 211 (5.0%) |
Employment Occupations by Sex in Pearsall
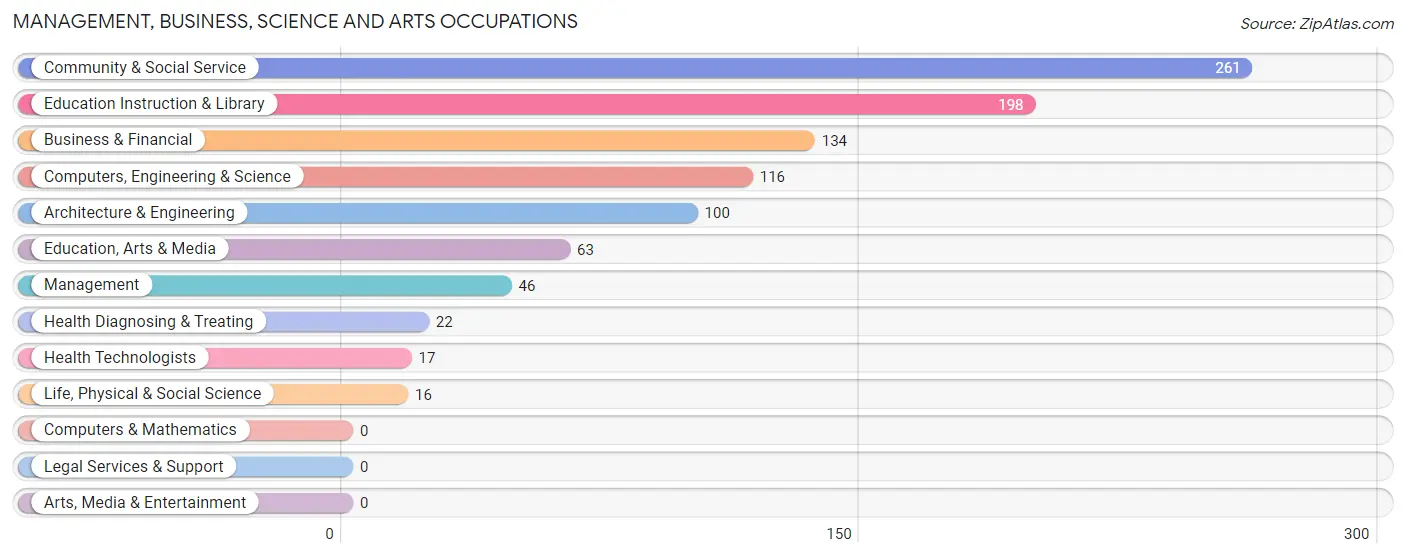
Management, Business, Science and Arts Occupations
The most common Management, Business, Science and Arts occupations in Pearsall are Community & Social Service (261 | 8.3%), Education Instruction & Library (198 | 6.3%), Business & Financial (134 | 4.2%), Computers, Engineering & Science (116 | 3.7%), and Architecture & Engineering (100 | 3.2%).
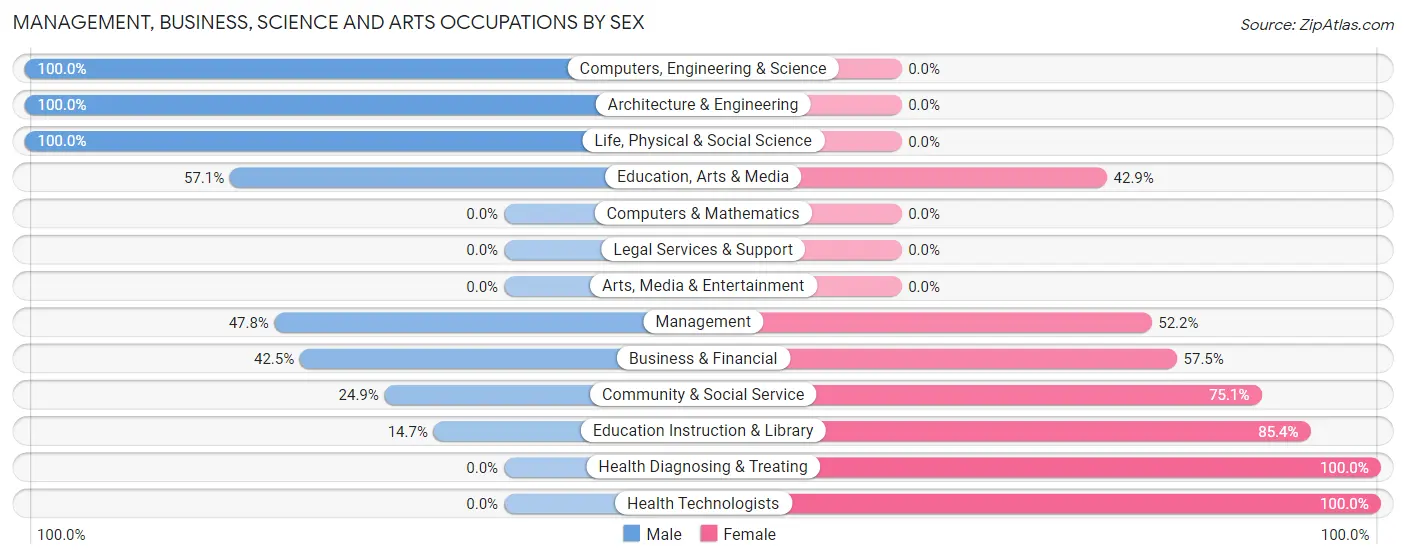
Management, Business, Science and Arts Occupations by Sex
Within the Management, Business, Science and Arts occupations in Pearsall, the most male-oriented occupations are Computers, Engineering & Science (100.0%), Architecture & Engineering (100.0%), and Life, Physical & Social Science (100.0%), while the most female-oriented occupations are Health Diagnosing & Treating (100.0%), Health Technologists (100.0%), and Education Instruction & Library (85.4%).
| Occupation | Male | Female |
| Management | 22 (47.8%) | 24 (52.2%) |
| Business & Financial | 57 (42.5%) | 77 (57.5%) |
| Computers, Engineering & Science | 116 (100.0%) | 0 (0.0%) |
| Computers & Mathematics | 0 (0.0%) | 0 (0.0%) |
| Architecture & Engineering | 100 (100.0%) | 0 (0.0%) |
| Life, Physical & Social Science | 16 (100.0%) | 0 (0.0%) |
| Community & Social Service | 65 (24.9%) | 196 (75.1%) |
| Education, Arts & Media | 36 (57.1%) | 27 (42.9%) |
| Legal Services & Support | 0 (0.0%) | 0 (0.0%) |
| Education Instruction & Library | 29 (14.6%) | 169 (85.4%) |
| Arts, Media & Entertainment | 0 (0.0%) | 0 (0.0%) |
| Health Diagnosing & Treating | 0 (0.0%) | 22 (100.0%) |
| Health Technologists | 0 (0.0%) | 17 (100.0%) |
| Total (Category) | 260 (44.9%) | 319 (55.1%) |
| Total (Overall) | 1,886 (59.7%) | 1,271 (40.3%) |
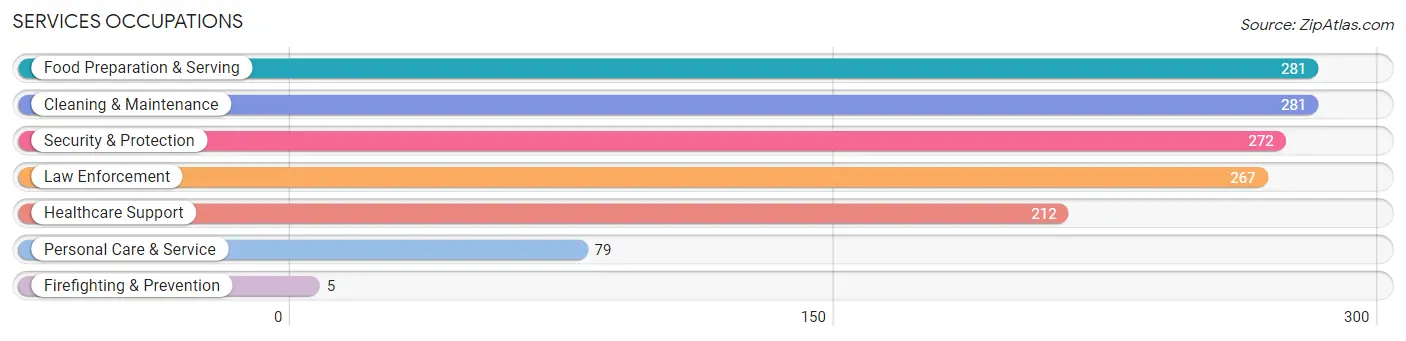
Services Occupations
The most common Services occupations in Pearsall are Food Preparation & Serving (281 | 8.9%), Cleaning & Maintenance (281 | 8.9%), Security & Protection (272 | 8.6%), Law Enforcement (267 | 8.5%), and Healthcare Support (212 | 6.7%).
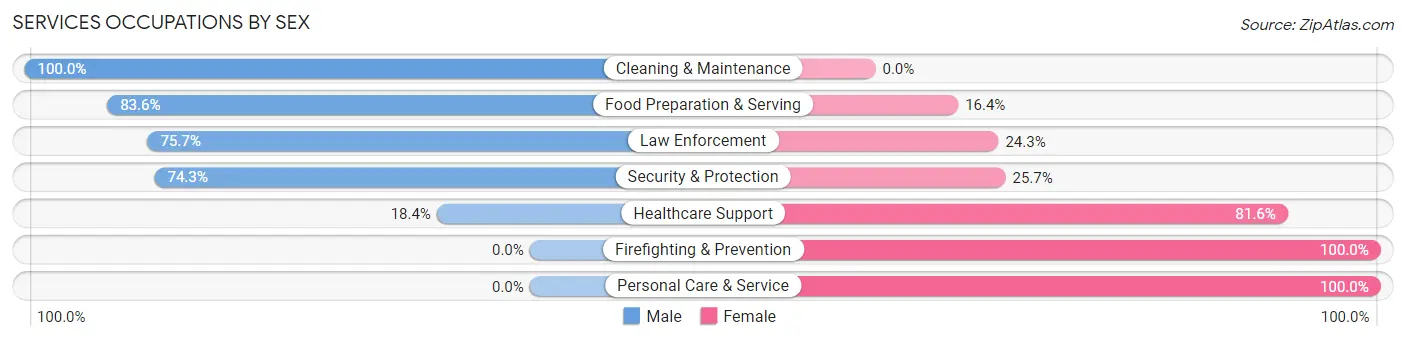
Services Occupations by Sex
Within the Services occupations in Pearsall, the most male-oriented occupations are Cleaning & Maintenance (100.0%), Food Preparation & Serving (83.6%), and Law Enforcement (75.7%), while the most female-oriented occupations are Firefighting & Prevention (100.0%), Personal Care & Service (100.0%), and Healthcare Support (81.6%).
| Occupation | Male | Female |
| Healthcare Support | 39 (18.4%) | 173 (81.6%) |
| Security & Protection | 202 (74.3%) | 70 (25.7%) |
| Firefighting & Prevention | 0 (0.0%) | 5 (100.0%) |
| Law Enforcement | 202 (75.7%) | 65 (24.3%) |
| Food Preparation & Serving | 235 (83.6%) | 46 (16.4%) |
| Cleaning & Maintenance | 281 (100.0%) | 0 (0.0%) |
| Personal Care & Service | 0 (0.0%) | 79 (100.0%) |
| Total (Category) | 757 (67.3%) | 368 (32.7%) |
| Total (Overall) | 1,886 (59.7%) | 1,271 (40.3%) |
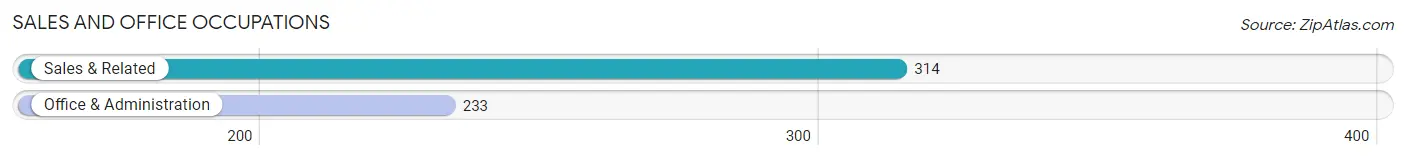
Sales and Office Occupations
The most common Sales and Office occupations in Pearsall are Sales & Related (314 | 10.0%), and Office & Administration (233 | 7.4%).
Sales and Office Occupations by Sex
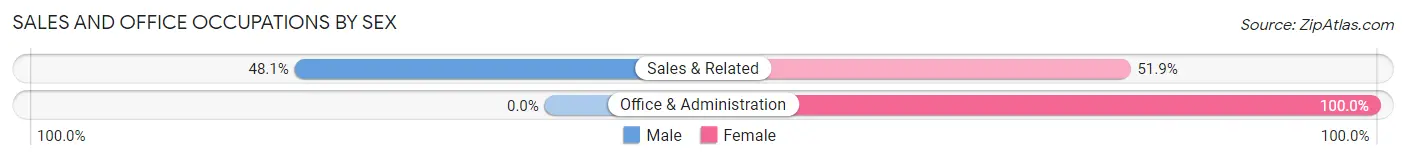
| Occupation | Male | Female |
| Sales & Related | 151 (48.1%) | 163 (51.9%) |
| Office & Administration | 0 (0.0%) | 233 (100.0%) |
| Total (Category) | 151 (27.6%) | 396 (72.4%) |
| Total (Overall) | 1,886 (59.7%) | 1,271 (40.3%) |
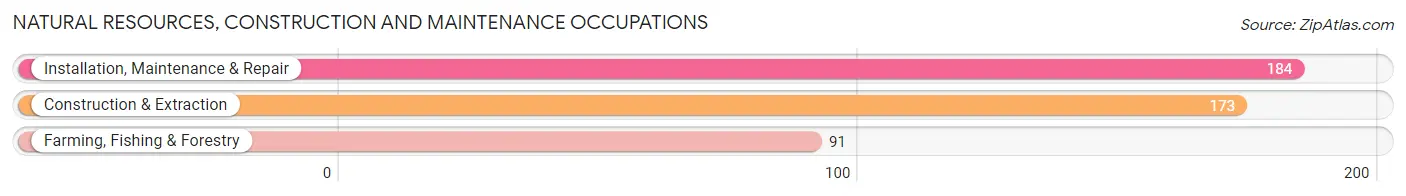
Natural Resources, Construction and Maintenance Occupations
The most common Natural Resources, Construction and Maintenance occupations in Pearsall are Installation, Maintenance & Repair (184 | 5.8%), Construction & Extraction (173 | 5.5%), and Farming, Fishing & Forestry (91 | 2.9%).
Natural Resources, Construction and Maintenance Occupations by Sex
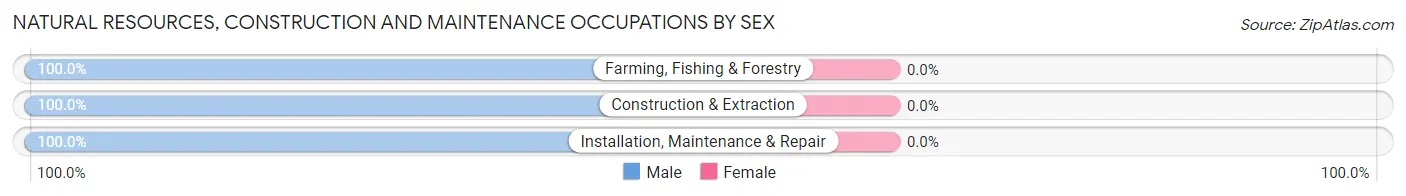
| Occupation | Male | Female |
| Farming, Fishing & Forestry | 91 (100.0%) | 0 (0.0%) |
| Construction & Extraction | 173 (100.0%) | 0 (0.0%) |
| Installation, Maintenance & Repair | 184 (100.0%) | 0 (0.0%) |
| Total (Category) | 448 (100.0%) | 0 (0.0%) |
| Total (Overall) | 1,886 (59.7%) | 1,271 (40.3%) |
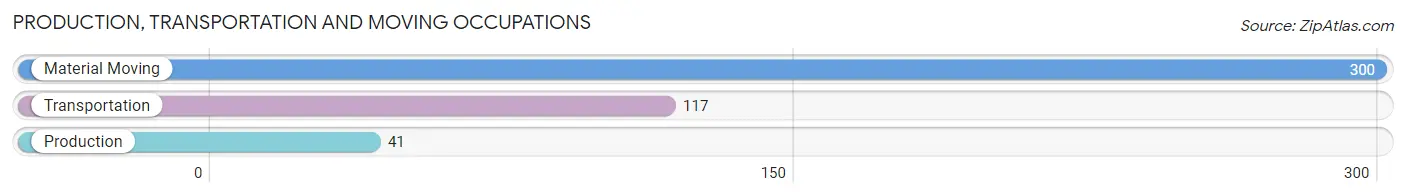
Production, Transportation and Moving Occupations
The most common Production, Transportation and Moving occupations in Pearsall are Material Moving (300 | 9.5%), Transportation (117 | 3.7%), and Production (41 | 1.3%).
Production, Transportation and Moving Occupations by Sex
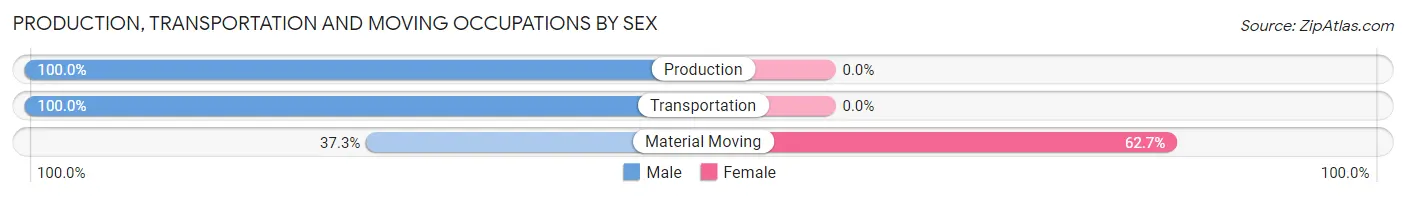
| Occupation | Male | Female |
| Production | 41 (100.0%) | 0 (0.0%) |
| Transportation | 117 (100.0%) | 0 (0.0%) |
| Material Moving | 112 (37.3%) | 188 (62.7%) |
| Total (Category) | 270 (59.0%) | 188 (41.0%) |
| Total (Overall) | 1,886 (59.7%) | 1,271 (40.3%) |
Employment Industries by Sex in Pearsall
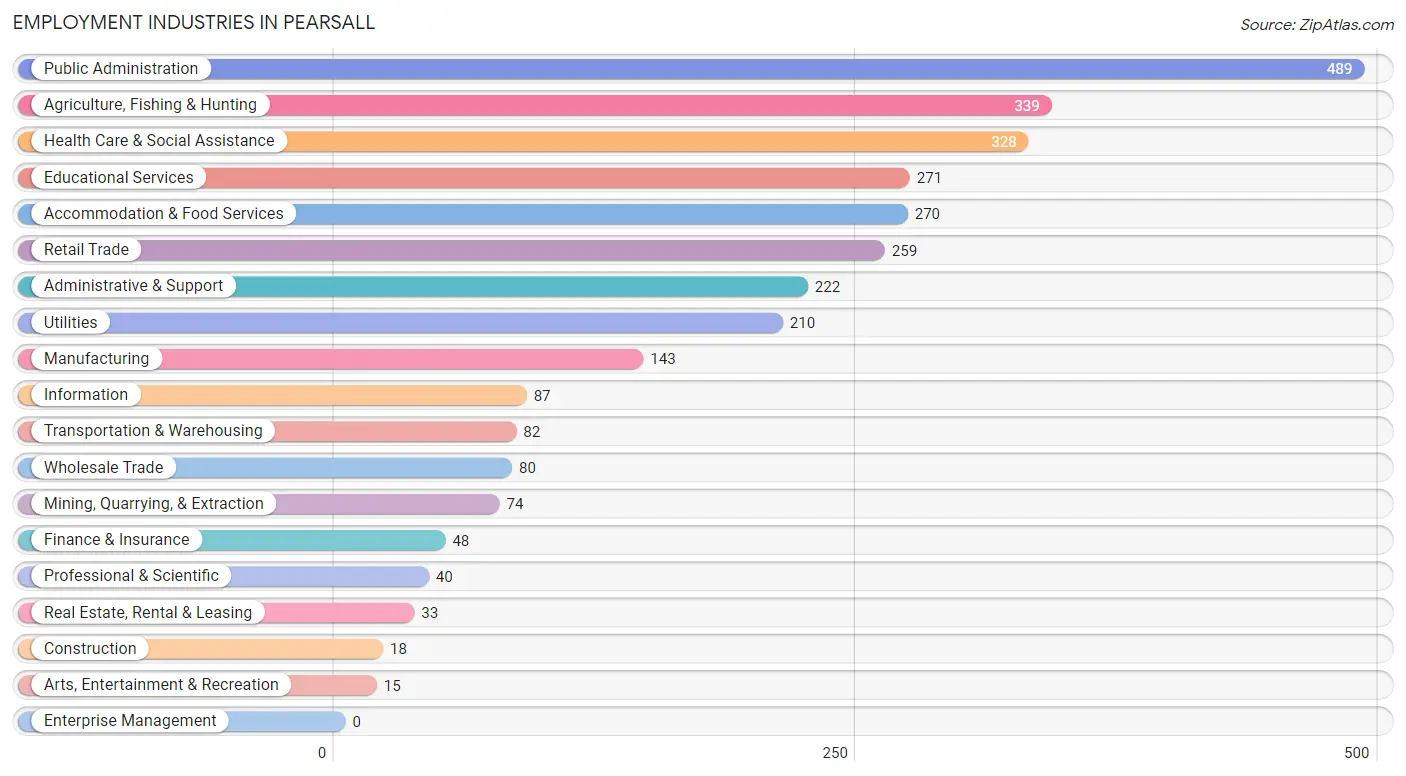
Employment Industries in Pearsall
The major employment industries in Pearsall include Public Administration (489 | 15.5%), Agriculture, Fishing & Hunting (339 | 10.7%), Health Care & Social Assistance (328 | 10.4%), Educational Services (271 | 8.6%), and Accommodation & Food Services (270 | 8.6%).
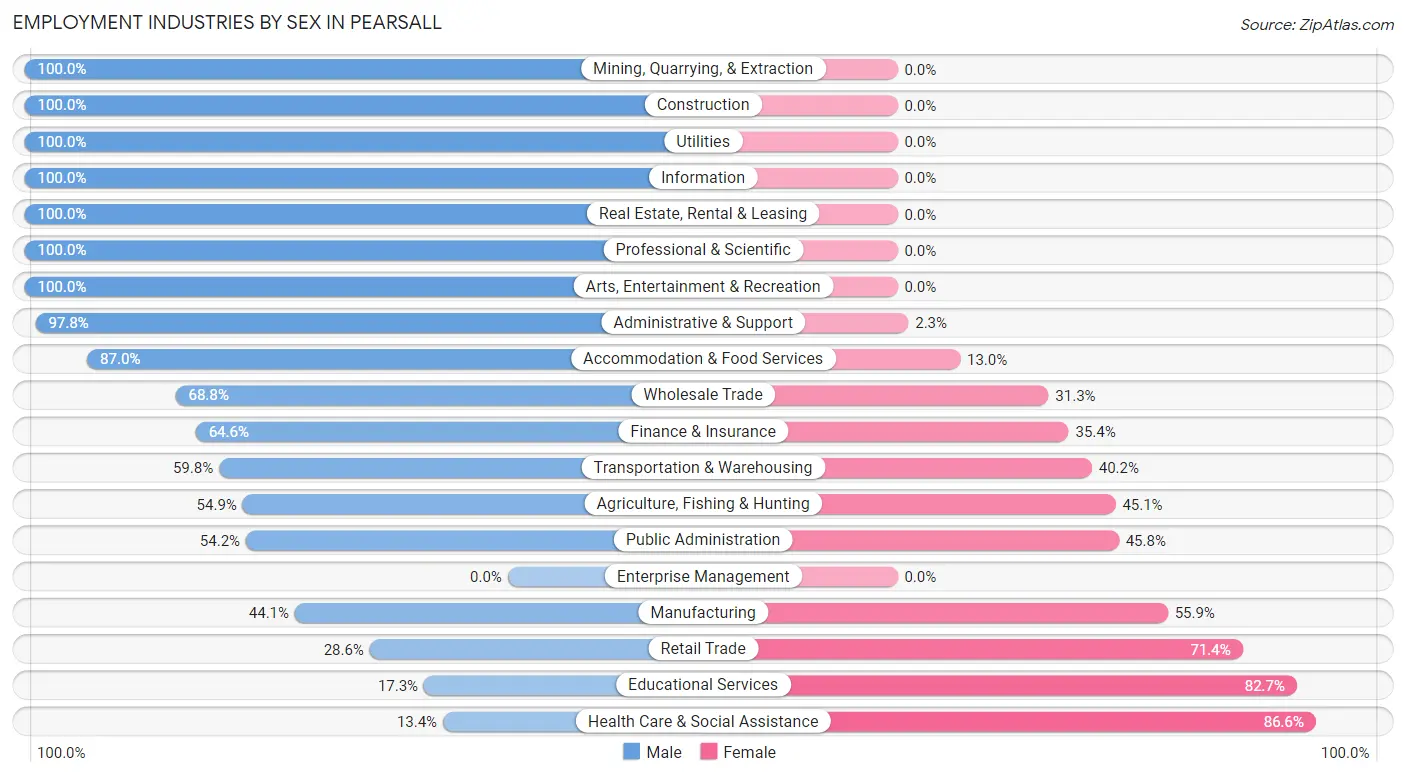
Employment Industries by Sex in Pearsall
The Pearsall industries that see more men than women are Mining, Quarrying, & Extraction (100.0%), Construction (100.0%), and Utilities (100.0%), whereas the industries that tend to have a higher number of women are Health Care & Social Assistance (86.6%), Educational Services (82.7%), and Retail Trade (71.4%).
| Industry | Male | Female |
| Agriculture, Fishing & Hunting | 186 (54.9%) | 153 (45.1%) |
| Mining, Quarrying, & Extraction | 74 (100.0%) | 0 (0.0%) |
| Construction | 18 (100.0%) | 0 (0.0%) |
| Manufacturing | 63 (44.1%) | 80 (55.9%) |
| Wholesale Trade | 55 (68.8%) | 25 (31.2%) |
| Retail Trade | 74 (28.6%) | 185 (71.4%) |
| Transportation & Warehousing | 49 (59.8%) | 33 (40.2%) |
| Utilities | 210 (100.0%) | 0 (0.0%) |
| Information | 87 (100.0%) | 0 (0.0%) |
| Finance & Insurance | 31 (64.6%) | 17 (35.4%) |
| Real Estate, Rental & Leasing | 33 (100.0%) | 0 (0.0%) |
| Professional & Scientific | 40 (100.0%) | 0 (0.0%) |
| Enterprise Management | 0 (0.0%) | 0 (0.0%) |
| Administrative & Support | 217 (97.8%) | 5 (2.2%) |
| Educational Services | 47 (17.3%) | 224 (82.7%) |
| Health Care & Social Assistance | 44 (13.4%) | 284 (86.6%) |
| Arts, Entertainment & Recreation | 15 (100.0%) | 0 (0.0%) |
| Accommodation & Food Services | 235 (87.0%) | 35 (13.0%) |
| Public Administration | 265 (54.2%) | 224 (45.8%) |
| Total | 1,886 (59.7%) | 1,271 (40.3%) |
Education in Pearsall
School Enrollment in Pearsall
The most common levels of schooling among the 2,274 students in Pearsall are high school (652 | 28.7%), elementary school (602 | 26.5%), and college / undergraduate (526 | 23.1%).
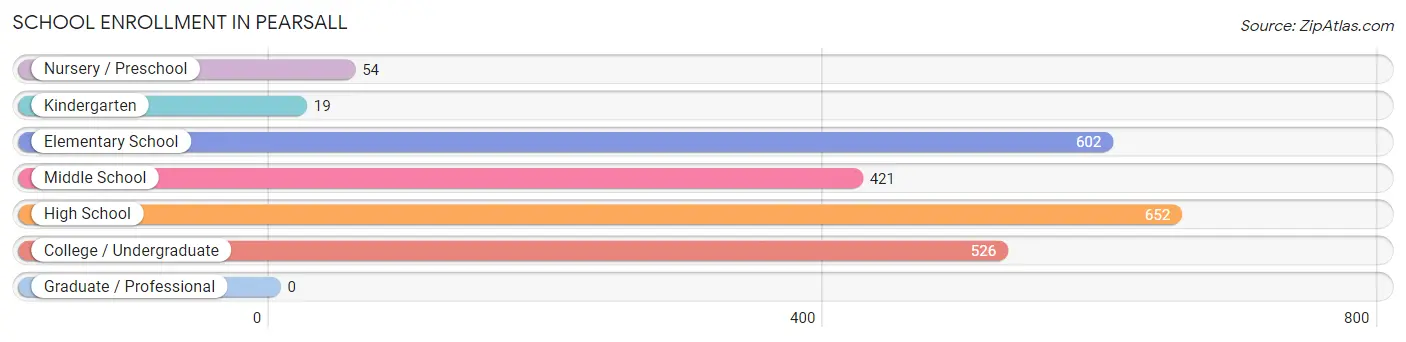
| School Level | # Students | % Students |
| Nursery / Preschool | 54 | 2.4% |
| Kindergarten | 19 | 0.8% |
| Elementary School | 602 | 26.5% |
| Middle School | 421 | 18.5% |
| High School | 652 | 28.7% |
| College / Undergraduate | 526 | 23.1% |
| Graduate / Professional | 0 | 0.0% |
| Total | 2,274 | 100.0% |
School Enrollment by Age by Funding Source in Pearsall
Out of a total of 2,274 students who are enrolled in schools in Pearsall, 241 (10.6%) attend a private institution, while the remaining 2,033 (89.4%) are enrolled in public schools. The age group of 18 to 19 year olds has the highest likelihood of being enrolled in private schools, with 90 (37.7% in the age bracket) enrolled. Conversely, the age group of 3 to 4 year olds has the lowest likelihood of being enrolled in a private school, with 40 (100.0% in the age bracket) attending a public institution.
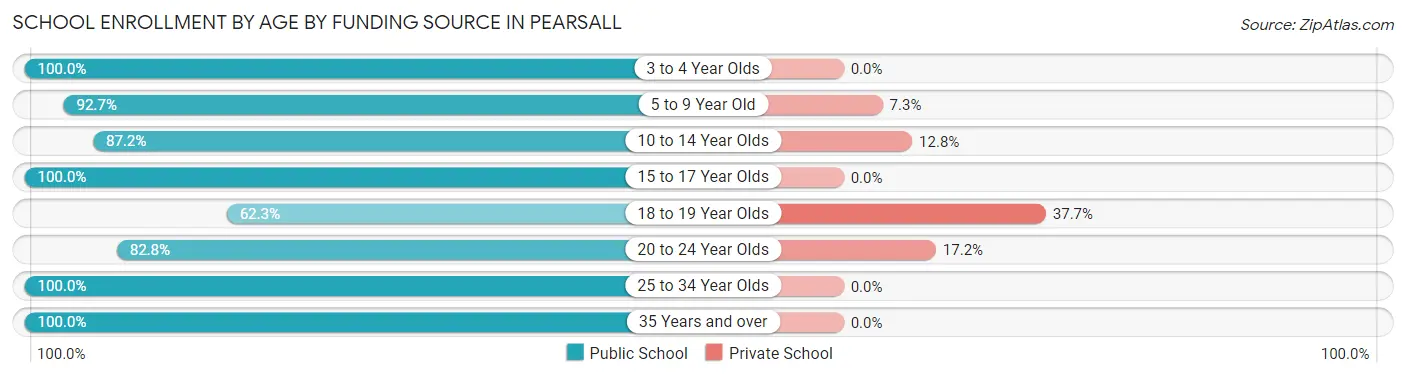
| Age Bracket | Public School | Private School |
| 3 to 4 Year Olds | 40 (100.0%) | 0 (0.0%) |
| 5 to 9 Year Old | 383 (92.7%) | 30 (7.3%) |
| 10 to 14 Year Olds | 629 (87.2%) | 92 (12.8%) |
| 15 to 17 Year Olds | 398 (100.0%) | 0 (0.0%) |
| 18 to 19 Year Olds | 149 (62.3%) | 90 (37.7%) |
| 20 to 24 Year Olds | 135 (82.8%) | 28 (17.2%) |
| 25 to 34 Year Olds | 246 (100.0%) | 0 (0.0%) |
| 35 Years and over | 54 (100.0%) | 0 (0.0%) |
| Total | 2,033 (89.4%) | 241 (10.6%) |
Educational Attainment by Field of Study in Pearsall
Education (86 | 23.4%), arts & humanities (57 | 15.5%), science & technology (53 | 14.4%), psychology (35 | 9.5%), and business (34 | 9.3%) are the most common fields of study among 367 individuals in Pearsall who have obtained a bachelor's degree or higher.
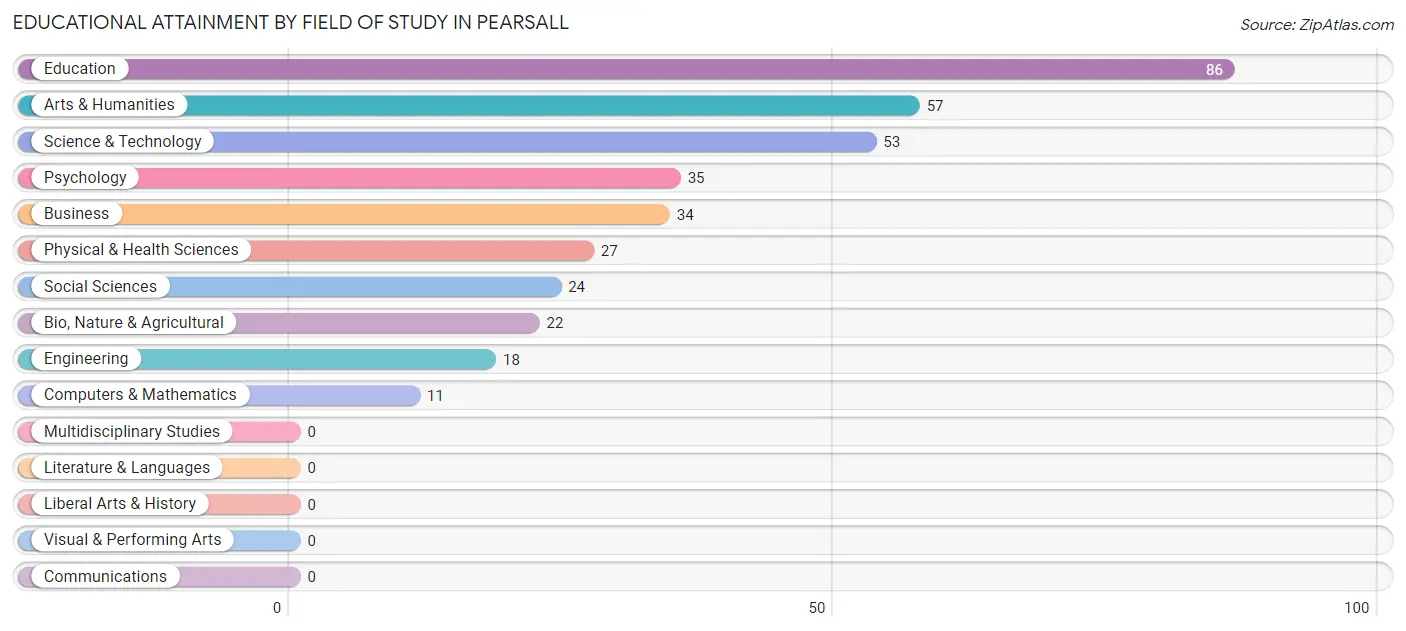
| Field of Study | # Graduates | % Graduates |
| Computers & Mathematics | 11 | 3.0% |
| Bio, Nature & Agricultural | 22 | 6.0% |
| Physical & Health Sciences | 27 | 7.4% |
| Psychology | 35 | 9.5% |
| Social Sciences | 24 | 6.5% |
| Engineering | 18 | 4.9% |
| Multidisciplinary Studies | 0 | 0.0% |
| Science & Technology | 53 | 14.4% |
| Business | 34 | 9.3% |
| Education | 86 | 23.4% |
| Literature & Languages | 0 | 0.0% |
| Liberal Arts & History | 0 | 0.0% |
| Visual & Performing Arts | 0 | 0.0% |
| Communications | 0 | 0.0% |
| Arts & Humanities | 57 | 15.5% |
| Total | 367 | 100.0% |
Transportation & Commute in Pearsall
Vehicle Availability by Sex in Pearsall
The most prevalent vehicle ownership categories in Pearsall are males with 3 vehicles (644, accounting for 35.1%) and females with 3 vehicles (243, making up 51.6%).
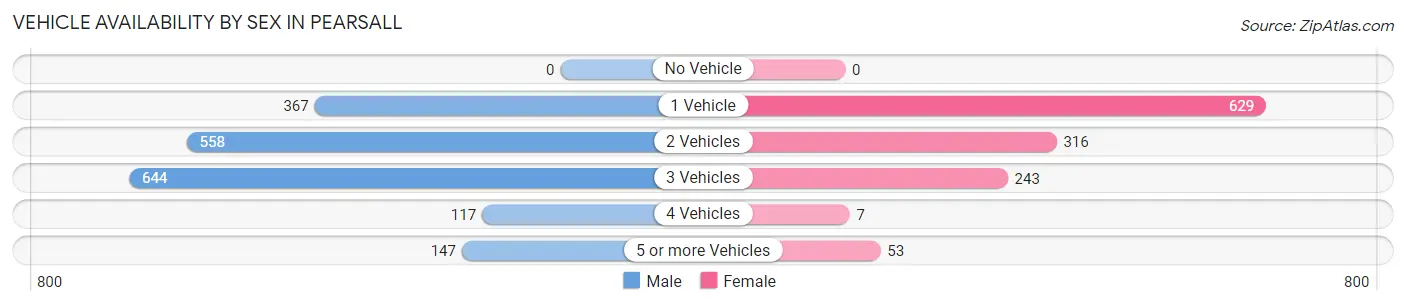
| Vehicles Available | Male | Female |
| No Vehicle | 0 (0.0%) | 0 (0.0%) |
| 1 Vehicle | 367 (20.0%) | 629 (50.4%) |
| 2 Vehicles | 558 (30.4%) | 316 (25.3%) |
| 3 Vehicles | 644 (35.1%) | 243 (19.5%) |
| 4 Vehicles | 117 (6.4%) | 7 (0.6%) |
| 5 or more Vehicles | 147 (8.0%) | 53 (4.3%) |
| Total | 1,833 (100.0%) | 1,248 (100.0%) |
Commute Time in Pearsall
The most frequently occuring commute durations in Pearsall are 5 to 9 minutes (802 commuters, 26.0%), 10 to 14 minutes (566 commuters, 18.3%), and 20 to 24 minutes (438 commuters, 14.2%).
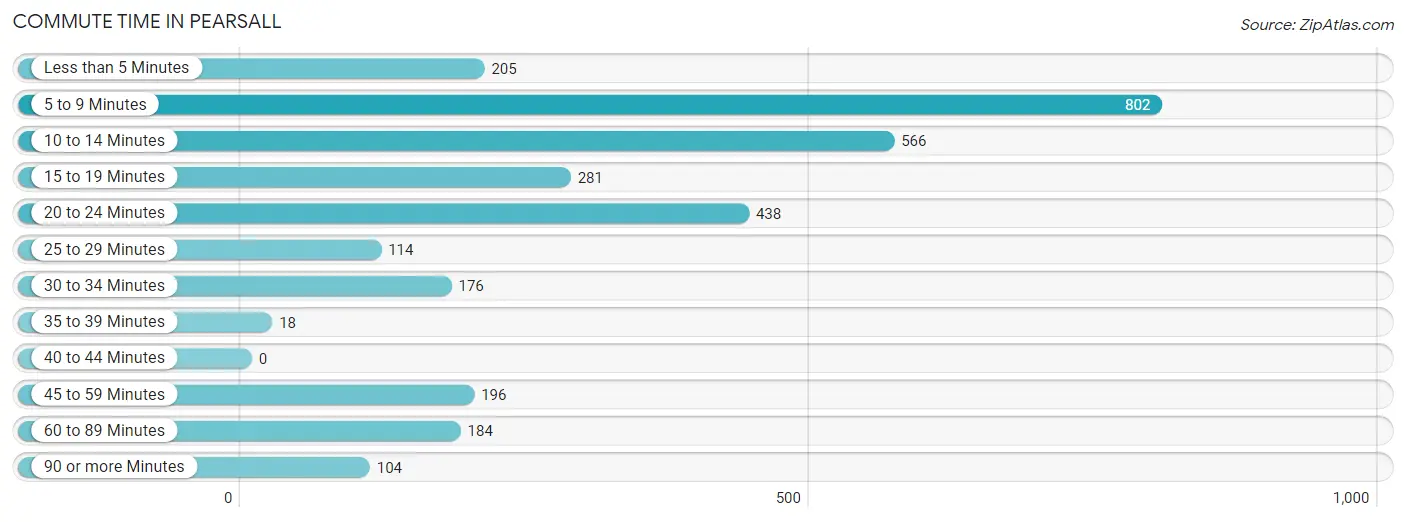
| Commute Time | # Commuters | % Commuters |
| Less than 5 Minutes | 205 | 6.7% |
| 5 to 9 Minutes | 802 | 26.0% |
| 10 to 14 Minutes | 566 | 18.3% |
| 15 to 19 Minutes | 281 | 9.1% |
| 20 to 24 Minutes | 438 | 14.2% |
| 25 to 29 Minutes | 114 | 3.7% |
| 30 to 34 Minutes | 176 | 5.7% |
| 35 to 39 Minutes | 18 | 0.6% |
| 40 to 44 Minutes | 0 | 0.0% |
| 45 to 59 Minutes | 196 | 6.4% |
| 60 to 89 Minutes | 184 | 6.0% |
| 90 or more Minutes | 104 | 3.4% |
Commute Time by Sex in Pearsall
The most common commute times in Pearsall are 5 to 9 minutes (442 commuters, 24.1%) for males and 5 to 9 minutes (360 commuters, 28.8%) for females.
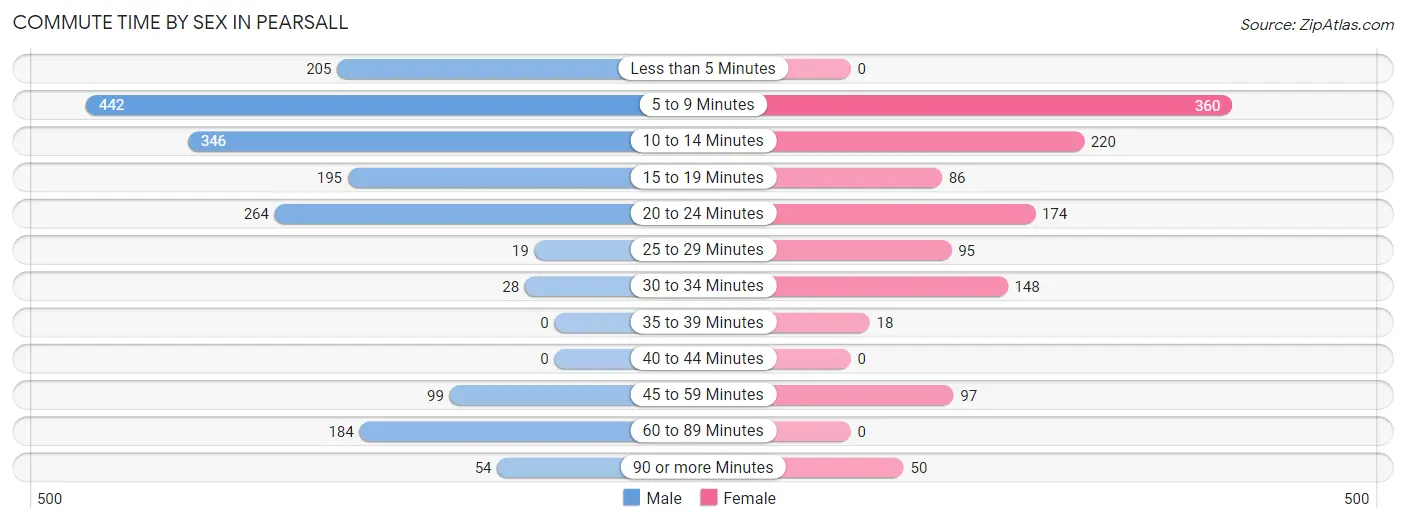
| Commute Time | Male | Female |
| Less than 5 Minutes | 205 (11.2%) | 0 (0.0%) |
| 5 to 9 Minutes | 442 (24.1%) | 360 (28.8%) |
| 10 to 14 Minutes | 346 (18.9%) | 220 (17.6%) |
| 15 to 19 Minutes | 195 (10.6%) | 86 (6.9%) |
| 20 to 24 Minutes | 264 (14.4%) | 174 (13.9%) |
| 25 to 29 Minutes | 19 (1.0%) | 95 (7.6%) |
| 30 to 34 Minutes | 28 (1.5%) | 148 (11.9%) |
| 35 to 39 Minutes | 0 (0.0%) | 18 (1.4%) |
| 40 to 44 Minutes | 0 (0.0%) | 0 (0.0%) |
| 45 to 59 Minutes | 99 (5.4%) | 97 (7.8%) |
| 60 to 89 Minutes | 184 (10.0%) | 0 (0.0%) |
| 90 or more Minutes | 54 (2.9%) | 50 (4.0%) |
Time of Departure to Work by Sex in Pearsall
The most frequent times of departure to work in Pearsall are 7:30 AM to 7:59 AM (458, 24.9%) for males and 7:30 AM to 7:59 AM (388, 31.1%) for females.
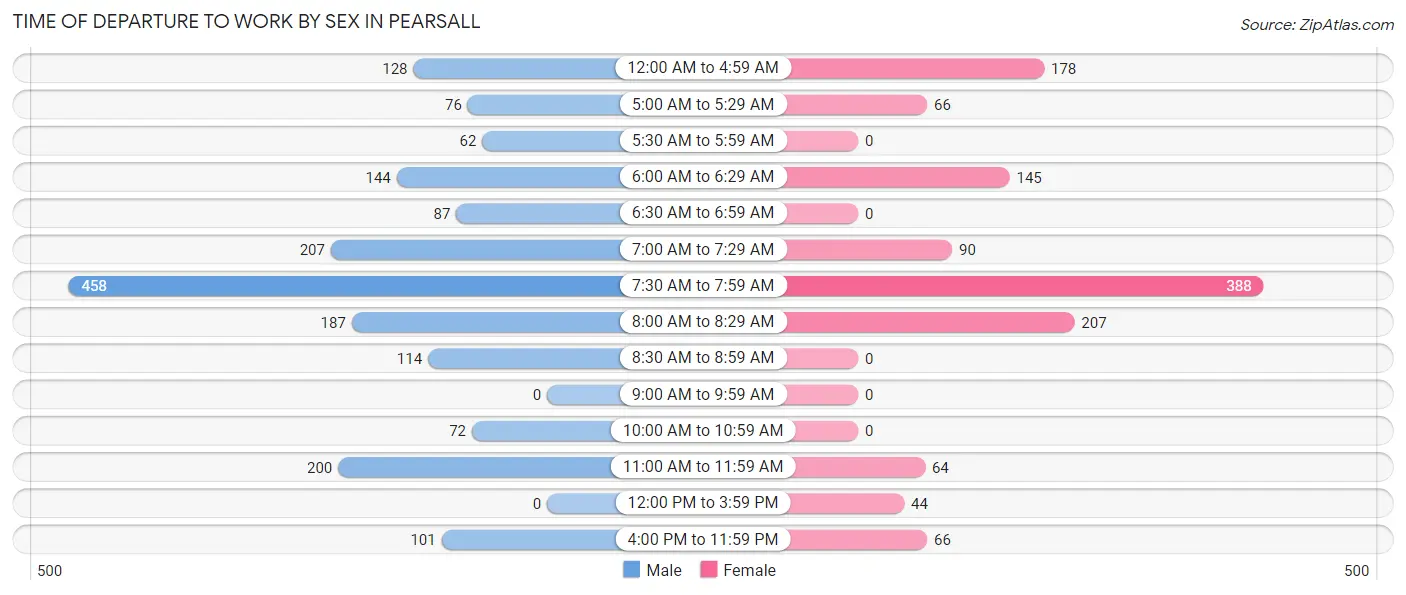
| Time of Departure | Male | Female |
| 12:00 AM to 4:59 AM | 128 (7.0%) | 178 (14.3%) |
| 5:00 AM to 5:29 AM | 76 (4.1%) | 66 (5.3%) |
| 5:30 AM to 5:59 AM | 62 (3.4%) | 0 (0.0%) |
| 6:00 AM to 6:29 AM | 144 (7.8%) | 145 (11.6%) |
| 6:30 AM to 6:59 AM | 87 (4.7%) | 0 (0.0%) |
| 7:00 AM to 7:29 AM | 207 (11.3%) | 90 (7.2%) |
| 7:30 AM to 7:59 AM | 458 (24.9%) | 388 (31.1%) |
| 8:00 AM to 8:29 AM | 187 (10.2%) | 207 (16.6%) |
| 8:30 AM to 8:59 AM | 114 (6.2%) | 0 (0.0%) |
| 9:00 AM to 9:59 AM | 0 (0.0%) | 0 (0.0%) |
| 10:00 AM to 10:59 AM | 72 (3.9%) | 0 (0.0%) |
| 11:00 AM to 11:59 AM | 200 (10.9%) | 64 (5.1%) |
| 12:00 PM to 3:59 PM | 0 (0.0%) | 44 (3.5%) |
| 4:00 PM to 11:59 PM | 101 (5.5%) | 66 (5.3%) |
| Total | 1,836 (100.0%) | 1,248 (100.0%) |
Housing Occupancy in Pearsall
Occupancy by Ownership in Pearsall
Of the total 2,413 dwellings in Pearsall, owner-occupied units account for 1,274 (52.8%), while renter-occupied units make up 1,139 (47.2%).
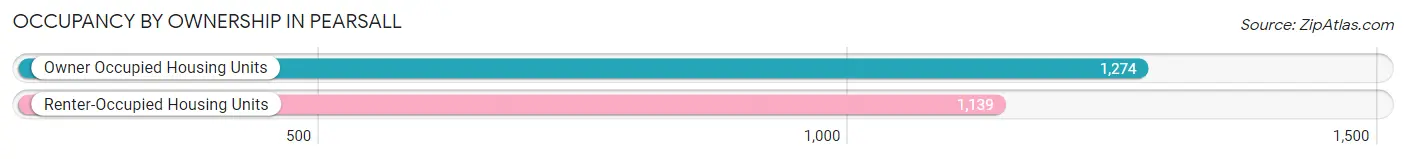
| Occupancy | # Housing Units | % Housing Units |
| Owner Occupied Housing Units | 1,274 | 52.8% |
| Renter-Occupied Housing Units | 1,139 | 47.2% |
| Total Occupied Housing Units | 2,413 | 100.0% |
Occupancy by Household Size in Pearsall
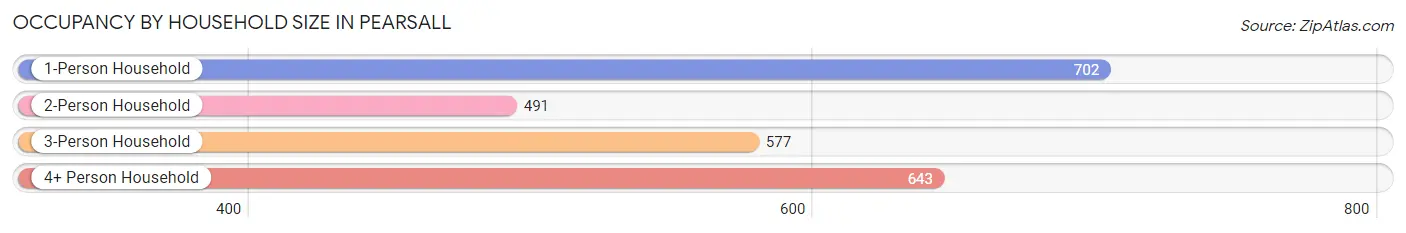
| Household Size | # Housing Units | % Housing Units |
| 1-Person Household | 702 | 29.1% |
| 2-Person Household | 491 | 20.3% |
| 3-Person Household | 577 | 23.9% |
| 4+ Person Household | 643 | 26.7% |
| Total Housing Units | 2,413 | 100.0% |
Occupancy by Ownership by Household Size in Pearsall
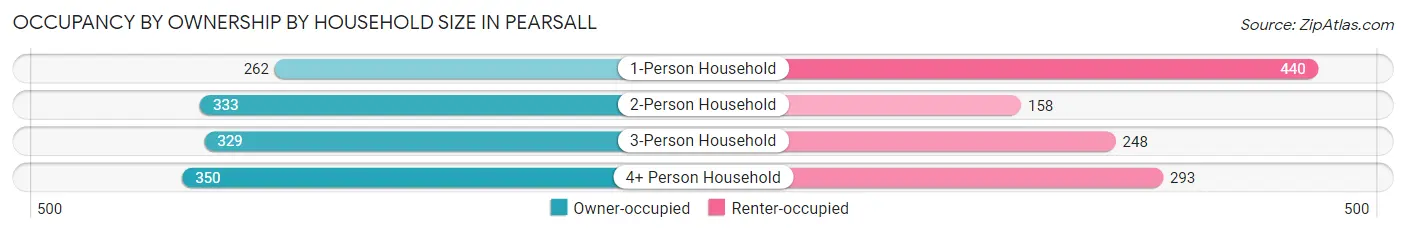
| Household Size | Owner-occupied | Renter-occupied |
| 1-Person Household | 262 (37.3%) | 440 (62.7%) |
| 2-Person Household | 333 (67.8%) | 158 (32.2%) |
| 3-Person Household | 329 (57.0%) | 248 (43.0%) |
| 4+ Person Household | 350 (54.4%) | 293 (45.6%) |
| Total Housing Units | 1,274 (52.8%) | 1,139 (47.2%) |
Occupancy by Educational Attainment in Pearsall
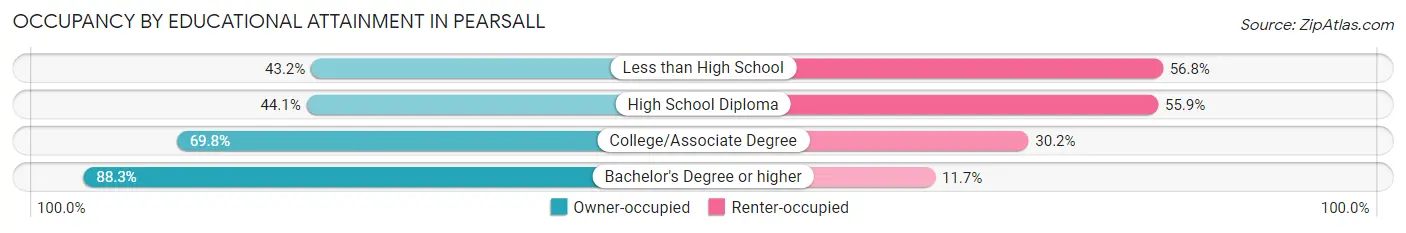
| Household Size | Owner-occupied | Renter-occupied |
| Less than High School | 384 (43.2%) | 505 (56.8%) |
| High School Diploma | 356 (44.1%) | 451 (55.9%) |
| College/Associate Degree | 375 (69.8%) | 162 (30.2%) |
| Bachelor's Degree or higher | 159 (88.3%) | 21 (11.7%) |
Occupancy by Age of Householder in Pearsall
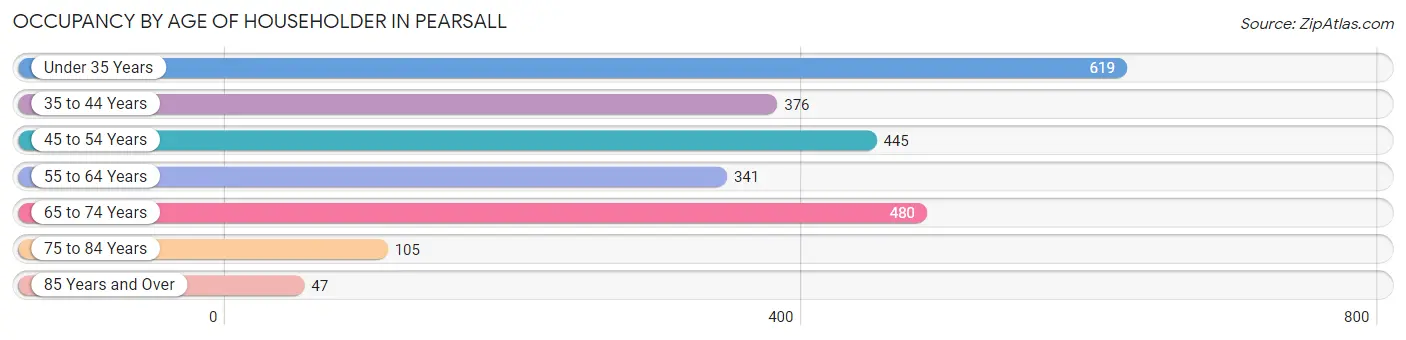
| Age Bracket | # Households | % Households |
| Under 35 Years | 619 | 25.7% |
| 35 to 44 Years | 376 | 15.6% |
| 45 to 54 Years | 445 | 18.4% |
| 55 to 64 Years | 341 | 14.1% |
| 65 to 74 Years | 480 | 19.9% |
| 75 to 84 Years | 105 | 4.3% |
| 85 Years and Over | 47 | 1.9% |
| Total | 2,413 | 100.0% |
Housing Finances in Pearsall
Median Income by Occupancy in Pearsall
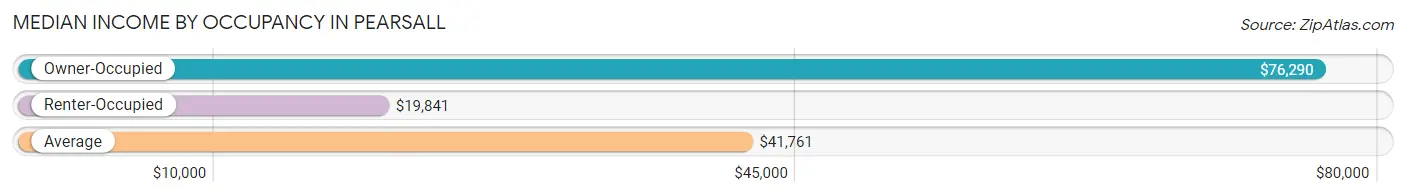
| Occupancy Type | # Households | Median Income |
| Owner-Occupied | 1,274 (52.8%) | $76,290 |
| Renter-Occupied | 1,139 (47.2%) | $19,841 |
| Average | 2,413 (100.0%) | $41,761 |
Occupancy by Householder Income Bracket in Pearsall
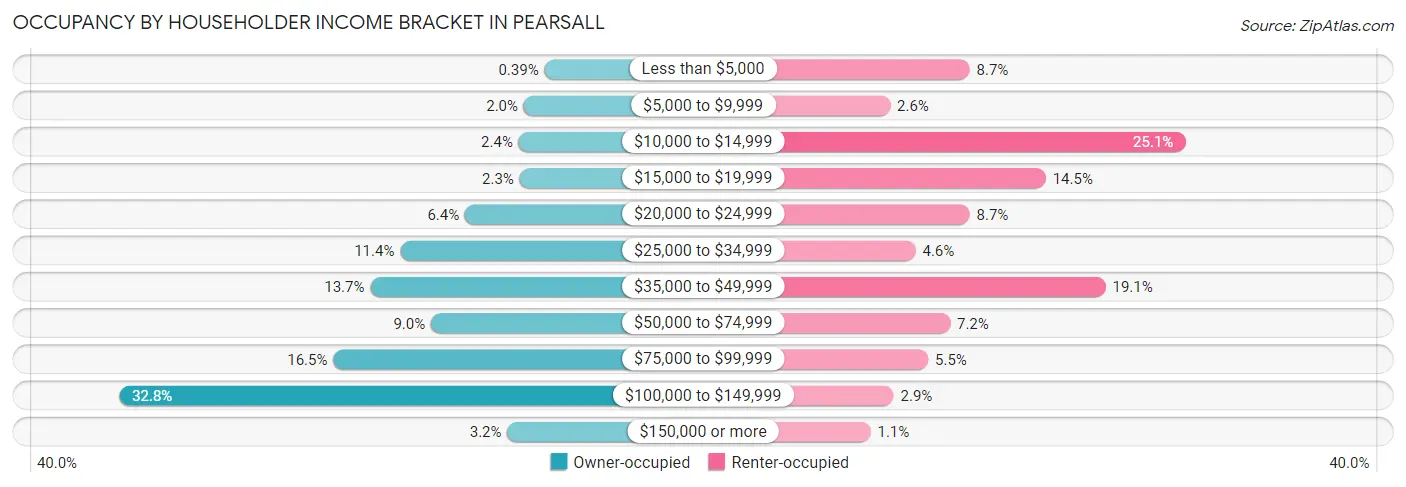
| Income Bracket | Owner-occupied | Renter-occupied |
| Less than $5,000 | 5 (0.4%) | 99 (8.7%) |
| $5,000 to $9,999 | 25 (2.0%) | 30 (2.6%) |
| $10,000 to $14,999 | 30 (2.4%) | 286 (25.1%) |
| $15,000 to $19,999 | 29 (2.3%) | 165 (14.5%) |
| $20,000 to $24,999 | 82 (6.4%) | 99 (8.7%) |
| $25,000 to $34,999 | 145 (11.4%) | 52 (4.6%) |
| $35,000 to $49,999 | 174 (13.7%) | 217 (19.1%) |
| $50,000 to $74,999 | 115 (9.0%) | 82 (7.2%) |
| $75,000 to $99,999 | 210 (16.5%) | 63 (5.5%) |
| $100,000 to $149,999 | 418 (32.8%) | 33 (2.9%) |
| $150,000 or more | 41 (3.2%) | 13 (1.1%) |
| Total | 1,274 (100.0%) | 1,139 (100.0%) |
Monthly Housing Cost Tiers in Pearsall
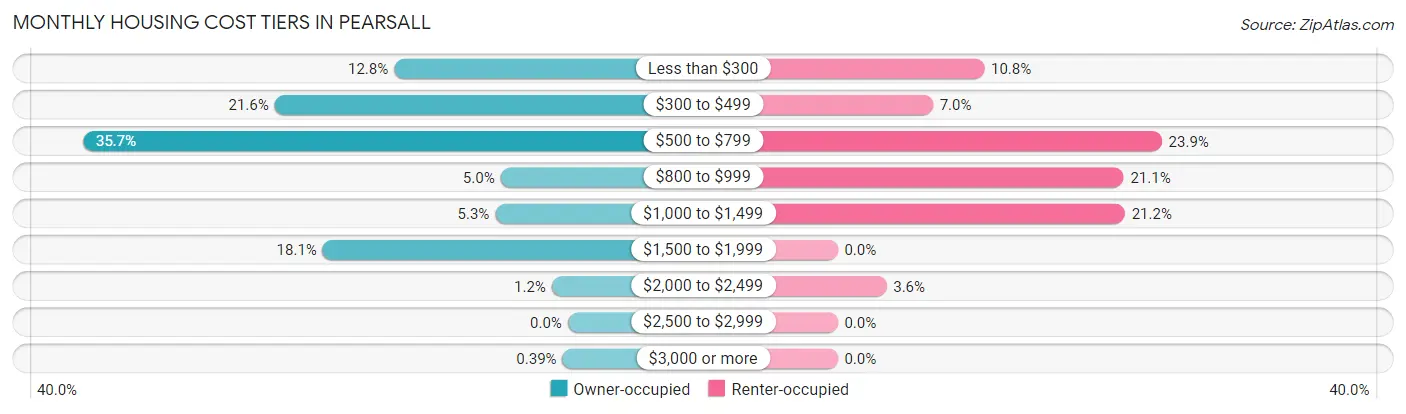
| Monthly Cost | Owner-occupied | Renter-occupied |
| Less than $300 | 163 (12.8%) | 123 (10.8%) |
| $300 to $499 | 275 (21.6%) | 80 (7.0%) |
| $500 to $799 | 455 (35.7%) | 272 (23.9%) |
| $800 to $999 | 63 (5.0%) | 240 (21.1%) |
| $1,000 to $1,499 | 68 (5.3%) | 241 (21.2%) |
| $1,500 to $1,999 | 230 (18.0%) | 0 (0.0%) |
| $2,000 to $2,499 | 15 (1.2%) | 41 (3.6%) |
| $2,500 to $2,999 | 0 (0.0%) | 0 (0.0%) |
| $3,000 or more | 5 (0.4%) | 0 (0.0%) |
| Total | 1,274 (100.0%) | 1,139 (100.0%) |
Physical Housing Characteristics in Pearsall
Housing Structures in Pearsall
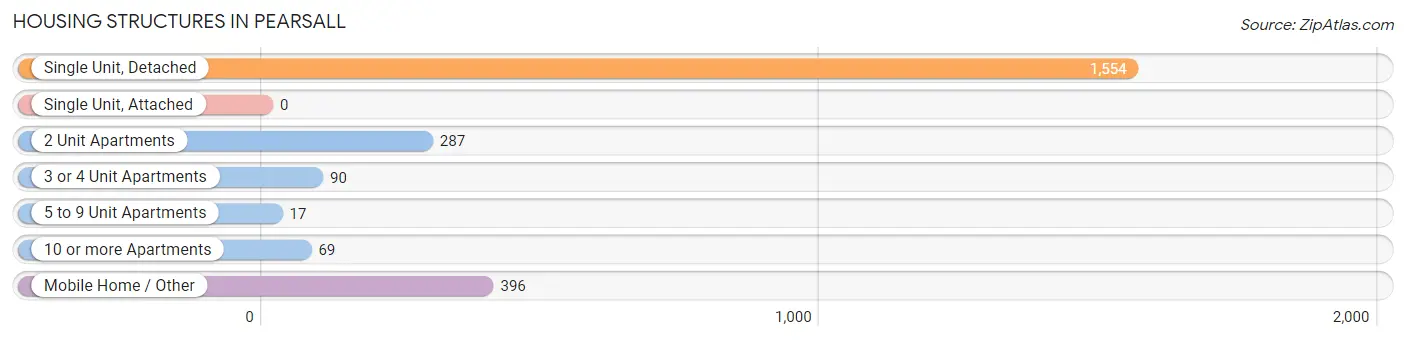
| Structure Type | # Housing Units | % Housing Units |
| Single Unit, Detached | 1,554 | 64.4% |
| Single Unit, Attached | 0 | 0.0% |
| 2 Unit Apartments | 287 | 11.9% |
| 3 or 4 Unit Apartments | 90 | 3.7% |
| 5 to 9 Unit Apartments | 17 | 0.7% |
| 10 or more Apartments | 69 | 2.9% |
| Mobile Home / Other | 396 | 16.4% |
| Total | 2,413 | 100.0% |
Housing Structures by Occupancy in Pearsall
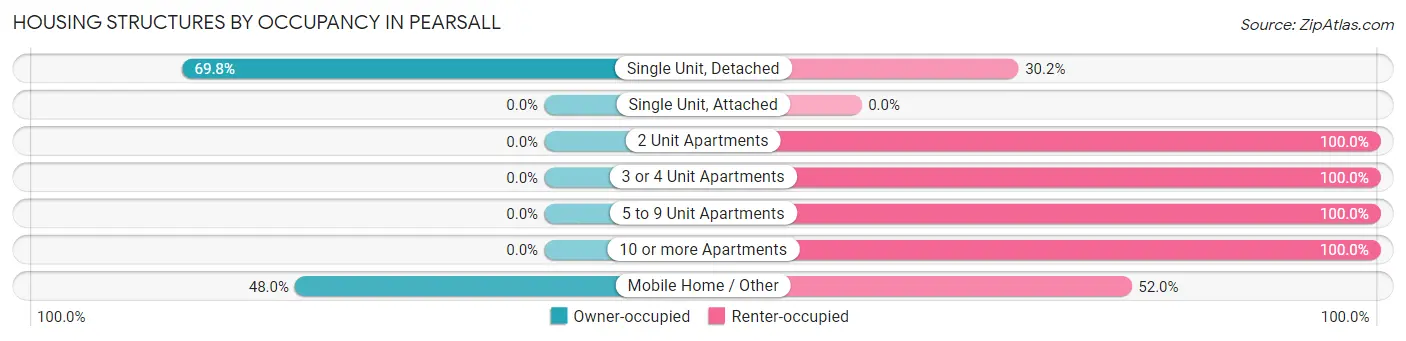
| Structure Type | Owner-occupied | Renter-occupied |
| Single Unit, Detached | 1,084 (69.8%) | 470 (30.2%) |
| Single Unit, Attached | 0 (0.0%) | 0 (0.0%) |
| 2 Unit Apartments | 0 (0.0%) | 287 (100.0%) |
| 3 or 4 Unit Apartments | 0 (0.0%) | 90 (100.0%) |
| 5 to 9 Unit Apartments | 0 (0.0%) | 17 (100.0%) |
| 10 or more Apartments | 0 (0.0%) | 69 (100.0%) |
| Mobile Home / Other | 190 (48.0%) | 206 (52.0%) |
| Total | 1,274 (52.8%) | 1,139 (47.2%) |
Housing Structures by Number of Rooms in Pearsall
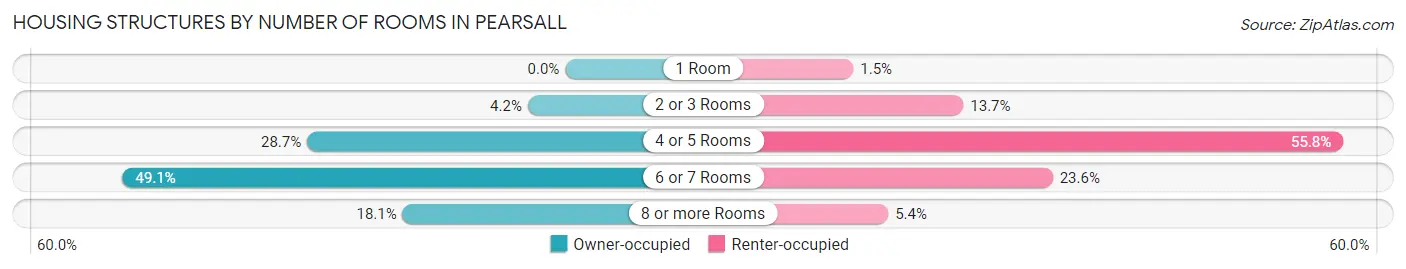
| Number of Rooms | Owner-occupied | Renter-occupied |
| 1 Room | 0 (0.0%) | 17 (1.5%) |
| 2 or 3 Rooms | 53 (4.2%) | 156 (13.7%) |
| 4 or 5 Rooms | 365 (28.6%) | 636 (55.8%) |
| 6 or 7 Rooms | 626 (49.1%) | 269 (23.6%) |
| 8 or more Rooms | 230 (18.0%) | 61 (5.4%) |
| Total | 1,274 (100.0%) | 1,139 (100.0%) |
Housing Structure by Heating Type in Pearsall
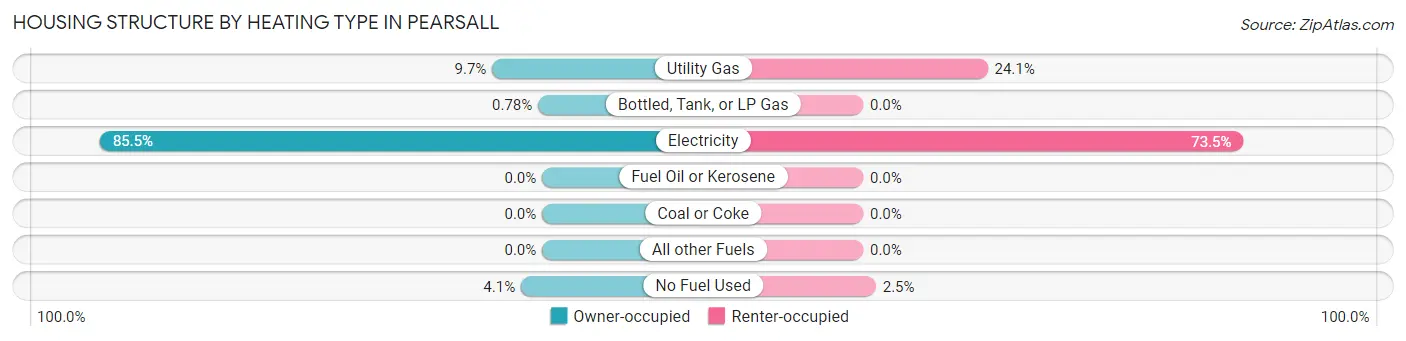
| Heating Type | Owner-occupied | Renter-occupied |
| Utility Gas | 123 (9.7%) | 274 (24.1%) |
| Bottled, Tank, or LP Gas | 10 (0.8%) | 0 (0.0%) |
| Electricity | 1,089 (85.5%) | 837 (73.5%) |
| Fuel Oil or Kerosene | 0 (0.0%) | 0 (0.0%) |
| Coal or Coke | 0 (0.0%) | 0 (0.0%) |
| All other Fuels | 0 (0.0%) | 0 (0.0%) |
| No Fuel Used | 52 (4.1%) | 28 (2.5%) |
| Total | 1,274 (100.0%) | 1,139 (100.0%) |
Household Vehicle Usage in Pearsall
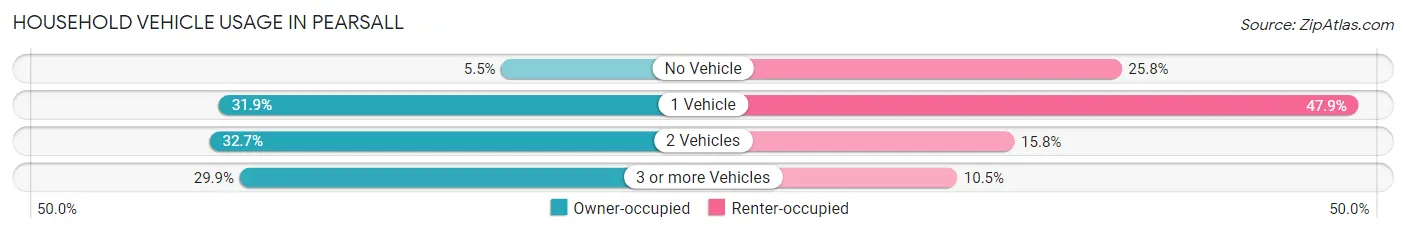
| Vehicles per Household | Owner-occupied | Renter-occupied |
| No Vehicle | 70 (5.5%) | 294 (25.8%) |
| 1 Vehicle | 406 (31.9%) | 546 (47.9%) |
| 2 Vehicles | 417 (32.7%) | 180 (15.8%) |
| 3 or more Vehicles | 381 (29.9%) | 119 (10.4%) |
| Total | 1,274 (100.0%) | 1,139 (100.0%) |
Real Estate & Mortgages in Pearsall
Real Estate and Mortgage Overview in Pearsall
| Characteristic | Without Mortgage | With Mortgage |
| Housing Units | 810 | 464 |
| Median Property Value | $76,000 | $112,500 |
| Median Household Income | $60,438 | $23 |
| Monthly Housing Costs | $530 | $5 |
| Real Estate Taxes | $1,649 | $65 |
Property Value by Mortgage Status in Pearsall
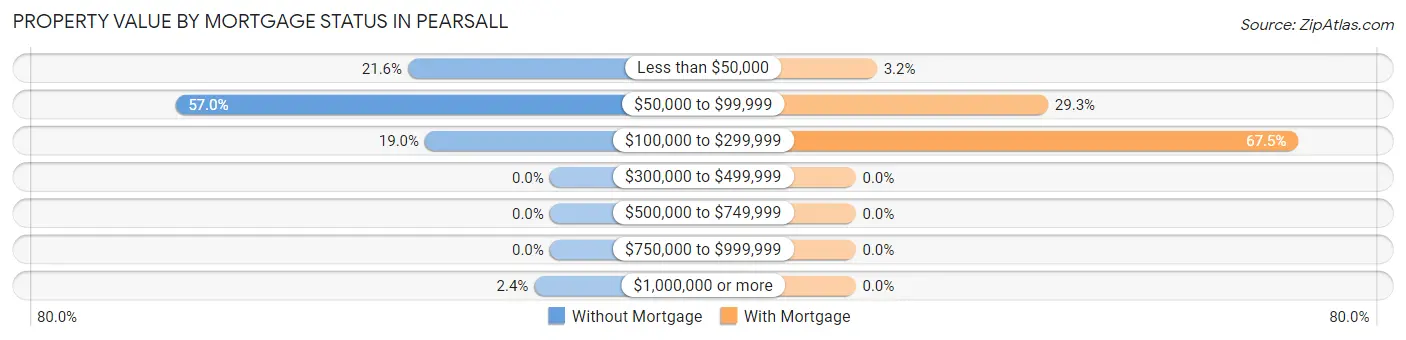
| Property Value | Without Mortgage | With Mortgage |
| Less than $50,000 | 175 (21.6%) | 15 (3.2%) |
| $50,000 to $99,999 | 462 (57.0%) | 136 (29.3%) |
| $100,000 to $299,999 | 154 (19.0%) | 313 (67.5%) |
| $300,000 to $499,999 | 0 (0.0%) | 0 (0.0%) |
| $500,000 to $749,999 | 0 (0.0%) | 0 (0.0%) |
| $750,000 to $999,999 | 0 (0.0%) | 0 (0.0%) |
| $1,000,000 or more | 19 (2.4%) | 0 (0.0%) |
| Total | 810 (100.0%) | 464 (100.0%) |
Household Income by Mortgage Status in Pearsall
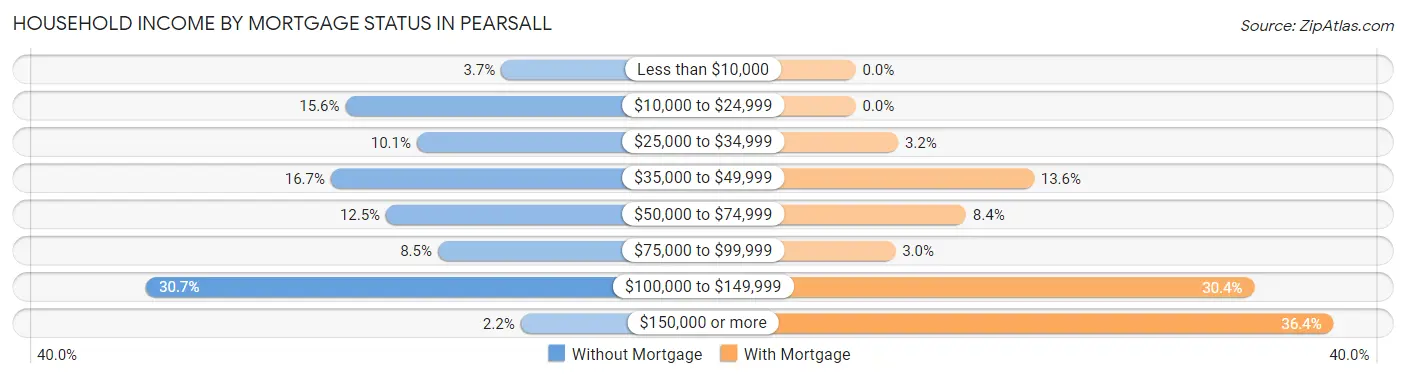
| Household Income | Without Mortgage | With Mortgage |
| Less than $10,000 | 30 (3.7%) | 0 (0.0%) |
| $10,000 to $24,999 | 126 (15.6%) | 0 (0.0%) |
| $25,000 to $34,999 | 82 (10.1%) | 15 (3.2%) |
| $35,000 to $49,999 | 135 (16.7%) | 63 (13.6%) |
| $50,000 to $74,999 | 101 (12.5%) | 39 (8.4%) |
| $75,000 to $99,999 | 69 (8.5%) | 14 (3.0%) |
| $100,000 to $149,999 | 249 (30.7%) | 141 (30.4%) |
| $150,000 or more | 18 (2.2%) | 169 (36.4%) |
| Total | 810 (100.0%) | 464 (100.0%) |
Property Value to Household Income Ratio in Pearsall
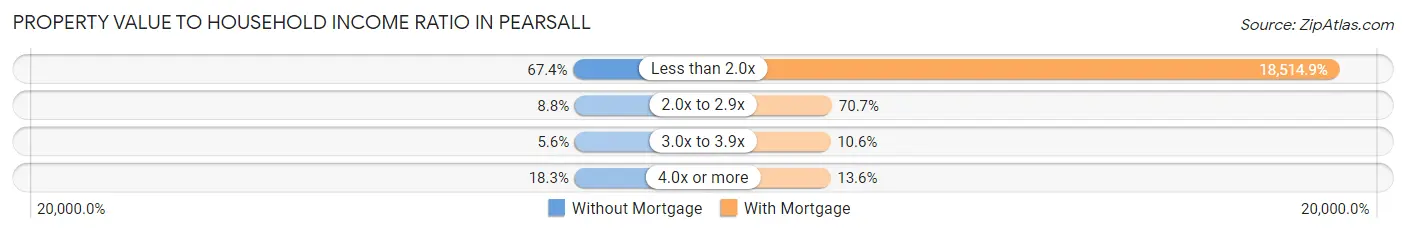
| Value-to-Income Ratio | Without Mortgage | With Mortgage |
| Less than 2.0x | 546 (67.4%) | 85,909 (18,514.9%) |
| 2.0x to 2.9x | 71 (8.8%) | 328 (70.7%) |
| 3.0x to 3.9x | 45 (5.6%) | 49 (10.6%) |
| 4.0x or more | 148 (18.3%) | 63 (13.6%) |
| Total | 810 (100.0%) | 464 (100.0%) |
Real Estate Taxes by Mortgage Status in Pearsall
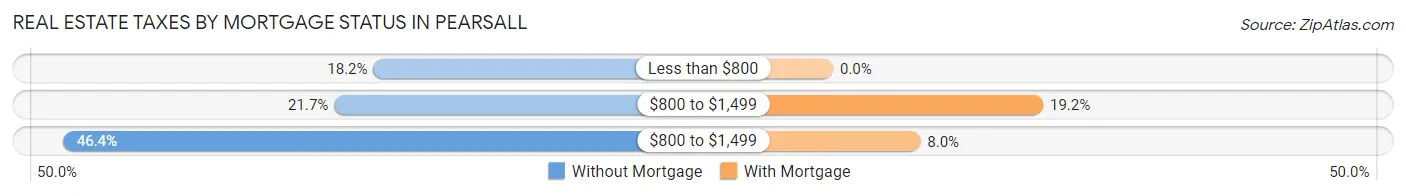
| Property Taxes | Without Mortgage | With Mortgage |
| Less than $800 | 147 (18.1%) | 0 (0.0%) |
| $800 to $1,499 | 176 (21.7%) | 89 (19.2%) |
| $800 to $1,499 | 376 (46.4%) | 37 (8.0%) |
| Total | 810 (100.0%) | 464 (100.0%) |
Health & Disability in Pearsall
Health Insurance Coverage by Age in Pearsall
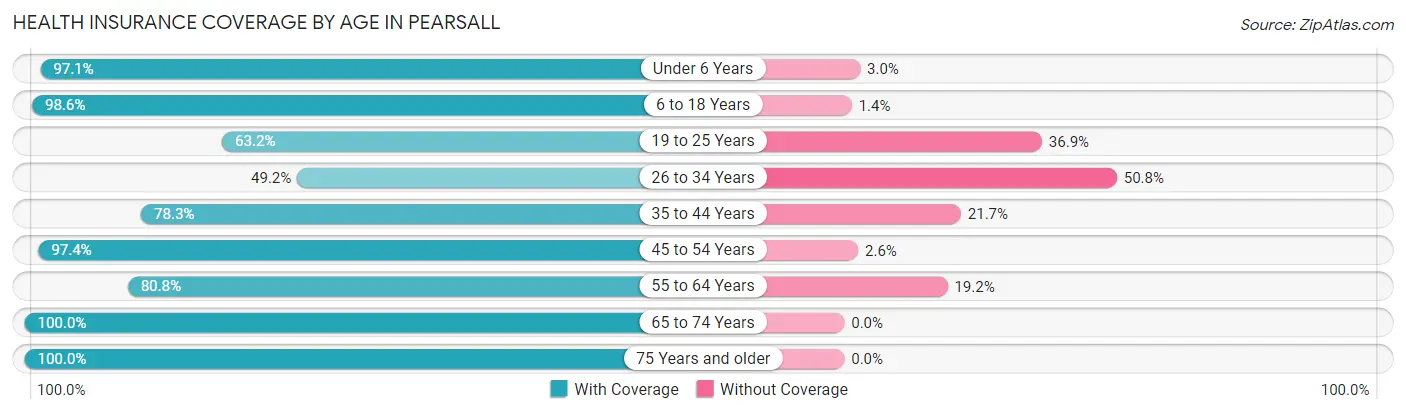
| Age Bracket | With Coverage | Without Coverage |
| Under 6 Years | 626 (97.1%) | 19 (2.9%) |
| 6 to 18 Years | 1,988 (98.6%) | 28 (1.4%) |
| 19 to 25 Years | 461 (63.1%) | 269 (36.8%) |
| 26 to 34 Years | 540 (49.2%) | 558 (50.8%) |
| 35 to 44 Years | 601 (78.3%) | 167 (21.7%) |
| 45 to 54 Years | 642 (97.4%) | 17 (2.6%) |
| 55 to 64 Years | 554 (80.8%) | 132 (19.2%) |
| 65 to 74 Years | 698 (100.0%) | 0 (0.0%) |
| 75 Years and older | 216 (100.0%) | 0 (0.0%) |
| Total | 6,326 (84.2%) | 1,190 (15.8%) |
Health Insurance Coverage by Citizenship Status in Pearsall
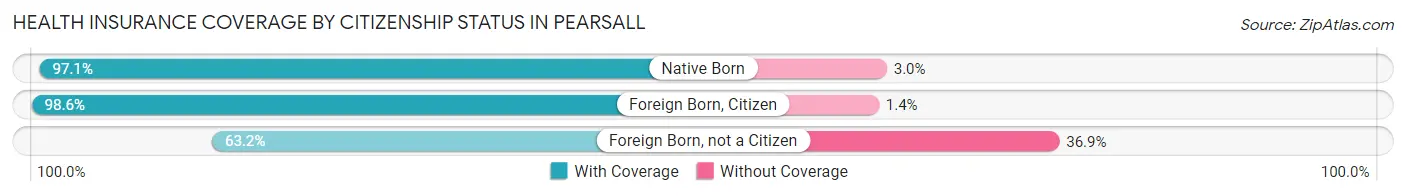
| Citizenship Status | With Coverage | Without Coverage |
| Native Born | 626 (97.1%) | 19 (2.9%) |
| Foreign Born, Citizen | 1,988 (98.6%) | 28 (1.4%) |
| Foreign Born, not a Citizen | 461 (63.1%) | 269 (36.8%) |
Health Insurance Coverage by Household Income in Pearsall
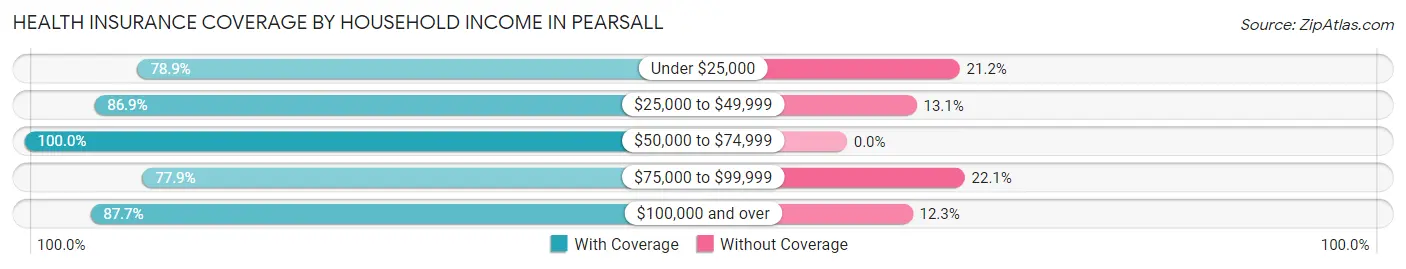
| Household Income | With Coverage | Without Coverage |
| Under $25,000 | 1,592 (78.8%) | 427 (21.1%) |
| $25,000 to $49,999 | 1,224 (86.9%) | 184 (13.1%) |
| $50,000 to $74,999 | 622 (100.0%) | 0 (0.0%) |
| $75,000 to $99,999 | 1,218 (77.9%) | 345 (22.1%) |
| $100,000 and over | 1,666 (87.7%) | 234 (12.3%) |
Public vs Private Health Insurance Coverage by Age in Pearsall
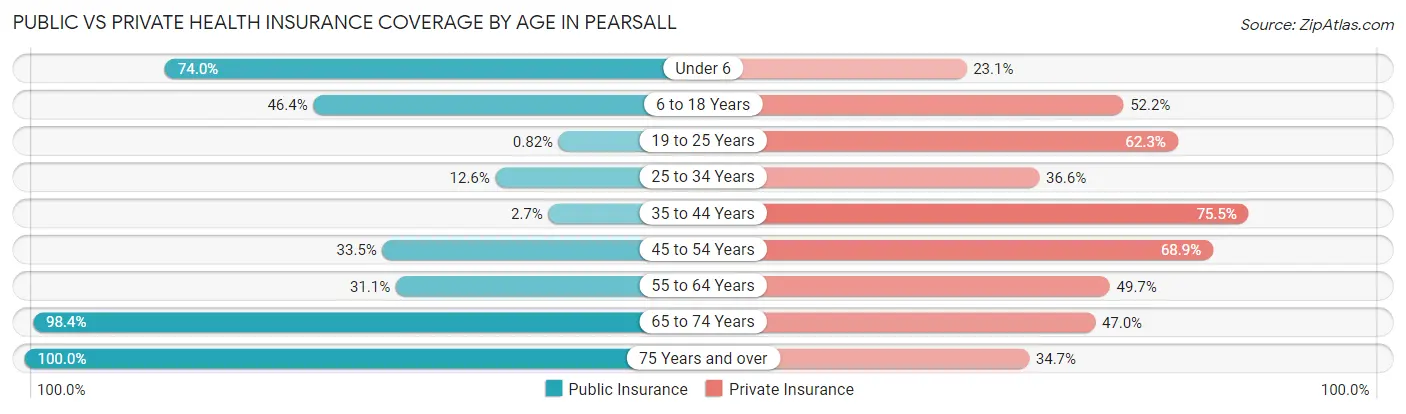
| Age Bracket | Public Insurance | Private Insurance |
| Under 6 | 477 (74.0%) | 149 (23.1%) |
| 6 to 18 Years | 935 (46.4%) | 1,053 (52.2%) |
| 19 to 25 Years | 6 (0.8%) | 455 (62.3%) |
| 25 to 34 Years | 138 (12.6%) | 402 (36.6%) |
| 35 to 44 Years | 21 (2.7%) | 580 (75.5%) |
| 45 to 54 Years | 221 (33.5%) | 454 (68.9%) |
| 55 to 64 Years | 213 (31.0%) | 341 (49.7%) |
| 65 to 74 Years | 687 (98.4%) | 328 (47.0%) |
| 75 Years and over | 216 (100.0%) | 75 (34.7%) |
| Total | 2,914 (38.8%) | 3,837 (51.0%) |
Disability Status by Sex by Age in Pearsall
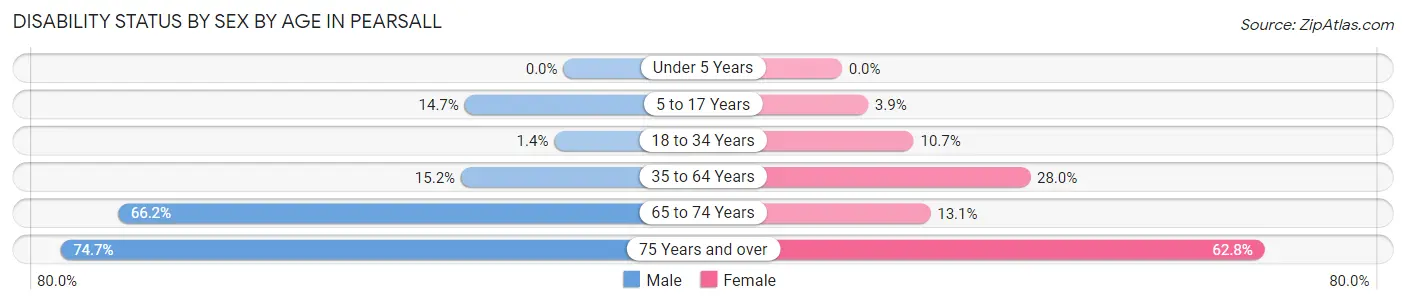
| Age Bracket | Male | Female |
| Under 5 Years | 0 (0.0%) | 0 (0.0%) |
| 5 to 17 Years | 139 (14.7%) | 23 (3.9%) |
| 18 to 34 Years | 19 (1.3%) | 98 (10.7%) |
| 35 to 64 Years | 151 (15.2%) | 313 (28.0%) |
| 65 to 74 Years | 215 (66.1%) | 49 (13.1%) |
| 75 Years and over | 65 (74.7%) | 81 (62.8%) |
Disability Class by Sex by Age in Pearsall
Disability Class: Hearing Difficulty
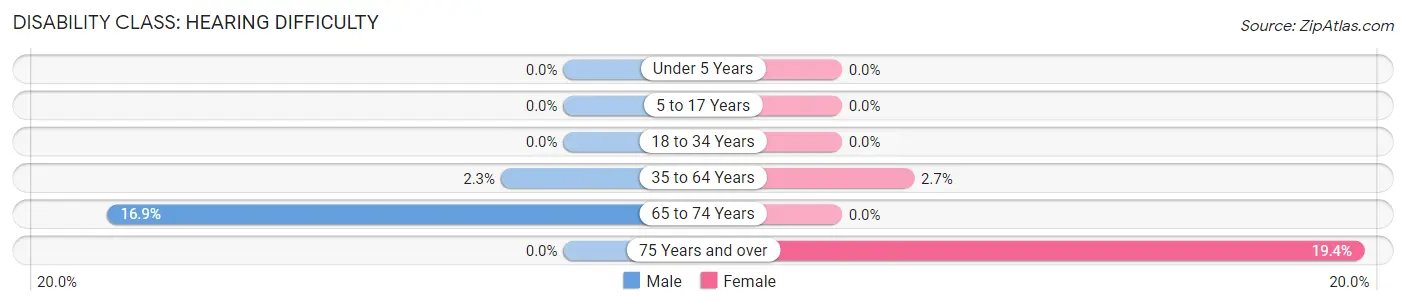
| Age Bracket | Male | Female |
| Under 5 Years | 0 (0.0%) | 0 (0.0%) |
| 5 to 17 Years | 0 (0.0%) | 0 (0.0%) |
| 18 to 34 Years | 0 (0.0%) | 0 (0.0%) |
| 35 to 64 Years | 23 (2.3%) | 30 (2.7%) |
| 65 to 74 Years | 55 (16.9%) | 0 (0.0%) |
| 75 Years and over | 0 (0.0%) | 25 (19.4%) |
Disability Class: Vision Difficulty
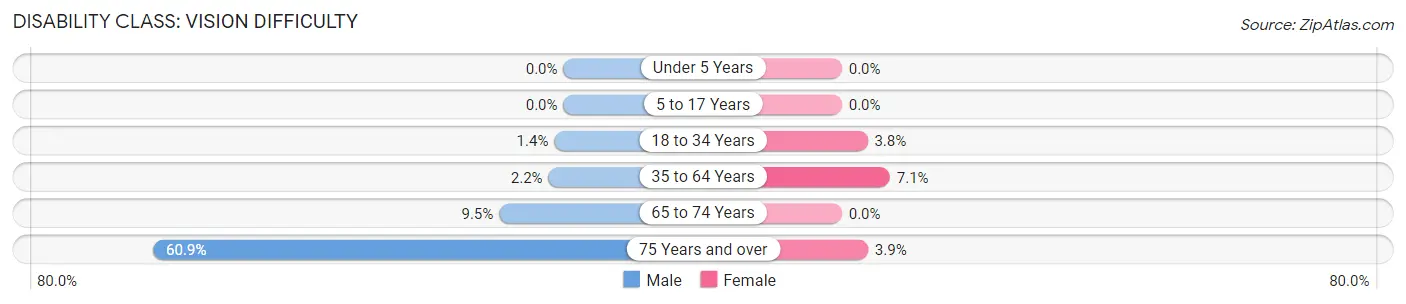
| Age Bracket | Male | Female |
| Under 5 Years | 0 (0.0%) | 0 (0.0%) |
| 5 to 17 Years | 0 (0.0%) | 0 (0.0%) |
| 18 to 34 Years | 19 (1.3%) | 35 (3.8%) |
| 35 to 64 Years | 22 (2.2%) | 80 (7.1%) |
| 65 to 74 Years | 31 (9.5%) | 0 (0.0%) |
| 75 Years and over | 53 (60.9%) | 5 (3.9%) |
Disability Class: Cognitive Difficulty
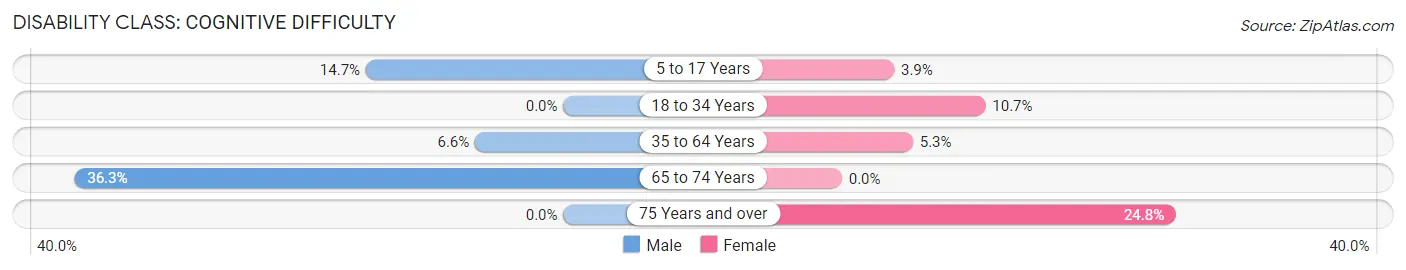
| Age Bracket | Male | Female |
| 5 to 17 Years | 139 (14.7%) | 23 (3.9%) |
| 18 to 34 Years | 0 (0.0%) | 98 (10.7%) |
| 35 to 64 Years | 65 (6.6%) | 59 (5.3%) |
| 65 to 74 Years | 118 (36.3%) | 0 (0.0%) |
| 75 Years and over | 0 (0.0%) | 32 (24.8%) |
Disability Class: Ambulatory Difficulty
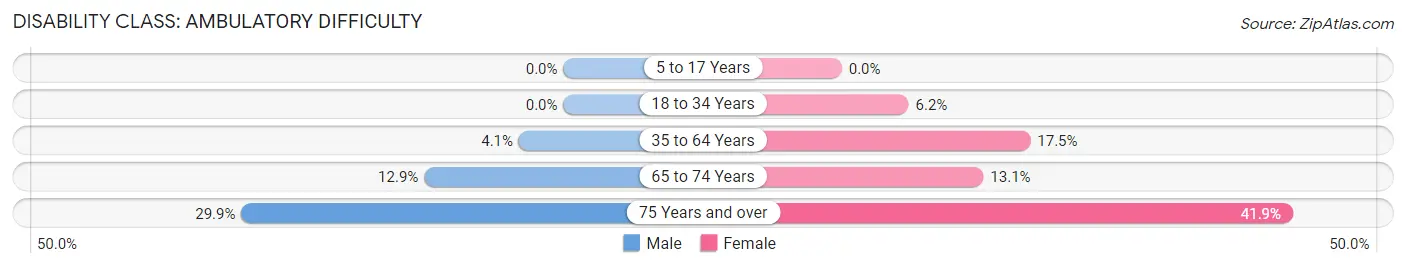
| Age Bracket | Male | Female |
| 5 to 17 Years | 0 (0.0%) | 0 (0.0%) |
| 18 to 34 Years | 0 (0.0%) | 57 (6.2%) |
| 35 to 64 Years | 41 (4.1%) | 196 (17.5%) |
| 65 to 74 Years | 42 (12.9%) | 49 (13.1%) |
| 75 Years and over | 26 (29.9%) | 54 (41.9%) |
Disability Class: Self-Care Difficulty
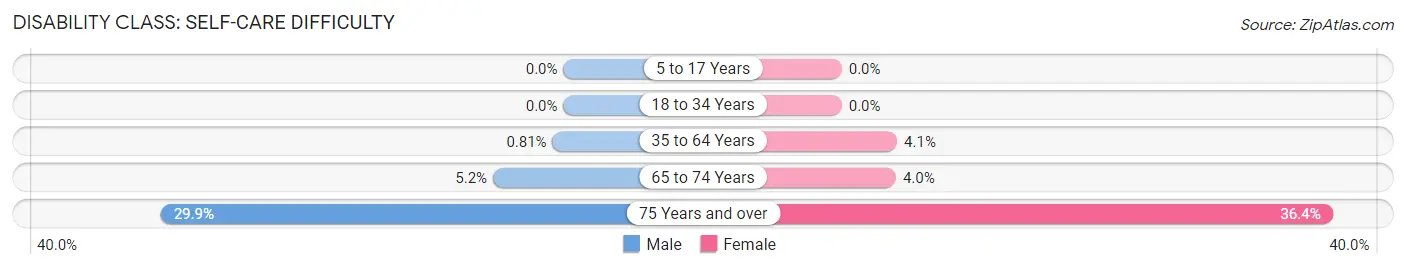
| Age Bracket | Male | Female |
| 5 to 17 Years | 0 (0.0%) | 0 (0.0%) |
| 18 to 34 Years | 0 (0.0%) | 0 (0.0%) |
| 35 to 64 Years | 8 (0.8%) | 46 (4.1%) |
| 65 to 74 Years | 17 (5.2%) | 15 (4.0%) |
| 75 Years and over | 26 (29.9%) | 47 (36.4%) |
Technology Access in Pearsall
Computing Device Access in Pearsall
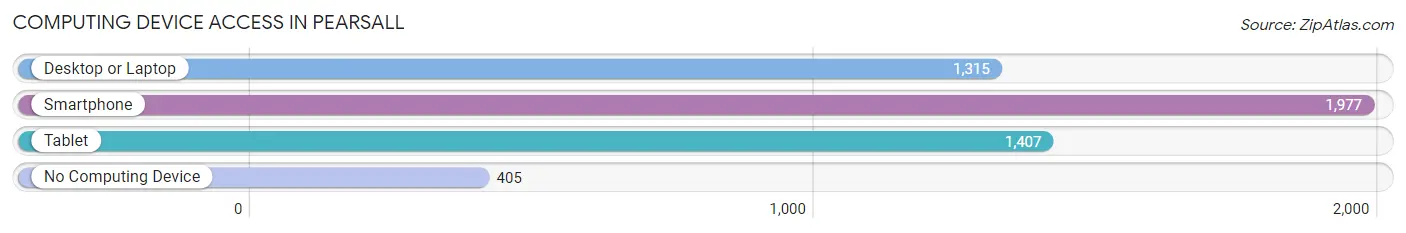
| Device Type | # Households | % Households |
| Desktop or Laptop | 1,315 | 54.5% |
| Smartphone | 1,977 | 81.9% |
| Tablet | 1,407 | 58.3% |
| No Computing Device | 405 | 16.8% |
| Total | 2,413 | 100.0% |
Internet Access in Pearsall
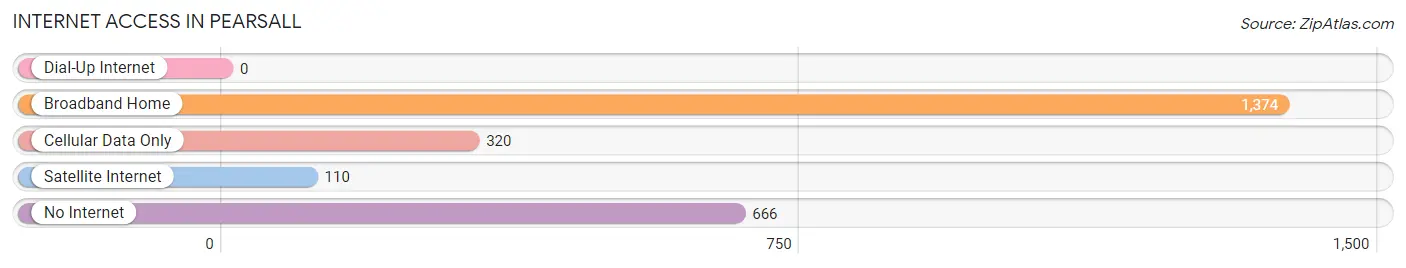
| Internet Type | # Households | % Households |
| Dial-Up Internet | 0 | 0.0% |
| Broadband Home | 1,374 | 56.9% |
| Cellular Data Only | 320 | 13.3% |
| Satellite Internet | 110 | 4.6% |
| No Internet | 666 | 27.6% |
| Total | 2,413 | 100.0% |
Pearsall Summary
Pearsall is a city located in Frio County, Texas, United States. The population was 11,508 at the 2010 census. It is the county seat of Frio County. Pearsall is located at the intersection of Interstate 35 and U.S. Highway 83, approximately 80 miles (130 km) southwest of San Antonio and 150 miles (240 km) northwest of Corpus Christi.
History
Pearsall was founded in 1876 by Edward Burleson Pearsall, a former Confederate soldier and rancher. The town was named after him and was incorporated in 1882. The town was a stop on the San Antonio and Aransas Pass Railway, which was completed in 1887. The railroad brought new settlers to the area and helped the town to grow.
In the early 1900s, Pearsall was a major center for the production of wool and mohair. The town was also home to several large ranches, including the King Ranch, which was founded in 1853.
In the 1920s, Pearsall was a major center for oil production. The town was also home to several large cotton gins.
In the 1950s, Pearsall was a major center for the production of cotton and grain. The town was also home to several large ranches, including the King Ranch, which was founded in 1853.
Geography
Pearsall is located at 28°53′N 99°5′W (28.88, -99.08). According to the United States Census Bureau, the city has a total area of 8.2 square miles (21.2 km2), all of it land.
Economy
The economy of Pearsall is largely based on agriculture and oil production. The town is home to several large ranches, including the King Ranch, which was founded in 1853. The town is also home to several large cotton gins and grain elevators.
The town is also home to several manufacturing companies, including a plastics plant, a metal fabrication plant, and a food processing plant.
Demographics
As of the census of 2010, there were 11,508 people, 3,845 households, and 2,717 families residing in the city. The population density was 1,406.2 people per square mile (541.7/km2). There were 4,093 housing units at an average density of 498.3 per square mile (192.3/km2). The racial makeup of the city was 73.2% White, 0.9% African American, 0.7% Native American, 0.3% Asian, 0.1% Pacific Islander, 22.3% from other races, and 2.5% from two or more races. Hispanic or Latino of any race were 79.2% of the population.
There were 3,845 households, out of which 37.2% had children under the age of 18 living with them, 48.2% were married couples living together, 17.7% had a female householder with no husband present, and 27.2% were non-families. 22.7% of all households were made up of individuals, and 10.2% had someone living alone who was 65 years of age or older. The average household size was 2.93 and the average family size was 3.45.
In the city, the population was spread out, with 30.2% under the age of 18, 9.7% from 18 to 24, 25.7% from 25 to 44, 20.7% from 45 to 64, and 13.7% who were 65 years of age or older. The median age was 33 years. For every 100 females, there were 92.2 males. For every 100 females age 18 and over, there were 87.7 males.
The median income for a household in the city was $25,938, and the median income for a family was $30,938. Males had a median income of $25,938 versus $19,938 for females. The per capita income for the city was $12,938. About 22.7% of families and 25.7% of the population were below the poverty line, including 33.7% of those under age 18 and 20.7% of those age 65 or over.
Common Questions
What is Per Capita Income in Pearsall?
Per Capita income in Pearsall is $19,519.
What is the Median Family Income in Pearsall?
Median Family Income in Pearsall is $46,795.
What is the Median Household income in Pearsall?
Median Household Income in Pearsall is $41,761.
What is Income or Wage Gap in Pearsall?
Income or Wage Gap in Pearsall is 33.3%.
Women in Pearsall earn 66.7 cents for every dollar earned by a man.
What is Family Income Deficit in Pearsall?
Family Income Deficit in Pearsall is $11,073.
Families that are below poverty line in Pearsall earn $11,073 less on average than the poverty threshold level.
What is Inequality or Gini Index in Pearsall?
Inequality or Gini Index in Pearsall is 0.49.
What is the Total Population of Pearsall?
Total Population of Pearsall is 8,870.
What is the Total Male Population of Pearsall?
Total Male Population of Pearsall is 5,177.
What is the Total Female Population of Pearsall?
Total Female Population of Pearsall is 3,693.
What is the Ratio of Males per 100 Females in Pearsall?
There are 140.18 Males per 100 Females in Pearsall.
What is the Ratio of Females per 100 Males in Pearsall?
There are 71.33 Females per 100 Males in Pearsall.
What is the Median Population Age in Pearsall?
Median Population Age in Pearsall is 30.6 Years.
What is the Average Family Size in Pearsall
Average Family Size in Pearsall is 3.8 People.
What is the Average Household Size in Pearsall
Average Household Size in Pearsall is 3.1 People.
How Large is the Labor Force in Pearsall?
There are 3,306 People in the Labor Forcein in Pearsall.
What is the Percentage of People in the Labor Force in Pearsall?
46.8% of People are in the Labor Force in Pearsall.
What is the Unemployment Rate in Pearsall?
Unemployment Rate in Pearsall is 4.5%.