Zip Codes with the Highest Percentage of Immigrants from Guatemala in Gatesville, TX
RELATED REPORTS & OPTIONS
Guatemala
Gatesville
Compare Zip Codes
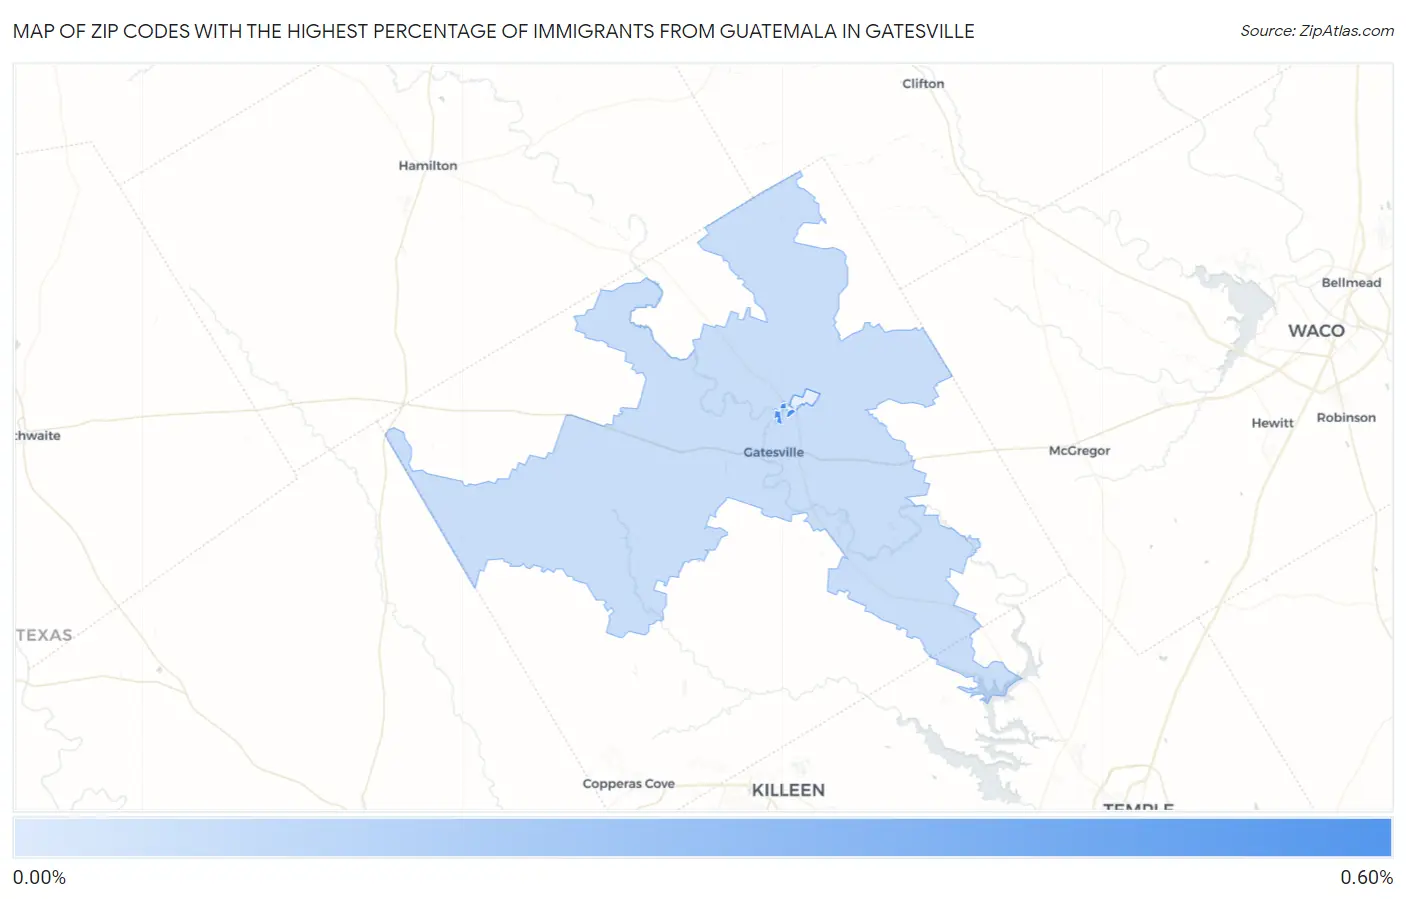
Map of Zip Codes with the Highest Percentage of Immigrants from Guatemala in Gatesville
0.078%
0.57%
Zip Codes with the Highest Percentage of Immigrants from Guatemala in Gatesville, TX
| Zip Code | Guatemala | vs State | vs National | |
| 1. | 76599 | 0.57% | 0.30%(+0.268)#-1 | 0.32%(+0.249)#0 |
| 2. | 76528 | 0.078% | 0.30%(-0.221)#131 | 0.32%(-0.240)#3,095 |
1
Common Questions
What are the Top 3 Zip Codes with the Highest Percentage of Immigrants from Guatemala in Gatesville, TX?
Top 3 Zip Codes with the Highest Percentage of Immigrants from Guatemala in Gatesville, TX are:
What zip code has the Highest Percentage of Immigrants from Guatemala in Gatesville, TX?
76599 has the Highest Percentage of Immigrants from Guatemala in Gatesville, TX with 0.57%.
What is the Percentage of Immigrants from Guatemala in Gatesville, TX?
Percentage of Immigrants from Guatemala in Gatesville is 0.16%.
What is the Percentage of Immigrants from Guatemala in Texas?
Percentage of Immigrants from Guatemala in Texas is 0.30%.
What is the Percentage of Immigrants from Guatemala in the United States?
Percentage of Immigrants from Guatemala in the United States is 0.32%.