Ingleside on the Bay, TX Map & Demographics
Ingleside on the Bay Map
Ingleside on the Bay Overview
$39,162
PER CAPITA INCOME
$88,472
AVG FAMILY INCOME
$81,875
AVG HOUSEHOLD INCOME
0.35
INEQUALITY / GINI INDEX
776
TOTAL POPULATION
463
MALE POPULATION
313
FEMALE POPULATION
147.92
MALES / 100 FEMALES
67.60
FEMALES / 100 MALES
50.0
MEDIAN AGE
3.2
AVG FAMILY SIZE
2.9
AVG HOUSEHOLD SIZE
325
LABOR FORCE [ PEOPLE ]
48.4%
PERCENT IN LABOR FORCE
7.4%
UNEMPLOYMENT RATE
Income in Ingleside on the Bay
Income Overview in Ingleside on the Bay
Per Capita Income in Ingleside on the Bay is $39,162, while median incomes of families and households are $88,472 and $81,875 respectively.
| Characteristic | Number | Measure |
| Per Capita Income | 776 | $39,162 |
| Median Family Income | 213 | $88,472 |
| Mean Family Income | 213 | $107,528 |
| Median Household Income | 268 | $81,875 |
| Mean Household Income | 268 | $99,279 |
| Income Deficit | 213 | $0 |
| Wage / Income Gap (%) | 776 | 0.00% |
| Wage / Income Gap ($) | 776 | 100.00¢ per $1 |
| Gini / Inequality Index | 776 | 0.35 |
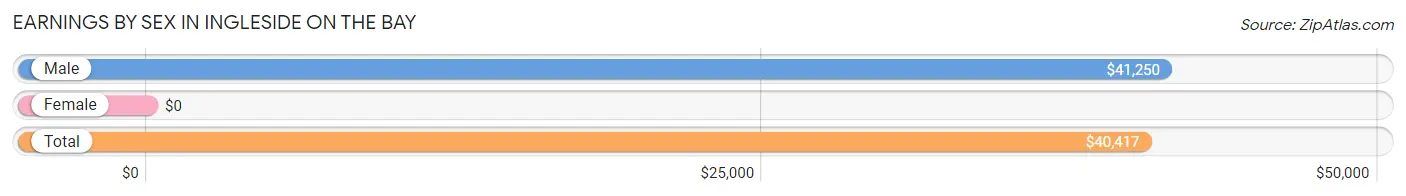
Earnings by Sex in Ingleside on the Bay
| Sex | Number | Average Earnings |
| Male | 191 (57.0%) | $41,250 |
| Female | 144 (43.0%) | $0 |
| Total | 335 (100.0%) | $40,417 |
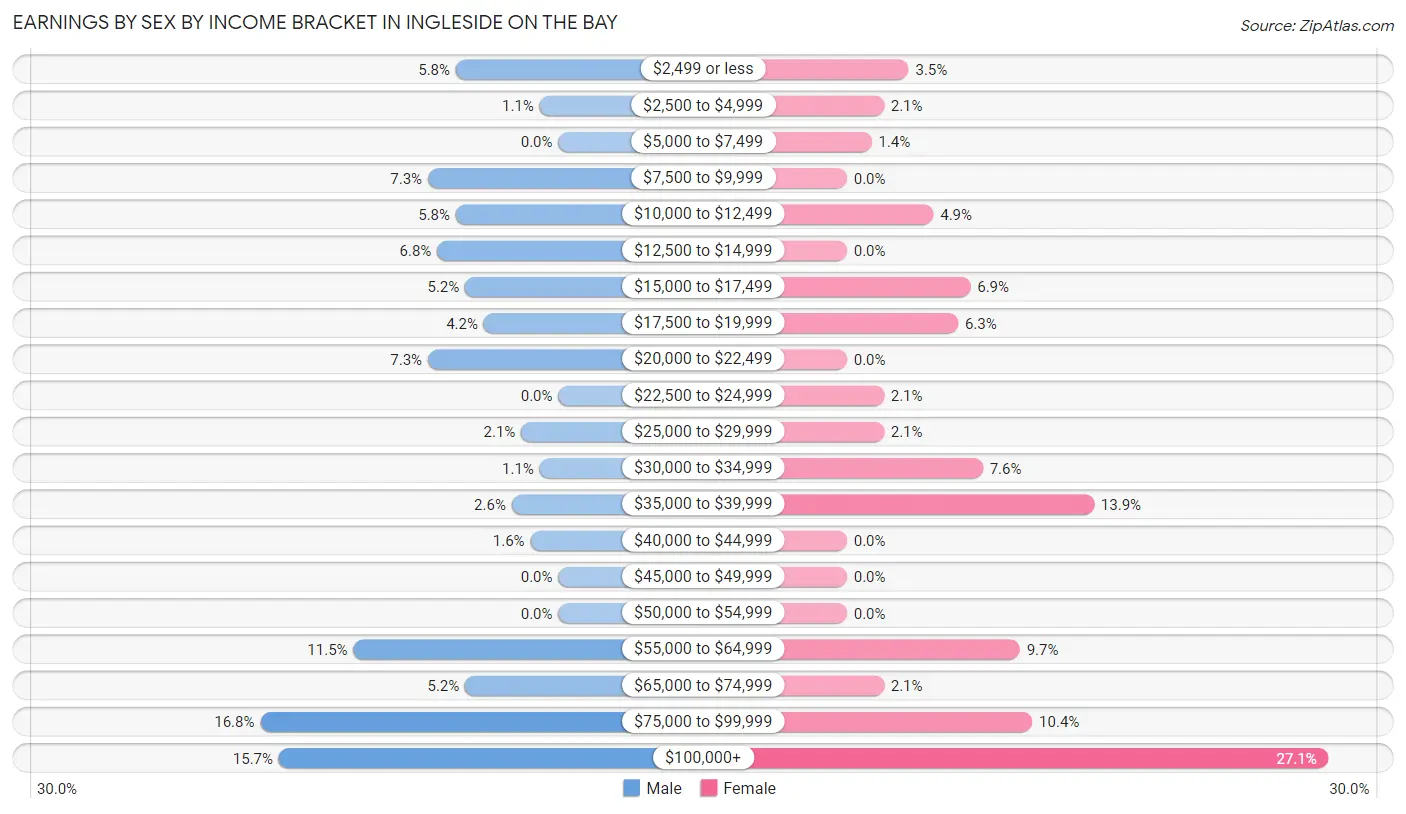
Earnings by Sex by Income Bracket in Ingleside on the Bay
The most common earnings brackets in Ingleside on the Bay are $75,000 to $99,999 for men (32 | 16.8%) and $100,000+ for women (39 | 27.1%).
| Income | Male | Female |
| $2,499 or less | 11 (5.8%) | 5 (3.5%) |
| $2,500 to $4,999 | 2 (1.1%) | 3 (2.1%) |
| $5,000 to $7,499 | 0 (0.0%) | 2 (1.4%) |
| $7,500 to $9,999 | 14 (7.3%) | 0 (0.0%) |
| $10,000 to $12,499 | 11 (5.8%) | 7 (4.9%) |
| $12,500 to $14,999 | 13 (6.8%) | 0 (0.0%) |
| $15,000 to $17,499 | 10 (5.2%) | 10 (6.9%) |
| $17,500 to $19,999 | 8 (4.2%) | 9 (6.2%) |
| $20,000 to $22,499 | 14 (7.3%) | 0 (0.0%) |
| $22,500 to $24,999 | 0 (0.0%) | 3 (2.1%) |
| $25,000 to $29,999 | 4 (2.1%) | 3 (2.1%) |
| $30,000 to $34,999 | 2 (1.1%) | 11 (7.6%) |
| $35,000 to $39,999 | 5 (2.6%) | 20 (13.9%) |
| $40,000 to $44,999 | 3 (1.6%) | 0 (0.0%) |
| $45,000 to $49,999 | 0 (0.0%) | 0 (0.0%) |
| $50,000 to $54,999 | 0 (0.0%) | 0 (0.0%) |
| $55,000 to $64,999 | 22 (11.5%) | 14 (9.7%) |
| $65,000 to $74,999 | 10 (5.2%) | 3 (2.1%) |
| $75,000 to $99,999 | 32 (16.8%) | 15 (10.4%) |
| $100,000+ | 30 (15.7%) | 39 (27.1%) |
| Total | 191 (100.0%) | 144 (100.0%) |
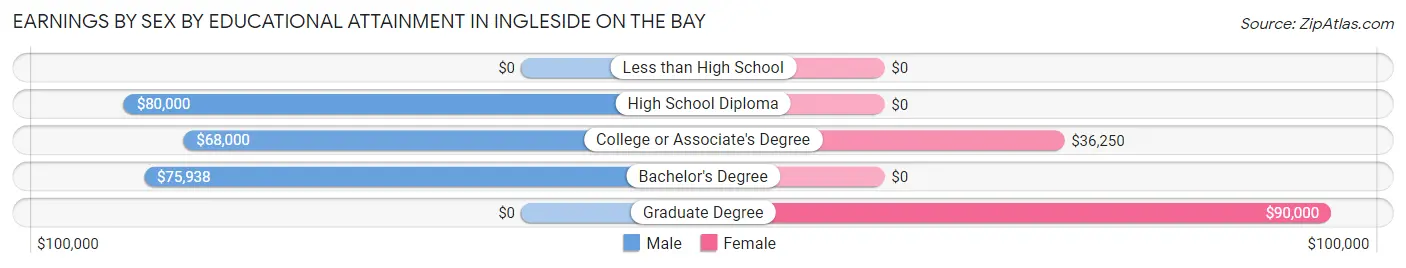
Earnings by Sex by Educational Attainment in Ingleside on the Bay
| Educational Attainment | Male Income | Female Income |
| Less than High School | - | - |
| High School Diploma | $80,000 | $0 |
| College or Associate's Degree | $68,000 | $36,250 |
| Bachelor's Degree | $75,938 | $0 |
| Graduate Degree | - | - |
| Total | $67,679 | $0 |
Family Income in Ingleside on the Bay
Family Income Brackets in Ingleside on the Bay
According to the Ingleside on the Bay family income data, there are 51 families falling into the $75,000 to $99,999 income range, which is the most common income bracket and makes up 23.9% of all families. Conversely, the $10,000 to $14,999 income bracket is the least frequent group with only 1 families (0.5%) belonging to this category.
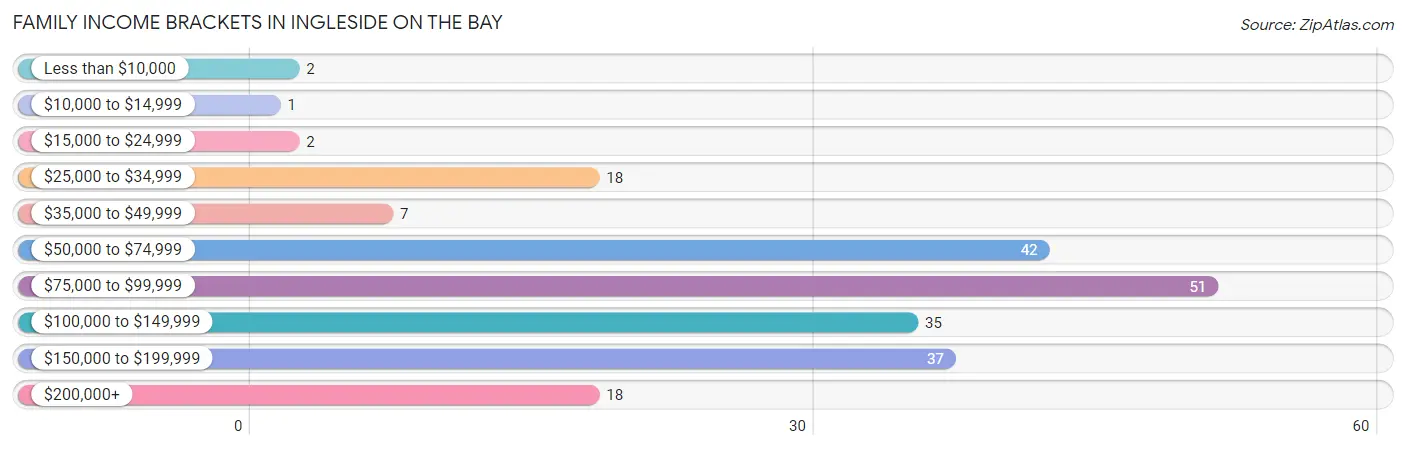
| Income Bracket | # Families | % Families |
| Less than $10,000 | 2 | 0.9% |
| $10,000 to $14,999 | 1 | 0.5% |
| $15,000 to $24,999 | 2 | 0.9% |
| $25,000 to $34,999 | 18 | 8.5% |
| $35,000 to $49,999 | 7 | 3.3% |
| $50,000 to $74,999 | 42 | 19.7% |
| $75,000 to $99,999 | 51 | 23.9% |
| $100,000 to $149,999 | 35 | 16.4% |
| $150,000 to $199,999 | 37 | 17.4% |
| $200,000+ | 18 | 8.5% |
Family Income by Famaliy Size in Ingleside on the Bay
4-person families (22 | 10.3%) account for the highest median family income in Ingleside on the Bay with $154,318 per family, while 2-person families (100 | 46.9%) have the highest median income of $39,375 per family member.
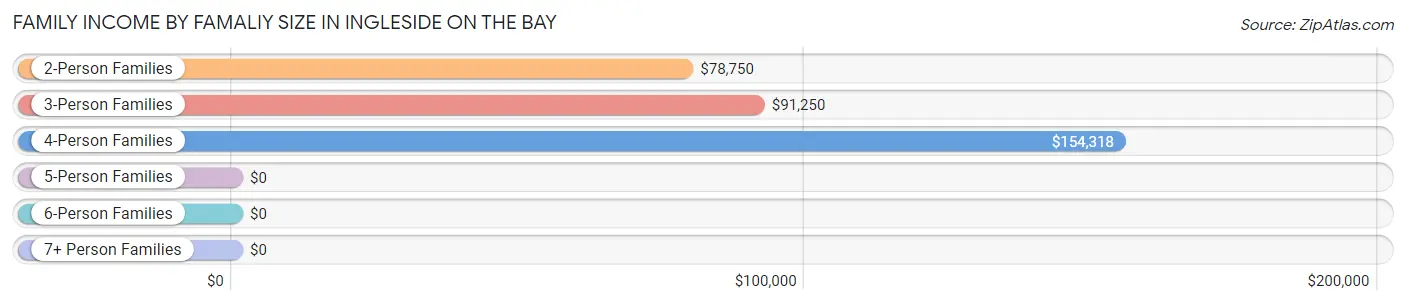
| Income Bracket | # Families | Median Income |
| 2-Person Families | 100 (46.9%) | $78,750 |
| 3-Person Families | 73 (34.3%) | $91,250 |
| 4-Person Families | 22 (10.3%) | $154,318 |
| 5-Person Families | 5 (2.4%) | $0 |
| 6-Person Families | 13 (6.1%) | $0 |
| 7+ Person Families | 0 (0.0%) | $0 |
| Total | 213 (100.0%) | $88,472 |
Family Income by Number of Earners in Ingleside on the Bay
The median family income in Ingleside on the Bay is $88,472, with families comprising 2 earners (59) having the highest median family income of $133,438, while families with no earners (72) have the lowest median family income of $71,250, accounting for 27.7% and 33.8% of families, respectively.
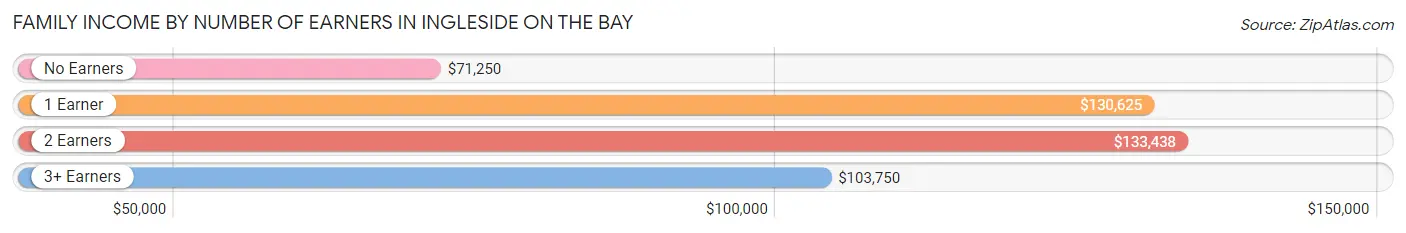
| Number of Earners | # Families | Median Income |
| No Earners | 72 (33.8%) | $71,250 |
| 1 Earner | 54 (25.4%) | $130,625 |
| 2 Earners | 59 (27.7%) | $133,438 |
| 3+ Earners | 28 (13.2%) | $103,750 |
| Total | 213 (100.0%) | $88,472 |
Household Income in Ingleside on the Bay
Household Income Brackets in Ingleside on the Bay
With 60 households falling in the category, the $50,000 to $74,999 income range is the most frequent in Ingleside on the Bay, accounting for 22.4% of all households. In contrast, only 5 households (1.9%) fall into the $10,000 to $14,999 income bracket, making it the least populous group.
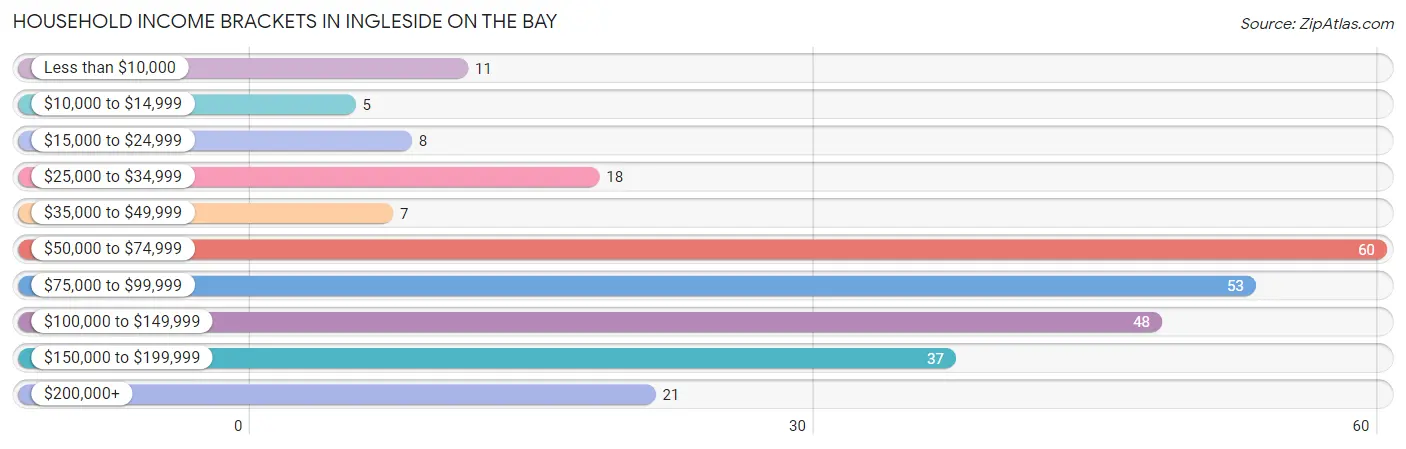
| Income Bracket | # Households | % Households |
| Less than $10,000 | 11 | 4.1% |
| $10,000 to $14,999 | 5 | 1.9% |
| $15,000 to $24,999 | 8 | 3.0% |
| $25,000 to $34,999 | 18 | 6.7% |
| $35,000 to $49,999 | 7 | 2.6% |
| $50,000 to $74,999 | 60 | 22.4% |
| $75,000 to $99,999 | 53 | 19.8% |
| $100,000 to $149,999 | 48 | 17.9% |
| $150,000 to $199,999 | 37 | 13.8% |
| $200,000+ | 21 | 7.8% |
Household Income by Householder Age in Ingleside on the Bay
The median household income in Ingleside on the Bay is $81,875, with the highest median household income of $120,250 found in the 45 to 64 years age bracket for the primary householder. A total of 101 households (37.7%) fall into this category.
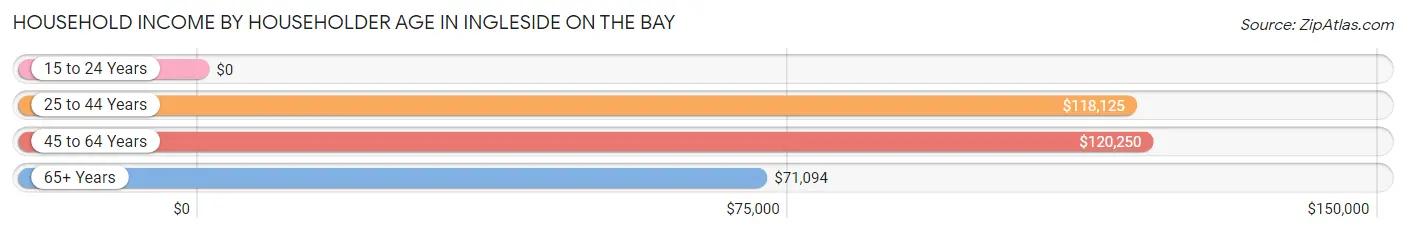
| Income Bracket | # Households | Median Income |
| 15 to 24 Years | 0 (0.0%) | $0 |
| 25 to 44 Years | 46 (17.2%) | $118,125 |
| 45 to 64 Years | 101 (37.7%) | $120,250 |
| 65+ Years | 121 (45.2%) | $71,094 |
| Total | 268 (100.0%) | $81,875 |
Poverty in Ingleside on the Bay
Income Below Poverty by Sex and Age in Ingleside on the Bay
With 2.4% poverty level for males and 8.6% for females among the residents of Ingleside on the Bay, 35 to 44 year old males and 65 to 74 year old females are the most vulnerable to poverty, with 4 males (8.2%) and 9 females (20.4%) in their respective age groups living below the poverty level.
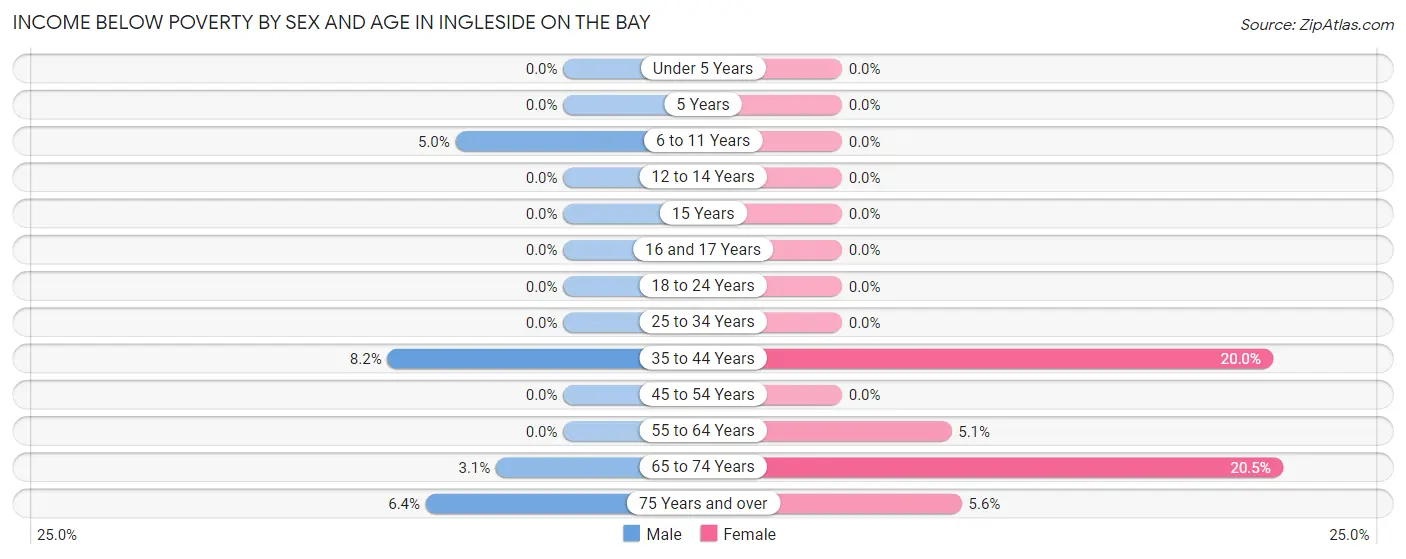
| Age Bracket | Male | Female |
| Under 5 Years | 0 (0.0%) | 0 (0.0%) |
| 5 Years | 0 (0.0%) | 0 (0.0%) |
| 6 to 11 Years | 2 (5.0%) | 0 (0.0%) |
| 12 to 14 Years | 0 (0.0%) | 0 (0.0%) |
| 15 Years | 0 (0.0%) | 0 (0.0%) |
| 16 and 17 Years | 0 (0.0%) | 0 (0.0%) |
| 18 to 24 Years | 0 (0.0%) | 0 (0.0%) |
| 25 to 34 Years | 0 (0.0%) | 0 (0.0%) |
| 35 to 44 Years | 4 (8.2%) | 13 (20.0%) |
| 45 to 54 Years | 0 (0.0%) | 0 (0.0%) |
| 55 to 64 Years | 0 (0.0%) | 3 (5.1%) |
| 65 to 74 Years | 2 (3.1%) | 9 (20.4%) |
| 75 Years and over | 3 (6.4%) | 2 (5.6%) |
| Total | 11 (2.4%) | 27 (8.6%) |
Income Above Poverty by Sex and Age in Ingleside on the Bay
According to the poverty statistics in Ingleside on the Bay, males aged under 5 years and females aged 6 to 11 years are the age groups that are most secure financially, with 100.0% of males and 100.0% of females in these age groups living above the poverty line.
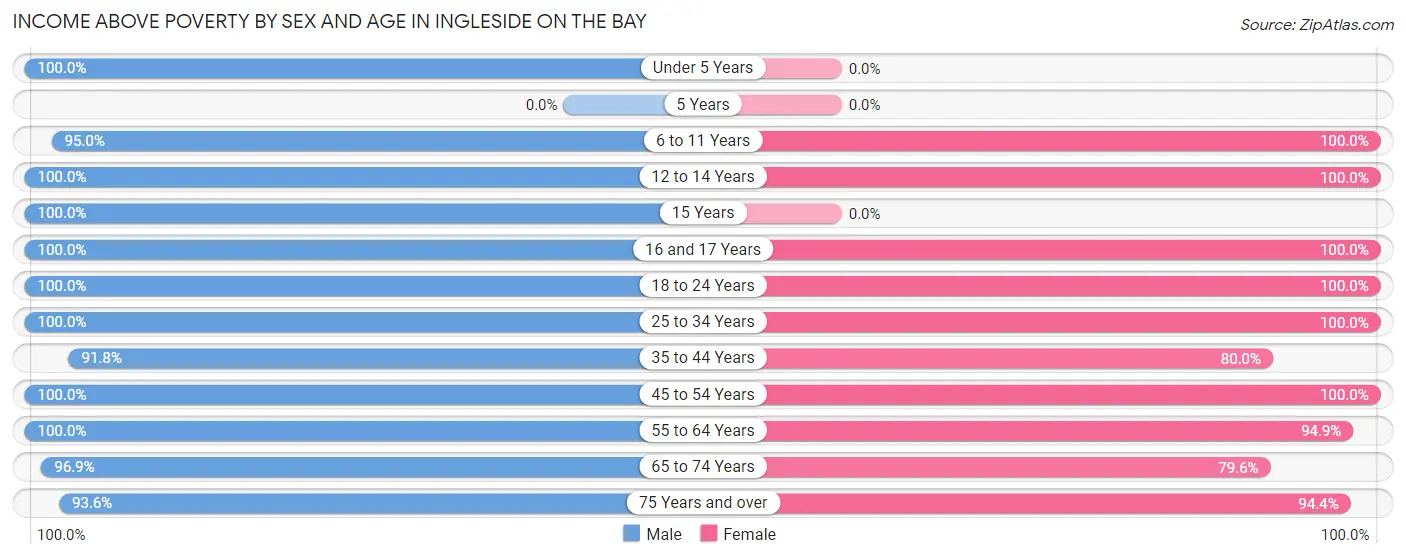
| Age Bracket | Male | Female |
| Under 5 Years | 2 (100.0%) | 0 (0.0%) |
| 5 Years | 0 (0.0%) | 0 (0.0%) |
| 6 to 11 Years | 38 (95.0%) | 6 (100.0%) |
| 12 to 14 Years | 24 (100.0%) | 15 (100.0%) |
| 15 Years | 16 (100.0%) | 0 (0.0%) |
| 16 and 17 Years | 38 (100.0%) | 9 (100.0%) |
| 18 to 24 Years | 50 (100.0%) | 3 (100.0%) |
| 25 to 34 Years | 14 (100.0%) | 13 (100.0%) |
| 35 to 44 Years | 45 (91.8%) | 52 (80.0%) |
| 45 to 54 Years | 41 (100.0%) | 63 (100.0%) |
| 55 to 64 Years | 76 (100.0%) | 56 (94.9%) |
| 65 to 74 Years | 62 (96.9%) | 35 (79.5%) |
| 75 Years and over | 44 (93.6%) | 34 (94.4%) |
| Total | 450 (97.6%) | 286 (91.4%) |
Income Below Poverty Among Married-Couple Families in Ingleside on the Bay
The poverty statistics for married-couple families in Ingleside on the Bay show that 1.1% or 2 of the total 188 families live below the poverty line. Families with no children have the highest poverty rate of 1.7%, comprising of 2 families. On the other hand, families with 1 or 2 children have the lowest poverty rate of 0.0%, which includes 0 families.
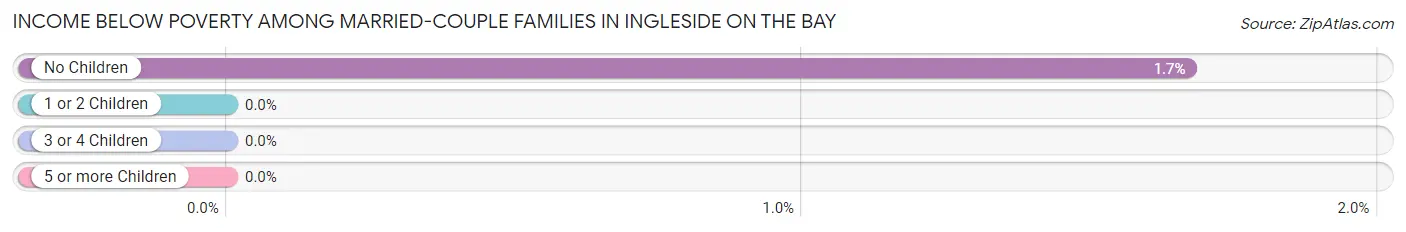
| Children | Above Poverty | Below Poverty |
| No Children | 118 (98.3%) | 2 (1.7%) |
| 1 or 2 Children | 63 (100.0%) | 0 (0.0%) |
| 3 or 4 Children | 5 (100.0%) | 0 (0.0%) |
| 5 or more Children | 0 (0.0%) | 0 (0.0%) |
| Total | 186 (98.9%) | 2 (1.1%) |
Income Below Poverty Among Single-Parent Households in Ingleside on the Bay
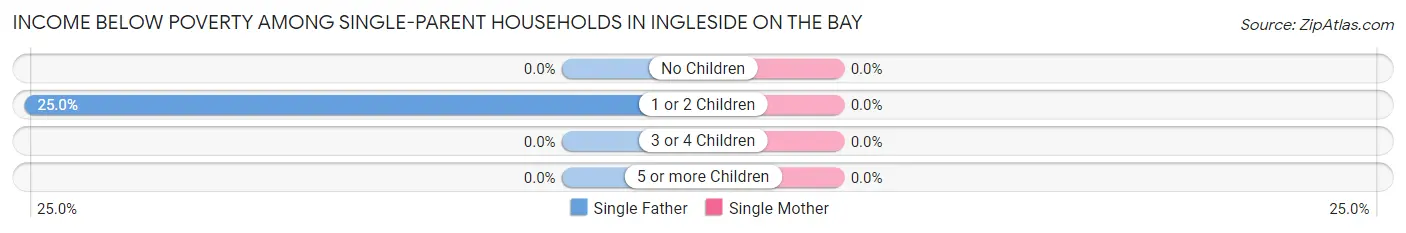
| Children | Single Father | Single Mother |
| No Children | 0 (0.0%) | 0 (0.0%) |
| 1 or 2 Children | 1 (25.0%) | 0 (0.0%) |
| 3 or 4 Children | 0 (0.0%) | 0 (0.0%) |
| 5 or more Children | 0 (0.0%) | 0 (0.0%) |
| Total | 1 (9.1%) | 0 (0.0%) |
Income Below Poverty Among Married-Couple vs Single-Parent Households in Ingleside on the Bay
The poverty data for Ingleside on the Bay shows that 2 of the married-couple family households (1.1%) and 1 of the single-parent households (4.0%) are living below the poverty level. Within the married-couple family households, those with no children have the highest poverty rate, with 2 households (1.7%) falling below the poverty line. Among the single-parent households, those with 1 or 2 children have the highest poverty rate, with 1 household (25.0%) living below poverty.
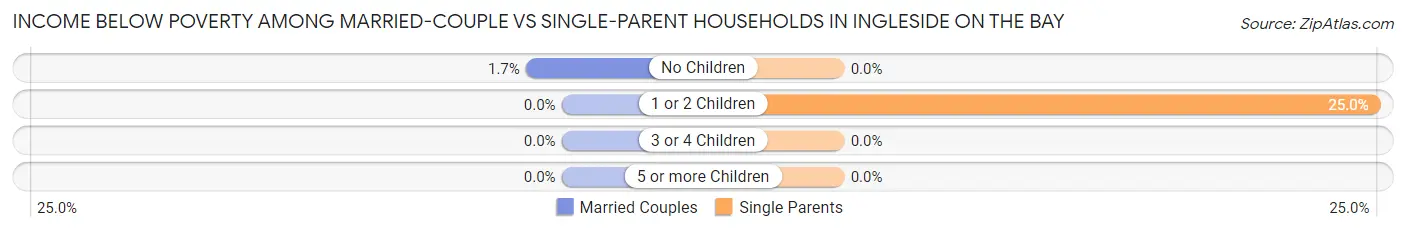
| Children | Married-Couple Families | Single-Parent Households |
| No Children | 2 (1.7%) | 0 (0.0%) |
| 1 or 2 Children | 0 (0.0%) | 1 (25.0%) |
| 3 or 4 Children | 0 (0.0%) | 0 (0.0%) |
| 5 or more Children | 0 (0.0%) | 0 (0.0%) |
| Total | 2 (1.1%) | 1 (4.0%) |
Race in Ingleside on the Bay
The most populous races in Ingleside on the Bay are White / Caucasian (631 | 81.3%), Hispanic or Latino (248 | 32.0%), and Two or more Races (144 | 18.6%).
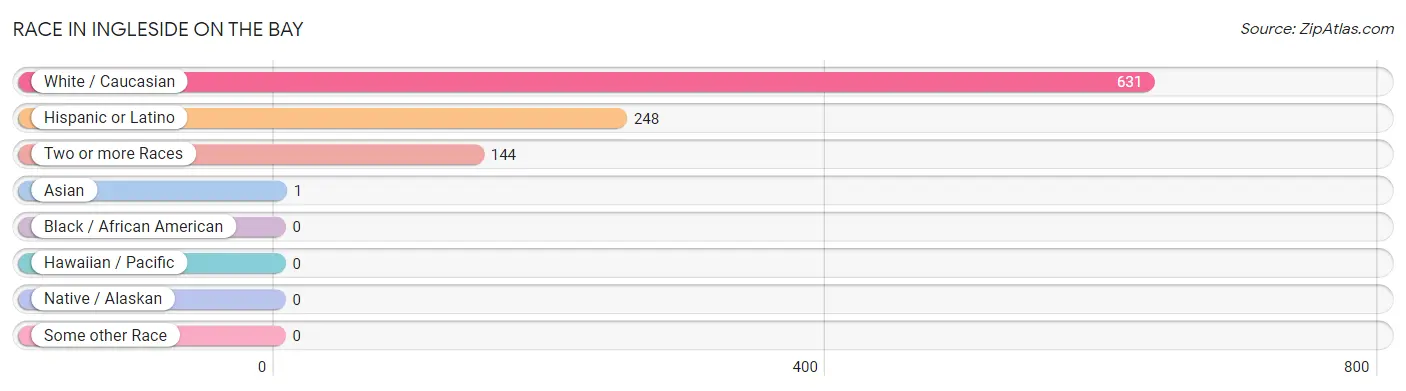
| Race | # Population | % Population |
| Asian | 1 | 0.1% |
| Black / African American | 0 | 0.0% |
| Hawaiian / Pacific | 0 | 0.0% |
| Hispanic or Latino | 248 | 32.0% |
| Native / Alaskan | 0 | 0.0% |
| White / Caucasian | 631 | 81.3% |
| Two or more Races | 144 | 18.6% |
| Some other Race | 0 | 0.0% |
| Total | 776 | 100.0% |
Ancestry in Ingleside on the Bay
The most populous ancestries reported in Ingleside on the Bay are Mexican (166 | 21.4%), German (105 | 13.5%), English (103 | 13.3%), Irish (79 | 10.2%), and Scotch-Irish (36 | 4.6%), together accounting for 63.0% of all Ingleside on the Bay residents.
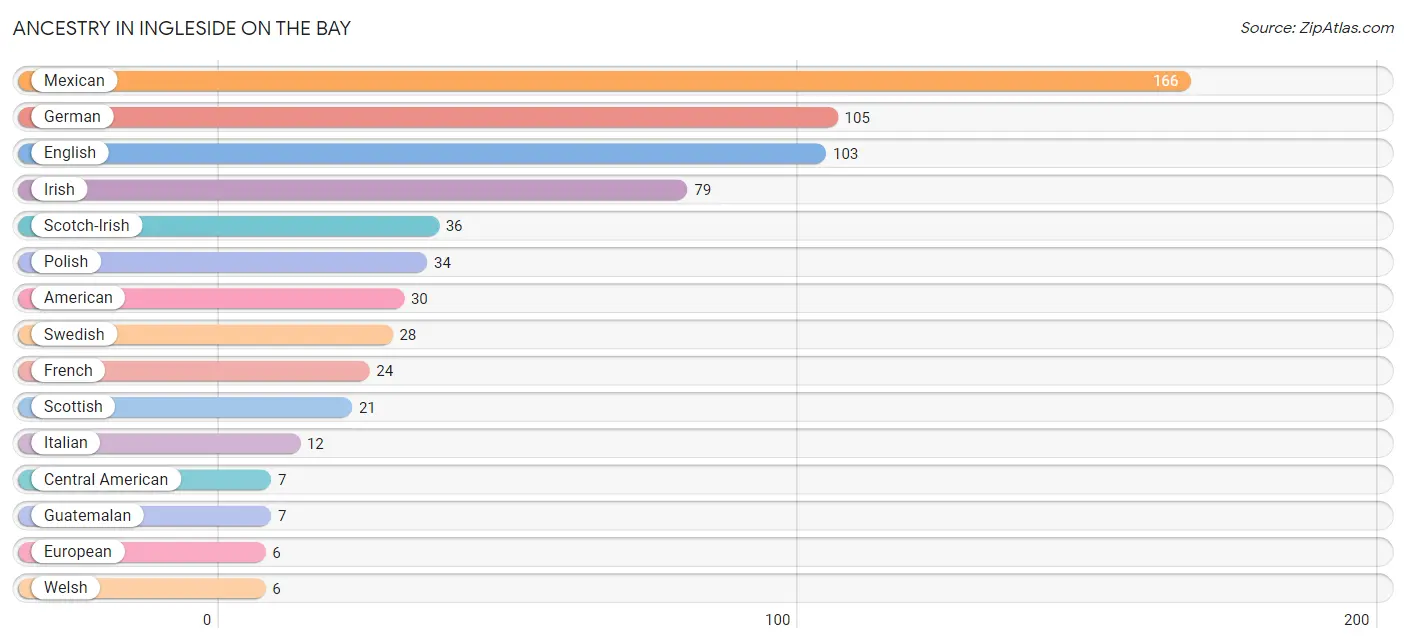
| Ancestry | # Population | % Population |
| American | 30 | 3.9% |
| Arab | 3 | 0.4% |
| British | 1 | 0.1% |
| Canadian | 2 | 0.3% |
| Central American | 7 | 0.9% |
| Dutch | 3 | 0.4% |
| English | 103 | 13.3% |
| European | 6 | 0.8% |
| French | 24 | 3.1% |
| German | 105 | 13.5% |
| Greek | 2 | 0.3% |
| Guatemalan | 7 | 0.9% |
| Indian (Asian) | 1 | 0.1% |
| Irish | 79 | 10.2% |
| Italian | 12 | 1.5% |
| Mexican | 166 | 21.4% |
| Moroccan | 3 | 0.4% |
| Norwegian | 2 | 0.3% |
| Polish | 34 | 4.4% |
| Russian | 3 | 0.4% |
| Scotch-Irish | 36 | 4.6% |
| Scottish | 21 | 2.7% |
| Slavic | 2 | 0.3% |
| Swedish | 28 | 3.6% |
| Swiss | 2 | 0.3% |
| Welsh | 6 | 0.8% | View All 26 Rows |
Immigrants in Ingleside on the Bay
The most numerous immigrant groups reported in Ingleside on the Bay came from Latin America (23 | 3.0%), Colombia (16 | 2.1%), South America (16 | 2.1%), Central America (7 | 0.9%), and Guatemala (7 | 0.9%), together accounting for 8.9% of all Ingleside on the Bay residents.
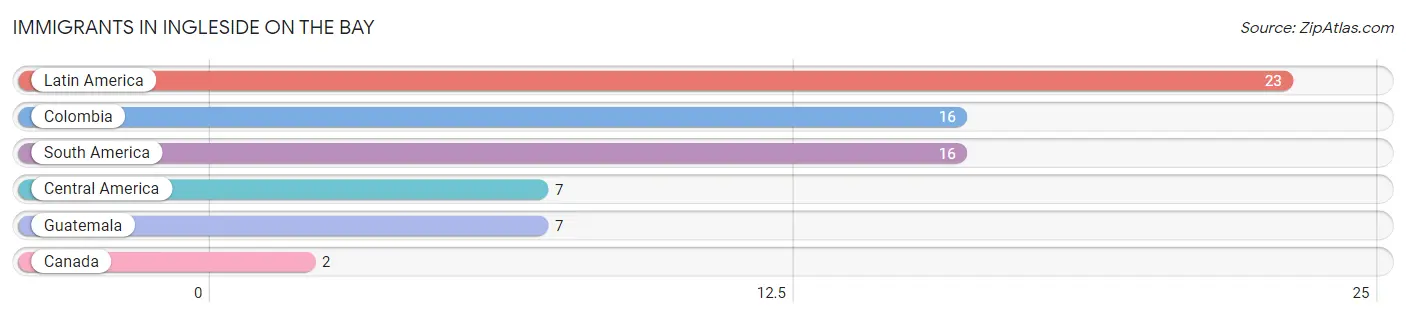
| Immigration Origin | # Population | % Population |
| Canada | 2 | 0.3% |
| Central America | 7 | 0.9% |
| Colombia | 16 | 2.1% |
| Guatemala | 7 | 0.9% |
| Latin America | 23 | 3.0% |
| South America | 16 | 2.1% | View All 6 Rows |
Sex and Age in Ingleside on the Bay
Sex and Age in Ingleside on the Bay
The most populous age groups in Ingleside on the Bay are 10 to 14 Years (55 | 11.9%) for men and 60 to 64 Years (43 | 13.7%) for women.
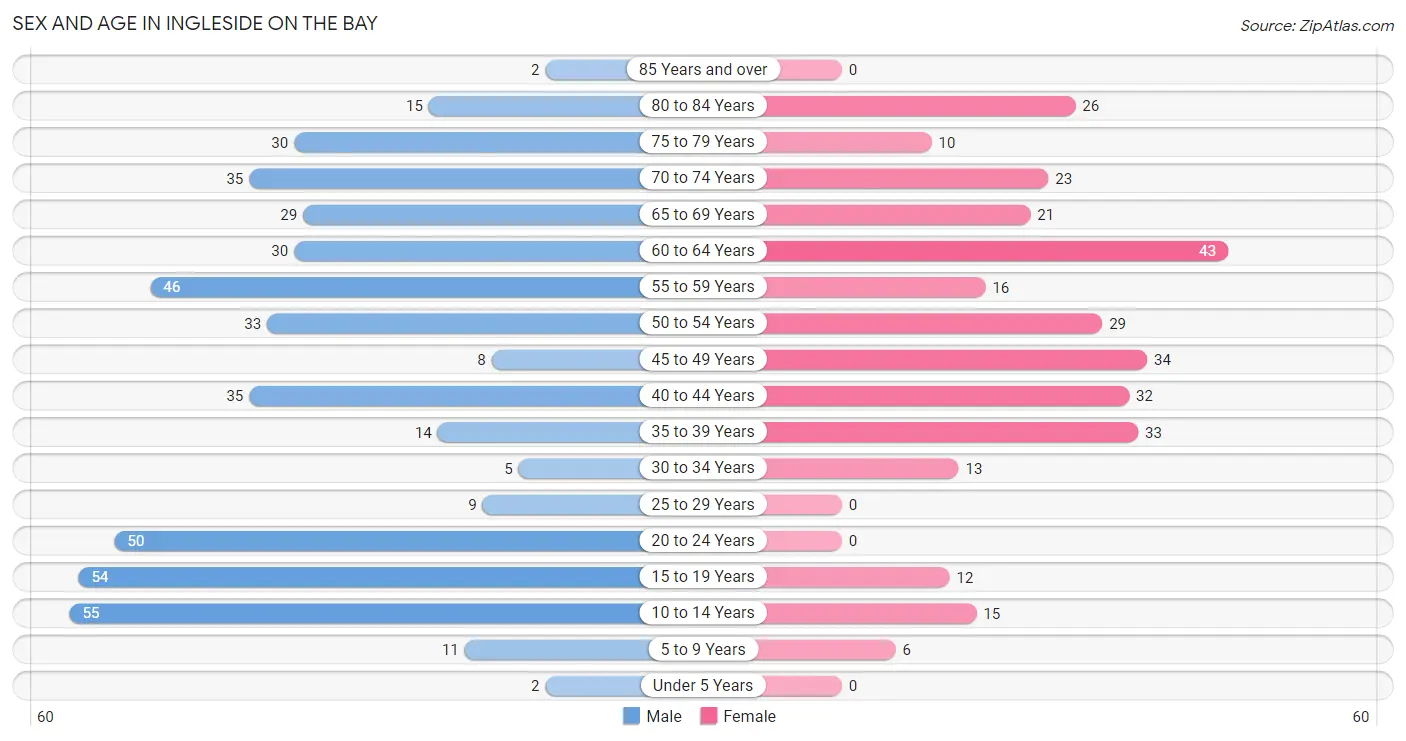
| Age Bracket | Male | Female |
| Under 5 Years | 2 (0.4%) | 0 (0.0%) |
| 5 to 9 Years | 11 (2.4%) | 6 (1.9%) |
| 10 to 14 Years | 55 (11.9%) | 15 (4.8%) |
| 15 to 19 Years | 54 (11.7%) | 12 (3.8%) |
| 20 to 24 Years | 50 (10.8%) | 0 (0.0%) |
| 25 to 29 Years | 9 (1.9%) | 0 (0.0%) |
| 30 to 34 Years | 5 (1.1%) | 13 (4.2%) |
| 35 to 39 Years | 14 (3.0%) | 33 (10.5%) |
| 40 to 44 Years | 35 (7.6%) | 32 (10.2%) |
| 45 to 49 Years | 8 (1.7%) | 34 (10.9%) |
| 50 to 54 Years | 33 (7.1%) | 29 (9.3%) |
| 55 to 59 Years | 46 (9.9%) | 16 (5.1%) |
| 60 to 64 Years | 30 (6.5%) | 43 (13.7%) |
| 65 to 69 Years | 29 (6.3%) | 21 (6.7%) |
| 70 to 74 Years | 35 (7.6%) | 23 (7.3%) |
| 75 to 79 Years | 30 (6.5%) | 10 (3.2%) |
| 80 to 84 Years | 15 (3.2%) | 26 (8.3%) |
| 85 Years and over | 2 (0.4%) | 0 (0.0%) |
| Total | 463 (100.0%) | 313 (100.0%) |
Families and Households in Ingleside on the Bay
Median Family Size in Ingleside on the Bay
The median family size in Ingleside on the Bay is 3.23 persons per family, with single male/father families (11 | 5.2%) accounting for the largest median family size of 5.91 persons per family. On the other hand, married-couple families (188 | 88.3%) represent the smallest median family size with 2.91 persons per family.
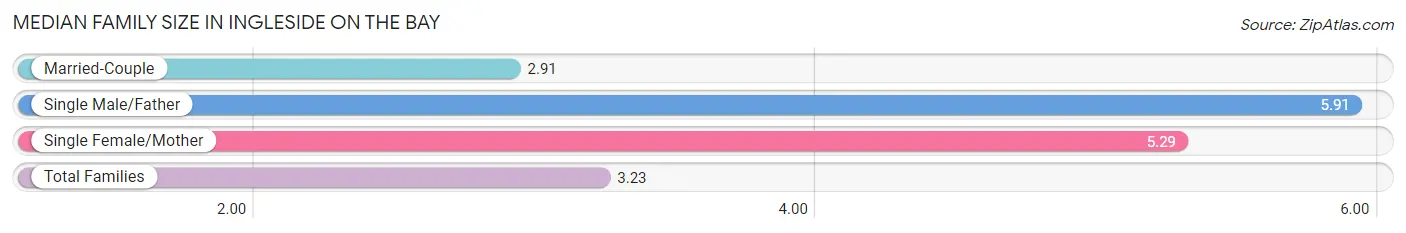
| Family Type | # Families | Family Size |
| Married-Couple | 188 (88.3%) | 2.91 |
| Single Male/Father | 11 (5.2%) | 5.91 |
| Single Female/Mother | 14 (6.6%) | 5.29 |
| Total Families | 213 (100.0%) | 3.23 |
Median Household Size in Ingleside on the Bay
The median household size in Ingleside on the Bay is 2.90 persons per household, with single female/mother households (14 | 5.2%) accounting for the largest median household size of 6.21 persons per household. non-family households (55 | 20.5%) represent the smallest median household size with 1.33 persons per household.
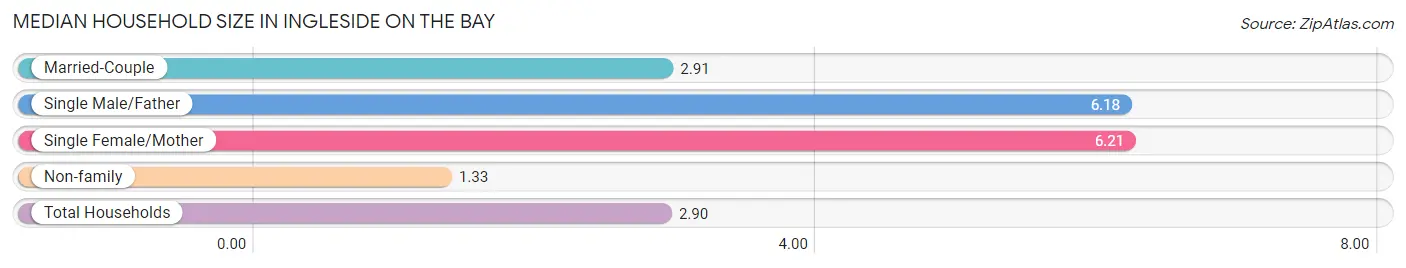
| Household Type | # Households | Household Size |
| Married-Couple | 188 (70.2%) | 2.91 |
| Single Male/Father | 11 (4.1%) | 6.18 |
| Single Female/Mother | 14 (5.2%) | 6.21 |
| Non-family | 55 (20.5%) | 1.33 |
| Total Households | 268 (100.0%) | 2.90 |
Household Size by Marriage Status in Ingleside on the Bay
Out of a total of 268 households in Ingleside on the Bay, 213 (79.5%) are family households, while 55 (20.5%) are nonfamily households. The most numerous type of family households are 2-person households, comprising 100, and the most common type of nonfamily households are 1-person households, comprising 40.
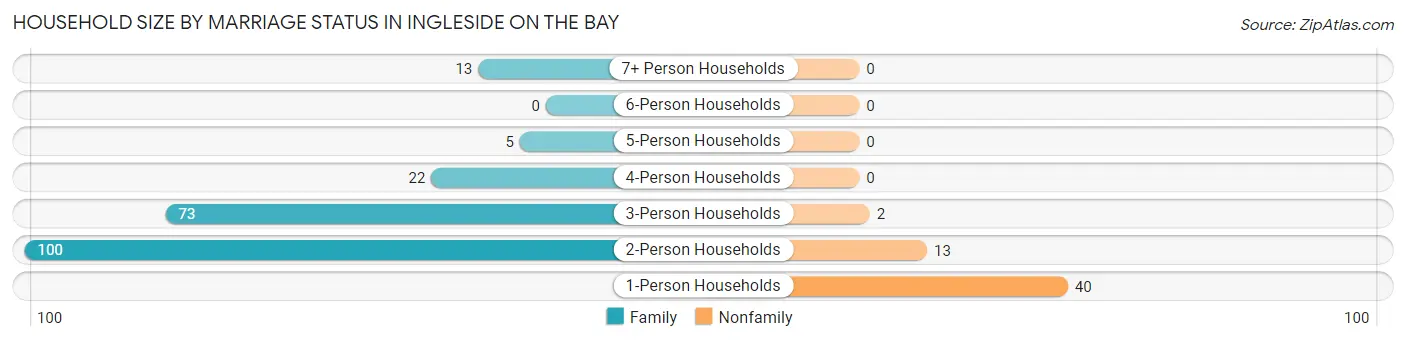
| Household Size | Family Households | Nonfamily Households |
| 1-Person Households | - | 40 (14.9%) |
| 2-Person Households | 100 (37.3%) | 13 (4.9%) |
| 3-Person Households | 73 (27.2%) | 2 (0.7%) |
| 4-Person Households | 22 (8.2%) | 0 (0.0%) |
| 5-Person Households | 5 (1.9%) | 0 (0.0%) |
| 6-Person Households | 0 (0.0%) | 0 (0.0%) |
| 7+ Person Households | 13 (4.9%) | 0 (0.0%) |
| Total | 213 (79.5%) | 55 (20.5%) |
Female Fertility in Ingleside on the Bay
Fertility by Age in Ingleside on the Bay
| Age Bracket | Women with Births | Births / 1,000 Women |
| 15 to 19 years | 0 (0.0%) | 0.0 |
| 20 to 34 years | 0 (0.0%) | 0.0 |
| 35 to 50 years | 0 (0.0%) | 0.0 |
| Total | 0 (0.0%) | 0.0 |
Fertility by Age by Marriage Status in Ingleside on the Bay
| Age Bracket | Married | Unmarried |
| 15 to 19 years | 0 (0.0%) | 0 (0.0%) |
| 20 to 34 years | 0 (0.0%) | 0 (0.0%) |
| 35 to 50 years | 0 (0.0%) | 0 (0.0%) |
| Total | 0 (0.0%) | 0 (0.0%) |
Fertility by Education in Ingleside on the Bay
| Educational Attainment | Women with Births | Births / 1,000 Women |
| Less than High School | 0 (0.0%) | 0.0 |
| High School Diploma | 0 (0.0%) | 0.0 |
| College or Associate's Degree | 0 (0.0%) | 0.0 |
| Bachelor's Degree | 0 (0.0%) | 0.0 |
| Graduate Degree | 0 (0.0%) | 0.0 |
| Total | 0 (0.0%) | 0.0 |
Fertility by Education by Marriage Status in Ingleside on the Bay
| Educational Attainment | Married | Unmarried |
| Less than High School | 0 (0.0%) | 0 (0.0%) |
| High School Diploma | 0 (0.0%) | 0 (0.0%) |
| College or Associate's Degree | 0 (0.0%) | 0 (0.0%) |
| Bachelor's Degree | 0 (0.0%) | 0 (0.0%) |
| Graduate Degree | 0 (0.0%) | 0 (0.0%) |
| Total | 0 (0.0%) | 0 (0.0%) |
Employment Characteristics in Ingleside on the Bay
Employment by Class of Employer in Ingleside on the Bay
Among the 294 employed individuals in Ingleside on the Bay, private company employees (236 | 80.3%), local government employees (13 | 4.4%), and not-for-profit organizations (12 | 4.1%) make up the most common classes of employment.
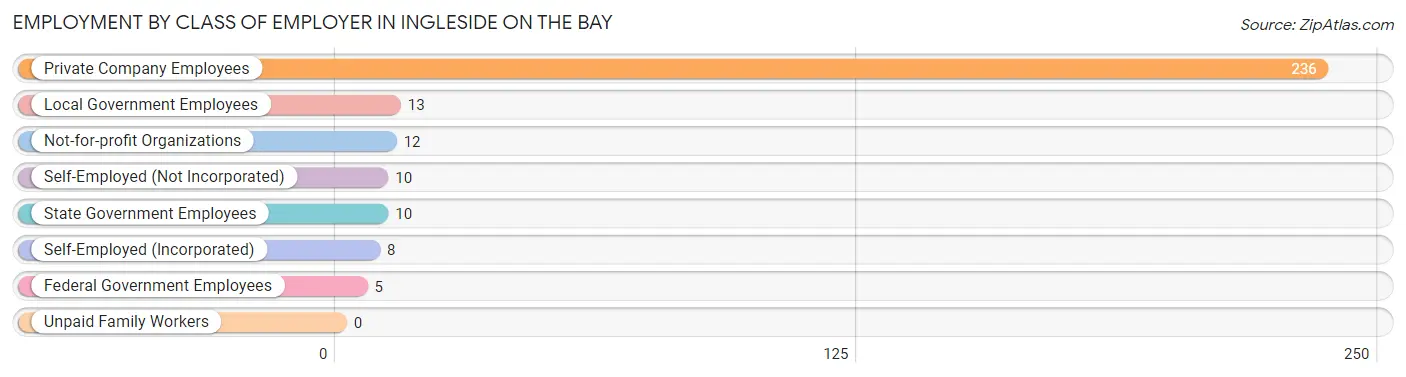
| Employer Class | # Employees | % Employees |
| Private Company Employees | 236 | 80.3% |
| Self-Employed (Incorporated) | 8 | 2.7% |
| Self-Employed (Not Incorporated) | 10 | 3.4% |
| Not-for-profit Organizations | 12 | 4.1% |
| Local Government Employees | 13 | 4.4% |
| State Government Employees | 10 | 3.4% |
| Federal Government Employees | 5 | 1.7% |
| Unpaid Family Workers | 0 | 0.0% |
| Total | 294 | 100.0% |
Employment Status by Age in Ingleside on the Bay
According to the labor force statistics for Ingleside on the Bay, out of the total population over 16 years of age (671), 48.4% or 325 individuals are in the labor force, with 7.4% or 24 of them unemployed. The age group with the highest labor force participation rate is 20 to 24 years, with 100.0% or 50 individuals in the labor force. Within the labor force, the 25 to 29 years age range has the highest percentage of unemployed individuals, with 100.0% or 5 of them being unemployed.
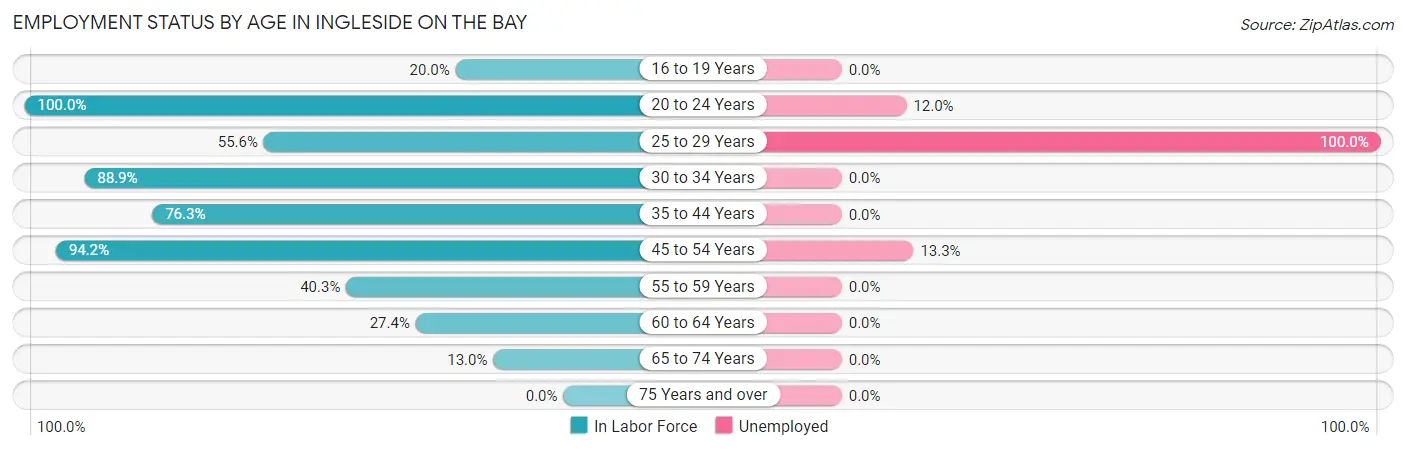
| Age Bracket | In Labor Force | Unemployed |
| 16 to 19 Years | 10 (20.0%) | 0 (0.0%) |
| 20 to 24 Years | 50 (100.0%) | 6 (12.0%) |
| 25 to 29 Years | 5 (55.6%) | 5 (100.0%) |
| 30 to 34 Years | 16 (88.9%) | 0 (0.0%) |
| 35 to 44 Years | 87 (76.3%) | 0 (0.0%) |
| 45 to 54 Years | 98 (94.2%) | 13 (13.3%) |
| 55 to 59 Years | 25 (40.3%) | 0 (0.0%) |
| 60 to 64 Years | 20 (27.4%) | 0 (0.0%) |
| 65 to 74 Years | 14 (13.0%) | 0 (0.0%) |
| 75 Years and over | 0 (0.0%) | 0 (0.0%) |
| Total | 325 (48.4%) | 24 (7.4%) |
Employment Status by Educational Attainment in Ingleside on the Bay
According to labor force statistics for Ingleside on the Bay, 66.1% of individuals (251) out of the total population between 25 and 64 years of age (380) are in the labor force, with 7.2% or 18 of them being unemployed. The group with the highest labor force participation rate are those with the educational attainment of high school diploma, with 82.8% or 106 individuals in the labor force. Within the labor force, individuals with high school diploma education have the highest percentage of unemployment, with 12.3% or 13 of them being unemployed.
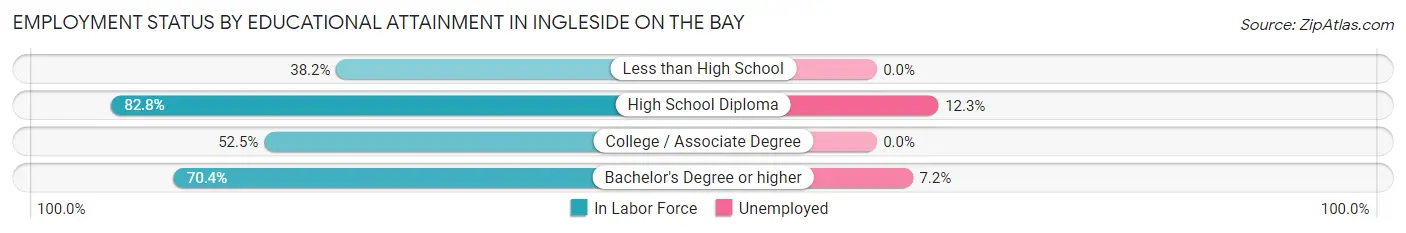
| Educational Attainment | In Labor Force | Unemployed |
| Less than High School | 13 (38.2%) | 0 (0.0%) |
| High School Diploma | 106 (82.8%) | 16 (12.3%) |
| College / Associate Degree | 63 (52.5%) | 0 (0.0%) |
| Bachelor's Degree or higher | 69 (70.4%) | 7 (7.2%) |
| Total | 251 (66.1%) | 27 (7.2%) |
Employment Occupations by Sex in Ingleside on the Bay
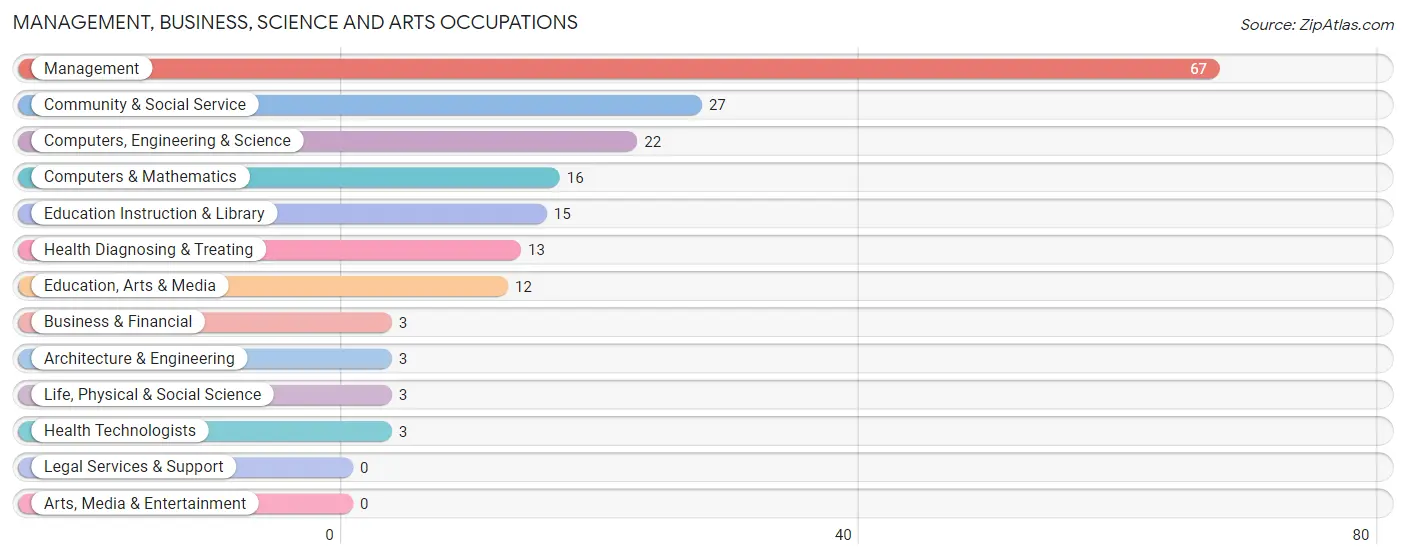
Management, Business, Science and Arts Occupations
The most common Management, Business, Science and Arts occupations in Ingleside on the Bay are Management (67 | 22.3%), Community & Social Service (27 | 9.0%), Computers, Engineering & Science (22 | 7.3%), Computers & Mathematics (16 | 5.3%), and Education Instruction & Library (15 | 5.0%).
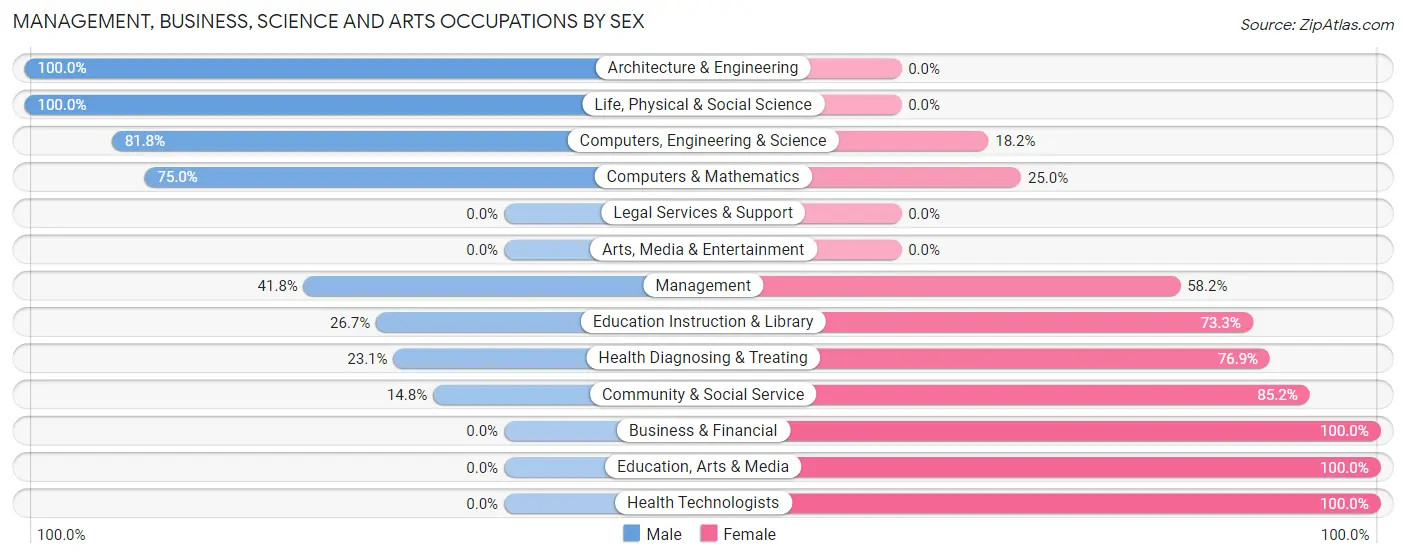
Management, Business, Science and Arts Occupations by Sex
Within the Management, Business, Science and Arts occupations in Ingleside on the Bay, the most male-oriented occupations are Architecture & Engineering (100.0%), Life, Physical & Social Science (100.0%), and Computers, Engineering & Science (81.8%), while the most female-oriented occupations are Business & Financial (100.0%), Education, Arts & Media (100.0%), and Health Technologists (100.0%).
| Occupation | Male | Female |
| Management | 28 (41.8%) | 39 (58.2%) |
| Business & Financial | 0 (0.0%) | 3 (100.0%) |
| Computers, Engineering & Science | 18 (81.8%) | 4 (18.2%) |
| Computers & Mathematics | 12 (75.0%) | 4 (25.0%) |
| Architecture & Engineering | 3 (100.0%) | 0 (0.0%) |
| Life, Physical & Social Science | 3 (100.0%) | 0 (0.0%) |
| Community & Social Service | 4 (14.8%) | 23 (85.2%) |
| Education, Arts & Media | 0 (0.0%) | 12 (100.0%) |
| Legal Services & Support | 0 (0.0%) | 0 (0.0%) |
| Education Instruction & Library | 4 (26.7%) | 11 (73.3%) |
| Arts, Media & Entertainment | 0 (0.0%) | 0 (0.0%) |
| Health Diagnosing & Treating | 3 (23.1%) | 10 (76.9%) |
| Health Technologists | 0 (0.0%) | 3 (100.0%) |
| Total (Category) | 53 (40.2%) | 79 (59.9%) |
| Total (Overall) | 163 (54.1%) | 138 (45.9%) |
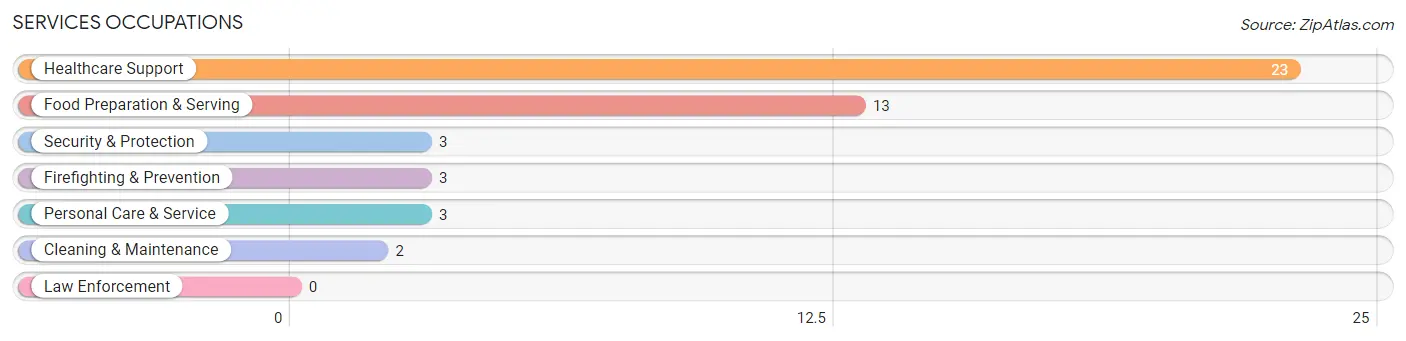
Services Occupations
The most common Services occupations in Ingleside on the Bay are Healthcare Support (23 | 7.6%), Food Preparation & Serving (13 | 4.3%), Security & Protection (3 | 1.0%), Firefighting & Prevention (3 | 1.0%), and Personal Care & Service (3 | 1.0%).
Services Occupations by Sex
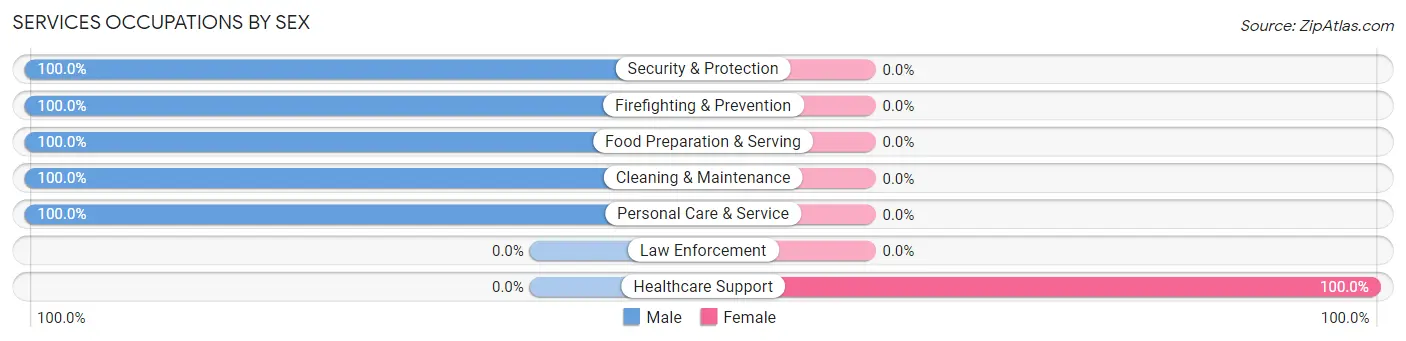
| Occupation | Male | Female |
| Healthcare Support | 0 (0.0%) | 23 (100.0%) |
| Security & Protection | 3 (100.0%) | 0 (0.0%) |
| Firefighting & Prevention | 3 (100.0%) | 0 (0.0%) |
| Law Enforcement | 0 (0.0%) | 0 (0.0%) |
| Food Preparation & Serving | 13 (100.0%) | 0 (0.0%) |
| Cleaning & Maintenance | 2 (100.0%) | 0 (0.0%) |
| Personal Care & Service | 3 (100.0%) | 0 (0.0%) |
| Total (Category) | 21 (47.7%) | 23 (52.3%) |
| Total (Overall) | 163 (54.1%) | 138 (45.9%) |
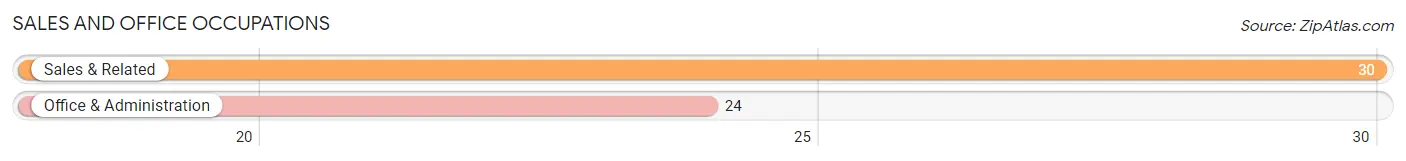
Sales and Office Occupations
The most common Sales and Office occupations in Ingleside on the Bay are Sales & Related (30 | 10.0%), and Office & Administration (24 | 8.0%).
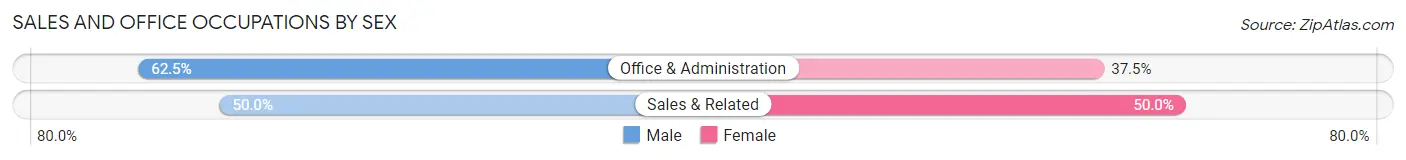
Sales and Office Occupations by Sex
| Occupation | Male | Female |
| Sales & Related | 15 (50.0%) | 15 (50.0%) |
| Office & Administration | 15 (62.5%) | 9 (37.5%) |
| Total (Category) | 30 (55.6%) | 24 (44.4%) |
| Total (Overall) | 163 (54.1%) | 138 (45.9%) |
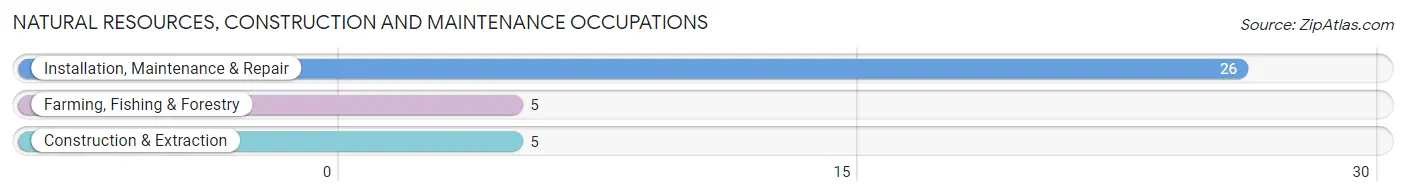
Natural Resources, Construction and Maintenance Occupations
The most common Natural Resources, Construction and Maintenance occupations in Ingleside on the Bay are Installation, Maintenance & Repair (26 | 8.6%), Farming, Fishing & Forestry (5 | 1.7%), and Construction & Extraction (5 | 1.7%).
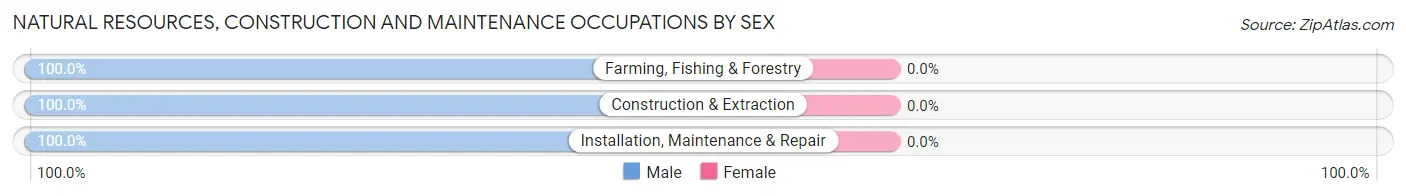
Natural Resources, Construction and Maintenance Occupations by Sex
| Occupation | Male | Female |
| Farming, Fishing & Forestry | 5 (100.0%) | 0 (0.0%) |
| Construction & Extraction | 5 (100.0%) | 0 (0.0%) |
| Installation, Maintenance & Repair | 26 (100.0%) | 0 (0.0%) |
| Total (Category) | 36 (100.0%) | 0 (0.0%) |
| Total (Overall) | 163 (54.1%) | 138 (45.9%) |
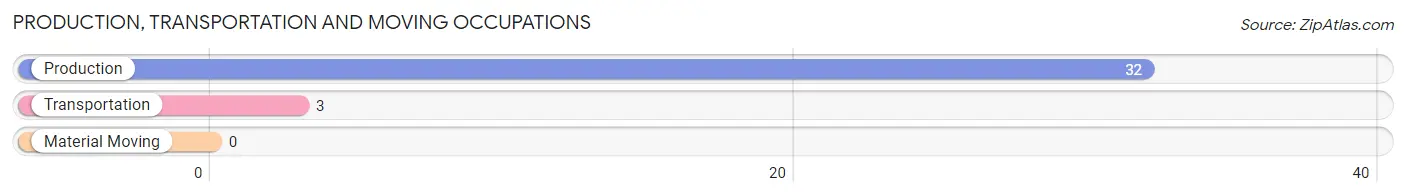
Production, Transportation and Moving Occupations
The most common Production, Transportation and Moving occupations in Ingleside on the Bay are Production (32 | 10.6%), and Transportation (3 | 1.0%).
Production, Transportation and Moving Occupations by Sex
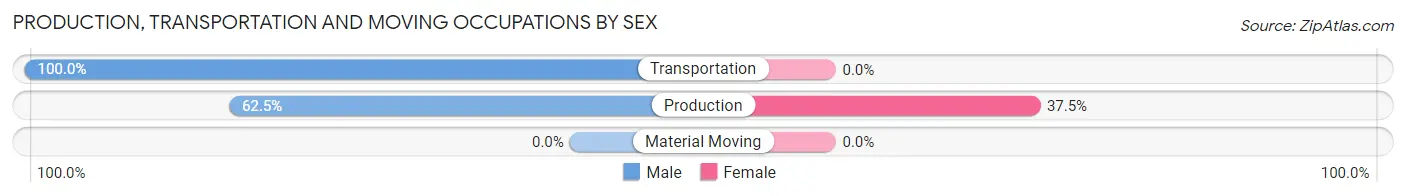
| Occupation | Male | Female |
| Production | 20 (62.5%) | 12 (37.5%) |
| Transportation | 3 (100.0%) | 0 (0.0%) |
| Material Moving | 0 (0.0%) | 0 (0.0%) |
| Total (Category) | 23 (65.7%) | 12 (34.3%) |
| Total (Overall) | 163 (54.1%) | 138 (45.9%) |
Employment Industries by Sex in Ingleside on the Bay
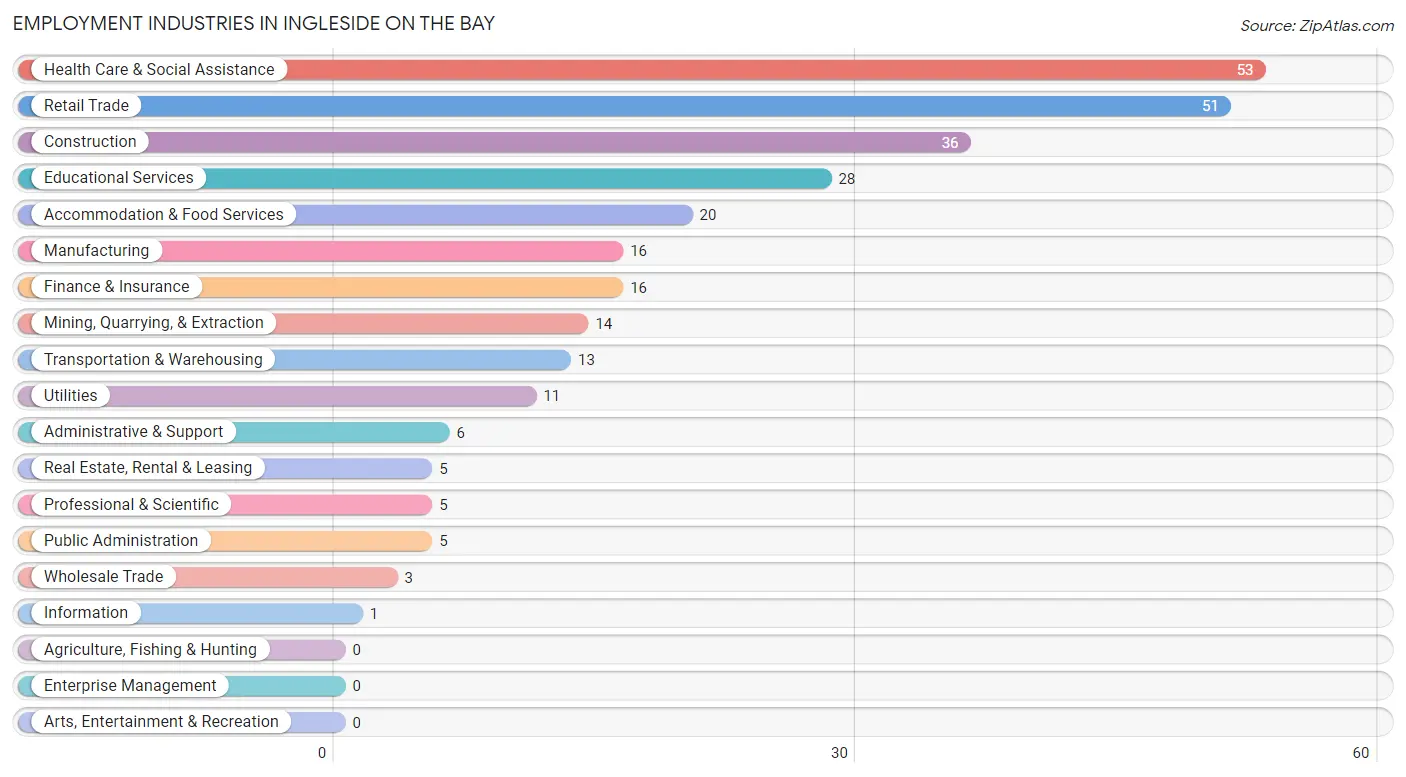
Employment Industries in Ingleside on the Bay
The major employment industries in Ingleside on the Bay include Health Care & Social Assistance (53 | 17.6%), Retail Trade (51 | 16.9%), Construction (36 | 12.0%), Educational Services (28 | 9.3%), and Accommodation & Food Services (20 | 6.6%).
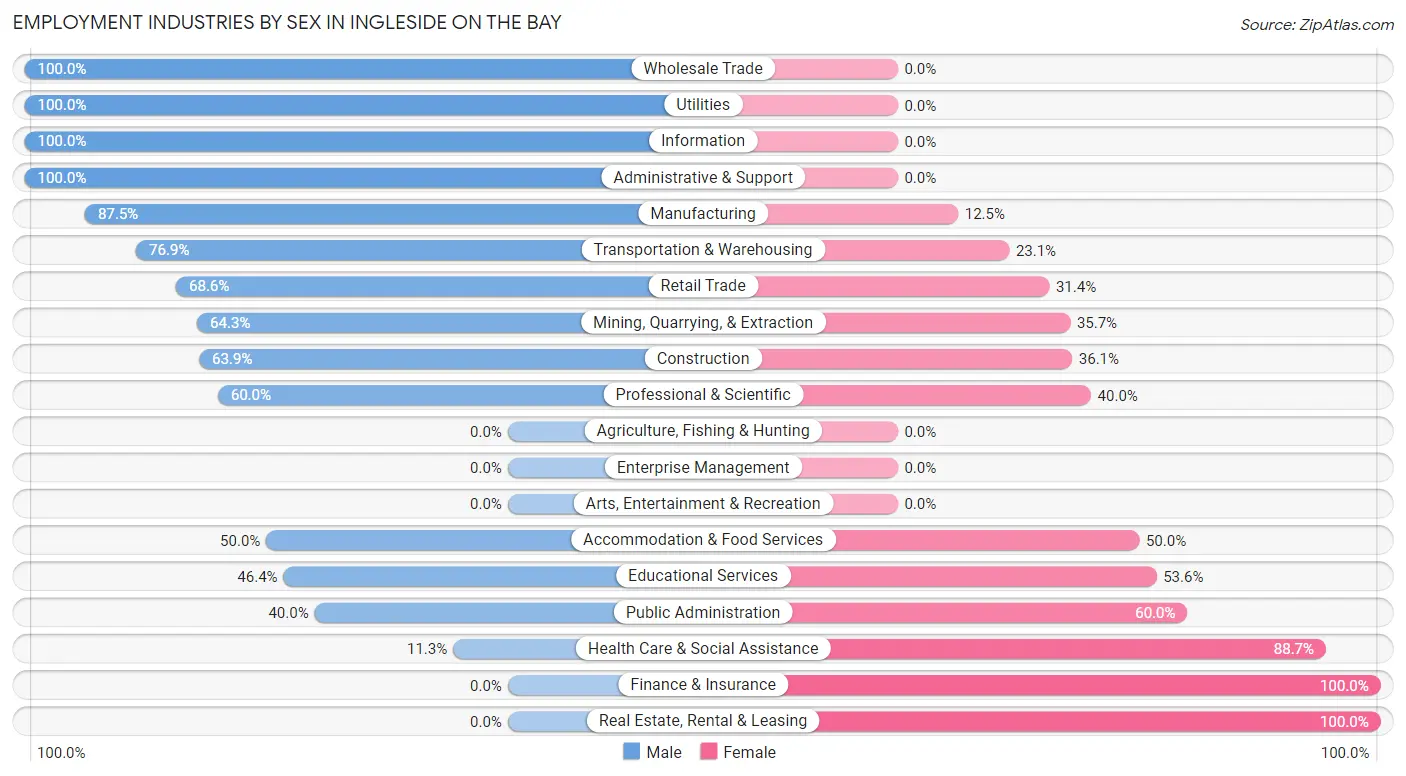
Employment Industries by Sex in Ingleside on the Bay
The Ingleside on the Bay industries that see more men than women are Wholesale Trade (100.0%), Utilities (100.0%), and Information (100.0%), whereas the industries that tend to have a higher number of women are Finance & Insurance (100.0%), Real Estate, Rental & Leasing (100.0%), and Health Care & Social Assistance (88.7%).
| Industry | Male | Female |
| Agriculture, Fishing & Hunting | 0 (0.0%) | 0 (0.0%) |
| Mining, Quarrying, & Extraction | 9 (64.3%) | 5 (35.7%) |
| Construction | 23 (63.9%) | 13 (36.1%) |
| Manufacturing | 14 (87.5%) | 2 (12.5%) |
| Wholesale Trade | 3 (100.0%) | 0 (0.0%) |
| Retail Trade | 35 (68.6%) | 16 (31.4%) |
| Transportation & Warehousing | 10 (76.9%) | 3 (23.1%) |
| Utilities | 11 (100.0%) | 0 (0.0%) |
| Information | 1 (100.0%) | 0 (0.0%) |
| Finance & Insurance | 0 (0.0%) | 16 (100.0%) |
| Real Estate, Rental & Leasing | 0 (0.0%) | 5 (100.0%) |
| Professional & Scientific | 3 (60.0%) | 2 (40.0%) |
| Enterprise Management | 0 (0.0%) | 0 (0.0%) |
| Administrative & Support | 6 (100.0%) | 0 (0.0%) |
| Educational Services | 13 (46.4%) | 15 (53.6%) |
| Health Care & Social Assistance | 6 (11.3%) | 47 (88.7%) |
| Arts, Entertainment & Recreation | 0 (0.0%) | 0 (0.0%) |
| Accommodation & Food Services | 10 (50.0%) | 10 (50.0%) |
| Public Administration | 2 (40.0%) | 3 (60.0%) |
| Total | 163 (54.1%) | 138 (45.9%) |
Education in Ingleside on the Bay
School Enrollment in Ingleside on the Bay
The most common levels of schooling among the 175 students in Ingleside on the Bay are middle school (68 | 38.9%), high school (63 | 36.0%), and college / undergraduate (24 | 13.7%).
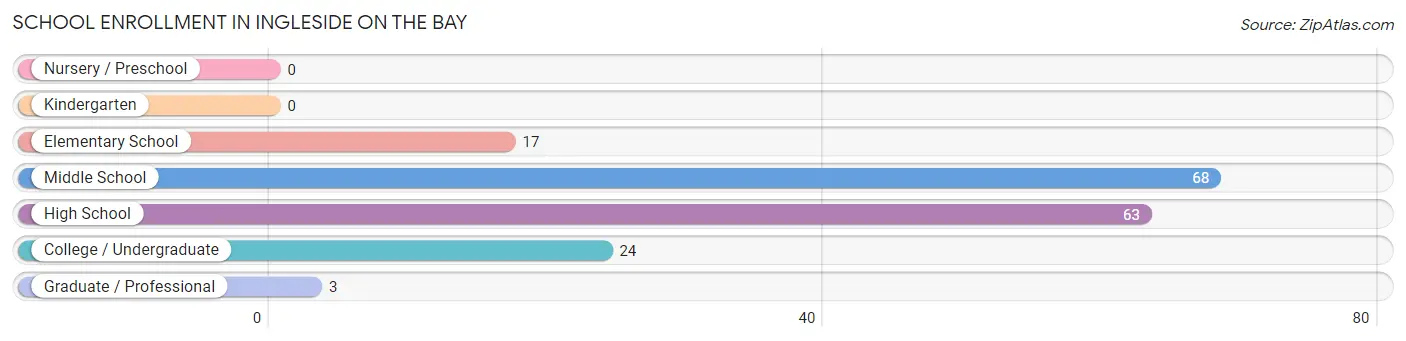
| School Level | # Students | % Students |
| Nursery / Preschool | 0 | 0.0% |
| Kindergarten | 0 | 0.0% |
| Elementary School | 17 | 9.7% |
| Middle School | 68 | 38.9% |
| High School | 63 | 36.0% |
| College / Undergraduate | 24 | 13.7% |
| Graduate / Professional | 3 | 1.7% |
| Total | 175 | 100.0% |
School Enrollment by Age by Funding Source in Ingleside on the Bay
Out of a total of 175 students who are enrolled in schools in Ingleside on the Bay, 15 (8.6%) attend a private institution, while the remaining 160 (91.4%) are enrolled in public schools. The age group of 5 to 9 year old has the highest likelihood of being enrolled in private schools, with 6 (40.0% in the age bracket) enrolled. Conversely, the age group of 20 to 24 year olds has the lowest likelihood of being enrolled in a private school, with 7 (100.0% in the age bracket) attending a public institution.
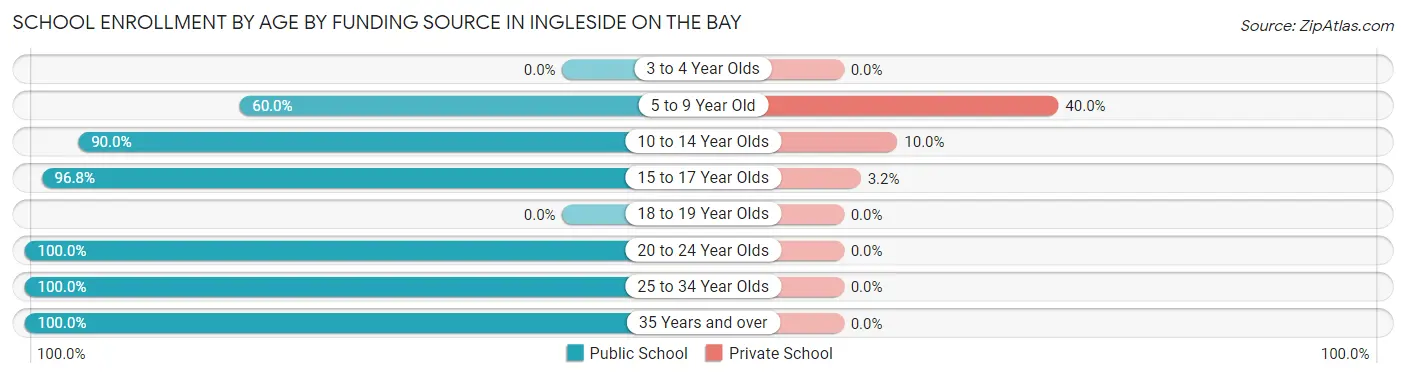
| Age Bracket | Public School | Private School |
| 3 to 4 Year Olds | 0 (0.0%) | 0 (0.0%) |
| 5 to 9 Year Old | 9 (60.0%) | 6 (40.0%) |
| 10 to 14 Year Olds | 63 (90.0%) | 7 (10.0%) |
| 15 to 17 Year Olds | 61 (96.8%) | 2 (3.2%) |
| 18 to 19 Year Olds | 0 (0.0%) | 0 (0.0%) |
| 20 to 24 Year Olds | 7 (100.0%) | 0 (0.0%) |
| 25 to 34 Year Olds | 5 (100.0%) | 0 (0.0%) |
| 35 Years and over | 15 (100.0%) | 0 (0.0%) |
| Total | 160 (91.4%) | 15 (8.6%) |
Educational Attainment by Field of Study in Ingleside on the Bay
Business (39 | 22.8%), education (38 | 22.2%), science & technology (23 | 13.5%), engineering (18 | 10.5%), and arts & humanities (16 | 9.4%) are the most common fields of study among 171 individuals in Ingleside on the Bay who have obtained a bachelor's degree or higher.
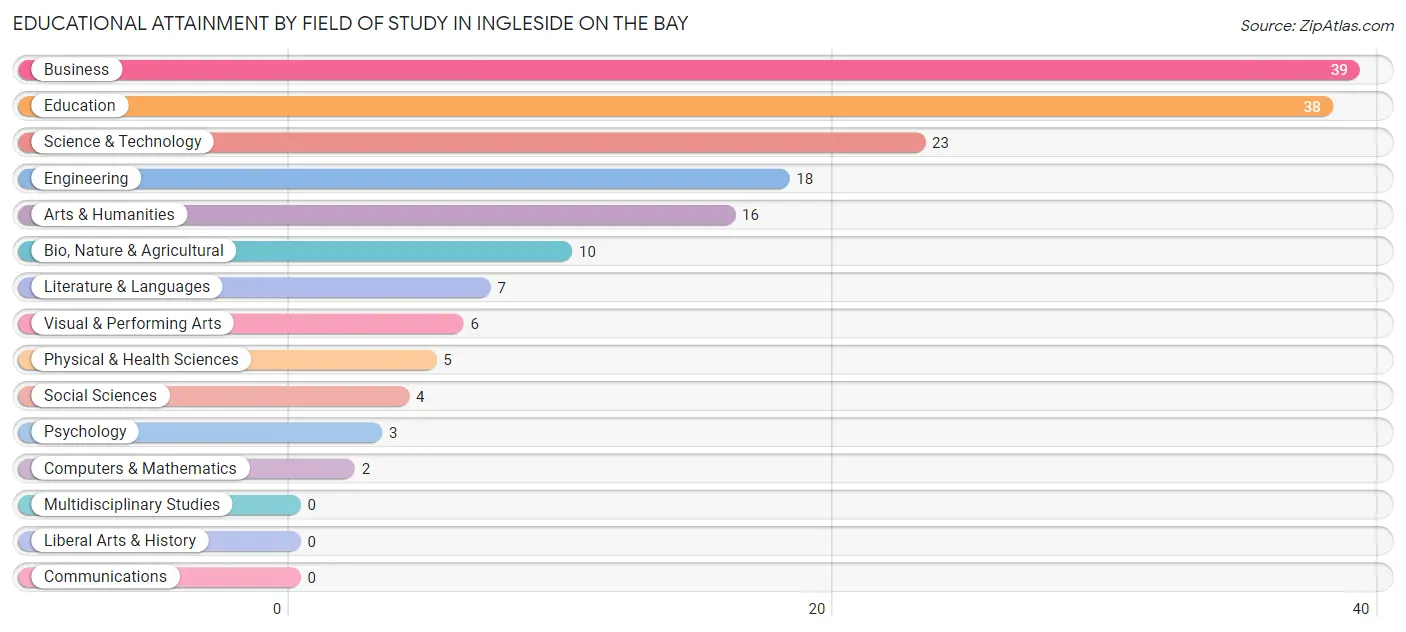
| Field of Study | # Graduates | % Graduates |
| Computers & Mathematics | 2 | 1.2% |
| Bio, Nature & Agricultural | 10 | 5.9% |
| Physical & Health Sciences | 5 | 2.9% |
| Psychology | 3 | 1.8% |
| Social Sciences | 4 | 2.3% |
| Engineering | 18 | 10.5% |
| Multidisciplinary Studies | 0 | 0.0% |
| Science & Technology | 23 | 13.5% |
| Business | 39 | 22.8% |
| Education | 38 | 22.2% |
| Literature & Languages | 7 | 4.1% |
| Liberal Arts & History | 0 | 0.0% |
| Visual & Performing Arts | 6 | 3.5% |
| Communications | 0 | 0.0% |
| Arts & Humanities | 16 | 9.4% |
| Total | 171 | 100.0% |
Transportation & Commute in Ingleside on the Bay
Vehicle Availability by Sex in Ingleside on the Bay
The most prevalent vehicle ownership categories in Ingleside on the Bay are males with 4 vehicles (53, accounting for 32.5%) and females with 4 vehicles (14, making up 40.5%).
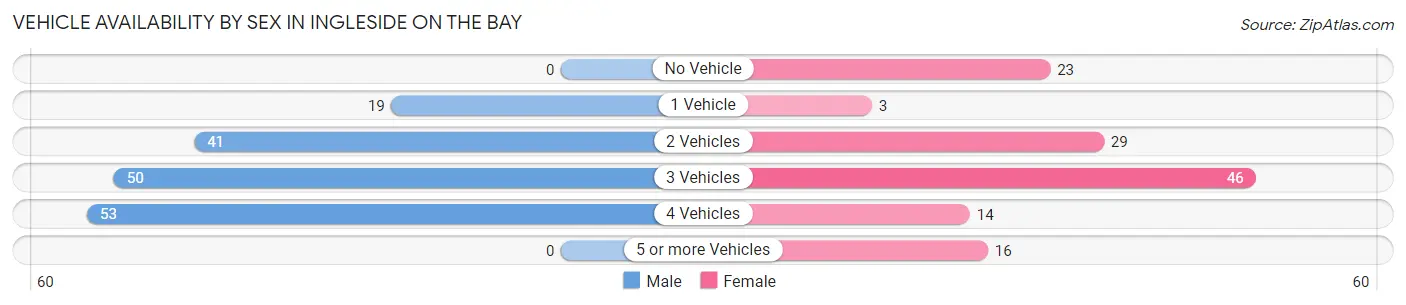
| Vehicles Available | Male | Female |
| No Vehicle | 0 (0.0%) | 23 (17.6%) |
| 1 Vehicle | 19 (11.7%) | 3 (2.3%) |
| 2 Vehicles | 41 (25.2%) | 29 (22.1%) |
| 3 Vehicles | 50 (30.7%) | 46 (35.1%) |
| 4 Vehicles | 53 (32.5%) | 14 (10.7%) |
| 5 or more Vehicles | 0 (0.0%) | 16 (12.2%) |
| Total | 163 (100.0%) | 131 (100.0%) |
Commute Time in Ingleside on the Bay
The most frequently occuring commute durations in Ingleside on the Bay are 10 to 14 minutes (74 commuters, 25.6%), 5 to 9 minutes (48 commuters, 16.6%), and 20 to 24 minutes (43 commuters, 14.9%).
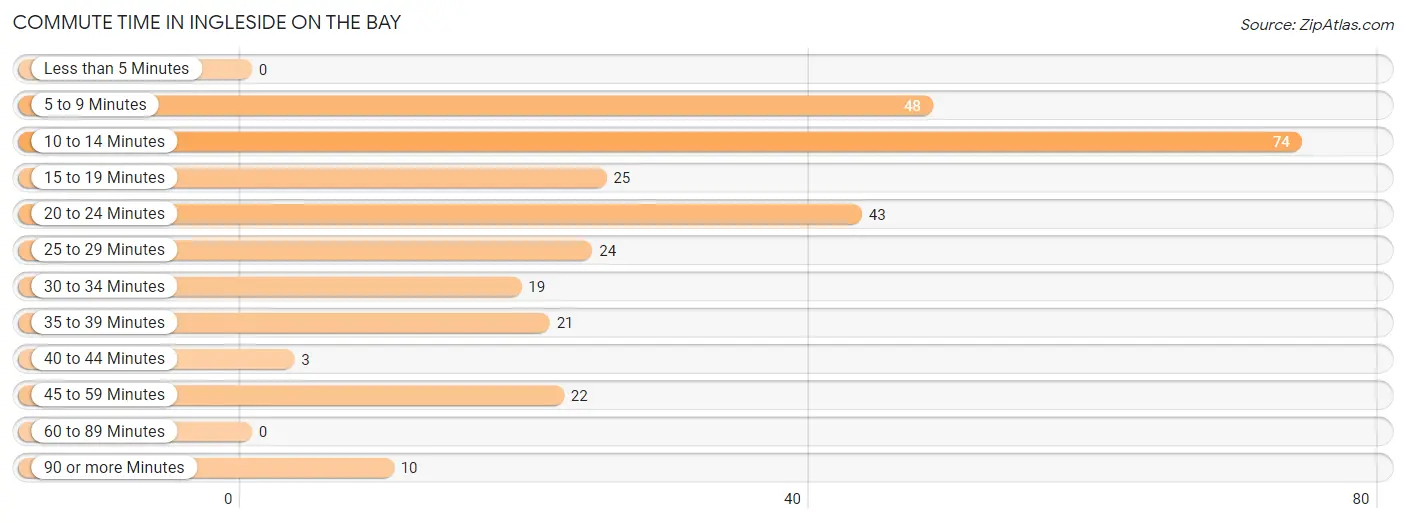
| Commute Time | # Commuters | % Commuters |
| Less than 5 Minutes | 0 | 0.0% |
| 5 to 9 Minutes | 48 | 16.6% |
| 10 to 14 Minutes | 74 | 25.6% |
| 15 to 19 Minutes | 25 | 8.6% |
| 20 to 24 Minutes | 43 | 14.9% |
| 25 to 29 Minutes | 24 | 8.3% |
| 30 to 34 Minutes | 19 | 6.6% |
| 35 to 39 Minutes | 21 | 7.3% |
| 40 to 44 Minutes | 3 | 1.0% |
| 45 to 59 Minutes | 22 | 7.6% |
| 60 to 89 Minutes | 0 | 0.0% |
| 90 or more Minutes | 10 | 3.5% |
Commute Time by Sex in Ingleside on the Bay
The most common commute times in Ingleside on the Bay are 5 to 9 minutes (46 commuters, 28.2%) for males and 10 to 14 minutes (32 commuters, 25.4%) for females.
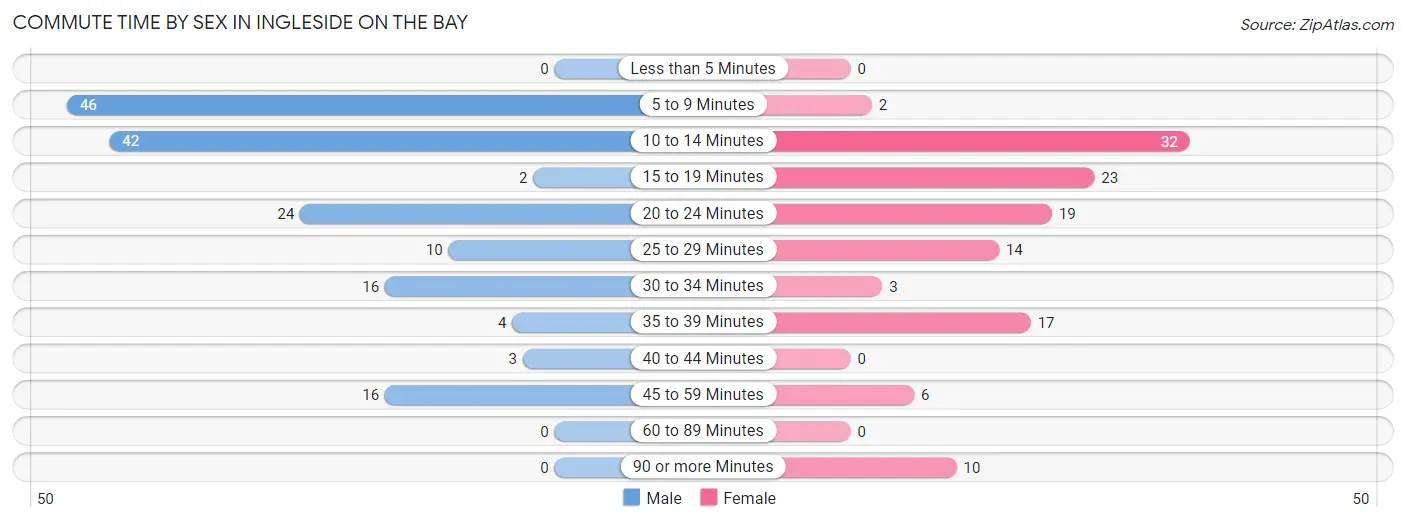
| Commute Time | Male | Female |
| Less than 5 Minutes | 0 (0.0%) | 0 (0.0%) |
| 5 to 9 Minutes | 46 (28.2%) | 2 (1.6%) |
| 10 to 14 Minutes | 42 (25.8%) | 32 (25.4%) |
| 15 to 19 Minutes | 2 (1.2%) | 23 (18.2%) |
| 20 to 24 Minutes | 24 (14.7%) | 19 (15.1%) |
| 25 to 29 Minutes | 10 (6.1%) | 14 (11.1%) |
| 30 to 34 Minutes | 16 (9.8%) | 3 (2.4%) |
| 35 to 39 Minutes | 4 (2.5%) | 17 (13.5%) |
| 40 to 44 Minutes | 3 (1.8%) | 0 (0.0%) |
| 45 to 59 Minutes | 16 (9.8%) | 6 (4.8%) |
| 60 to 89 Minutes | 0 (0.0%) | 0 (0.0%) |
| 90 or more Minutes | 0 (0.0%) | 10 (7.9%) |
Time of Departure to Work by Sex in Ingleside on the Bay
The most frequent times of departure to work in Ingleside on the Bay are 6:00 AM to 6:29 AM (31, 19.0%) for males and 7:00 AM to 7:29 AM (36, 28.6%) for females.
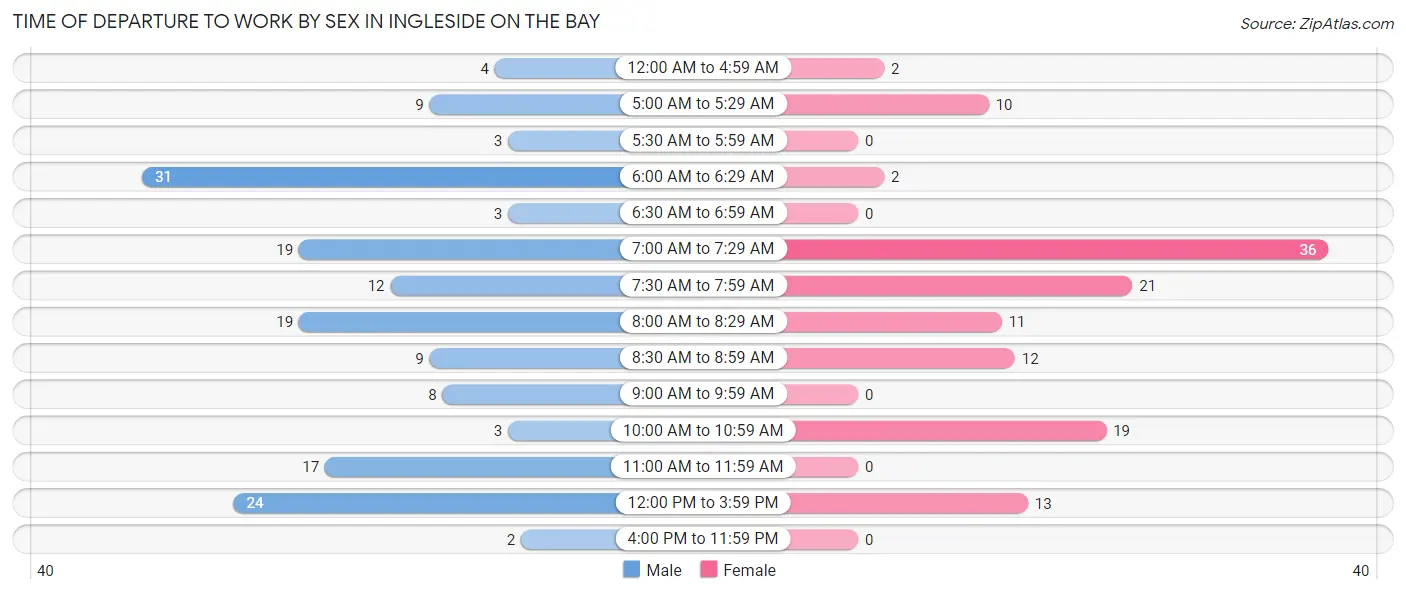
| Time of Departure | Male | Female |
| 12:00 AM to 4:59 AM | 4 (2.5%) | 2 (1.6%) |
| 5:00 AM to 5:29 AM | 9 (5.5%) | 10 (7.9%) |
| 5:30 AM to 5:59 AM | 3 (1.8%) | 0 (0.0%) |
| 6:00 AM to 6:29 AM | 31 (19.0%) | 2 (1.6%) |
| 6:30 AM to 6:59 AM | 3 (1.8%) | 0 (0.0%) |
| 7:00 AM to 7:29 AM | 19 (11.7%) | 36 (28.6%) |
| 7:30 AM to 7:59 AM | 12 (7.4%) | 21 (16.7%) |
| 8:00 AM to 8:29 AM | 19 (11.7%) | 11 (8.7%) |
| 8:30 AM to 8:59 AM | 9 (5.5%) | 12 (9.5%) |
| 9:00 AM to 9:59 AM | 8 (4.9%) | 0 (0.0%) |
| 10:00 AM to 10:59 AM | 3 (1.8%) | 19 (15.1%) |
| 11:00 AM to 11:59 AM | 17 (10.4%) | 0 (0.0%) |
| 12:00 PM to 3:59 PM | 24 (14.7%) | 13 (10.3%) |
| 4:00 PM to 11:59 PM | 2 (1.2%) | 0 (0.0%) |
| Total | 163 (100.0%) | 126 (100.0%) |
Housing Occupancy in Ingleside on the Bay
Occupancy by Ownership in Ingleside on the Bay
Of the total 268 dwellings in Ingleside on the Bay, owner-occupied units account for 239 (89.2%), while renter-occupied units make up 29 (10.8%).
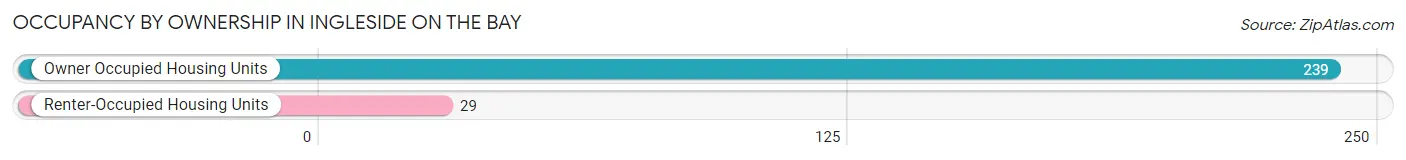
| Occupancy | # Housing Units | % Housing Units |
| Owner Occupied Housing Units | 239 | 89.2% |
| Renter-Occupied Housing Units | 29 | 10.8% |
| Total Occupied Housing Units | 268 | 100.0% |
Occupancy by Household Size in Ingleside on the Bay
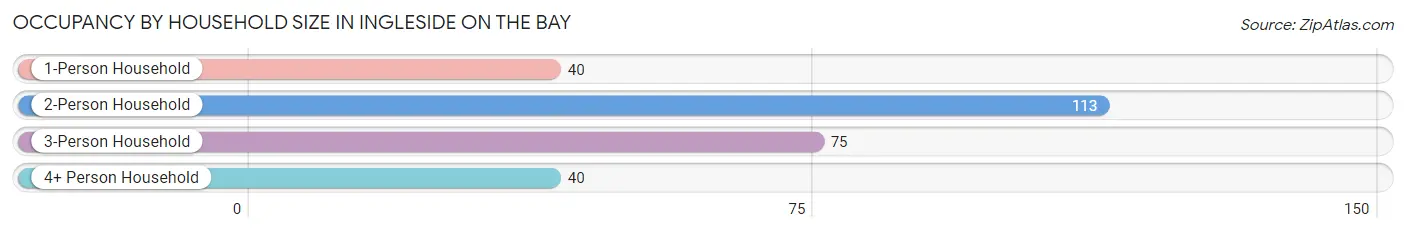
| Household Size | # Housing Units | % Housing Units |
| 1-Person Household | 40 | 14.9% |
| 2-Person Household | 113 | 42.2% |
| 3-Person Household | 75 | 28.0% |
| 4+ Person Household | 40 | 14.9% |
| Total Housing Units | 268 | 100.0% |
Occupancy by Ownership by Household Size in Ingleside on the Bay
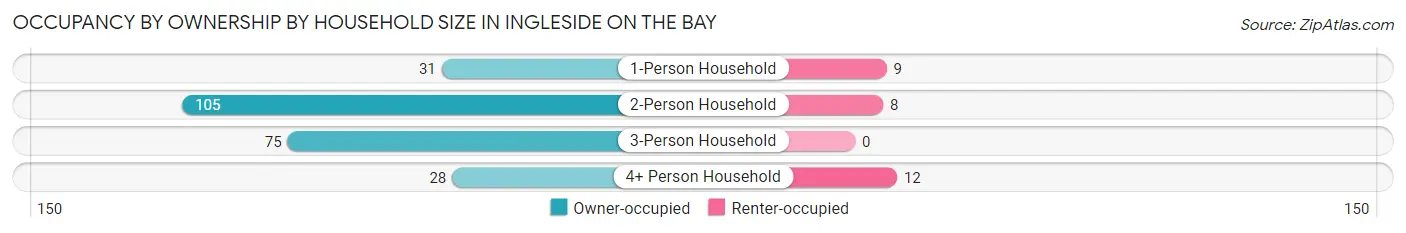
| Household Size | Owner-occupied | Renter-occupied |
| 1-Person Household | 31 (77.5%) | 9 (22.5%) |
| 2-Person Household | 105 (92.9%) | 8 (7.1%) |
| 3-Person Household | 75 (100.0%) | 0 (0.0%) |
| 4+ Person Household | 28 (70.0%) | 12 (30.0%) |
| Total Housing Units | 239 (89.2%) | 29 (10.8%) |
Occupancy by Educational Attainment in Ingleside on the Bay
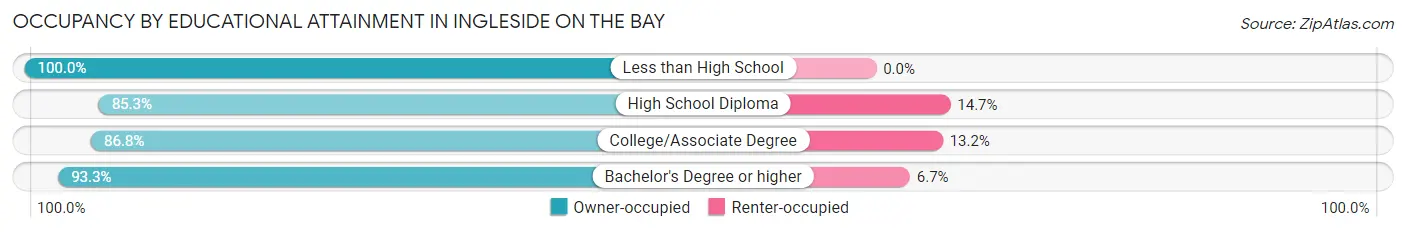
| Household Size | Owner-occupied | Renter-occupied |
| Less than High School | 4 (100.0%) | 0 (0.0%) |
| High School Diploma | 58 (85.3%) | 10 (14.7%) |
| College/Associate Degree | 79 (86.8%) | 12 (13.2%) |
| Bachelor's Degree or higher | 98 (93.3%) | 7 (6.7%) |
Occupancy by Age of Householder in Ingleside on the Bay
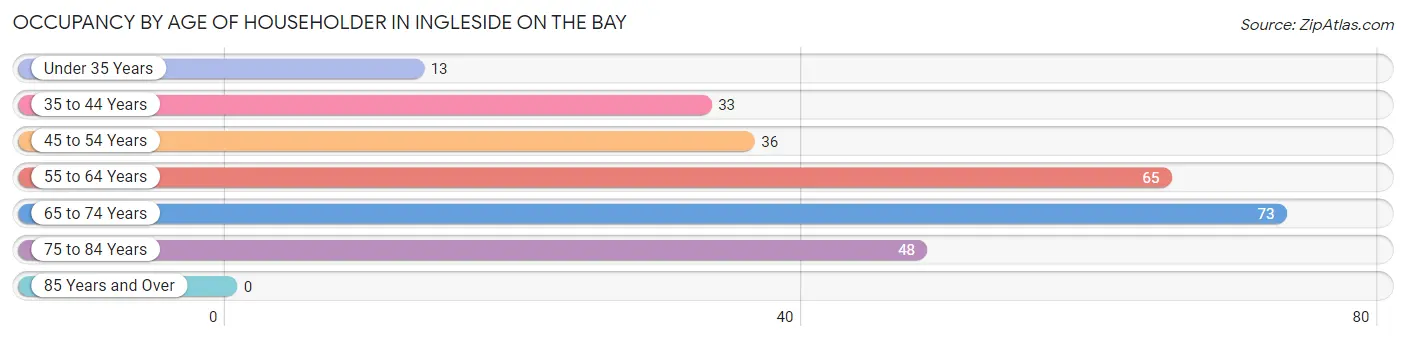
| Age Bracket | # Households | % Households |
| Under 35 Years | 13 | 4.9% |
| 35 to 44 Years | 33 | 12.3% |
| 45 to 54 Years | 36 | 13.4% |
| 55 to 64 Years | 65 | 24.2% |
| 65 to 74 Years | 73 | 27.2% |
| 75 to 84 Years | 48 | 17.9% |
| 85 Years and Over | 0 | 0.0% |
| Total | 268 | 100.0% |
Housing Finances in Ingleside on the Bay
Median Income by Occupancy in Ingleside on the Bay
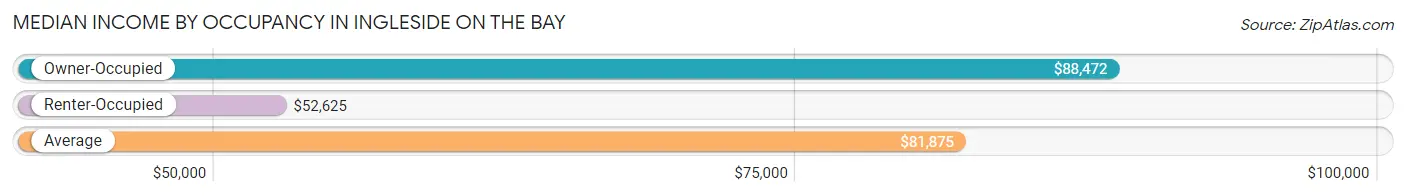
| Occupancy Type | # Households | Median Income |
| Owner-Occupied | 239 (89.2%) | $88,472 |
| Renter-Occupied | 29 (10.8%) | $52,625 |
| Average | 268 (100.0%) | $81,875 |
Occupancy by Householder Income Bracket in Ingleside on the Bay
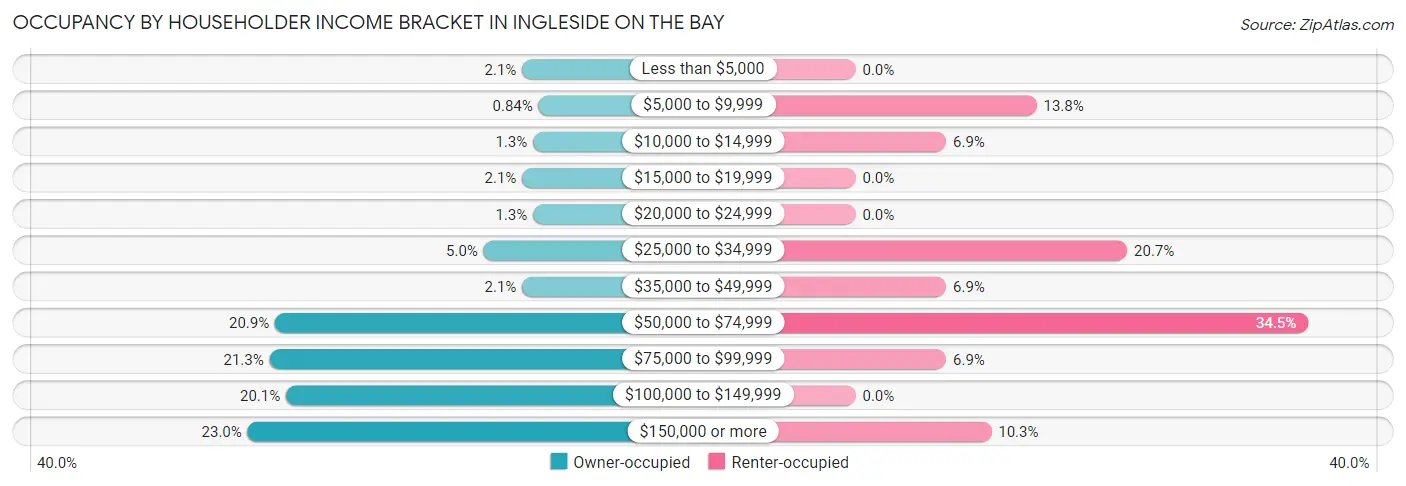
| Income Bracket | Owner-occupied | Renter-occupied |
| Less than $5,000 | 5 (2.1%) | 0 (0.0%) |
| $5,000 to $9,999 | 2 (0.8%) | 4 (13.8%) |
| $10,000 to $14,999 | 3 (1.3%) | 2 (6.9%) |
| $15,000 to $19,999 | 5 (2.1%) | 0 (0.0%) |
| $20,000 to $24,999 | 3 (1.3%) | 0 (0.0%) |
| $25,000 to $34,999 | 12 (5.0%) | 6 (20.7%) |
| $35,000 to $49,999 | 5 (2.1%) | 2 (6.9%) |
| $50,000 to $74,999 | 50 (20.9%) | 10 (34.5%) |
| $75,000 to $99,999 | 51 (21.3%) | 2 (6.9%) |
| $100,000 to $149,999 | 48 (20.1%) | 0 (0.0%) |
| $150,000 or more | 55 (23.0%) | 3 (10.3%) |
| Total | 239 (100.0%) | 29 (100.0%) |
Monthly Housing Cost Tiers in Ingleside on the Bay
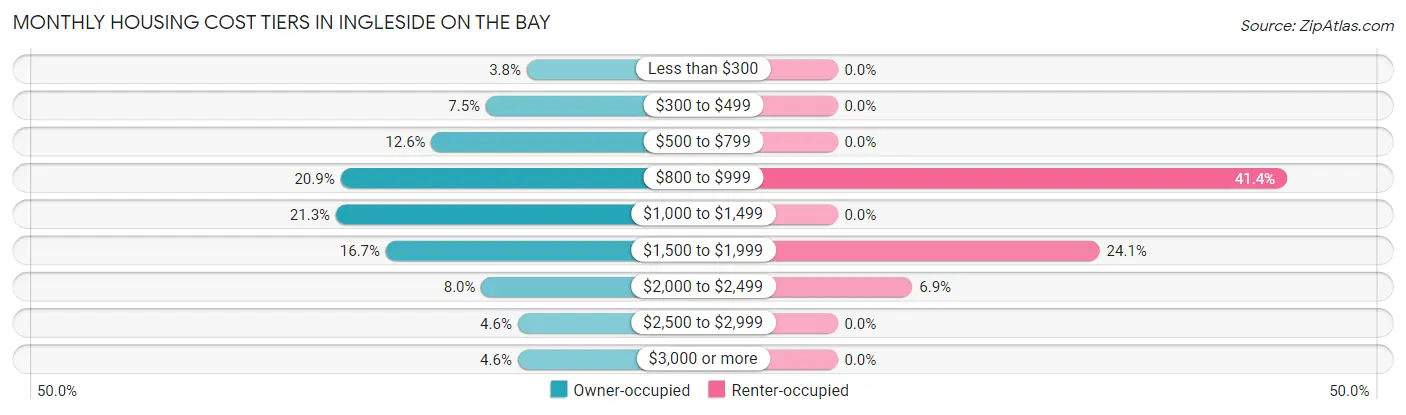
| Monthly Cost | Owner-occupied | Renter-occupied |
| Less than $300 | 9 (3.8%) | 0 (0.0%) |
| $300 to $499 | 18 (7.5%) | 0 (0.0%) |
| $500 to $799 | 30 (12.6%) | 0 (0.0%) |
| $800 to $999 | 50 (20.9%) | 12 (41.4%) |
| $1,000 to $1,499 | 51 (21.3%) | 0 (0.0%) |
| $1,500 to $1,999 | 40 (16.7%) | 7 (24.1%) |
| $2,000 to $2,499 | 19 (8.0%) | 2 (6.9%) |
| $2,500 to $2,999 | 11 (4.6%) | 0 (0.0%) |
| $3,000 or more | 11 (4.6%) | 0 (0.0%) |
| Total | 239 (100.0%) | 29 (100.0%) |
Physical Housing Characteristics in Ingleside on the Bay
Housing Structures in Ingleside on the Bay
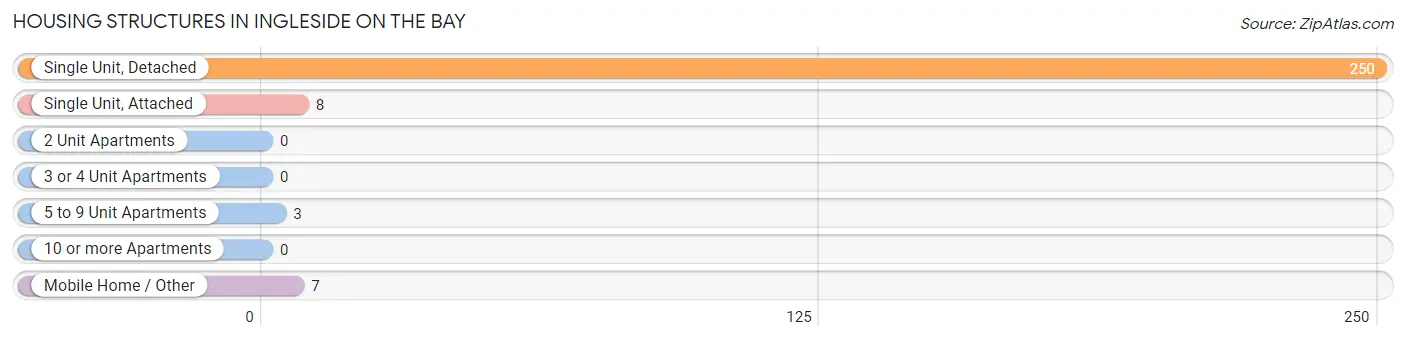
| Structure Type | # Housing Units | % Housing Units |
| Single Unit, Detached | 250 | 93.3% |
| Single Unit, Attached | 8 | 3.0% |
| 2 Unit Apartments | 0 | 0.0% |
| 3 or 4 Unit Apartments | 0 | 0.0% |
| 5 to 9 Unit Apartments | 3 | 1.1% |
| 10 or more Apartments | 0 | 0.0% |
| Mobile Home / Other | 7 | 2.6% |
| Total | 268 | 100.0% |
Housing Structures by Occupancy in Ingleside on the Bay
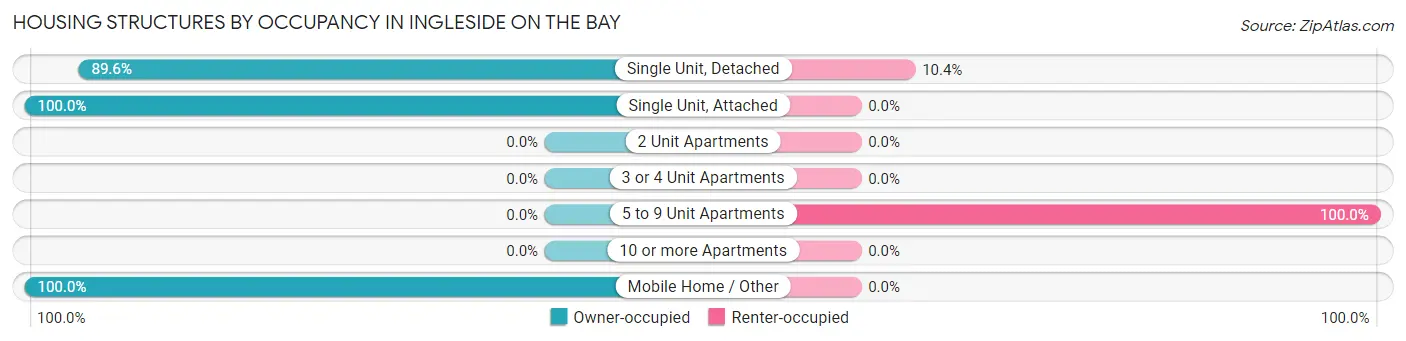
| Structure Type | Owner-occupied | Renter-occupied |
| Single Unit, Detached | 224 (89.6%) | 26 (10.4%) |
| Single Unit, Attached | 8 (100.0%) | 0 (0.0%) |
| 2 Unit Apartments | 0 (0.0%) | 0 (0.0%) |
| 3 or 4 Unit Apartments | 0 (0.0%) | 0 (0.0%) |
| 5 to 9 Unit Apartments | 0 (0.0%) | 3 (100.0%) |
| 10 or more Apartments | 0 (0.0%) | 0 (0.0%) |
| Mobile Home / Other | 7 (100.0%) | 0 (0.0%) |
| Total | 239 (89.2%) | 29 (10.8%) |
Housing Structures by Number of Rooms in Ingleside on the Bay
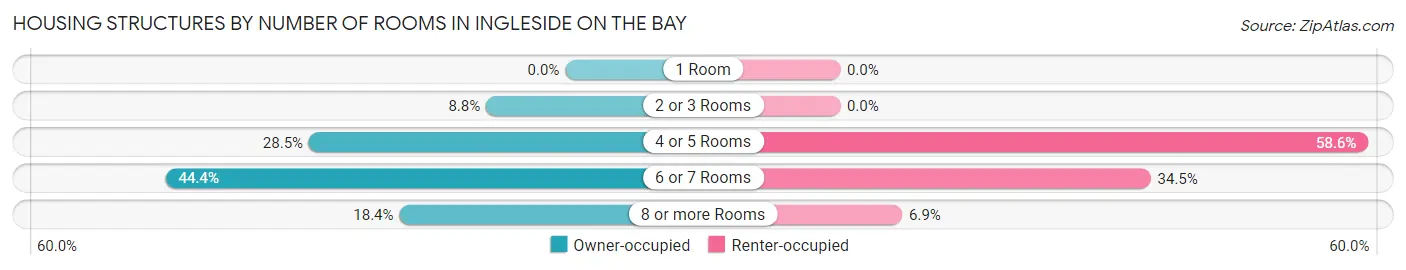
| Number of Rooms | Owner-occupied | Renter-occupied |
| 1 Room | 0 (0.0%) | 0 (0.0%) |
| 2 or 3 Rooms | 21 (8.8%) | 0 (0.0%) |
| 4 or 5 Rooms | 68 (28.4%) | 17 (58.6%) |
| 6 or 7 Rooms | 106 (44.4%) | 10 (34.5%) |
| 8 or more Rooms | 44 (18.4%) | 2 (6.9%) |
| Total | 239 (100.0%) | 29 (100.0%) |
Housing Structure by Heating Type in Ingleside on the Bay
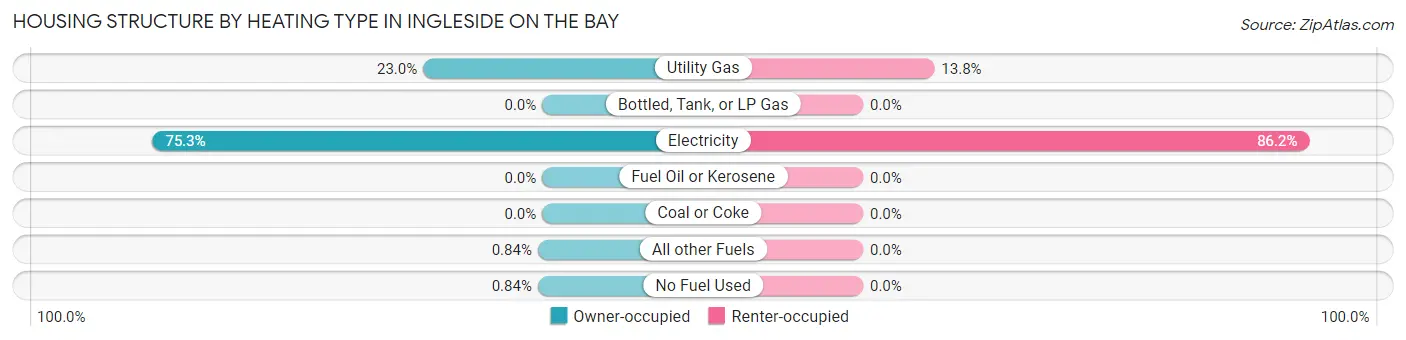
| Heating Type | Owner-occupied | Renter-occupied |
| Utility Gas | 55 (23.0%) | 4 (13.8%) |
| Bottled, Tank, or LP Gas | 0 (0.0%) | 0 (0.0%) |
| Electricity | 180 (75.3%) | 25 (86.2%) |
| Fuel Oil or Kerosene | 0 (0.0%) | 0 (0.0%) |
| Coal or Coke | 0 (0.0%) | 0 (0.0%) |
| All other Fuels | 2 (0.8%) | 0 (0.0%) |
| No Fuel Used | 2 (0.8%) | 0 (0.0%) |
| Total | 239 (100.0%) | 29 (100.0%) |
Household Vehicle Usage in Ingleside on the Bay
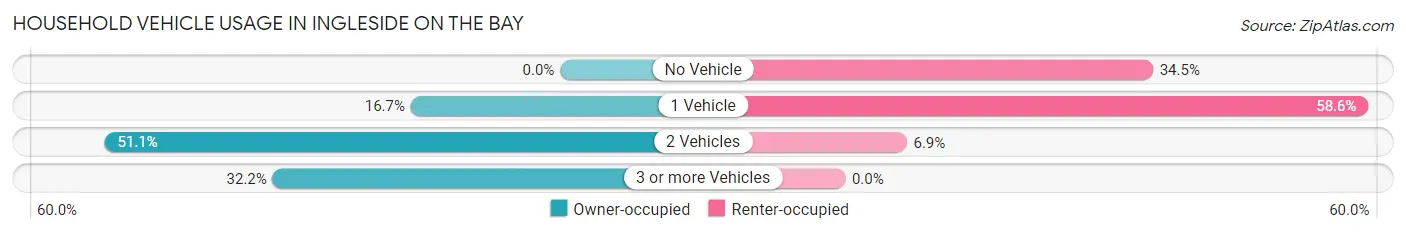
| Vehicles per Household | Owner-occupied | Renter-occupied |
| No Vehicle | 0 (0.0%) | 10 (34.5%) |
| 1 Vehicle | 40 (16.7%) | 17 (58.6%) |
| 2 Vehicles | 122 (51.0%) | 2 (6.9%) |
| 3 or more Vehicles | 77 (32.2%) | 0 (0.0%) |
| Total | 239 (100.0%) | 29 (100.0%) |
Real Estate & Mortgages in Ingleside on the Bay
Real Estate and Mortgage Overview in Ingleside on the Bay
| Characteristic | Without Mortgage | With Mortgage |
| Housing Units | 125 | 114 |
| Median Property Value | $239,100 | $313,900 |
| Median Household Income | $65,417 | $44 |
| Monthly Housing Costs | $822 | $11 |
| Real Estate Taxes | $2,833 | $26 |
Property Value by Mortgage Status in Ingleside on the Bay
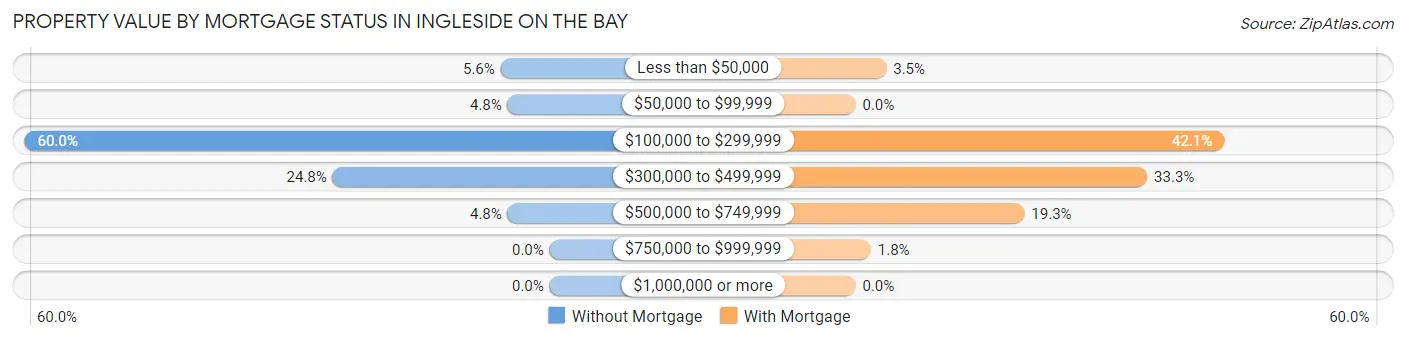
| Property Value | Without Mortgage | With Mortgage |
| Less than $50,000 | 7 (5.6%) | 4 (3.5%) |
| $50,000 to $99,999 | 6 (4.8%) | 0 (0.0%) |
| $100,000 to $299,999 | 75 (60.0%) | 48 (42.1%) |
| $300,000 to $499,999 | 31 (24.8%) | 38 (33.3%) |
| $500,000 to $749,999 | 6 (4.8%) | 22 (19.3%) |
| $750,000 to $999,999 | 0 (0.0%) | 2 (1.8%) |
| $1,000,000 or more | 0 (0.0%) | 0 (0.0%) |
| Total | 125 (100.0%) | 114 (100.0%) |
Household Income by Mortgage Status in Ingleside on the Bay
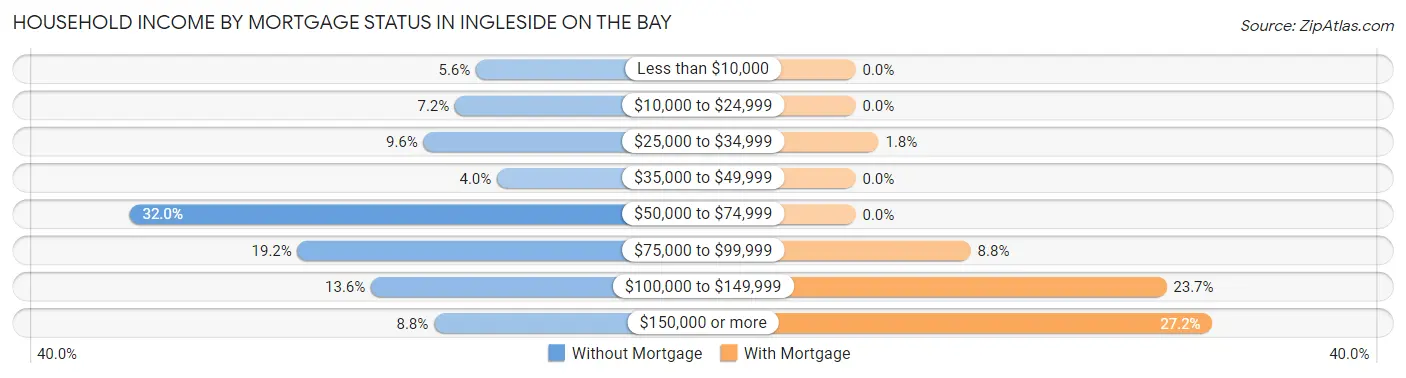
| Household Income | Without Mortgage | With Mortgage |
| Less than $10,000 | 7 (5.6%) | 0 (0.0%) |
| $10,000 to $24,999 | 9 (7.2%) | 0 (0.0%) |
| $25,000 to $34,999 | 12 (9.6%) | 2 (1.8%) |
| $35,000 to $49,999 | 5 (4.0%) | 0 (0.0%) |
| $50,000 to $74,999 | 40 (32.0%) | 0 (0.0%) |
| $75,000 to $99,999 | 24 (19.2%) | 10 (8.8%) |
| $100,000 to $149,999 | 17 (13.6%) | 27 (23.7%) |
| $150,000 or more | 11 (8.8%) | 31 (27.2%) |
| Total | 125 (100.0%) | 114 (100.0%) |
Property Value to Household Income Ratio in Ingleside on the Bay
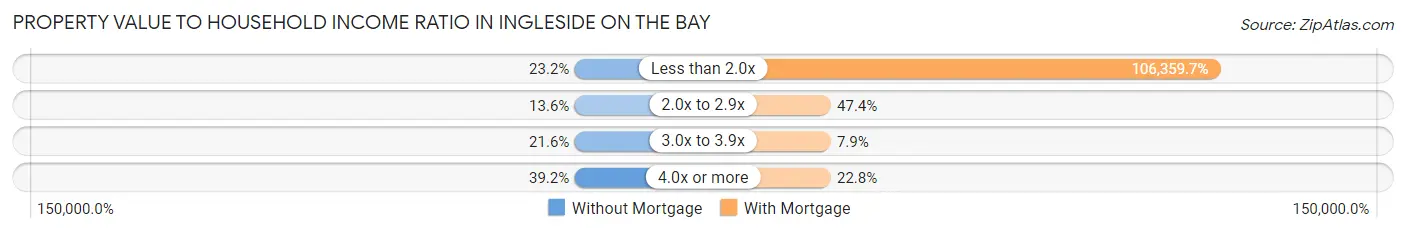
| Value-to-Income Ratio | Without Mortgage | With Mortgage |
| Less than 2.0x | 29 (23.2%) | 121,250 (106,359.7%) |
| 2.0x to 2.9x | 17 (13.6%) | 54 (47.4%) |
| 3.0x to 3.9x | 27 (21.6%) | 9 (7.9%) |
| 4.0x or more | 49 (39.2%) | 26 (22.8%) |
| Total | 125 (100.0%) | 114 (100.0%) |
Real Estate Taxes by Mortgage Status in Ingleside on the Bay
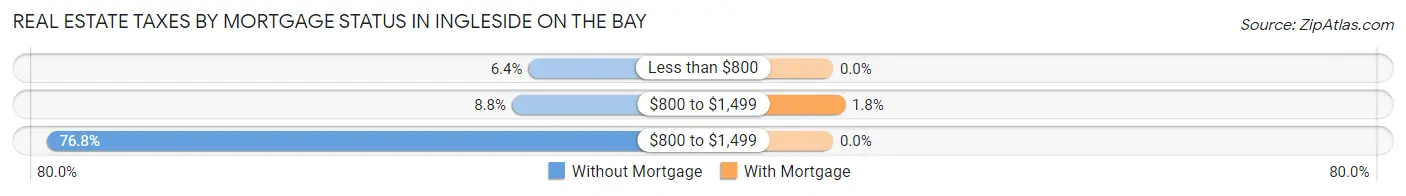
| Property Taxes | Without Mortgage | With Mortgage |
| Less than $800 | 8 (6.4%) | 0 (0.0%) |
| $800 to $1,499 | 11 (8.8%) | 2 (1.8%) |
| $800 to $1,499 | 96 (76.8%) | 0 (0.0%) |
| Total | 125 (100.0%) | 114 (100.0%) |
Health & Disability in Ingleside on the Bay
Health Insurance Coverage by Age in Ingleside on the Bay
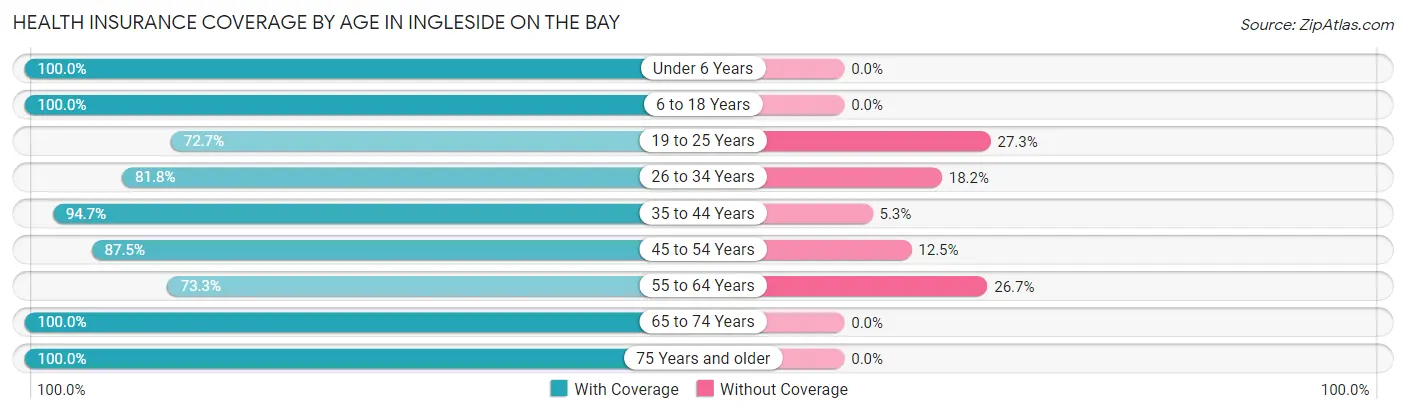
| Age Bracket | With Coverage | Without Coverage |
| Under 6 Years | 2 (100.0%) | 0 (0.0%) |
| 6 to 18 Years | 153 (100.0%) | 0 (0.0%) |
| 19 to 25 Years | 40 (72.7%) | 15 (27.3%) |
| 26 to 34 Years | 18 (81.8%) | 4 (18.2%) |
| 35 to 44 Years | 108 (94.7%) | 6 (5.3%) |
| 45 to 54 Years | 91 (87.5%) | 13 (12.5%) |
| 55 to 64 Years | 99 (73.3%) | 36 (26.7%) |
| 65 to 74 Years | 108 (100.0%) | 0 (0.0%) |
| 75 Years and older | 83 (100.0%) | 0 (0.0%) |
| Total | 702 (90.5%) | 74 (9.5%) |
Health Insurance Coverage by Citizenship Status in Ingleside on the Bay
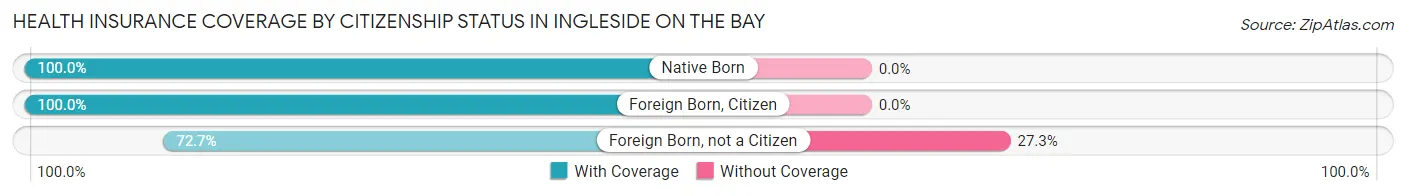
| Citizenship Status | With Coverage | Without Coverage |
| Native Born | 2 (100.0%) | 0 (0.0%) |
| Foreign Born, Citizen | 153 (100.0%) | 0 (0.0%) |
| Foreign Born, not a Citizen | 40 (72.7%) | 15 (27.3%) |
Health Insurance Coverage by Household Income in Ingleside on the Bay
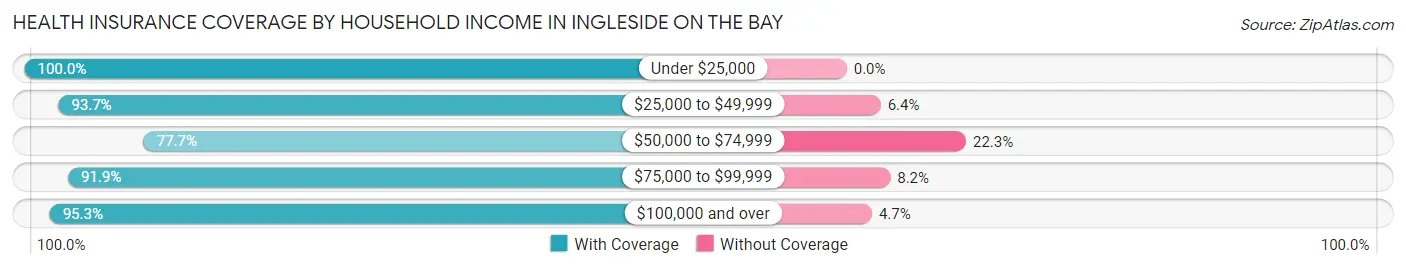
| Household Income | With Coverage | Without Coverage |
| Under $25,000 | 30 (100.0%) | 0 (0.0%) |
| $25,000 to $49,999 | 59 (93.6%) | 4 (6.4%) |
| $50,000 to $74,999 | 146 (77.7%) | 42 (22.3%) |
| $75,000 to $99,999 | 124 (91.8%) | 11 (8.2%) |
| $100,000 and over | 343 (95.3%) | 17 (4.7%) |
Public vs Private Health Insurance Coverage by Age in Ingleside on the Bay
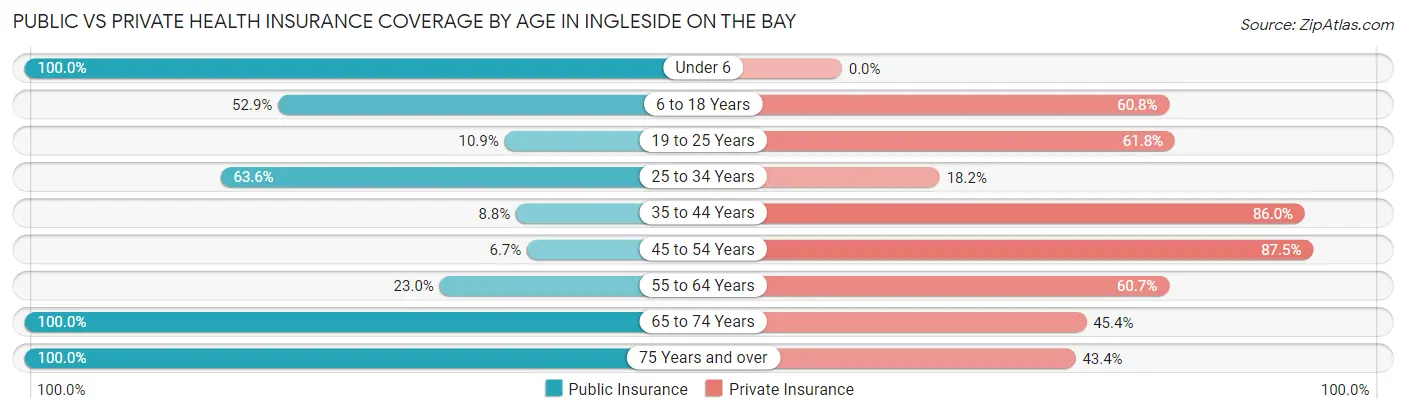
| Age Bracket | Public Insurance | Private Insurance |
| Under 6 | 2 (100.0%) | 0 (0.0%) |
| 6 to 18 Years | 81 (52.9%) | 93 (60.8%) |
| 19 to 25 Years | 6 (10.9%) | 34 (61.8%) |
| 25 to 34 Years | 14 (63.6%) | 4 (18.2%) |
| 35 to 44 Years | 10 (8.8%) | 98 (86.0%) |
| 45 to 54 Years | 7 (6.7%) | 91 (87.5%) |
| 55 to 64 Years | 31 (23.0%) | 82 (60.7%) |
| 65 to 74 Years | 108 (100.0%) | 49 (45.4%) |
| 75 Years and over | 83 (100.0%) | 36 (43.4%) |
| Total | 342 (44.1%) | 487 (62.8%) |
Disability Status by Sex by Age in Ingleside on the Bay
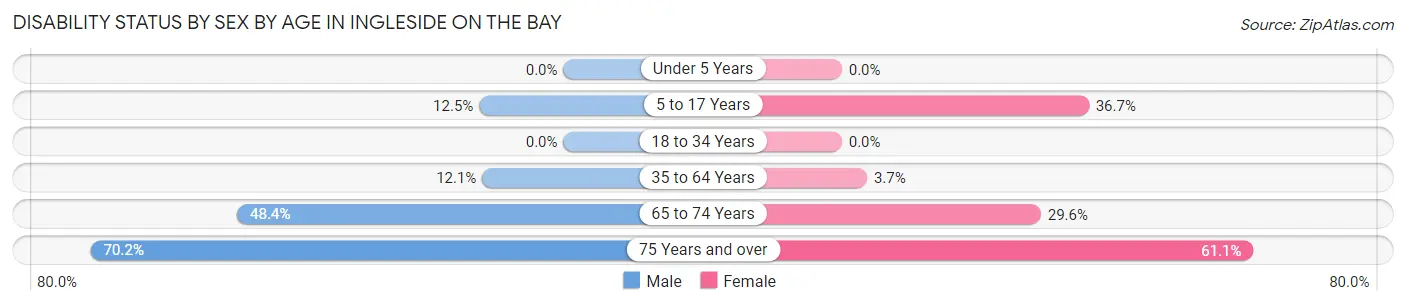
| Age Bracket | Male | Female |
| Under 5 Years | 0 (0.0%) | 0 (0.0%) |
| 5 to 17 Years | 15 (12.5%) | 11 (36.7%) |
| 18 to 34 Years | 0 (0.0%) | 0 (0.0%) |
| 35 to 64 Years | 20 (12.0%) | 7 (3.7%) |
| 65 to 74 Years | 31 (48.4%) | 13 (29.5%) |
| 75 Years and over | 33 (70.2%) | 22 (61.1%) |
Disability Class by Sex by Age in Ingleside on the Bay
Disability Class: Hearing Difficulty
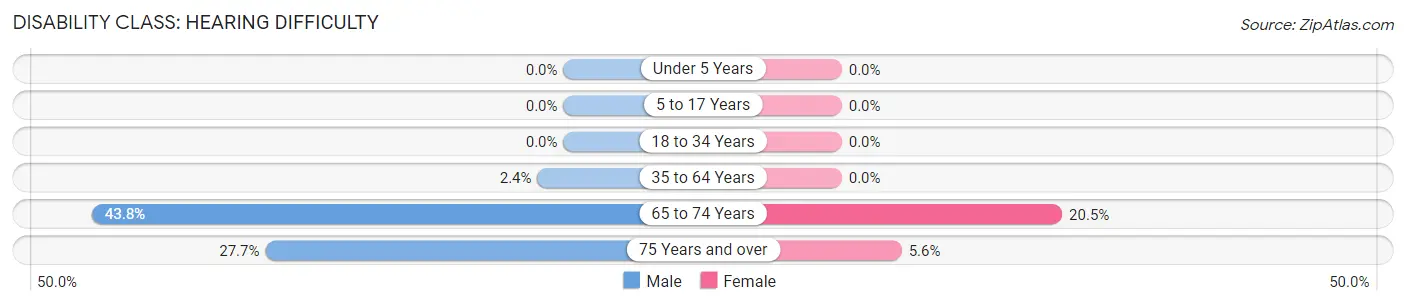
| Age Bracket | Male | Female |
| Under 5 Years | 0 (0.0%) | 0 (0.0%) |
| 5 to 17 Years | 0 (0.0%) | 0 (0.0%) |
| 18 to 34 Years | 0 (0.0%) | 0 (0.0%) |
| 35 to 64 Years | 4 (2.4%) | 0 (0.0%) |
| 65 to 74 Years | 28 (43.8%) | 9 (20.4%) |
| 75 Years and over | 13 (27.7%) | 2 (5.6%) |
Disability Class: Vision Difficulty
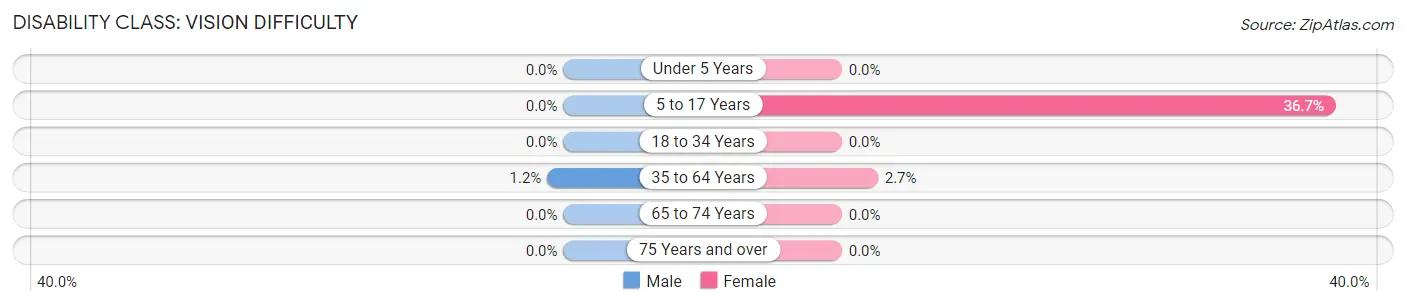
| Age Bracket | Male | Female |
| Under 5 Years | 0 (0.0%) | 0 (0.0%) |
| 5 to 17 Years | 0 (0.0%) | 11 (36.7%) |
| 18 to 34 Years | 0 (0.0%) | 0 (0.0%) |
| 35 to 64 Years | 2 (1.2%) | 5 (2.7%) |
| 65 to 74 Years | 0 (0.0%) | 0 (0.0%) |
| 75 Years and over | 0 (0.0%) | 0 (0.0%) |
Disability Class: Cognitive Difficulty
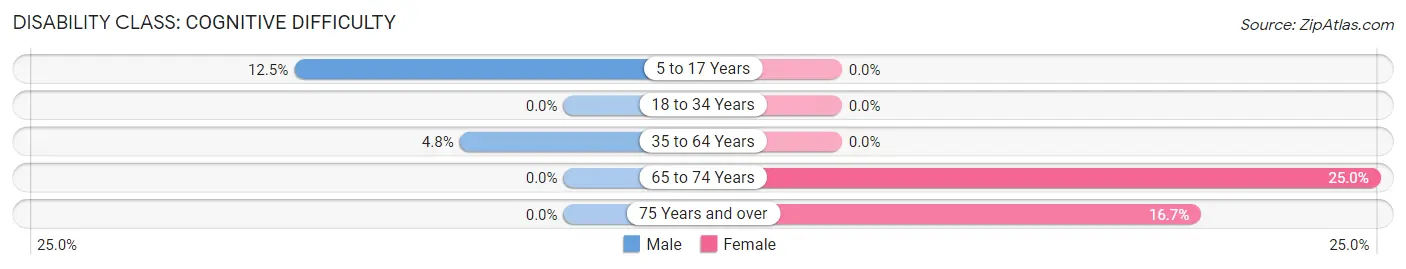
| Age Bracket | Male | Female |
| 5 to 17 Years | 15 (12.5%) | 0 (0.0%) |
| 18 to 34 Years | 0 (0.0%) | 0 (0.0%) |
| 35 to 64 Years | 8 (4.8%) | 0 (0.0%) |
| 65 to 74 Years | 0 (0.0%) | 11 (25.0%) |
| 75 Years and over | 0 (0.0%) | 6 (16.7%) |
Disability Class: Ambulatory Difficulty
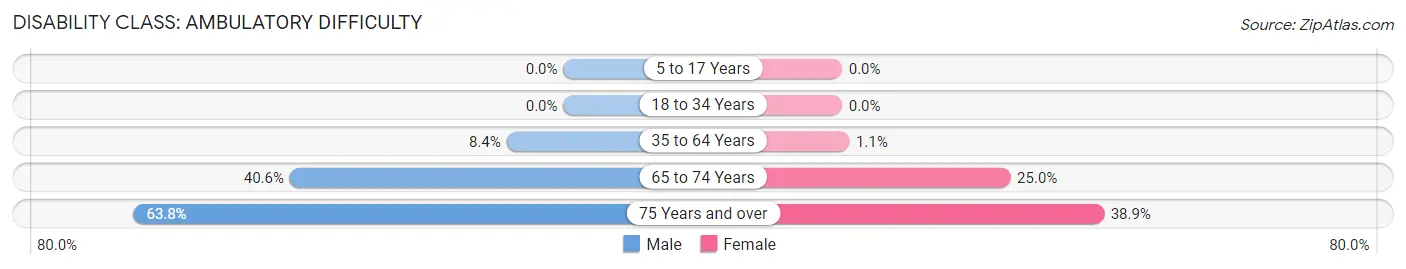
| Age Bracket | Male | Female |
| 5 to 17 Years | 0 (0.0%) | 0 (0.0%) |
| 18 to 34 Years | 0 (0.0%) | 0 (0.0%) |
| 35 to 64 Years | 14 (8.4%) | 2 (1.1%) |
| 65 to 74 Years | 26 (40.6%) | 11 (25.0%) |
| 75 Years and over | 30 (63.8%) | 14 (38.9%) |
Disability Class: Self-Care Difficulty
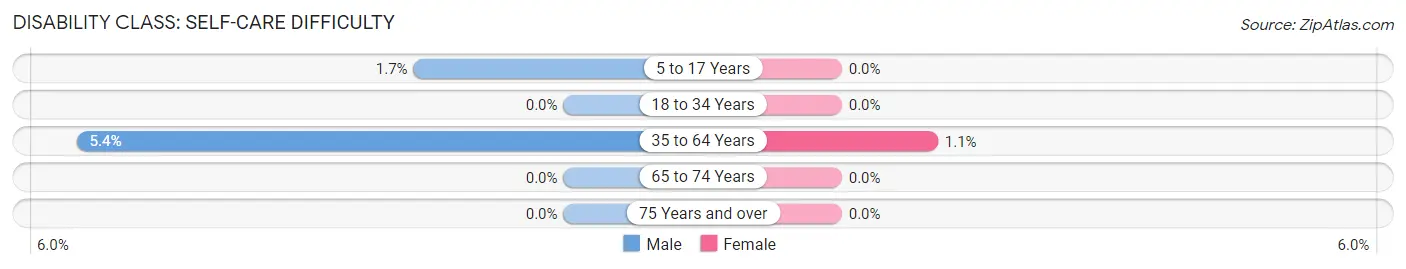
| Age Bracket | Male | Female |
| 5 to 17 Years | 2 (1.7%) | 0 (0.0%) |
| 18 to 34 Years | 0 (0.0%) | 0 (0.0%) |
| 35 to 64 Years | 9 (5.4%) | 2 (1.1%) |
| 65 to 74 Years | 0 (0.0%) | 0 (0.0%) |
| 75 Years and over | 0 (0.0%) | 0 (0.0%) |
Technology Access in Ingleside on the Bay
Computing Device Access in Ingleside on the Bay
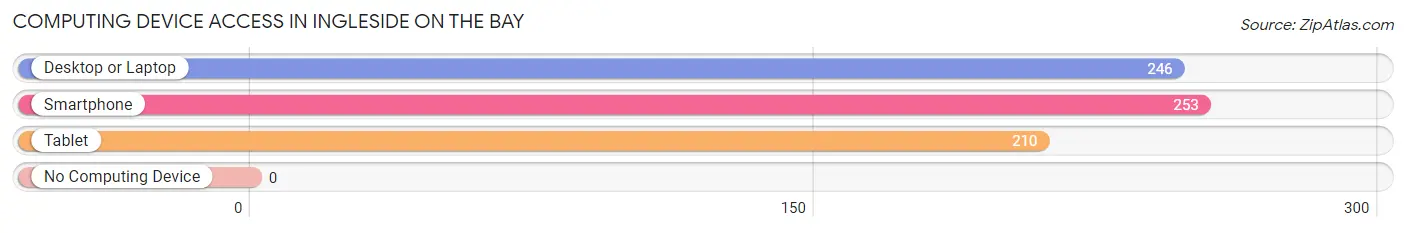
| Device Type | # Households | % Households |
| Desktop or Laptop | 246 | 91.8% |
| Smartphone | 253 | 94.4% |
| Tablet | 210 | 78.4% |
| No Computing Device | 0 | 0.0% |
| Total | 268 | 100.0% |
Internet Access in Ingleside on the Bay
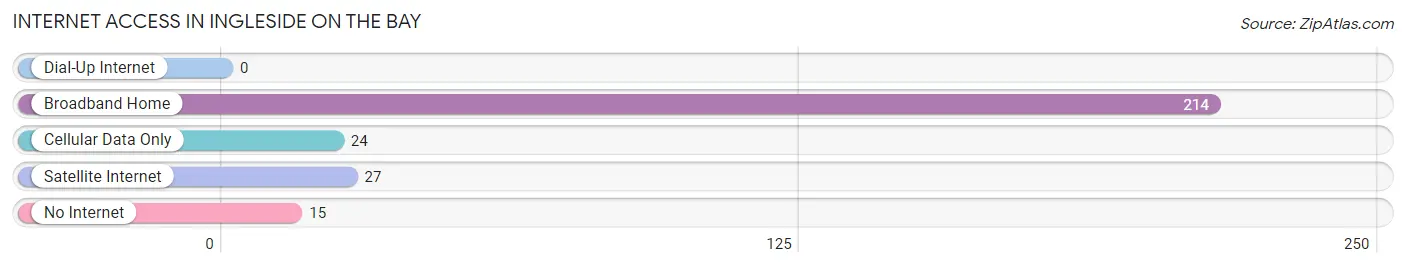
| Internet Type | # Households | % Households |
| Dial-Up Internet | 0 | 0.0% |
| Broadband Home | 214 | 79.8% |
| Cellular Data Only | 24 | 9.0% |
| Satellite Internet | 27 | 10.1% |
| No Internet | 15 | 5.6% |
| Total | 268 | 100.0% |
Ingleside on the Bay Summary
Engleside on the Bay is a small town located in the state of Texas, United States. It is situated on the western shore of Galveston Bay, approximately 25 miles southeast of Houston. The town has a population of approximately 1,000 people and is part of the Galveston-Houston metropolitan area.
History
Engleside on the Bay was founded in 1891 by a group of settlers from England. The town was named after the English settlement of Engleside, which was located in the same area. The settlers were attracted to the area due to its proximity to the bay and the abundance of fish and wildlife.
The town quickly grew and by the early 1900s, it had become a popular tourist destination. The town was known for its beautiful beaches and fishing opportunities. In the 1920s, the town was home to a number of resorts and hotels, including the Engleside Hotel, which was built in 1924.
The town was also home to a number of businesses, including a cannery, a boatyard, and a fish market. The town was also home to a number of churches, including the First Baptist Church of Engleside, which was founded in 1891.
In the 1950s, the town began to decline as the popularity of the beach resorts began to wane. The town was also affected by the construction of the Galveston Causeway, which cut off access to the bay. By the 1970s, the town had become a quiet, rural community.
Geography
Engleside on the Bay is located on the western shore of Galveston Bay, approximately 25 miles southeast of Houston. The town is situated on a peninsula, which is bordered by the bay to the east and the San Jacinto River to the west. The town is located at an elevation of approximately 10 feet above sea level.
The town has a total area of 1.2 square miles, all of which is land. The town is located in a humid subtropical climate zone, with hot, humid summers and mild winters. The average annual temperature is approximately 70 degrees Fahrenheit.
Economy
Engleside on the Bay is a small, rural community with a limited economy. The town is home to a number of small businesses, including a marina, a boatyard, and a fish market. The town is also home to a number of restaurants and bars.
The town is also home to a number of tourist attractions, including the Engleside Hotel, which was built in 1924. The hotel is now a popular destination for weddings and other special events.
Demographics
As of the 2010 census, Engleside on the Bay had a population of 1,000 people. The town has a median household income of $45,000 and a median home value of $150,000. The town is predominantly white, with approximately 90% of the population identifying as white. The town also has a small Hispanic population, with approximately 5% of the population identifying as Hispanic. The town also has a small African American population, with approximately 2% of the population identifying as African American.
Common Questions
What is Per Capita Income in Ingleside on the Bay?
Per Capita income in Ingleside on the Bay is $39,162.
What is the Median Family Income in Ingleside on the Bay?
Median Family Income in Ingleside on the Bay is $88,472.
What is the Median Household income in Ingleside on the Bay?
Median Household Income in Ingleside on the Bay is $81,875.
What is Inequality or Gini Index in Ingleside on the Bay?
Inequality or Gini Index in Ingleside on the Bay is 0.35.
What is the Total Population of Ingleside on the Bay?
Total Population of Ingleside on the Bay is 776.
What is the Total Male Population of Ingleside on the Bay?
Total Male Population of Ingleside on the Bay is 463.
What is the Total Female Population of Ingleside on the Bay?
Total Female Population of Ingleside on the Bay is 313.
What is the Ratio of Males per 100 Females in Ingleside on the Bay?
There are 147.92 Males per 100 Females in Ingleside on the Bay.
What is the Ratio of Females per 100 Males in Ingleside on the Bay?
There are 67.60 Females per 100 Males in Ingleside on the Bay.
What is the Median Population Age in Ingleside on the Bay?
Median Population Age in Ingleside on the Bay is 50.0 Years.
What is the Average Family Size in Ingleside on the Bay
Average Family Size in Ingleside on the Bay is 3.2 People.
What is the Average Household Size in Ingleside on the Bay
Average Household Size in Ingleside on the Bay is 2.9 People.
How Large is the Labor Force in Ingleside on the Bay?
There are 325 People in the Labor Forcein in Ingleside on the Bay.
What is the Percentage of People in the Labor Force in Ingleside on the Bay?
48.4% of People are in the Labor Force in Ingleside on the Bay.
What is the Unemployment Rate in Ingleside on the Bay?
Unemployment Rate in Ingleside on the Bay is 7.4%.