West Orange, TX Map & Demographics
West Orange Map
West Orange Overview
$30,652
PER CAPITA INCOME
$63,750
AVG FAMILY INCOME
$63,409
AVG HOUSEHOLD INCOME
0.41
INEQUALITY / GINI INDEX
3,444
TOTAL POPULATION
1,456
MALE POPULATION
1,988
FEMALE POPULATION
73.24
MALES / 100 FEMALES
136.54
FEMALES / 100 MALES
30.0
MEDIAN AGE
3.1
AVG FAMILY SIZE
2.6
AVG HOUSEHOLD SIZE
1,423
LABOR FORCE [ PEOPLE ]
55.0%
PERCENT IN LABOR FORCE
3.7%
UNEMPLOYMENT RATE
West Orange Area Codes
Income in West Orange
Income Overview in West Orange
Per Capita Income in West Orange is $30,652, while median incomes of families and households are $63,750 and $63,409 respectively.
| Characteristic | Number | Measure |
| Per Capita Income | 3,444 | $30,652 |
| Median Family Income | 956 | $63,750 |
| Mean Family Income | 956 | $88,388 |
| Median Household Income | 1,330 | $63,409 |
| Mean Household Income | 1,330 | $81,694 |
| Income Deficit | 956 | $0 |
| Wage / Income Gap (%) | 3,444 | 0.00% |
| Wage / Income Gap ($) | 3,444 | 100.00¢ per $1 |
| Gini / Inequality Index | 3,444 | 0.41 |
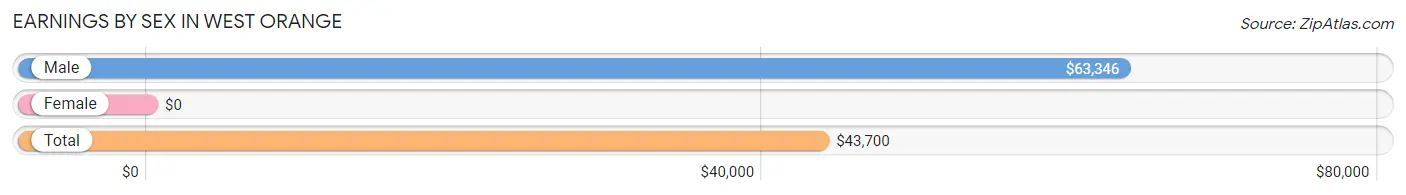
Earnings by Sex in West Orange
| Sex | Number | Average Earnings |
| Male | 802 (54.0%) | $63,346 |
| Female | 682 (46.0%) | $0 |
| Total | 1,484 (100.0%) | $43,700 |
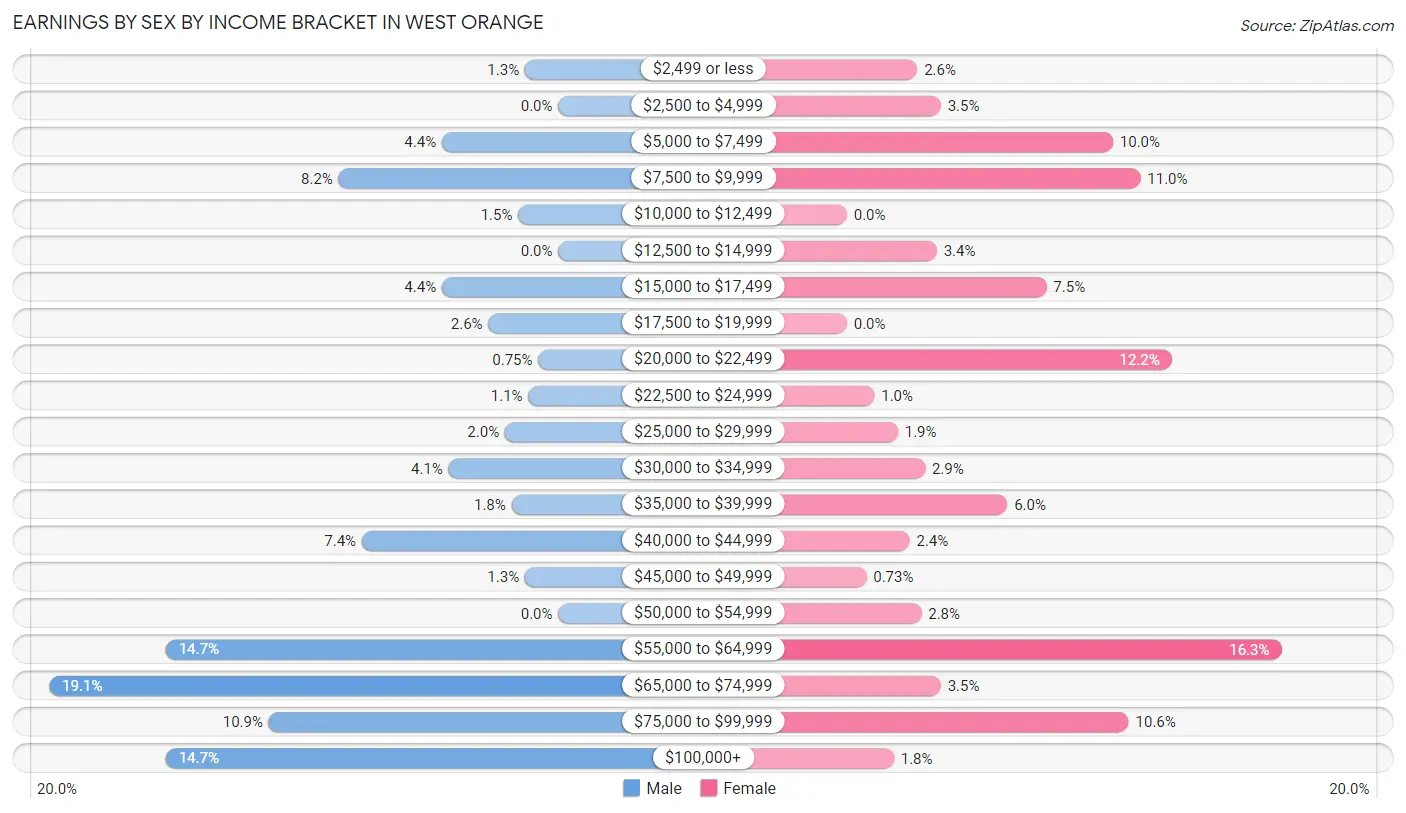
Earnings by Sex by Income Bracket in West Orange
The most common earnings brackets in West Orange are $65,000 to $74,999 for men (153 | 19.1%) and $55,000 to $64,999 for women (111 | 16.3%).
| Income | Male | Female |
| $2,499 or less | 10 (1.3%) | 18 (2.6%) |
| $2,500 to $4,999 | 0 (0.0%) | 24 (3.5%) |
| $5,000 to $7,499 | 35 (4.4%) | 68 (10.0%) |
| $7,500 to $9,999 | 66 (8.2%) | 75 (11.0%) |
| $10,000 to $12,499 | 12 (1.5%) | 0 (0.0%) |
| $12,500 to $14,999 | 0 (0.0%) | 23 (3.4%) |
| $15,000 to $17,499 | 35 (4.4%) | 51 (7.5%) |
| $17,500 to $19,999 | 21 (2.6%) | 0 (0.0%) |
| $20,000 to $22,499 | 6 (0.7%) | 83 (12.2%) |
| $22,500 to $24,999 | 9 (1.1%) | 7 (1.0%) |
| $25,000 to $29,999 | 16 (2.0%) | 13 (1.9%) |
| $30,000 to $34,999 | 33 (4.1%) | 20 (2.9%) |
| $35,000 to $39,999 | 14 (1.8%) | 41 (6.0%) |
| $40,000 to $44,999 | 59 (7.4%) | 16 (2.4%) |
| $45,000 to $49,999 | 10 (1.3%) | 5 (0.7%) |
| $50,000 to $54,999 | 0 (0.0%) | 19 (2.8%) |
| $55,000 to $64,999 | 118 (14.7%) | 111 (16.3%) |
| $65,000 to $74,999 | 153 (19.1%) | 24 (3.5%) |
| $75,000 to $99,999 | 87 (10.8%) | 72 (10.6%) |
| $100,000+ | 118 (14.7%) | 12 (1.8%) |
| Total | 802 (100.0%) | 682 (100.0%) |
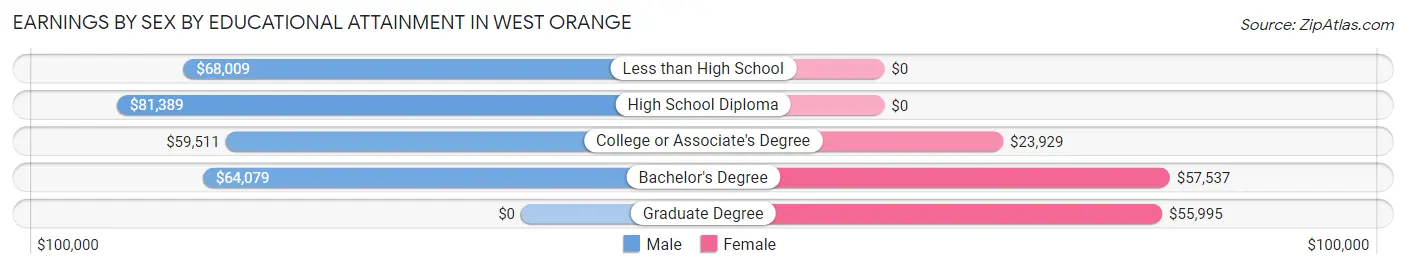
Earnings by Sex by Educational Attainment in West Orange
Average earnings in West Orange are $65,403 for men and $35,000 for women, a difference of 46.5%. Men with an educational attainment of high school diploma enjoy the highest average annual earnings of $81,389, while those with college or associate's degree education earn the least with $59,511. Women with an educational attainment of bachelor's degree earn the most with the average annual earnings of $57,537, while those with college or associate's degree education have the smallest earnings of $23,929.
| Educational Attainment | Male Income | Female Income |
| Less than High School | $68,009 | $0 |
| High School Diploma | $81,389 | $0 |
| College or Associate's Degree | $59,511 | $23,929 |
| Bachelor's Degree | $64,079 | $57,537 |
| Graduate Degree | - | - |
| Total | $65,403 | $35,000 |
Family Income in West Orange
Family Income Brackets in West Orange
According to the West Orange family income data, there are 299 families falling into the $100,000 to $149,999 income range, which is the most common income bracket and makes up 31.3% of all families.
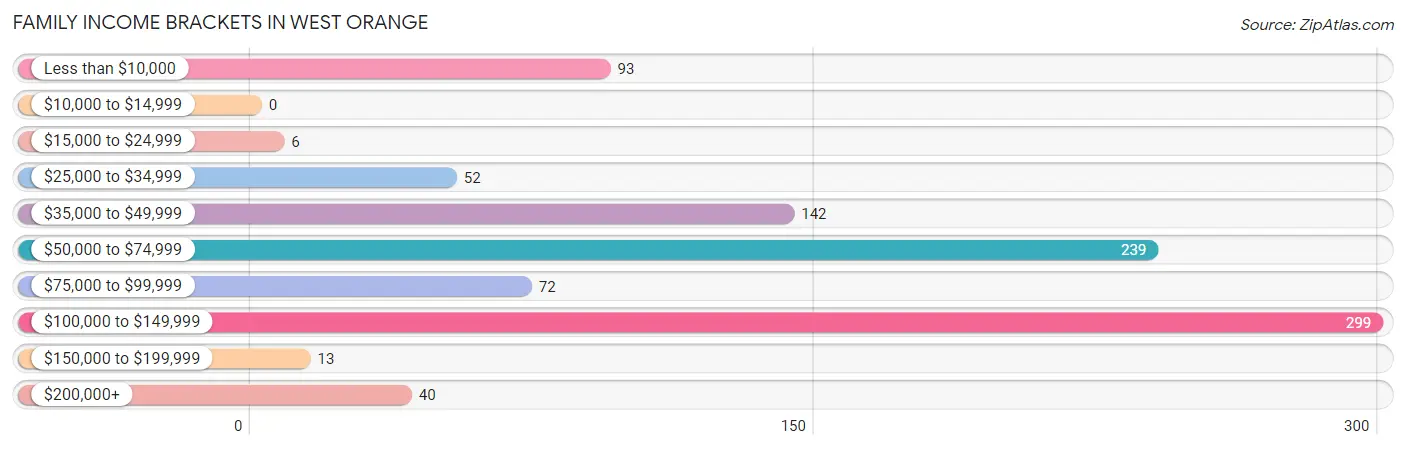
| Income Bracket | # Families | % Families |
| Less than $10,000 | 93 | 9.7% |
| $10,000 to $14,999 | 0 | 0.0% |
| $15,000 to $24,999 | 6 | 0.6% |
| $25,000 to $34,999 | 52 | 5.4% |
| $35,000 to $49,999 | 142 | 14.9% |
| $50,000 to $74,999 | 239 | 25.0% |
| $75,000 to $99,999 | 72 | 7.5% |
| $100,000 to $149,999 | 299 | 31.3% |
| $150,000 to $199,999 | 13 | 1.4% |
| $200,000+ | 40 | 4.2% |
Family Income by Famaliy Size in West Orange
3-person families (263 | 27.5%) account for the highest median family income in West Orange with $100,688 per family, while 3-person families (263 | 27.5%) have the highest median income of $33,563 per family member.
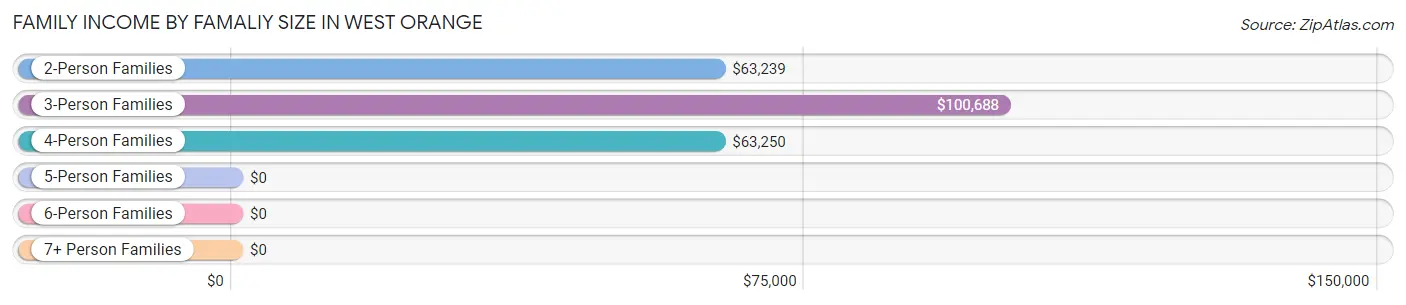
| Income Bracket | # Families | Median Income |
| 2-Person Families | 463 (48.4%) | $63,239 |
| 3-Person Families | 263 (27.5%) | $100,688 |
| 4-Person Families | 56 (5.9%) | $63,250 |
| 5-Person Families | 145 (15.2%) | $0 |
| 6-Person Families | 29 (3.0%) | $0 |
| 7+ Person Families | 0 (0.0%) | $0 |
| Total | 956 (100.0%) | $63,750 |
Family Income by Number of Earners in West Orange
The median family income in West Orange is $63,750, with families comprising 2 earners (370) having the highest median family income of $124,048, while families with no earners (210) have the lowest median family income of $41,477, accounting for 38.7% and 22.0% of families, respectively.
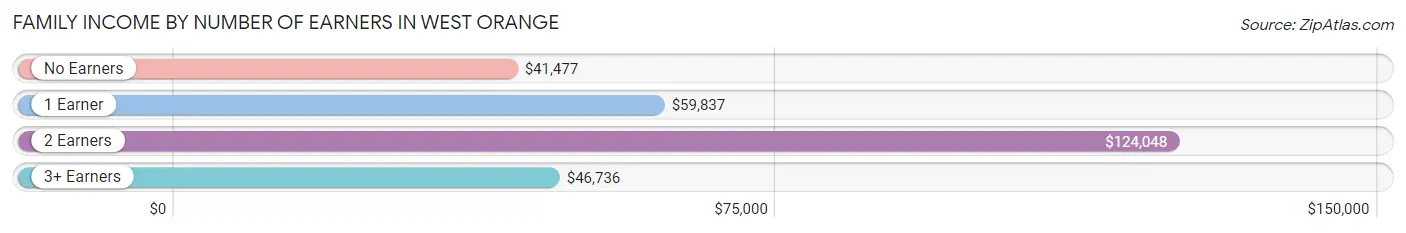
| Number of Earners | # Families | Median Income |
| No Earners | 210 (22.0%) | $41,477 |
| 1 Earner | 326 (34.1%) | $59,837 |
| 2 Earners | 370 (38.7%) | $124,048 |
| 3+ Earners | 50 (5.2%) | $46,736 |
| Total | 956 (100.0%) | $63,750 |
Household Income in West Orange
Household Income Brackets in West Orange
With 367 households falling in the category, the $50,000 to $74,999 income range is the most frequent in West Orange, accounting for 27.6% of all households. In contrast, only 7 households (0.5%) fall into the $10,000 to $14,999 income bracket, making it the least populous group.
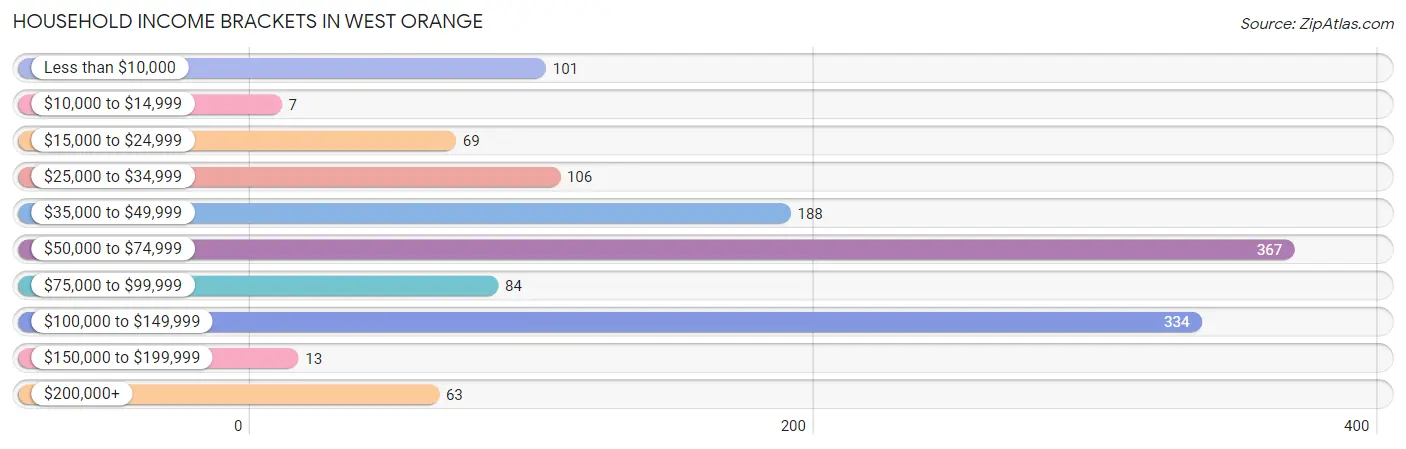
| Income Bracket | # Households | % Households |
| Less than $10,000 | 101 | 7.6% |
| $10,000 to $14,999 | 7 | 0.5% |
| $15,000 to $24,999 | 69 | 5.2% |
| $25,000 to $34,999 | 106 | 8.0% |
| $35,000 to $49,999 | 188 | 14.1% |
| $50,000 to $74,999 | 367 | 27.6% |
| $75,000 to $99,999 | 84 | 6.3% |
| $100,000 to $149,999 | 334 | 25.1% |
| $150,000 to $199,999 | 13 | 1.0% |
| $200,000+ | 63 | 4.7% |
Household Income by Householder Age in West Orange
The median household income in West Orange is $63,409, with the highest median household income of $94,083 found in the 25 to 44 years age bracket for the primary householder. A total of 411 households (30.9%) fall into this category. Meanwhile, the 15 to 24 years age bracket for the primary householder has the lowest median household income of $0, with 133 households (10.0%) in this group.
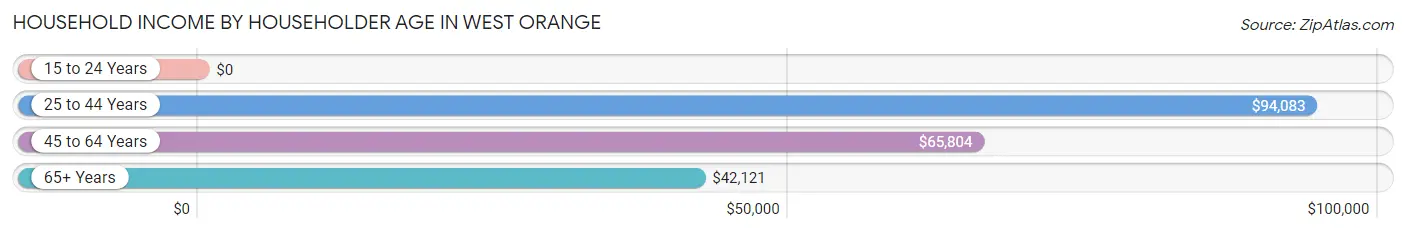
| Income Bracket | # Households | Median Income |
| 15 to 24 Years | 133 (10.0%) | $0 |
| 25 to 44 Years | 411 (30.9%) | $94,083 |
| 45 to 64 Years | 392 (29.5%) | $65,804 |
| 65+ Years | 394 (29.6%) | $42,121 |
| Total | 1,330 (100.0%) | $63,409 |
Poverty in West Orange
Income Below Poverty by Sex and Age in West Orange
With 19.7% poverty level for males and 11.7% for females among the residents of West Orange, 5 year old males and 18 to 24 year old females are the most vulnerable to poverty, with 17 males (100.0%) and 105 females (34.6%) in their respective age groups living below the poverty level.
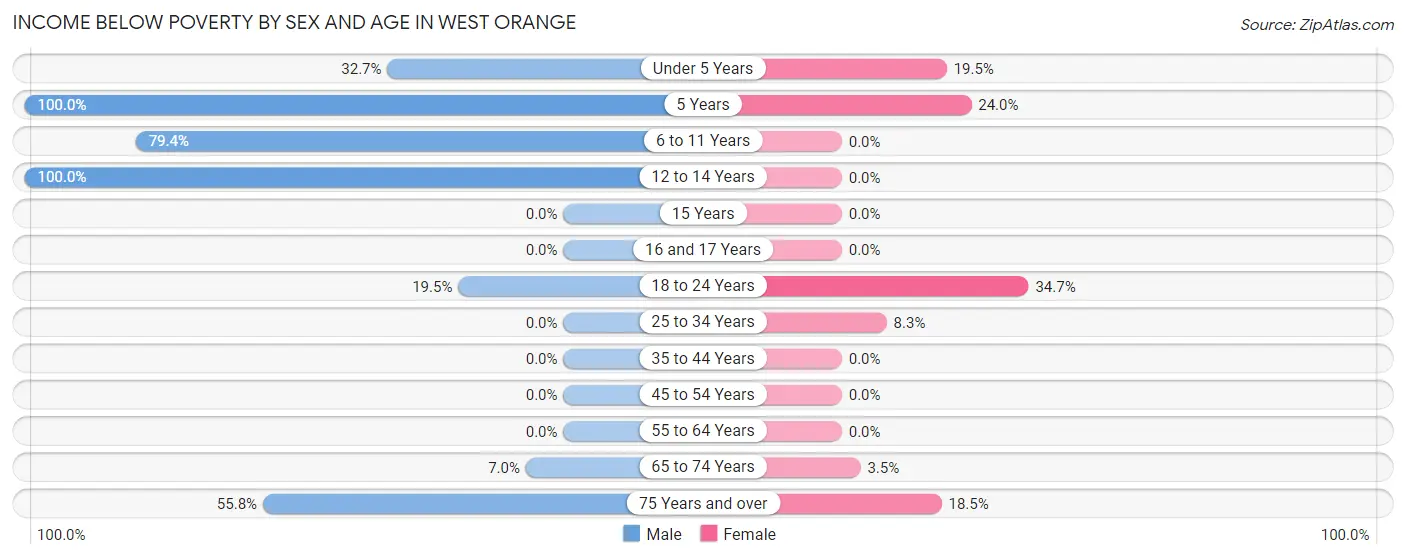
| Age Bracket | Male | Female |
| Under 5 Years | 49 (32.7%) | 44 (19.5%) |
| 5 Years | 17 (100.0%) | 31 (24.0%) |
| 6 to 11 Years | 100 (79.4%) | 0 (0.0%) |
| 12 to 14 Years | 50 (100.0%) | 0 (0.0%) |
| 15 Years | 0 (0.0%) | 0 (0.0%) |
| 16 and 17 Years | 0 (0.0%) | 0 (0.0%) |
| 18 to 24 Years | 24 (19.5%) | 105 (34.6%) |
| 25 to 34 Years | 0 (0.0%) | 24 (8.3%) |
| 35 to 44 Years | 0 (0.0%) | 0 (0.0%) |
| 45 to 54 Years | 0 (0.0%) | 0 (0.0%) |
| 55 to 64 Years | 0 (0.0%) | 0 (0.0%) |
| 65 to 74 Years | 14 (7.0%) | 9 (3.5%) |
| 75 Years and over | 29 (55.8%) | 20 (18.5%) |
| Total | 283 (19.7%) | 233 (11.7%) |
Income Above Poverty by Sex and Age in West Orange
According to the poverty statistics in West Orange, males aged 15 years and females aged 6 to 11 years are the age groups that are most secure financially, with 100.0% of males and 100.0% of females in these age groups living above the poverty line.
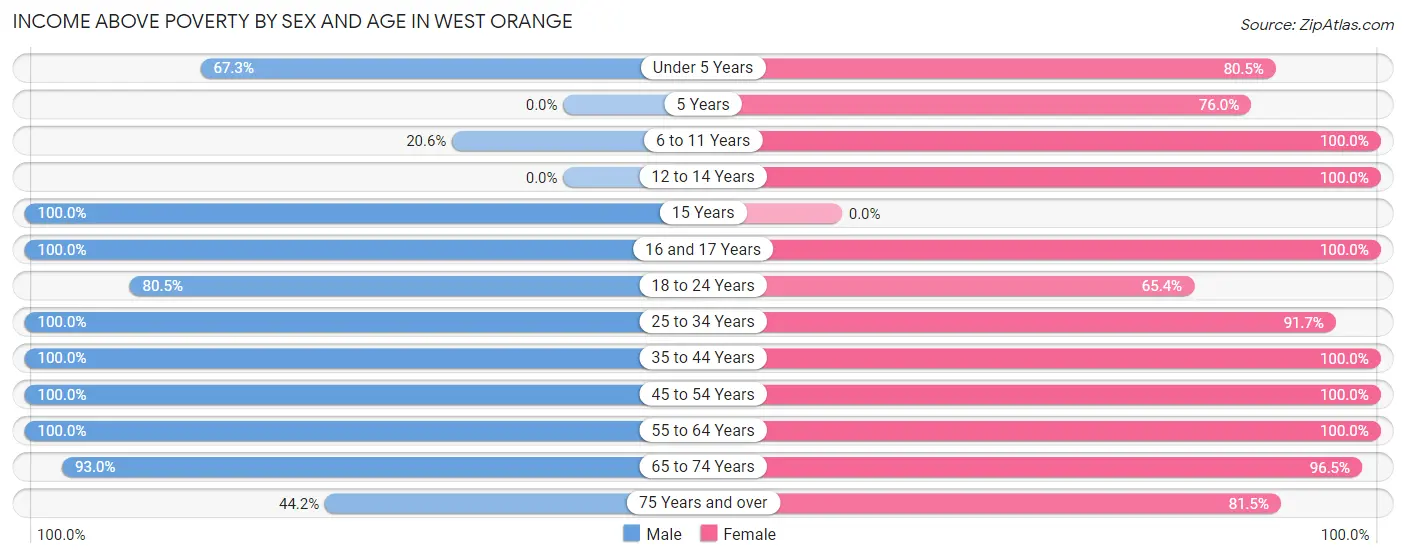
| Age Bracket | Male | Female |
| Under 5 Years | 101 (67.3%) | 182 (80.5%) |
| 5 Years | 0 (0.0%) | 98 (76.0%) |
| 6 to 11 Years | 26 (20.6%) | 86 (100.0%) |
| 12 to 14 Years | 0 (0.0%) | 18 (100.0%) |
| 15 Years | 39 (100.0%) | 0 (0.0%) |
| 16 and 17 Years | 34 (100.0%) | 40 (100.0%) |
| 18 to 24 Years | 99 (80.5%) | 198 (65.3%) |
| 25 to 34 Years | 275 (100.0%) | 264 (91.7%) |
| 35 to 44 Years | 73 (100.0%) | 175 (100.0%) |
| 45 to 54 Years | 151 (100.0%) | 123 (100.0%) |
| 55 to 64 Years | 149 (100.0%) | 233 (100.0%) |
| 65 to 74 Years | 187 (93.0%) | 250 (96.5%) |
| 75 Years and over | 23 (44.2%) | 88 (81.5%) |
| Total | 1,157 (80.3%) | 1,755 (88.3%) |
Income Below Poverty Among Married-Couple Families in West Orange
The poverty statistics for married-couple families in West Orange show that 1.0% or 6 of the total 616 families live below the poverty line. Families with 1 or 2 children have the highest poverty rate of 2.4%, comprising of 6 families. On the other hand, families with no children have the lowest poverty rate of 0.0%, which includes 0 families.
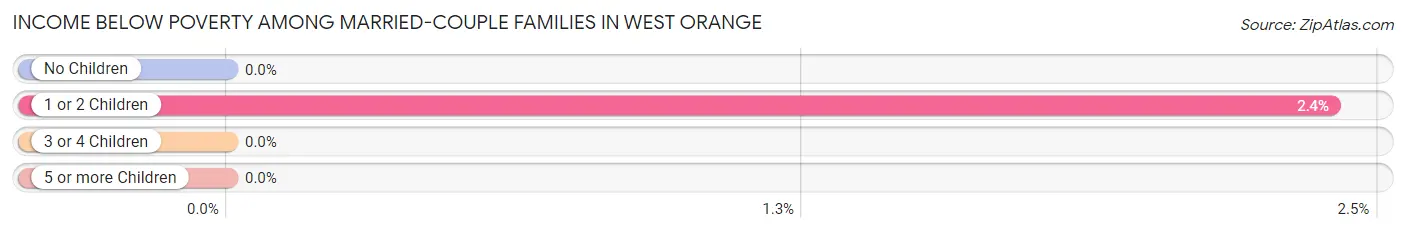
| Children | Above Poverty | Below Poverty |
| No Children | 287 (100.0%) | 0 (0.0%) |
| 1 or 2 Children | 244 (97.6%) | 6 (2.4%) |
| 3 or 4 Children | 79 (100.0%) | 0 (0.0%) |
| 5 or more Children | 0 (0.0%) | 0 (0.0%) |
| Total | 610 (99.0%) | 6 (1.0%) |
Income Below Poverty Among Single-Parent Households in West Orange
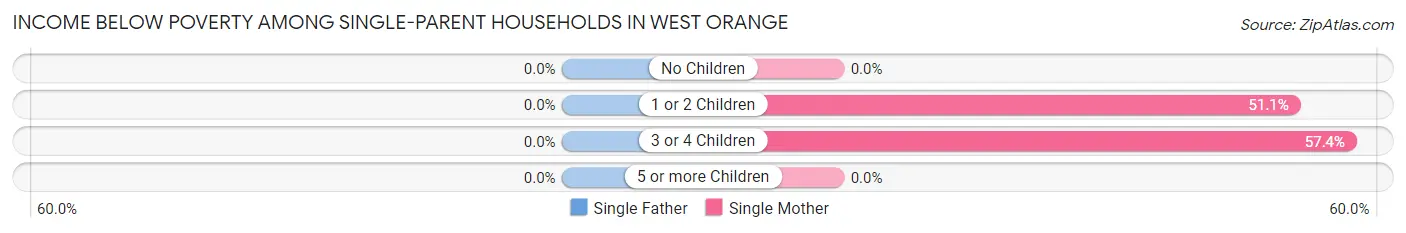
| Children | Single Father | Single Mother |
| No Children | 0 (0.0%) | 0 (0.0%) |
| 1 or 2 Children | 0 (0.0%) | 48 (51.1%) |
| 3 or 4 Children | 0 (0.0%) | 39 (57.4%) |
| 5 or more Children | 0 (0.0%) | 0 (0.0%) |
| Total | 0 (0.0%) | 87 (31.0%) |
Income Below Poverty Among Married-Couple vs Single-Parent Households in West Orange
The poverty data for West Orange shows that 6 of the married-couple family households (1.0%) and 87 of the single-parent households (25.6%) are living below the poverty level. Within the married-couple family households, those with 1 or 2 children have the highest poverty rate, with 6 households (2.4%) falling below the poverty line. Among the single-parent households, those with 3 or 4 children have the highest poverty rate, with 39 household (57.4%) living below poverty.
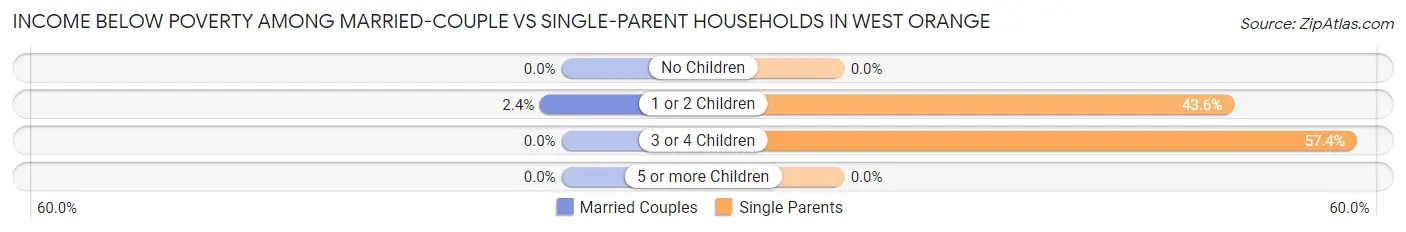
| Children | Married-Couple Families | Single-Parent Households |
| No Children | 0 (0.0%) | 0 (0.0%) |
| 1 or 2 Children | 6 (2.4%) | 48 (43.6%) |
| 3 or 4 Children | 0 (0.0%) | 39 (57.4%) |
| 5 or more Children | 0 (0.0%) | 0 (0.0%) |
| Total | 6 (1.0%) | 87 (25.6%) |
Race in West Orange
The most populous races in West Orange are White / Caucasian (2,456 | 71.3%), Black / African American (502 | 14.6%), and Two or more Races (434 | 12.6%).
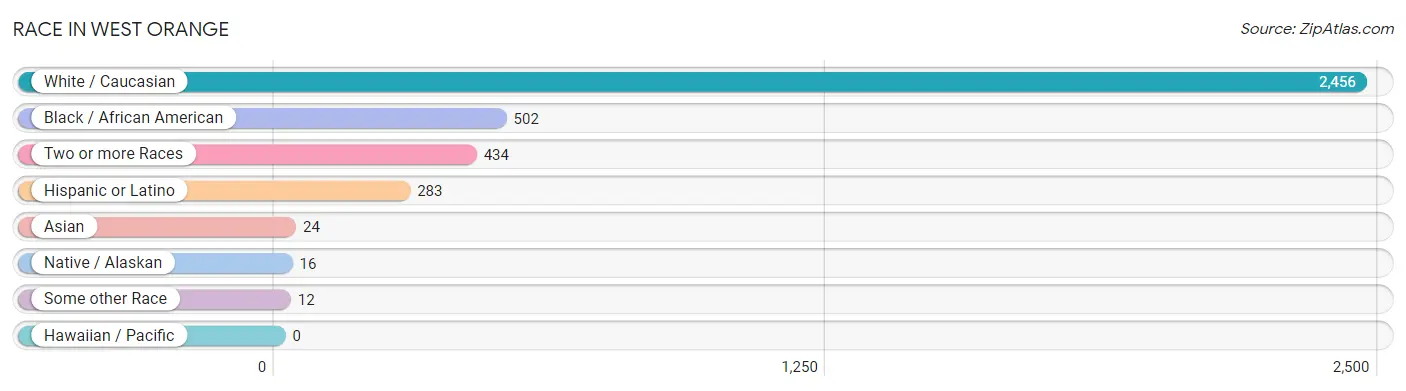
| Race | # Population | % Population |
| Asian | 24 | 0.7% |
| Black / African American | 502 | 14.6% |
| Hawaiian / Pacific | 0 | 0.0% |
| Hispanic or Latino | 283 | 8.2% |
| Native / Alaskan | 16 | 0.5% |
| White / Caucasian | 2,456 | 71.3% |
| Two or more Races | 434 | 12.6% |
| Some other Race | 12 | 0.4% |
| Total | 3,444 | 100.0% |
Ancestry in West Orange
The most populous ancestries reported in West Orange are Irish (540 | 15.7%), English (363 | 10.5%), German (314 | 9.1%), French (263 | 7.6%), and Mexican (197 | 5.7%), together accounting for 48.7% of all West Orange residents.
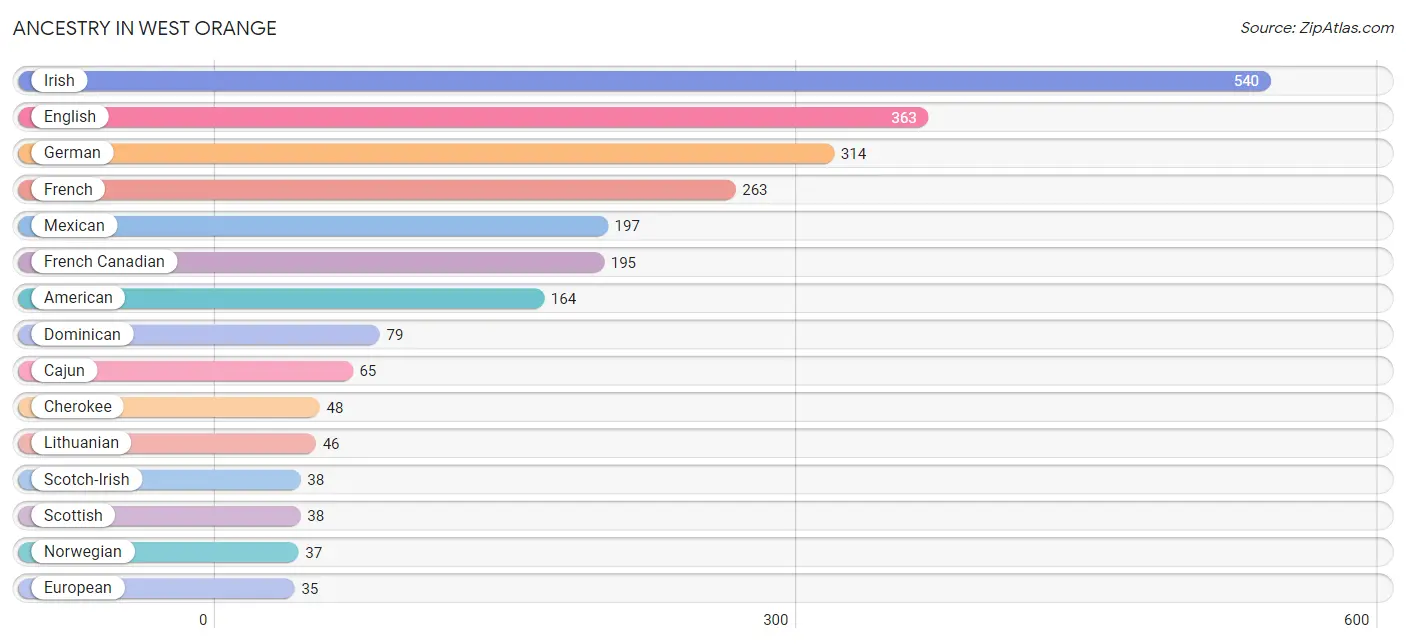
| Ancestry | # Population | % Population |
| American | 164 | 4.8% |
| Cajun | 65 | 1.9% |
| Cherokee | 48 | 1.4% |
| Czech | 9 | 0.3% |
| Dominican | 79 | 2.3% |
| Dutch | 21 | 0.6% |
| English | 363 | 10.5% |
| European | 35 | 1.0% |
| French | 263 | 7.6% |
| French Canadian | 195 | 5.7% |
| German | 314 | 9.1% |
| Greek | 12 | 0.4% |
| Irish | 540 | 15.7% |
| Italian | 16 | 0.5% |
| Korean | 24 | 0.7% |
| Lithuanian | 46 | 1.3% |
| Mexican | 197 | 5.7% |
| Norwegian | 37 | 1.1% |
| Polish | 9 | 0.3% |
| Scotch-Irish | 38 | 1.1% |
| Scottish | 38 | 1.1% |
| Spanish | 7 | 0.2% |
| Swedish | 28 | 0.8% | View All 23 Rows |
Immigrants in West Orange
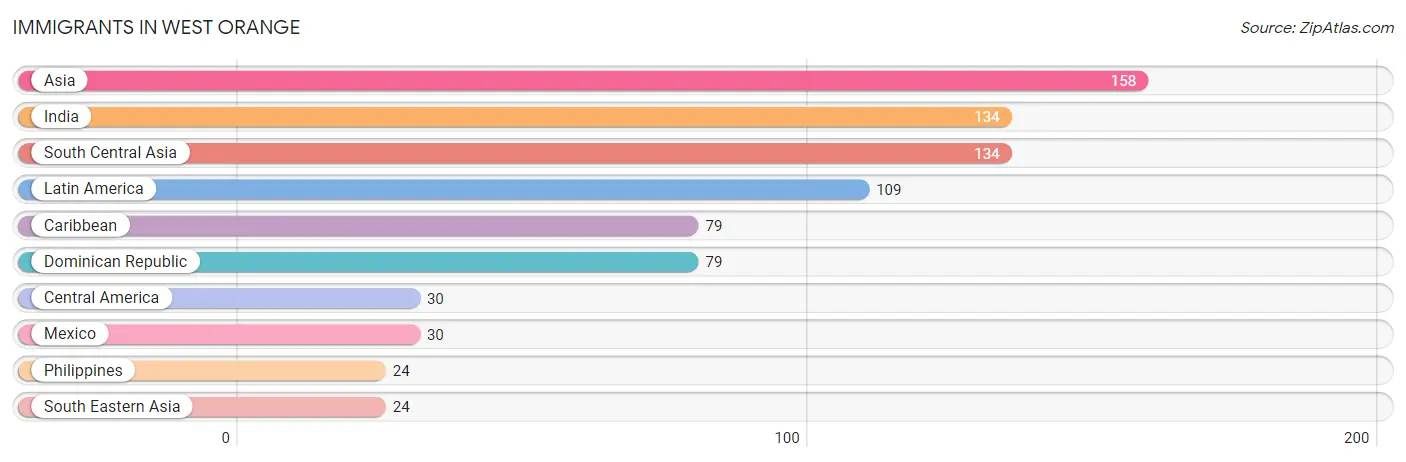
The most numerous immigrant groups reported in West Orange came from Asia (158 | 4.6%), India (134 | 3.9%), South Central Asia (134 | 3.9%), Latin America (109 | 3.2%), and Caribbean (79 | 2.3%), together accounting for 17.8% of all West Orange residents.
| Immigration Origin | # Population | % Population |
| Asia | 158 | 4.6% |
| Caribbean | 79 | 2.3% |
| Central America | 30 | 0.9% |
| Dominican Republic | 79 | 2.3% |
| India | 134 | 3.9% |
| Latin America | 109 | 3.2% |
| Mexico | 30 | 0.9% |
| Philippines | 24 | 0.7% |
| South Central Asia | 134 | 3.9% |
| South Eastern Asia | 24 | 0.7% | View All 10 Rows |
Sex and Age in West Orange
Sex and Age in West Orange
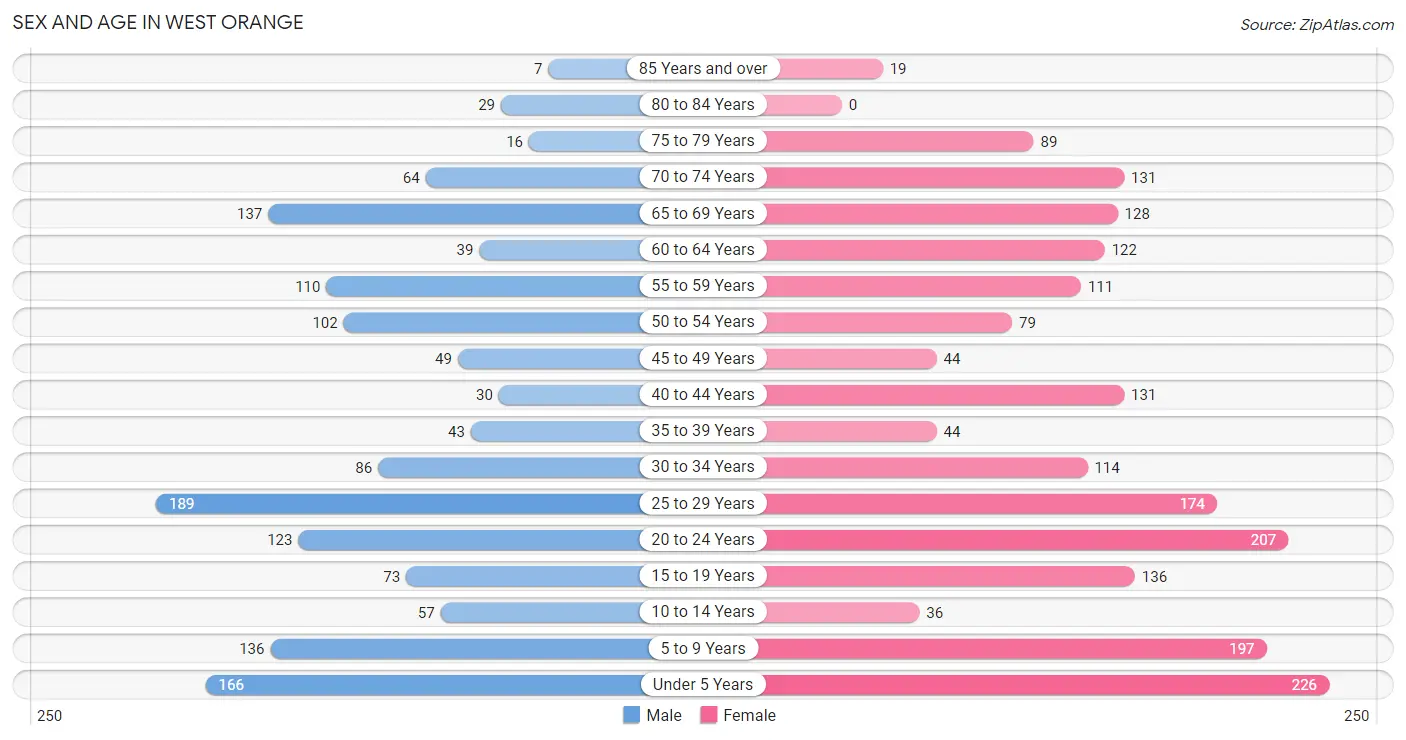
The most populous age groups in West Orange are 25 to 29 Years (189 | 13.0%) for men and Under 5 Years (226 | 11.4%) for women.
| Age Bracket | Male | Female |
| Under 5 Years | 166 (11.4%) | 226 (11.4%) |
| 5 to 9 Years | 136 (9.3%) | 197 (9.9%) |
| 10 to 14 Years | 57 (3.9%) | 36 (1.8%) |
| 15 to 19 Years | 73 (5.0%) | 136 (6.8%) |
| 20 to 24 Years | 123 (8.5%) | 207 (10.4%) |
| 25 to 29 Years | 189 (13.0%) | 174 (8.7%) |
| 30 to 34 Years | 86 (5.9%) | 114 (5.7%) |
| 35 to 39 Years | 43 (2.9%) | 44 (2.2%) |
| 40 to 44 Years | 30 (2.1%) | 131 (6.6%) |
| 45 to 49 Years | 49 (3.4%) | 44 (2.2%) |
| 50 to 54 Years | 102 (7.0%) | 79 (4.0%) |
| 55 to 59 Years | 110 (7.5%) | 111 (5.6%) |
| 60 to 64 Years | 39 (2.7%) | 122 (6.1%) |
| 65 to 69 Years | 137 (9.4%) | 128 (6.4%) |
| 70 to 74 Years | 64 (4.4%) | 131 (6.6%) |
| 75 to 79 Years | 16 (1.1%) | 89 (4.5%) |
| 80 to 84 Years | 29 (2.0%) | 0 (0.0%) |
| 85 Years and over | 7 (0.5%) | 19 (1.0%) |
| Total | 1,456 (100.0%) | 1,988 (100.0%) |
Families and Households in West Orange
Median Family Size in West Orange
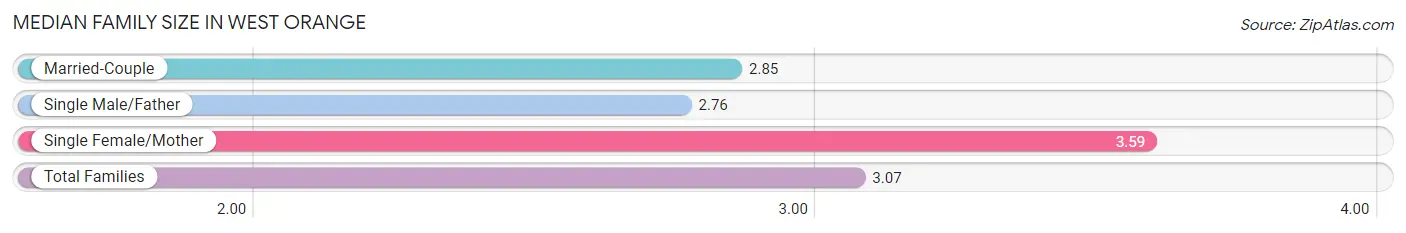
The median family size in West Orange is 3.07 persons per family, with single female/mother families (281 | 29.4%) accounting for the largest median family size of 3.59 persons per family. On the other hand, single male/father families (59 | 6.2%) represent the smallest median family size with 2.76 persons per family.
| Family Type | # Families | Family Size |
| Married-Couple | 616 (64.4%) | 2.85 |
| Single Male/Father | 59 (6.2%) | 2.76 |
| Single Female/Mother | 281 (29.4%) | 3.59 |
| Total Families | 956 (100.0%) | 3.07 |
Median Household Size in West Orange
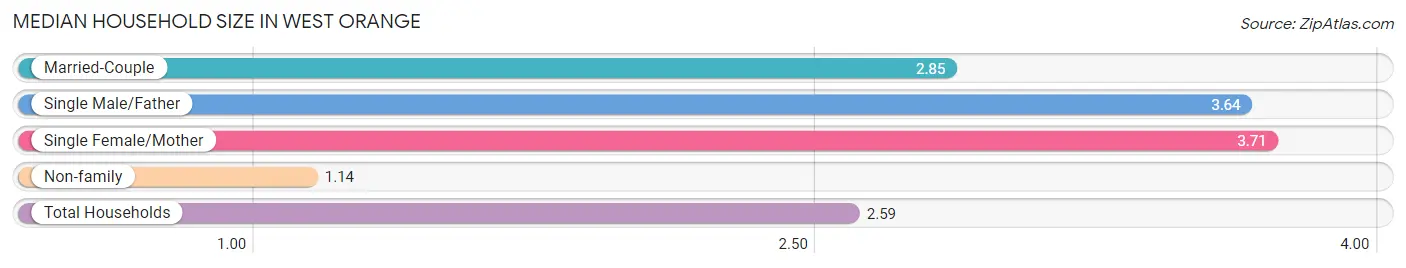
The median household size in West Orange is 2.59 persons per household, with single female/mother households (281 | 21.1%) accounting for the largest median household size of 3.71 persons per household. non-family households (374 | 28.1%) represent the smallest median household size with 1.14 persons per household.
| Household Type | # Households | Household Size |
| Married-Couple | 616 (46.3%) | 2.85 |
| Single Male/Father | 59 (4.4%) | 3.64 |
| Single Female/Mother | 281 (21.1%) | 3.71 |
| Non-family | 374 (28.1%) | 1.14 |
| Total Households | 1,330 (100.0%) | 2.59 |
Household Size by Marriage Status in West Orange
Out of a total of 1,330 households in West Orange, 956 (71.9%) are family households, while 374 (28.1%) are nonfamily households. The most numerous type of family households are 2-person households, comprising 424, and the most common type of nonfamily households are 1-person households, comprising 283.
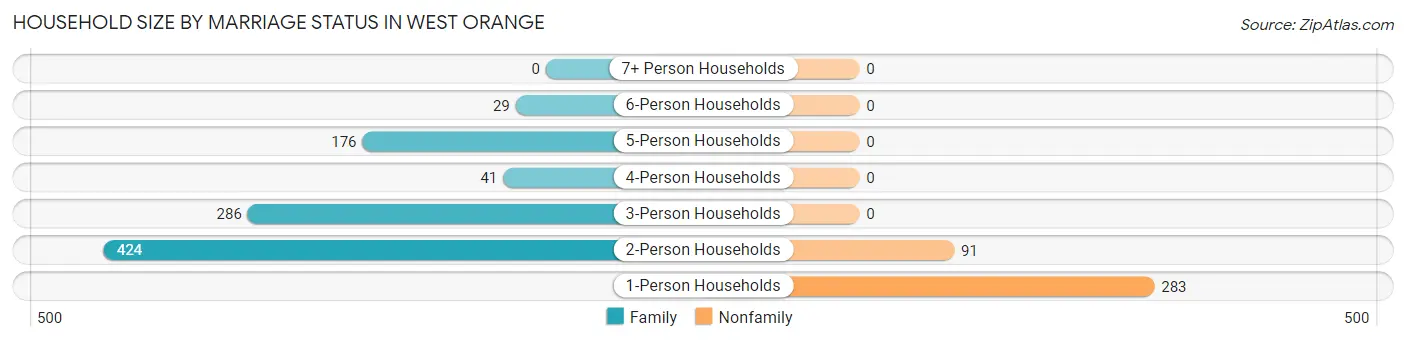
| Household Size | Family Households | Nonfamily Households |
| 1-Person Households | - | 283 (21.3%) |
| 2-Person Households | 424 (31.9%) | 91 (6.8%) |
| 3-Person Households | 286 (21.5%) | 0 (0.0%) |
| 4-Person Households | 41 (3.1%) | 0 (0.0%) |
| 5-Person Households | 176 (13.2%) | 0 (0.0%) |
| 6-Person Households | 29 (2.2%) | 0 (0.0%) |
| 7+ Person Households | 0 (0.0%) | 0 (0.0%) |
| Total | 956 (71.9%) | 374 (28.1%) |
Female Fertility in West Orange
Fertility by Age in West Orange
Average fertility rate in West Orange is 88.0 births per 1,000 women. Women in the age bracket of 20 to 34 years have the highest fertility rate with 152.0 births per 1,000 women. Women in the age bracket of 20 to 34 years acount for 100.0% of all women with births.
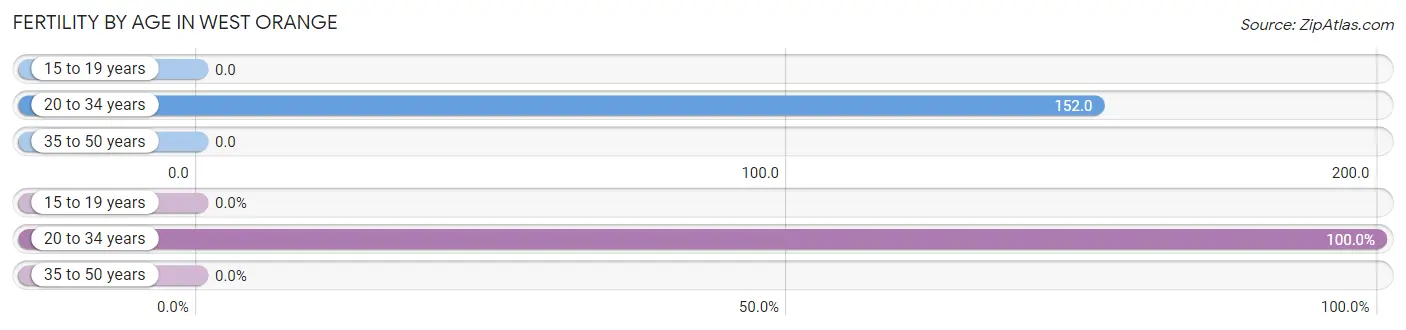
| Age Bracket | Women with Births | Births / 1,000 Women |
| 15 to 19 years | 0 (0.0%) | 0.0 |
| 20 to 34 years | 75 (100.0%) | 152.0 |
| 35 to 50 years | 0 (0.0%) | 0.0 |
| Total | 75 (100.0%) | 88.0 |
Fertility by Age by Marriage Status in West Orange
65.3% of women with births (75) in West Orange are married. The highest percentage of unmarried women with births falls into 20 to 34 years age bracket with 34.7% of them unmarried at the time of birth, while the lowest percentage of unmarried women with births belong to 20 to 34 years age bracket with 34.7% of them unmarried.
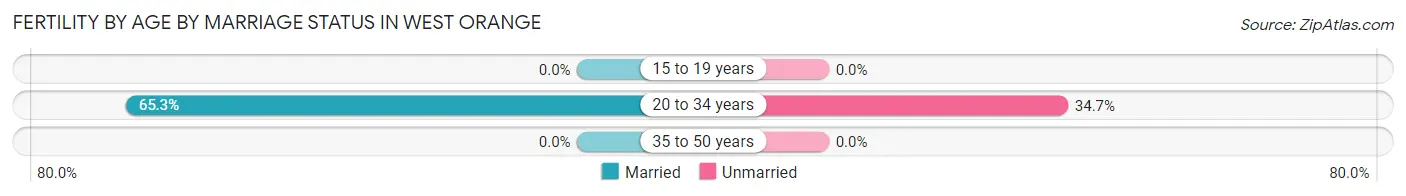
| Age Bracket | Married | Unmarried |
| 15 to 19 years | 0 (0.0%) | 0 (0.0%) |
| 20 to 34 years | 49 (65.3%) | 26 (34.7%) |
| 35 to 50 years | 0 (0.0%) | 0 (0.0%) |
| Total | 49 (65.3%) | 26 (34.7%) |
Fertility by Education in West Orange
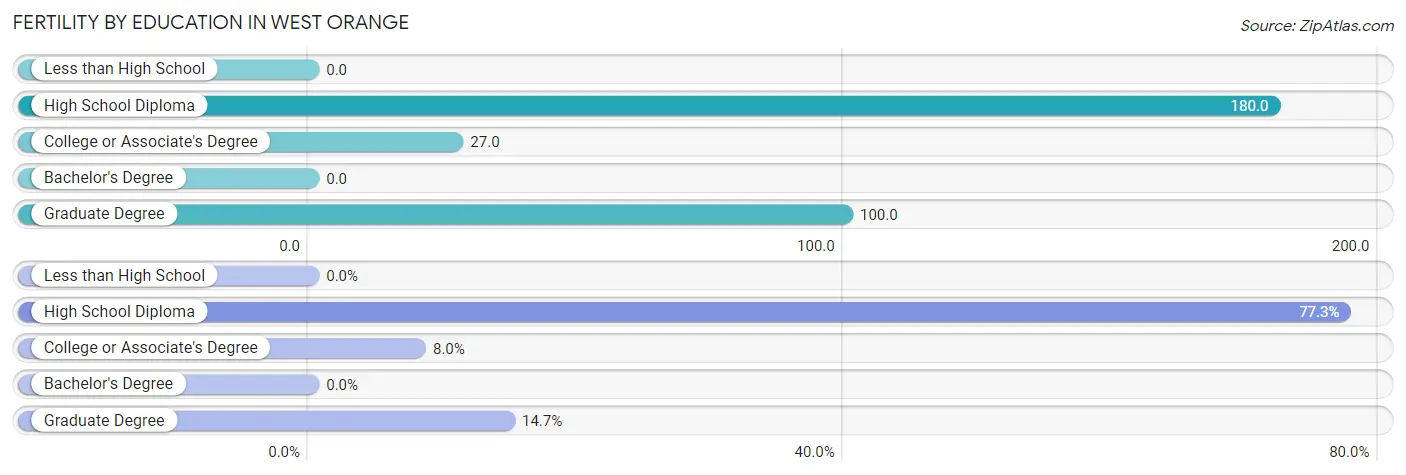
| Educational Attainment | Women with Births | Births / 1,000 Women |
| Less than High School | 0 (0.0%) | 0.0 |
| High School Diploma | 58 (77.3%) | 180.0 |
| College or Associate's Degree | 6 (8.0%) | 27.0 |
| Bachelor's Degree | 0 (0.0%) | 0.0 |
| Graduate Degree | 11 (14.7%) | 100.0 |
| Total | 75 (100.0%) | 88.0 |
Fertility by Education by Marriage Status in West Orange
34.7% of women with births in West Orange are unmarried. Women with the educational attainment of college or associate's degree are most likely to be married with 100.0% of them married at childbirth, while women with the educational attainment of high school diploma are least likely to be married with 44.8% of them unmarried at childbirth.
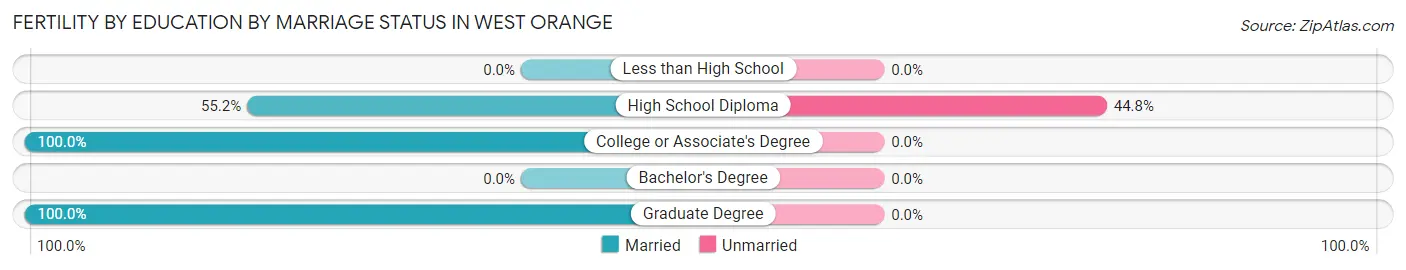
| Educational Attainment | Married | Unmarried |
| Less than High School | 0 (0.0%) | 0 (0.0%) |
| High School Diploma | 32 (55.2%) | 26 (44.8%) |
| College or Associate's Degree | 6 (100.0%) | 0 (0.0%) |
| Bachelor's Degree | 0 (0.0%) | 0 (0.0%) |
| Graduate Degree | 11 (100.0%) | 0 (0.0%) |
| Total | 49 (65.3%) | 26 (34.7%) |
Employment Characteristics in West Orange
Employment by Class of Employer in West Orange
Among the 1,335 employed individuals in West Orange, private company employees (940 | 70.4%), not-for-profit organizations (157 | 11.8%), and local government employees (150 | 11.2%) make up the most common classes of employment.
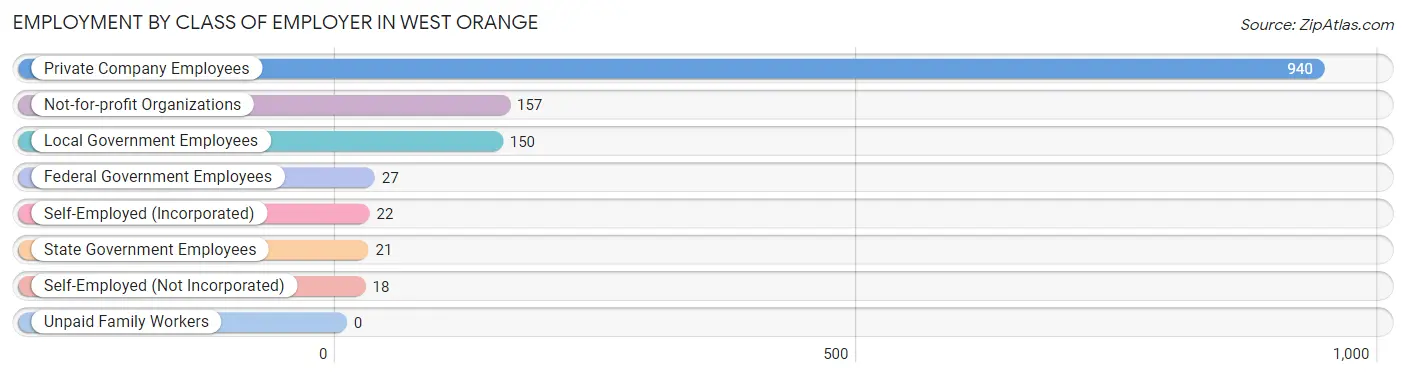
| Employer Class | # Employees | % Employees |
| Private Company Employees | 940 | 70.4% |
| Self-Employed (Incorporated) | 22 | 1.7% |
| Self-Employed (Not Incorporated) | 18 | 1.3% |
| Not-for-profit Organizations | 157 | 11.8% |
| Local Government Employees | 150 | 11.2% |
| State Government Employees | 21 | 1.6% |
| Federal Government Employees | 27 | 2.0% |
| Unpaid Family Workers | 0 | 0.0% |
| Total | 1,335 | 100.0% |
Employment Status by Age in West Orange
According to the labor force statistics for West Orange, out of the total population over 16 years of age (2,587), 55.0% or 1,423 individuals are in the labor force, with 3.7% or 53 of them unemployed. The age group with the highest labor force participation rate is 35 to 44 years, with 100.0% or 248 individuals in the labor force. Within the labor force, the 20 to 24 years age range has the highest percentage of unemployed individuals, with 20.4% or 28 of them being unemployed.
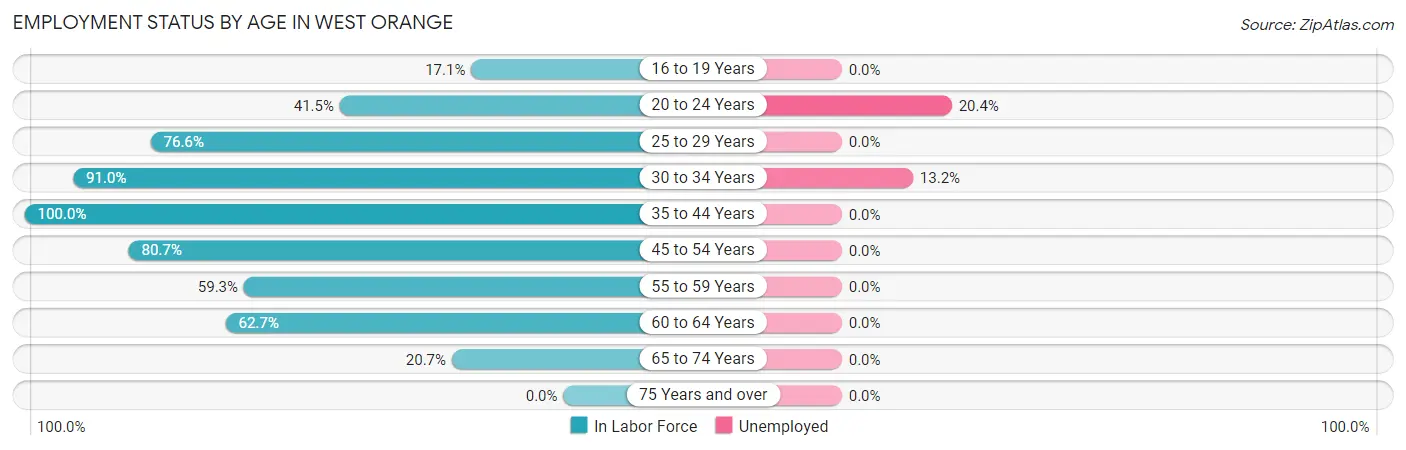
| Age Bracket | In Labor Force | Unemployed |
| 16 to 19 Years | 29 (17.1%) | 0 (0.0%) |
| 20 to 24 Years | 137 (41.5%) | 28 (20.4%) |
| 25 to 29 Years | 278 (76.6%) | 0 (0.0%) |
| 30 to 34 Years | 182 (91.0%) | 24 (13.2%) |
| 35 to 44 Years | 248 (100.0%) | 0 (0.0%) |
| 45 to 54 Years | 221 (80.7%) | 0 (0.0%) |
| 55 to 59 Years | 131 (59.3%) | 0 (0.0%) |
| 60 to 64 Years | 101 (62.7%) | 0 (0.0%) |
| 65 to 74 Years | 95 (20.7%) | 0 (0.0%) |
| 75 Years and over | 0 (0.0%) | 0 (0.0%) |
| Total | 1,423 (55.0%) | 53 (3.7%) |
Employment Status by Educational Attainment in West Orange
According to labor force statistics for West Orange, 79.1% of individuals (1,160) out of the total population between 25 and 64 years of age (1,467) are in the labor force, with 2.1% or 24 of them being unemployed. The group with the highest labor force participation rate are those with the educational attainment of college / associate degree, with 95.1% or 509 individuals in the labor force. Within the labor force, individuals with college / associate degree education have the highest percentage of unemployment, with 4.7% or 24 of them being unemployed.
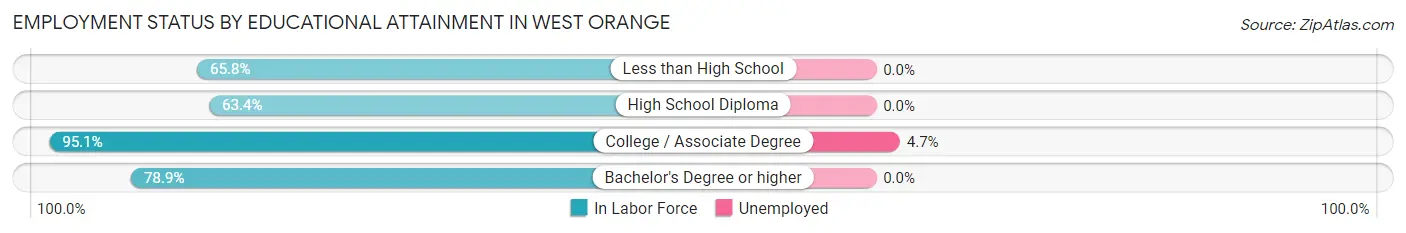
| Educational Attainment | In Labor Force | Unemployed |
| Less than High School | 169 (65.8%) | 0 (0.0%) |
| High School Diploma | 203 (63.4%) | 0 (0.0%) |
| College / Associate Degree | 509 (95.1%) | 25 (4.7%) |
| Bachelor's Degree or higher | 280 (78.9%) | 0 (0.0%) |
| Total | 1,160 (79.1%) | 31 (2.1%) |
Employment Occupations by Sex in West Orange
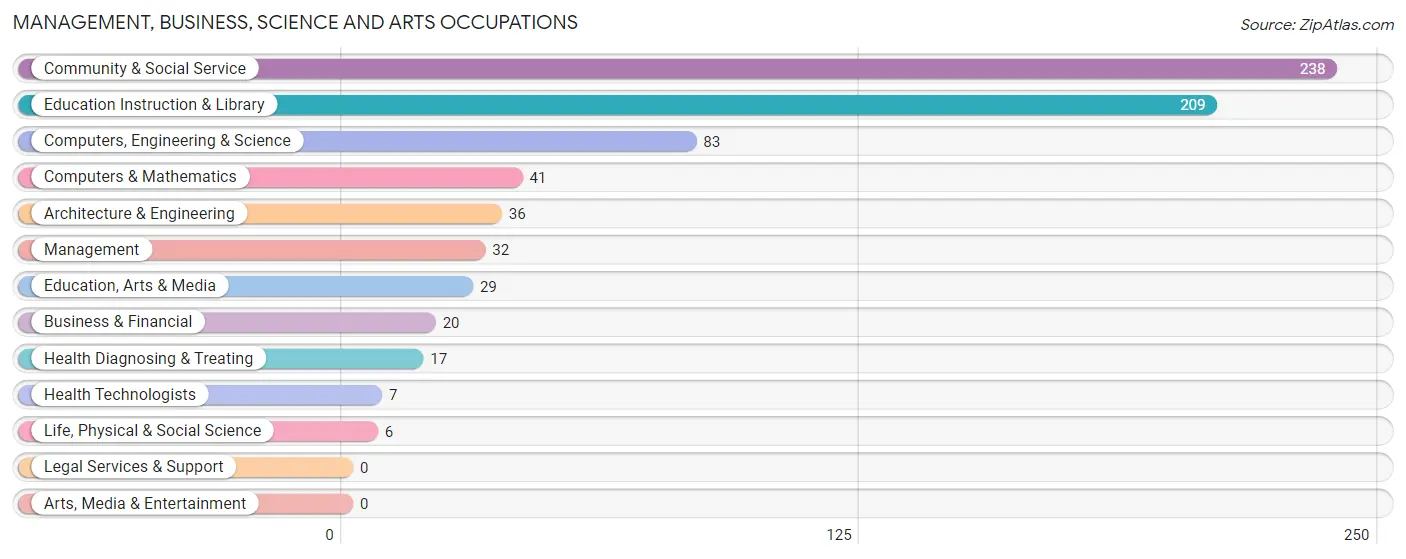
Management, Business, Science and Arts Occupations
The most common Management, Business, Science and Arts occupations in West Orange are Community & Social Service (238 | 17.4%), Education Instruction & Library (209 | 15.3%), Computers, Engineering & Science (83 | 6.1%), Computers & Mathematics (41 | 3.0%), and Architecture & Engineering (36 | 2.6%).
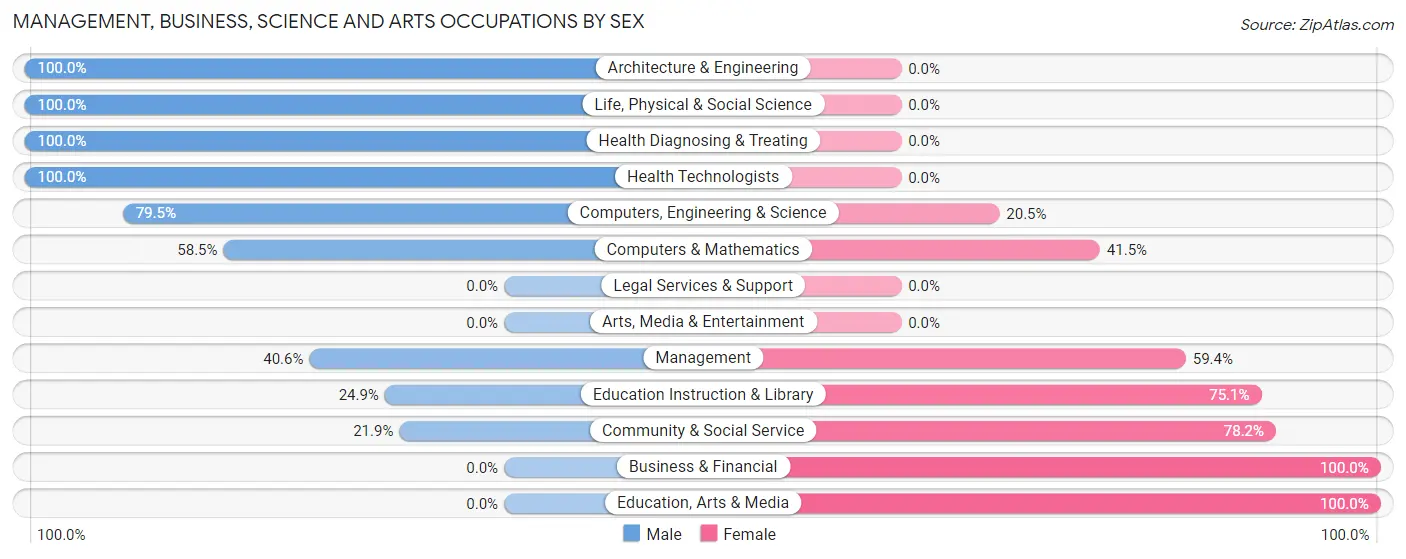
Management, Business, Science and Arts Occupations by Sex
Within the Management, Business, Science and Arts occupations in West Orange, the most male-oriented occupations are Architecture & Engineering (100.0%), Life, Physical & Social Science (100.0%), and Health Diagnosing & Treating (100.0%), while the most female-oriented occupations are Business & Financial (100.0%), Education, Arts & Media (100.0%), and Community & Social Service (78.1%).
| Occupation | Male | Female |
| Management | 13 (40.6%) | 19 (59.4%) |
| Business & Financial | 0 (0.0%) | 20 (100.0%) |
| Computers, Engineering & Science | 66 (79.5%) | 17 (20.5%) |
| Computers & Mathematics | 24 (58.5%) | 17 (41.5%) |
| Architecture & Engineering | 36 (100.0%) | 0 (0.0%) |
| Life, Physical & Social Science | 6 (100.0%) | 0 (0.0%) |
| Community & Social Service | 52 (21.8%) | 186 (78.1%) |
| Education, Arts & Media | 0 (0.0%) | 29 (100.0%) |
| Legal Services & Support | 0 (0.0%) | 0 (0.0%) |
| Education Instruction & Library | 52 (24.9%) | 157 (75.1%) |
| Arts, Media & Entertainment | 0 (0.0%) | 0 (0.0%) |
| Health Diagnosing & Treating | 17 (100.0%) | 0 (0.0%) |
| Health Technologists | 7 (100.0%) | 0 (0.0%) |
| Total (Category) | 148 (38.0%) | 242 (62.1%) |
| Total (Overall) | 764 (55.8%) | 606 (44.2%) |
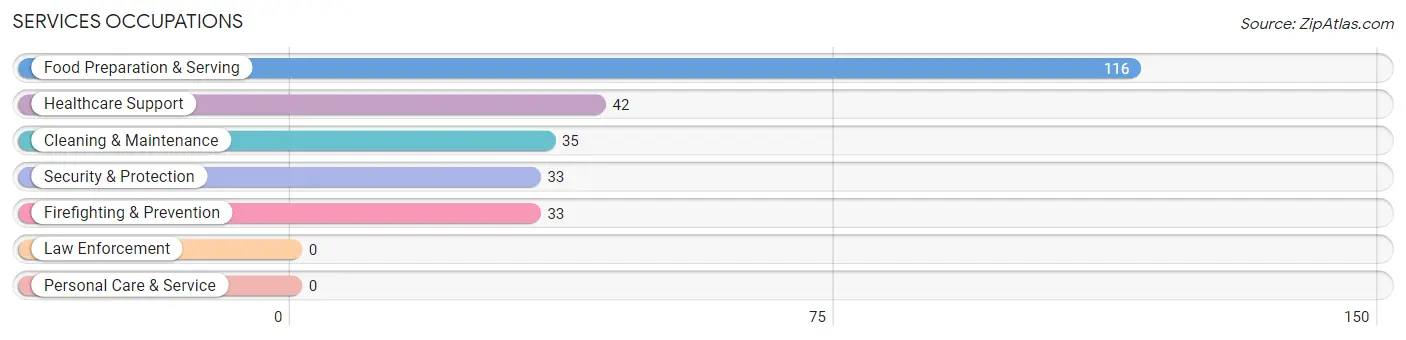
Services Occupations
The most common Services occupations in West Orange are Food Preparation & Serving (116 | 8.5%), Healthcare Support (42 | 3.1%), Cleaning & Maintenance (35 | 2.5%), Security & Protection (33 | 2.4%), and Firefighting & Prevention (33 | 2.4%).
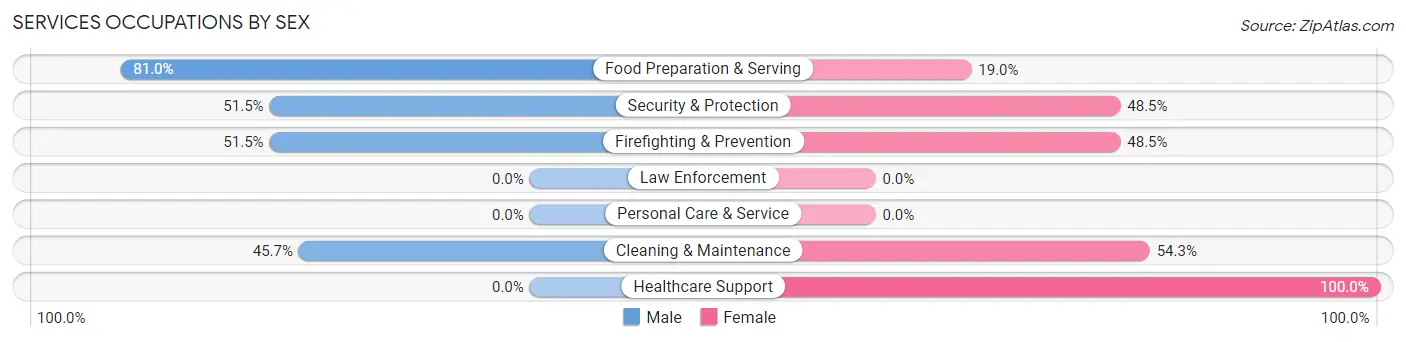
Services Occupations by Sex
Within the Services occupations in West Orange, the most male-oriented occupations are Food Preparation & Serving (81.0%), Security & Protection (51.5%), and Firefighting & Prevention (51.5%), while the most female-oriented occupations are Healthcare Support (100.0%), Cleaning & Maintenance (54.3%), and Security & Protection (48.5%).
| Occupation | Male | Female |
| Healthcare Support | 0 (0.0%) | 42 (100.0%) |
| Security & Protection | 17 (51.5%) | 16 (48.5%) |
| Firefighting & Prevention | 17 (51.5%) | 16 (48.5%) |
| Law Enforcement | 0 (0.0%) | 0 (0.0%) |
| Food Preparation & Serving | 94 (81.0%) | 22 (19.0%) |
| Cleaning & Maintenance | 16 (45.7%) | 19 (54.3%) |
| Personal Care & Service | 0 (0.0%) | 0 (0.0%) |
| Total (Category) | 127 (56.2%) | 99 (43.8%) |
| Total (Overall) | 764 (55.8%) | 606 (44.2%) |
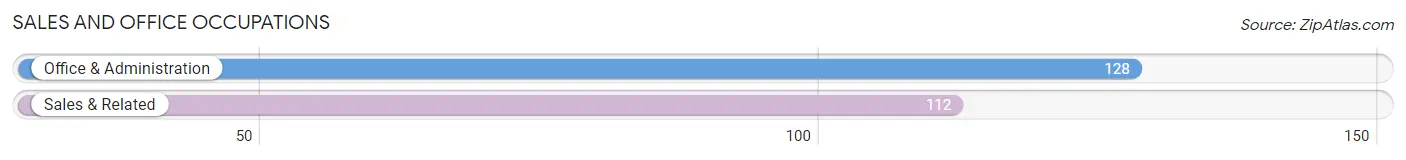
Sales and Office Occupations
The most common Sales and Office occupations in West Orange are Office & Administration (128 | 9.3%), and Sales & Related (112 | 8.2%).
Sales and Office Occupations by Sex
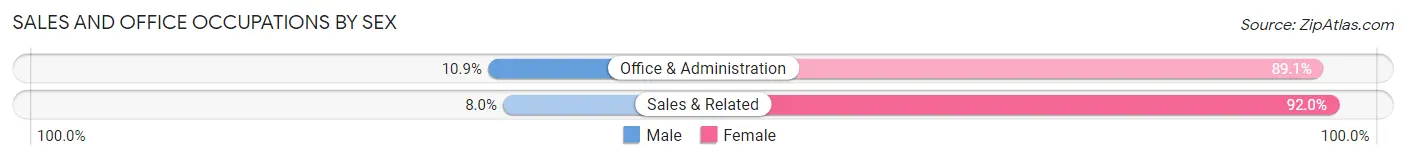
| Occupation | Male | Female |
| Sales & Related | 9 (8.0%) | 103 (92.0%) |
| Office & Administration | 14 (10.9%) | 114 (89.1%) |
| Total (Category) | 23 (9.6%) | 217 (90.4%) |
| Total (Overall) | 764 (55.8%) | 606 (44.2%) |
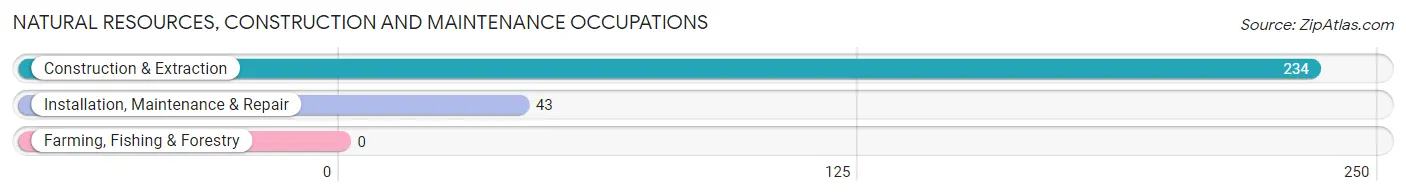
Natural Resources, Construction and Maintenance Occupations
The most common Natural Resources, Construction and Maintenance occupations in West Orange are Construction & Extraction (234 | 17.1%), and Installation, Maintenance & Repair (43 | 3.1%).
Natural Resources, Construction and Maintenance Occupations by Sex
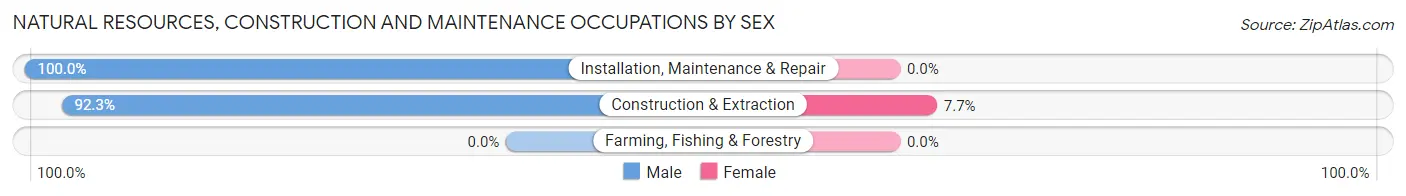
| Occupation | Male | Female |
| Farming, Fishing & Forestry | 0 (0.0%) | 0 (0.0%) |
| Construction & Extraction | 216 (92.3%) | 18 (7.7%) |
| Installation, Maintenance & Repair | 43 (100.0%) | 0 (0.0%) |
| Total (Category) | 259 (93.5%) | 18 (6.5%) |
| Total (Overall) | 764 (55.8%) | 606 (44.2%) |
Production, Transportation and Moving Occupations
The most common Production, Transportation and Moving occupations in West Orange are Production (230 | 16.8%), and Transportation (7 | 0.5%).
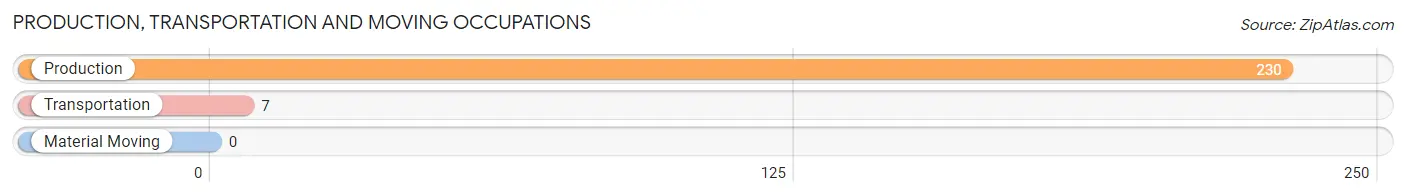
Production, Transportation and Moving Occupations by Sex
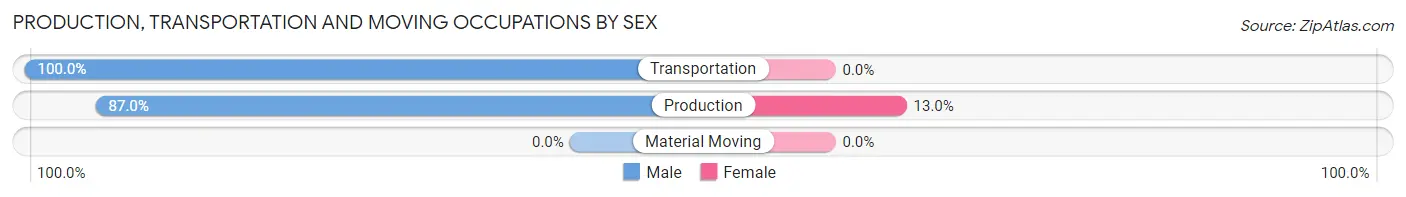
| Occupation | Male | Female |
| Production | 200 (87.0%) | 30 (13.0%) |
| Transportation | 7 (100.0%) | 0 (0.0%) |
| Material Moving | 0 (0.0%) | 0 (0.0%) |
| Total (Category) | 207 (87.3%) | 30 (12.7%) |
| Total (Overall) | 764 (55.8%) | 606 (44.2%) |
Employment Industries by Sex in West Orange
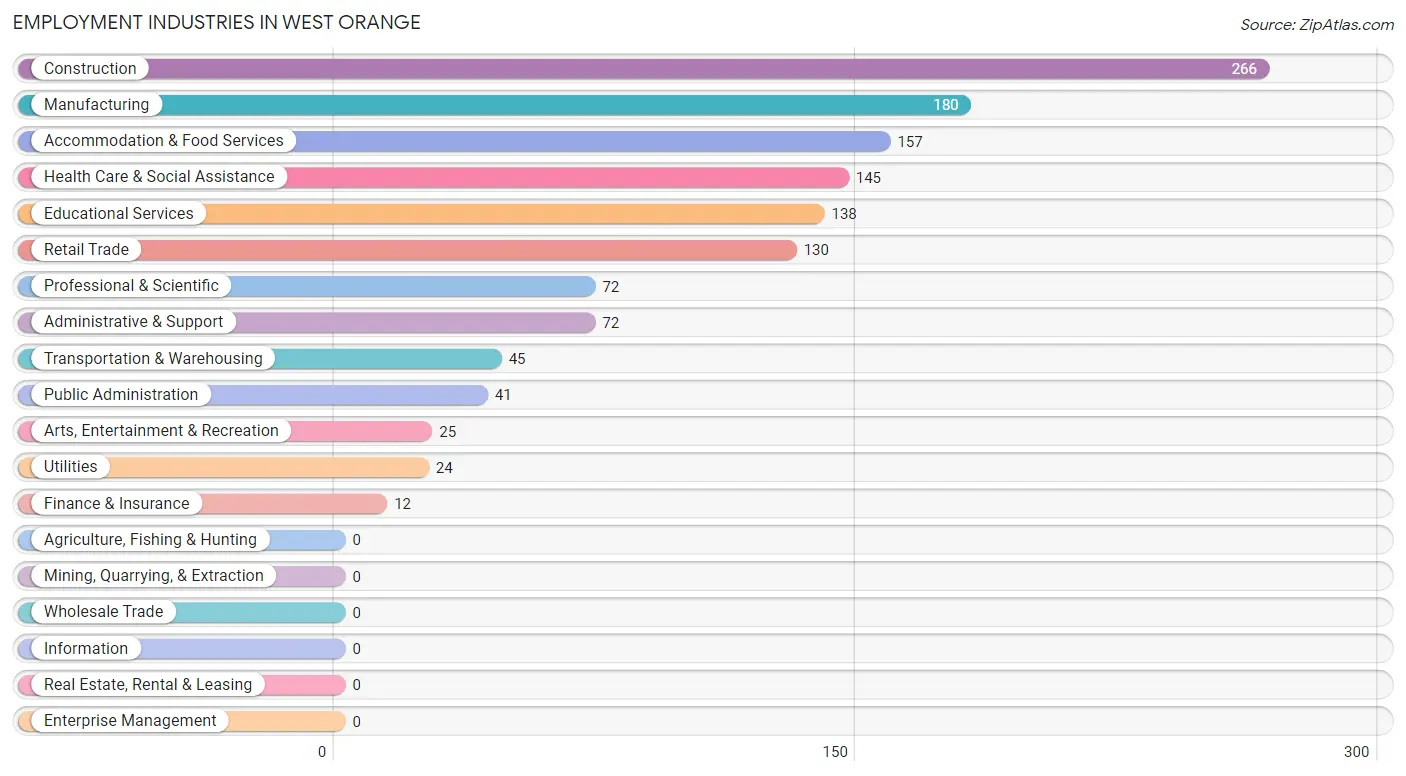
Employment Industries in West Orange
The major employment industries in West Orange include Construction (266 | 19.4%), Manufacturing (180 | 13.1%), Accommodation & Food Services (157 | 11.5%), Health Care & Social Assistance (145 | 10.6%), and Educational Services (138 | 10.1%).
Employment Industries by Sex in West Orange
The West Orange industries that see more men than women are Utilities (100.0%), Construction (93.2%), and Manufacturing (78.3%), whereas the industries that tend to have a higher number of women are Transportation & Warehousing (100.0%), Finance & Insurance (100.0%), and Arts, Entertainment & Recreation (100.0%).
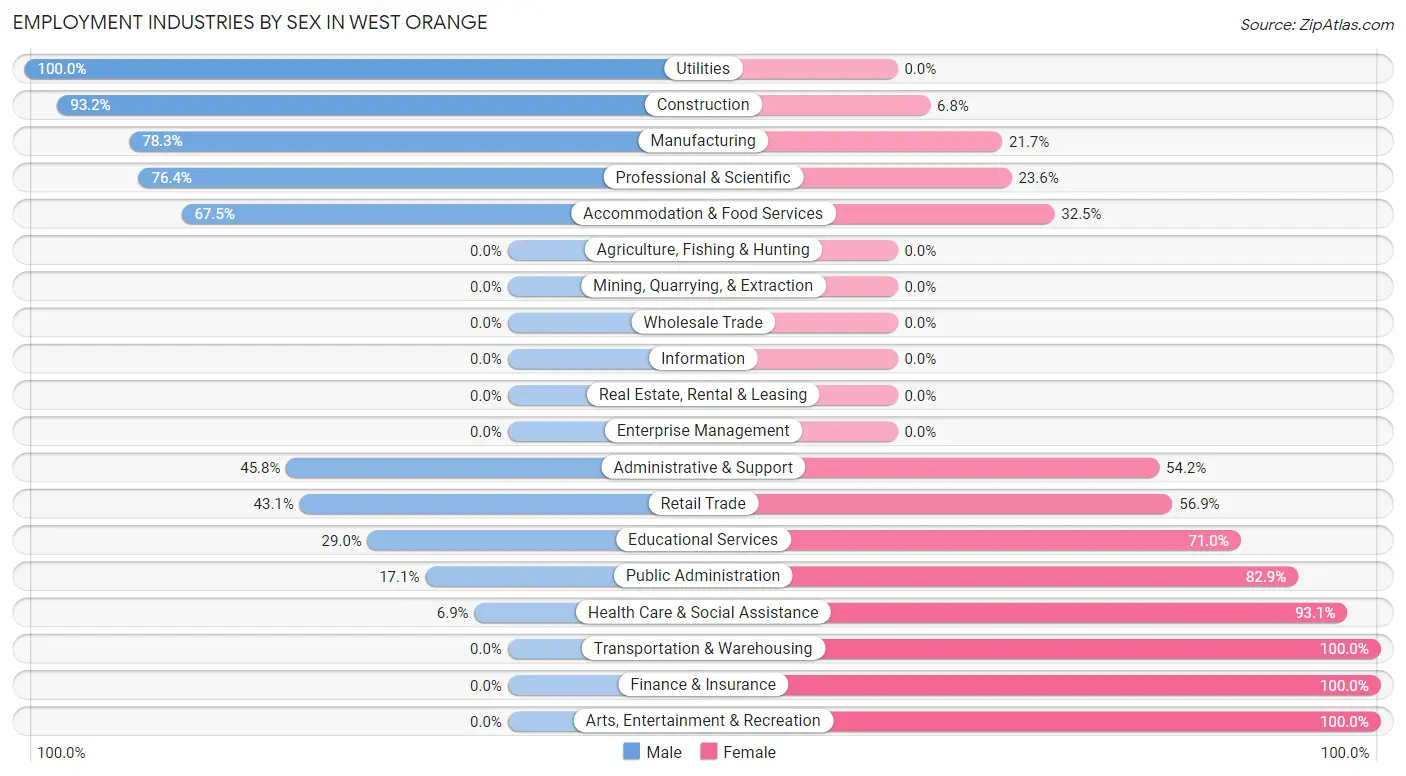
| Industry | Male | Female |
| Agriculture, Fishing & Hunting | 0 (0.0%) | 0 (0.0%) |
| Mining, Quarrying, & Extraction | 0 (0.0%) | 0 (0.0%) |
| Construction | 248 (93.2%) | 18 (6.8%) |
| Manufacturing | 141 (78.3%) | 39 (21.7%) |
| Wholesale Trade | 0 (0.0%) | 0 (0.0%) |
| Retail Trade | 56 (43.1%) | 74 (56.9%) |
| Transportation & Warehousing | 0 (0.0%) | 45 (100.0%) |
| Utilities | 24 (100.0%) | 0 (0.0%) |
| Information | 0 (0.0%) | 0 (0.0%) |
| Finance & Insurance | 0 (0.0%) | 12 (100.0%) |
| Real Estate, Rental & Leasing | 0 (0.0%) | 0 (0.0%) |
| Professional & Scientific | 55 (76.4%) | 17 (23.6%) |
| Enterprise Management | 0 (0.0%) | 0 (0.0%) |
| Administrative & Support | 33 (45.8%) | 39 (54.2%) |
| Educational Services | 40 (29.0%) | 98 (71.0%) |
| Health Care & Social Assistance | 10 (6.9%) | 135 (93.1%) |
| Arts, Entertainment & Recreation | 0 (0.0%) | 25 (100.0%) |
| Accommodation & Food Services | 106 (67.5%) | 51 (32.5%) |
| Public Administration | 7 (17.1%) | 34 (82.9%) |
| Total | 764 (55.8%) | 606 (44.2%) |
Education in West Orange
School Enrollment in West Orange
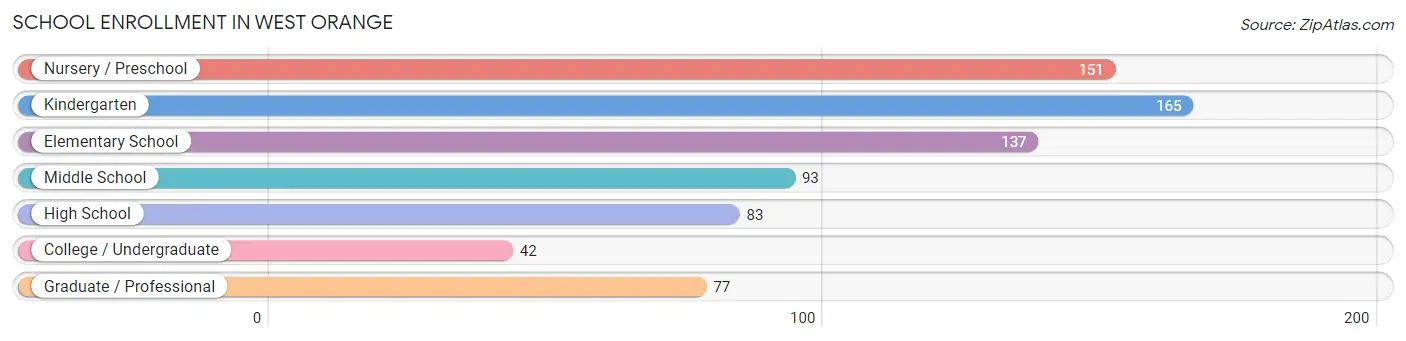
The most common levels of schooling among the 748 students in West Orange are kindergarten (165 | 22.1%), nursery / preschool (151 | 20.2%), and elementary school (137 | 18.3%).
| School Level | # Students | % Students |
| Nursery / Preschool | 151 | 20.2% |
| Kindergarten | 165 | 22.1% |
| Elementary School | 137 | 18.3% |
| Middle School | 93 | 12.4% |
| High School | 83 | 11.1% |
| College / Undergraduate | 42 | 5.6% |
| Graduate / Professional | 77 | 10.3% |
| Total | 748 | 100.0% |
School Enrollment by Age by Funding Source in West Orange
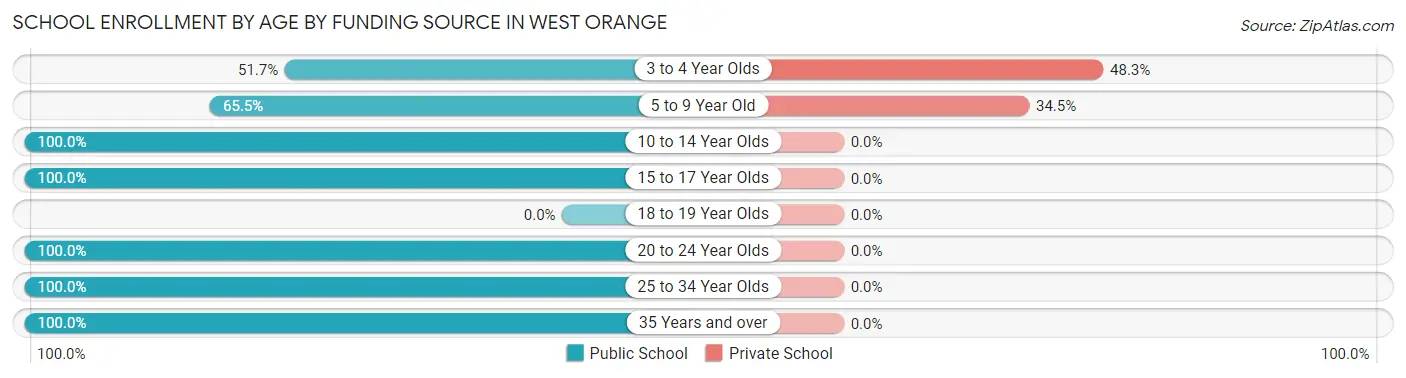
Out of a total of 748 students who are enrolled in schools in West Orange, 173 (23.1%) attend a private institution, while the remaining 575 (76.9%) are enrolled in public schools. The age group of 3 to 4 year olds has the highest likelihood of being enrolled in private schools, with 58 (48.3% in the age bracket) enrolled. Conversely, the age group of 10 to 14 year olds has the lowest likelihood of being enrolled in a private school, with 93 (100.0% in the age bracket) attending a public institution.
| Age Bracket | Public School | Private School |
| 3 to 4 Year Olds | 62 (51.7%) | 58 (48.3%) |
| 5 to 9 Year Old | 218 (65.5%) | 115 (34.5%) |
| 10 to 14 Year Olds | 93 (100.0%) | 0 (0.0%) |
| 15 to 17 Year Olds | 83 (100.0%) | 0 (0.0%) |
| 18 to 19 Year Olds | 0 (0.0%) | 0 (0.0%) |
| 20 to 24 Year Olds | 20 (100.0%) | 0 (0.0%) |
| 25 to 34 Year Olds | 70 (100.0%) | 0 (0.0%) |
| 35 Years and over | 29 (100.0%) | 0 (0.0%) |
| Total | 575 (76.9%) | 173 (23.1%) |
Educational Attainment by Field of Study in West Orange
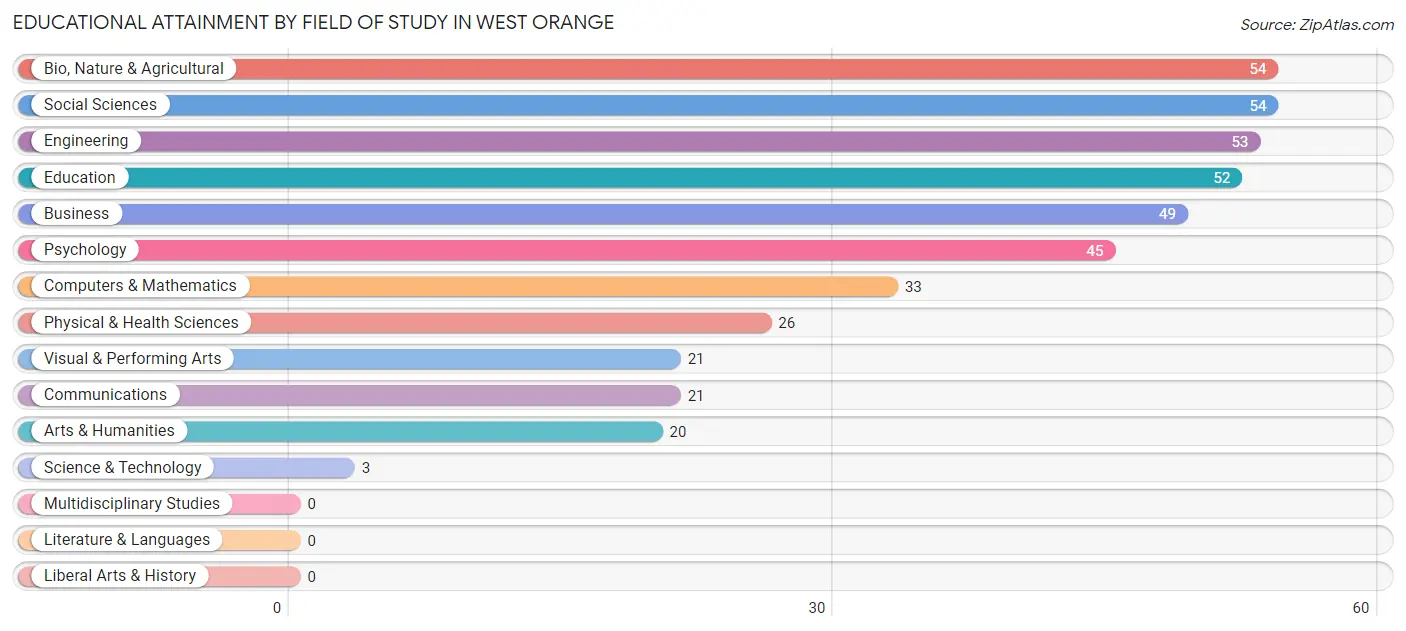
Bio, nature & agricultural (54 | 12.5%), social sciences (54 | 12.5%), engineering (53 | 12.3%), education (52 | 12.1%), and business (49 | 11.4%) are the most common fields of study among 431 individuals in West Orange who have obtained a bachelor's degree or higher.
| Field of Study | # Graduates | % Graduates |
| Computers & Mathematics | 33 | 7.7% |
| Bio, Nature & Agricultural | 54 | 12.5% |
| Physical & Health Sciences | 26 | 6.0% |
| Psychology | 45 | 10.4% |
| Social Sciences | 54 | 12.5% |
| Engineering | 53 | 12.3% |
| Multidisciplinary Studies | 0 | 0.0% |
| Science & Technology | 3 | 0.7% |
| Business | 49 | 11.4% |
| Education | 52 | 12.1% |
| Literature & Languages | 0 | 0.0% |
| Liberal Arts & History | 0 | 0.0% |
| Visual & Performing Arts | 21 | 4.9% |
| Communications | 21 | 4.9% |
| Arts & Humanities | 20 | 4.6% |
| Total | 431 | 100.0% |
Transportation & Commute in West Orange
Vehicle Availability by Sex in West Orange
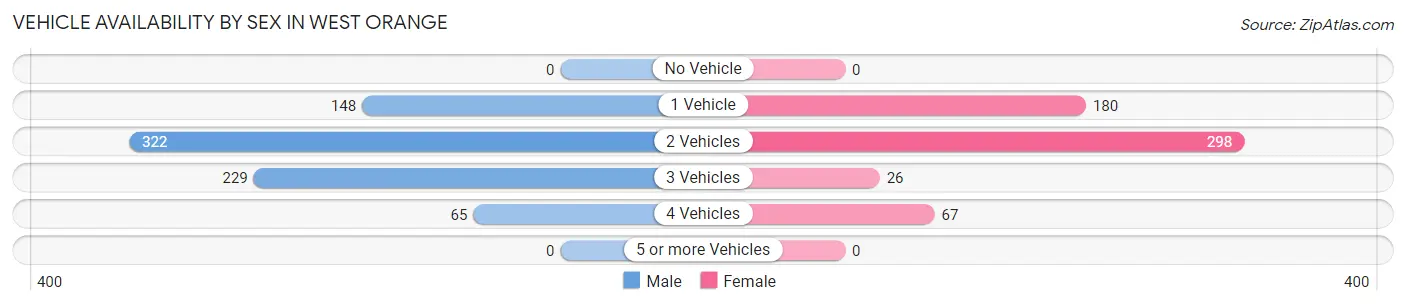
The most prevalent vehicle ownership categories in West Orange are males with 2 vehicles (322, accounting for 42.1%) and females with 2 vehicles (298, making up 56.4%).
| Vehicles Available | Male | Female |
| No Vehicle | 0 (0.0%) | 0 (0.0%) |
| 1 Vehicle | 148 (19.4%) | 180 (31.5%) |
| 2 Vehicles | 322 (42.1%) | 298 (52.2%) |
| 3 Vehicles | 229 (30.0%) | 26 (4.5%) |
| 4 Vehicles | 65 (8.5%) | 67 (11.7%) |
| 5 or more Vehicles | 0 (0.0%) | 0 (0.0%) |
| Total | 764 (100.0%) | 571 (100.0%) |
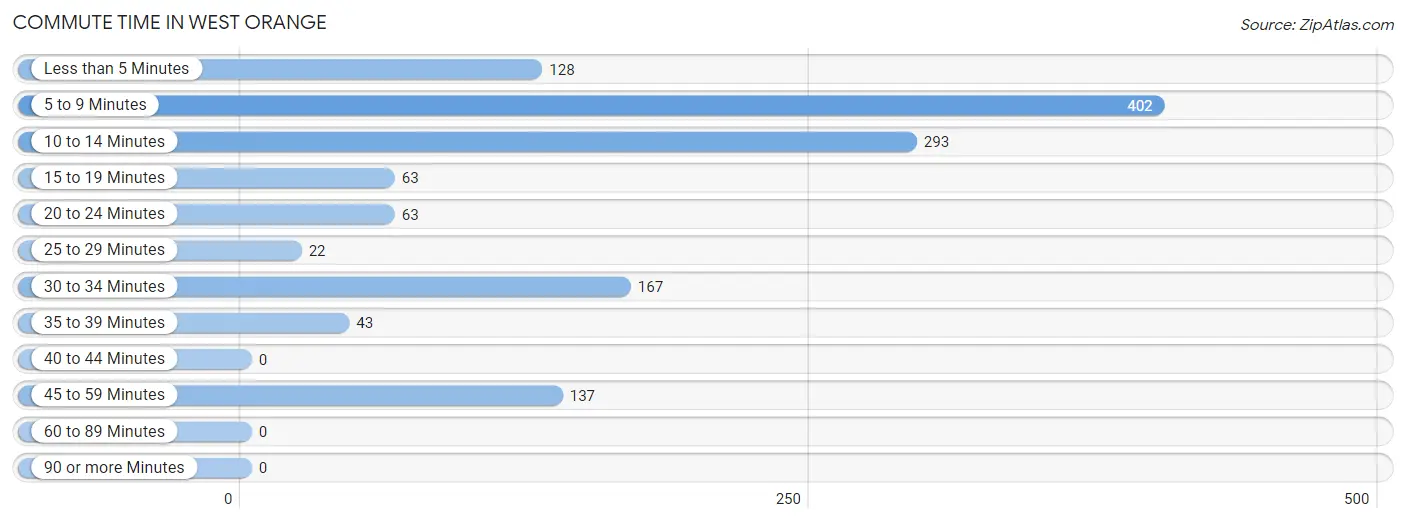
Commute Time in West Orange
The most frequently occuring commute durations in West Orange are 5 to 9 minutes (402 commuters, 30.5%), 10 to 14 minutes (293 commuters, 22.2%), and 30 to 34 minutes (167 commuters, 12.7%).
| Commute Time | # Commuters | % Commuters |
| Less than 5 Minutes | 128 | 9.7% |
| 5 to 9 Minutes | 402 | 30.5% |
| 10 to 14 Minutes | 293 | 22.2% |
| 15 to 19 Minutes | 63 | 4.8% |
| 20 to 24 Minutes | 63 | 4.8% |
| 25 to 29 Minutes | 22 | 1.7% |
| 30 to 34 Minutes | 167 | 12.7% |
| 35 to 39 Minutes | 43 | 3.3% |
| 40 to 44 Minutes | 0 | 0.0% |
| 45 to 59 Minutes | 137 | 10.4% |
| 60 to 89 Minutes | 0 | 0.0% |
| 90 or more Minutes | 0 | 0.0% |
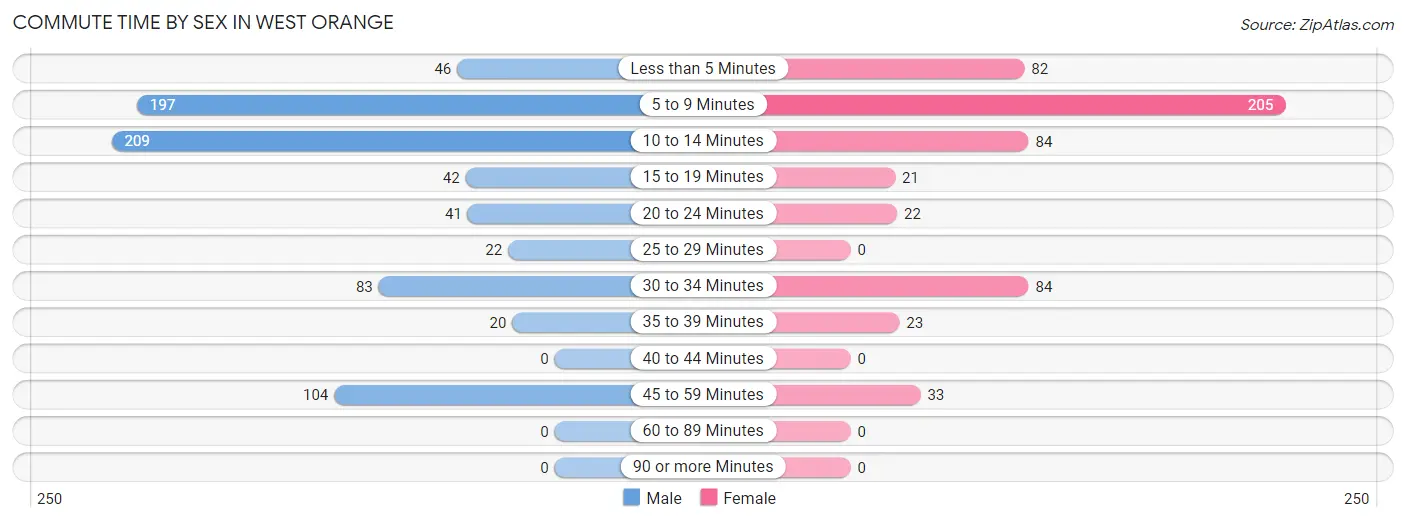
Commute Time by Sex in West Orange
The most common commute times in West Orange are 10 to 14 minutes (209 commuters, 27.4%) for males and 5 to 9 minutes (205 commuters, 37.0%) for females.
| Commute Time | Male | Female |
| Less than 5 Minutes | 46 (6.0%) | 82 (14.8%) |
| 5 to 9 Minutes | 197 (25.8%) | 205 (37.0%) |
| 10 to 14 Minutes | 209 (27.4%) | 84 (15.2%) |
| 15 to 19 Minutes | 42 (5.5%) | 21 (3.8%) |
| 20 to 24 Minutes | 41 (5.4%) | 22 (4.0%) |
| 25 to 29 Minutes | 22 (2.9%) | 0 (0.0%) |
| 30 to 34 Minutes | 83 (10.9%) | 84 (15.2%) |
| 35 to 39 Minutes | 20 (2.6%) | 23 (4.2%) |
| 40 to 44 Minutes | 0 (0.0%) | 0 (0.0%) |
| 45 to 59 Minutes | 104 (13.6%) | 33 (6.0%) |
| 60 to 89 Minutes | 0 (0.0%) | 0 (0.0%) |
| 90 or more Minutes | 0 (0.0%) | 0 (0.0%) |
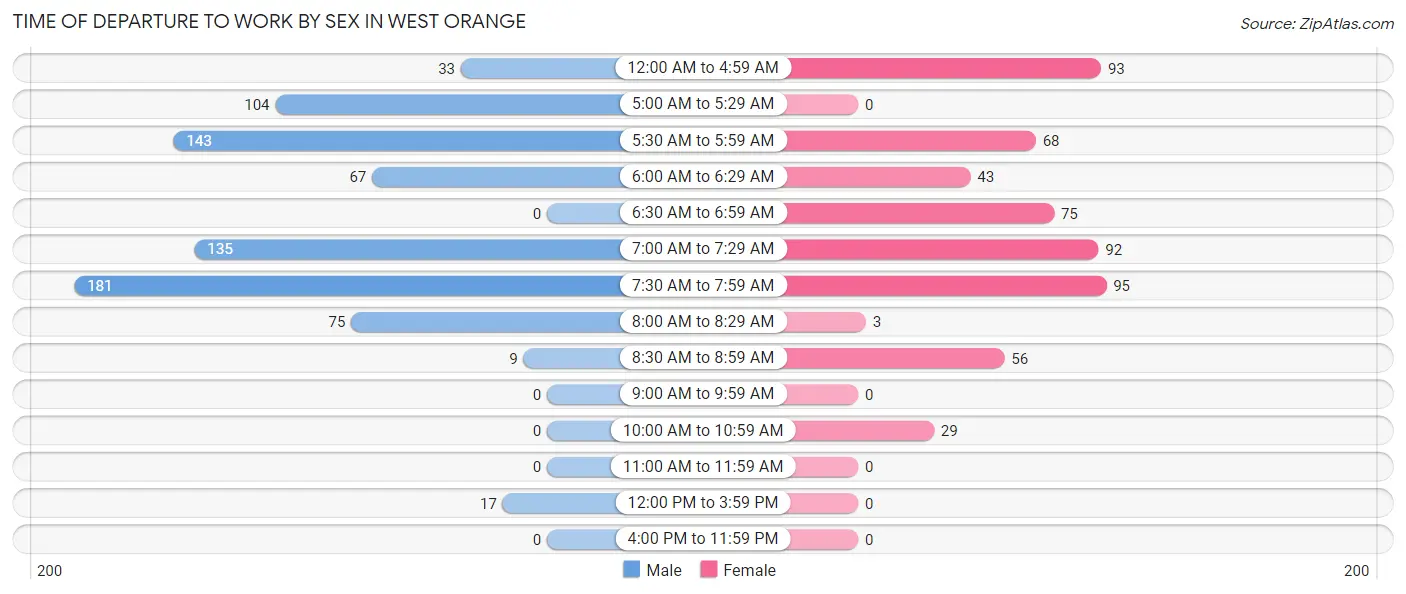
Time of Departure to Work by Sex in West Orange
The most frequent times of departure to work in West Orange are 7:30 AM to 7:59 AM (181, 23.7%) for males and 7:30 AM to 7:59 AM (95, 17.2%) for females.
| Time of Departure | Male | Female |
| 12:00 AM to 4:59 AM | 33 (4.3%) | 93 (16.8%) |
| 5:00 AM to 5:29 AM | 104 (13.6%) | 0 (0.0%) |
| 5:30 AM to 5:59 AM | 143 (18.7%) | 68 (12.3%) |
| 6:00 AM to 6:29 AM | 67 (8.8%) | 43 (7.8%) |
| 6:30 AM to 6:59 AM | 0 (0.0%) | 75 (13.5%) |
| 7:00 AM to 7:29 AM | 135 (17.7%) | 92 (16.6%) |
| 7:30 AM to 7:59 AM | 181 (23.7%) | 95 (17.2%) |
| 8:00 AM to 8:29 AM | 75 (9.8%) | 3 (0.5%) |
| 8:30 AM to 8:59 AM | 9 (1.2%) | 56 (10.1%) |
| 9:00 AM to 9:59 AM | 0 (0.0%) | 0 (0.0%) |
| 10:00 AM to 10:59 AM | 0 (0.0%) | 29 (5.2%) |
| 11:00 AM to 11:59 AM | 0 (0.0%) | 0 (0.0%) |
| 12:00 PM to 3:59 PM | 17 (2.2%) | 0 (0.0%) |
| 4:00 PM to 11:59 PM | 0 (0.0%) | 0 (0.0%) |
| Total | 764 (100.0%) | 554 (100.0%) |
Housing Occupancy in West Orange
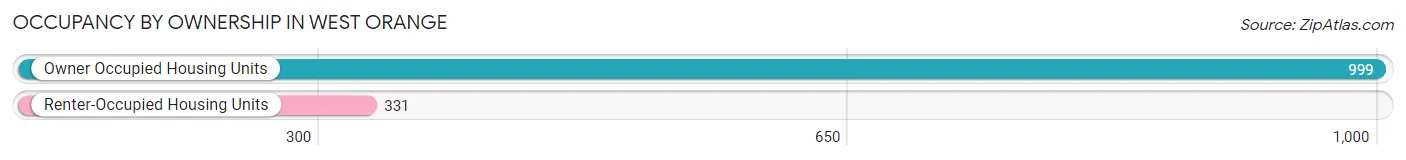
Occupancy by Ownership in West Orange
Of the total 1,330 dwellings in West Orange, owner-occupied units account for 999 (75.1%), while renter-occupied units make up 331 (24.9%).
| Occupancy | # Housing Units | % Housing Units |
| Owner Occupied Housing Units | 999 | 75.1% |
| Renter-Occupied Housing Units | 331 | 24.9% |
| Total Occupied Housing Units | 1,330 | 100.0% |
Occupancy by Household Size in West Orange
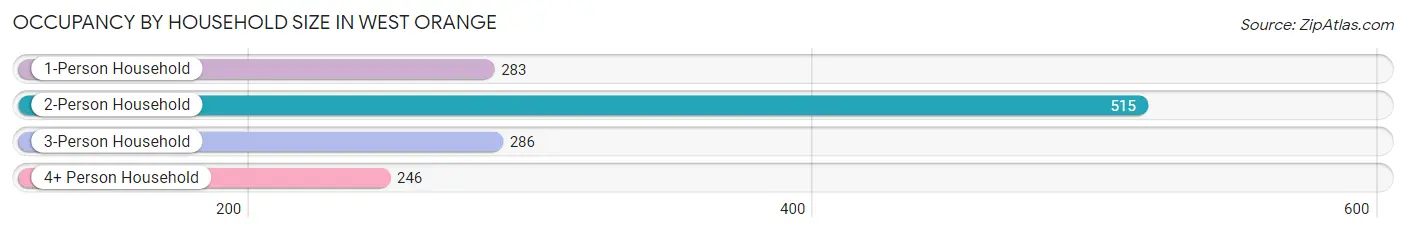
| Household Size | # Housing Units | % Housing Units |
| 1-Person Household | 283 | 21.3% |
| 2-Person Household | 515 | 38.7% |
| 3-Person Household | 286 | 21.5% |
| 4+ Person Household | 246 | 18.5% |
| Total Housing Units | 1,330 | 100.0% |
Occupancy by Ownership by Household Size in West Orange
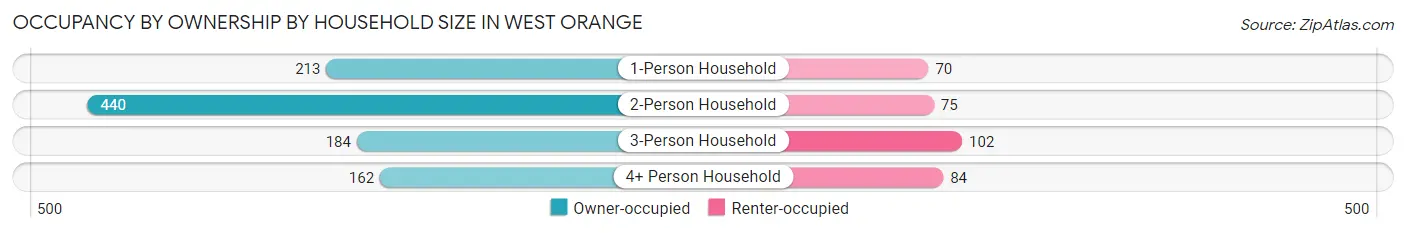
| Household Size | Owner-occupied | Renter-occupied |
| 1-Person Household | 213 (75.3%) | 70 (24.7%) |
| 2-Person Household | 440 (85.4%) | 75 (14.6%) |
| 3-Person Household | 184 (64.3%) | 102 (35.7%) |
| 4+ Person Household | 162 (65.8%) | 84 (34.2%) |
| Total Housing Units | 999 (75.1%) | 331 (24.9%) |
Occupancy by Educational Attainment in West Orange
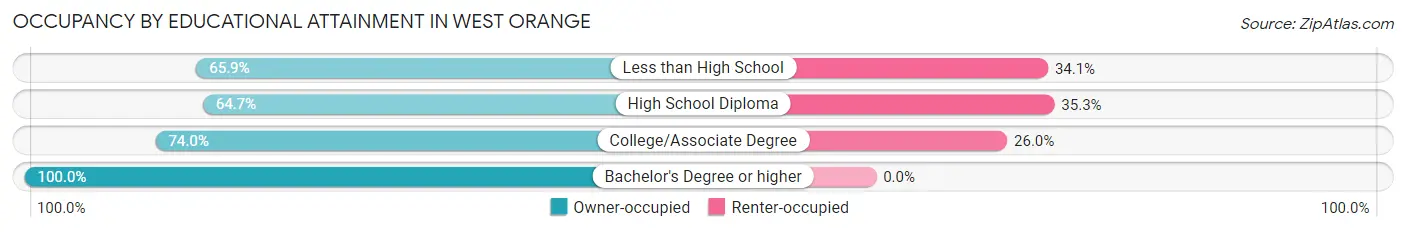
| Household Size | Owner-occupied | Renter-occupied |
| Less than High School | 211 (65.9%) | 109 (34.1%) |
| High School Diploma | 172 (64.7%) | 94 (35.3%) |
| College/Associate Degree | 365 (74.0%) | 128 (26.0%) |
| Bachelor's Degree or higher | 251 (100.0%) | 0 (0.0%) |
Occupancy by Age of Householder in West Orange
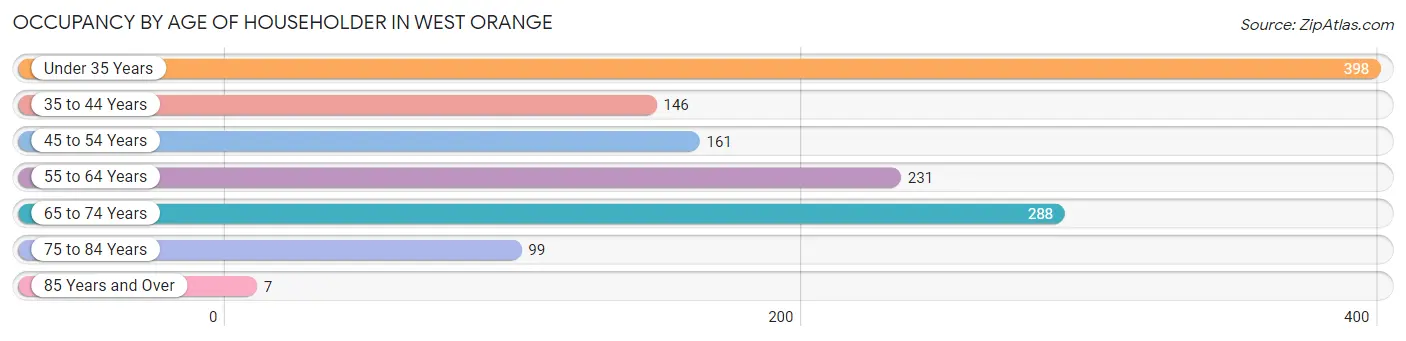
| Age Bracket | # Households | % Households |
| Under 35 Years | 398 | 29.9% |
| 35 to 44 Years | 146 | 11.0% |
| 45 to 54 Years | 161 | 12.1% |
| 55 to 64 Years | 231 | 17.4% |
| 65 to 74 Years | 288 | 21.6% |
| 75 to 84 Years | 99 | 7.4% |
| 85 Years and Over | 7 | 0.5% |
| Total | 1,330 | 100.0% |
Housing Finances in West Orange
Median Income by Occupancy in West Orange
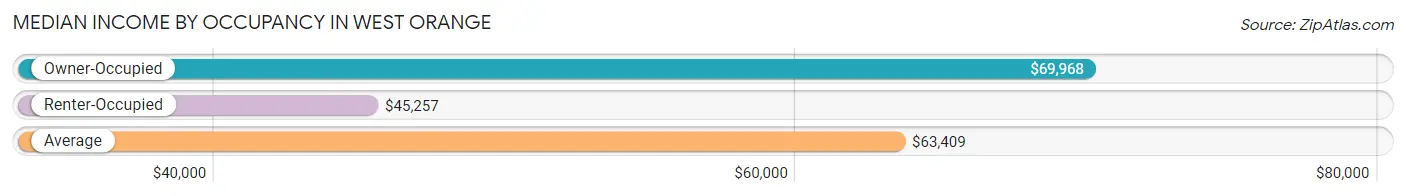
| Occupancy Type | # Households | Median Income |
| Owner-Occupied | 999 (75.1%) | $69,968 |
| Renter-Occupied | 331 (24.9%) | $45,257 |
| Average | 1,330 (100.0%) | $63,409 |
Occupancy by Householder Income Bracket in West Orange
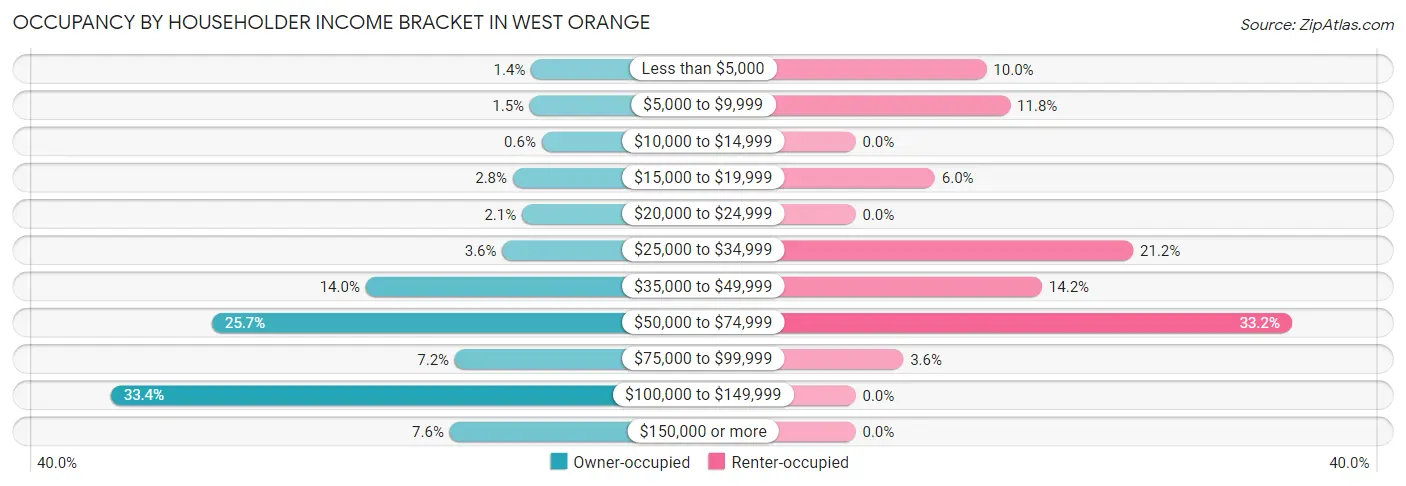
| Income Bracket | Owner-occupied | Renter-occupied |
| Less than $5,000 | 14 (1.4%) | 33 (10.0%) |
| $5,000 to $9,999 | 15 (1.5%) | 39 (11.8%) |
| $10,000 to $14,999 | 6 (0.6%) | 0 (0.0%) |
| $15,000 to $19,999 | 28 (2.8%) | 20 (6.0%) |
| $20,000 to $24,999 | 21 (2.1%) | 0 (0.0%) |
| $25,000 to $34,999 | 36 (3.6%) | 70 (21.1%) |
| $35,000 to $49,999 | 140 (14.0%) | 47 (14.2%) |
| $50,000 to $74,999 | 257 (25.7%) | 110 (33.2%) |
| $75,000 to $99,999 | 72 (7.2%) | 12 (3.6%) |
| $100,000 to $149,999 | 334 (33.4%) | 0 (0.0%) |
| $150,000 or more | 76 (7.6%) | 0 (0.0%) |
| Total | 999 (100.0%) | 331 (100.0%) |
Monthly Housing Cost Tiers in West Orange
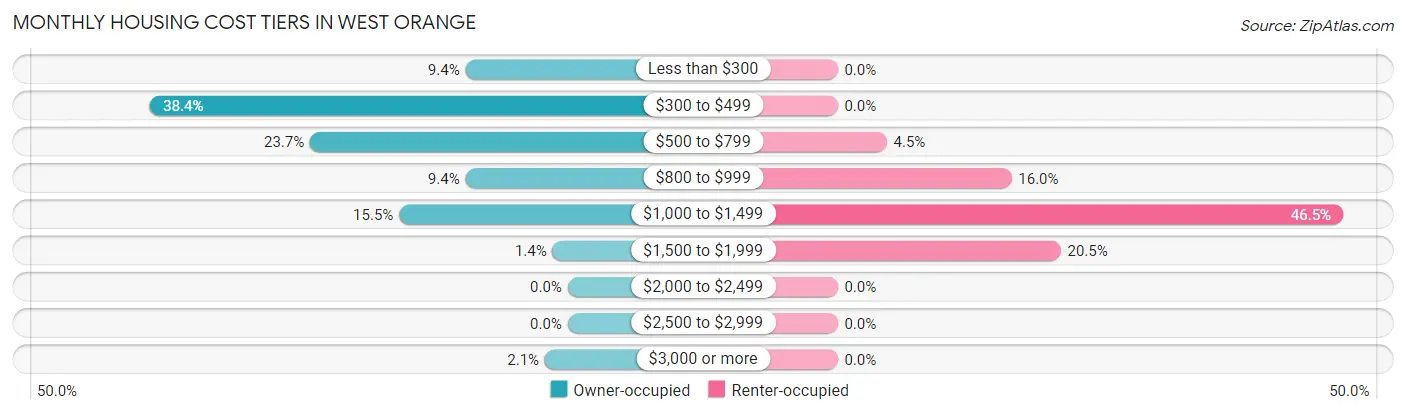
| Monthly Cost | Owner-occupied | Renter-occupied |
| Less than $300 | 94 (9.4%) | 0 (0.0%) |
| $300 to $499 | 384 (38.4%) | 0 (0.0%) |
| $500 to $799 | 237 (23.7%) | 15 (4.5%) |
| $800 to $999 | 94 (9.4%) | 53 (16.0%) |
| $1,000 to $1,499 | 155 (15.5%) | 154 (46.5%) |
| $1,500 to $1,999 | 14 (1.4%) | 68 (20.5%) |
| $2,000 to $2,499 | 0 (0.0%) | 0 (0.0%) |
| $2,500 to $2,999 | 0 (0.0%) | 0 (0.0%) |
| $3,000 or more | 21 (2.1%) | 0 (0.0%) |
| Total | 999 (100.0%) | 331 (100.0%) |
Physical Housing Characteristics in West Orange
Housing Structures in West Orange
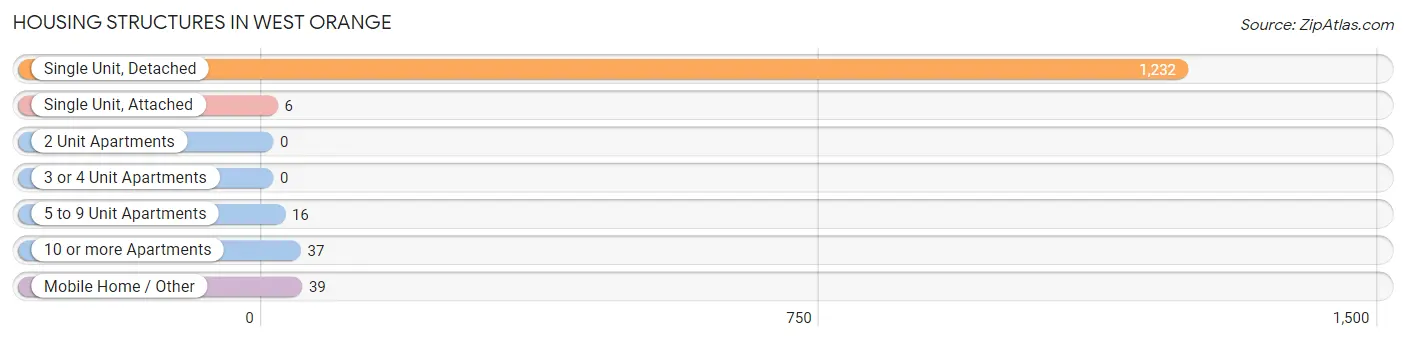
| Structure Type | # Housing Units | % Housing Units |
| Single Unit, Detached | 1,232 | 92.6% |
| Single Unit, Attached | 6 | 0.4% |
| 2 Unit Apartments | 0 | 0.0% |
| 3 or 4 Unit Apartments | 0 | 0.0% |
| 5 to 9 Unit Apartments | 16 | 1.2% |
| 10 or more Apartments | 37 | 2.8% |
| Mobile Home / Other | 39 | 2.9% |
| Total | 1,330 | 100.0% |
Housing Structures by Occupancy in West Orange
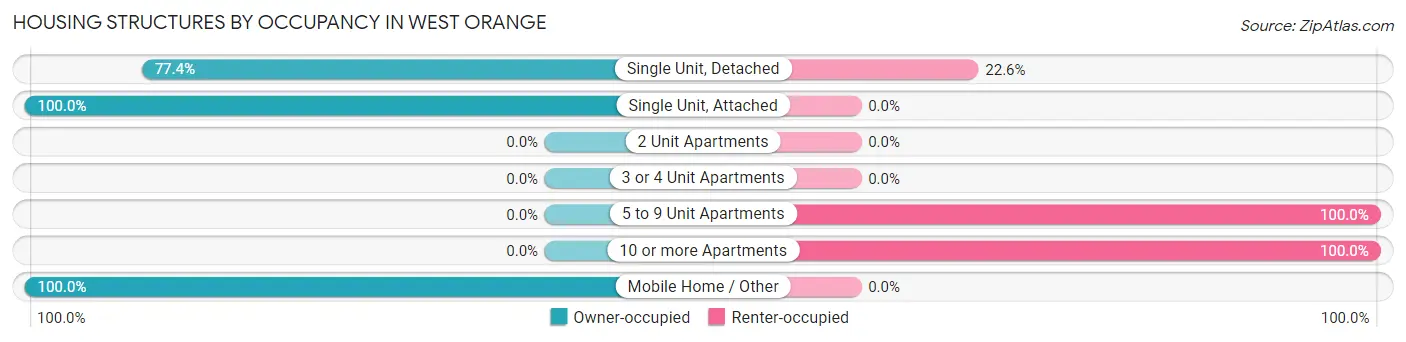
| Structure Type | Owner-occupied | Renter-occupied |
| Single Unit, Detached | 954 (77.4%) | 278 (22.6%) |
| Single Unit, Attached | 6 (100.0%) | 0 (0.0%) |
| 2 Unit Apartments | 0 (0.0%) | 0 (0.0%) |
| 3 or 4 Unit Apartments | 0 (0.0%) | 0 (0.0%) |
| 5 to 9 Unit Apartments | 0 (0.0%) | 16 (100.0%) |
| 10 or more Apartments | 0 (0.0%) | 37 (100.0%) |
| Mobile Home / Other | 39 (100.0%) | 0 (0.0%) |
| Total | 999 (75.1%) | 331 (24.9%) |
Housing Structures by Number of Rooms in West Orange
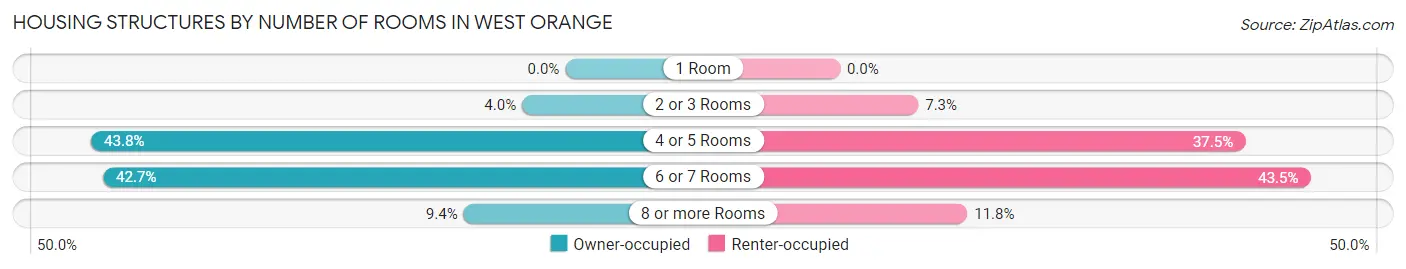
| Number of Rooms | Owner-occupied | Renter-occupied |
| 1 Room | 0 (0.0%) | 0 (0.0%) |
| 2 or 3 Rooms | 40 (4.0%) | 24 (7.2%) |
| 4 or 5 Rooms | 438 (43.8%) | 124 (37.5%) |
| 6 or 7 Rooms | 427 (42.7%) | 144 (43.5%) |
| 8 or more Rooms | 94 (9.4%) | 39 (11.8%) |
| Total | 999 (100.0%) | 331 (100.0%) |
Housing Structure by Heating Type in West Orange
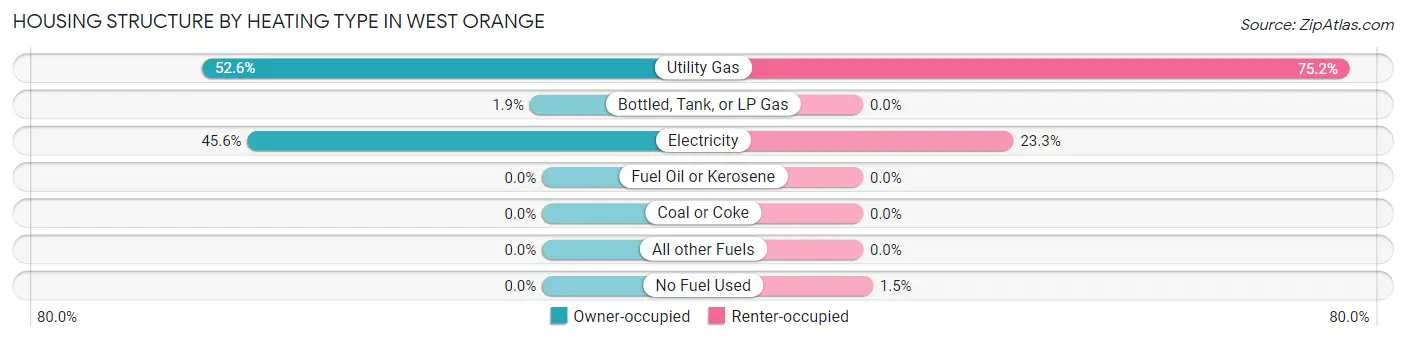
| Heating Type | Owner-occupied | Renter-occupied |
| Utility Gas | 525 (52.5%) | 249 (75.2%) |
| Bottled, Tank, or LP Gas | 19 (1.9%) | 0 (0.0%) |
| Electricity | 455 (45.6%) | 77 (23.3%) |
| Fuel Oil or Kerosene | 0 (0.0%) | 0 (0.0%) |
| Coal or Coke | 0 (0.0%) | 0 (0.0%) |
| All other Fuels | 0 (0.0%) | 0 (0.0%) |
| No Fuel Used | 0 (0.0%) | 5 (1.5%) |
| Total | 999 (100.0%) | 331 (100.0%) |
Household Vehicle Usage in West Orange
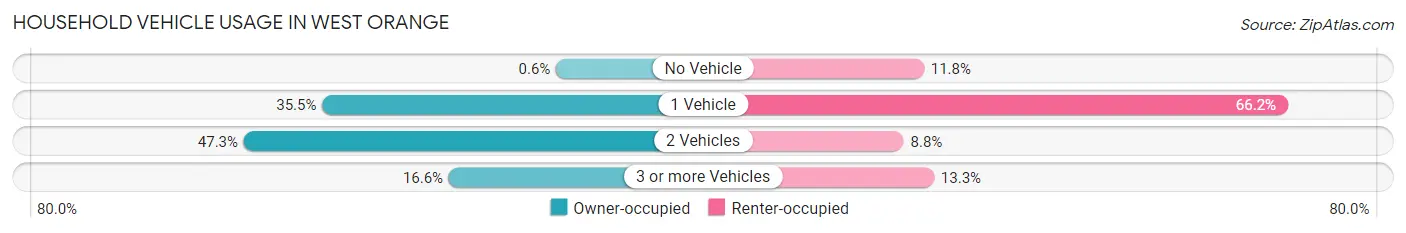
| Vehicles per Household | Owner-occupied | Renter-occupied |
| No Vehicle | 6 (0.6%) | 39 (11.8%) |
| 1 Vehicle | 355 (35.5%) | 219 (66.2%) |
| 2 Vehicles | 472 (47.2%) | 29 (8.8%) |
| 3 or more Vehicles | 166 (16.6%) | 44 (13.3%) |
| Total | 999 (100.0%) | 331 (100.0%) |
Real Estate & Mortgages in West Orange
Real Estate and Mortgage Overview in West Orange
| Characteristic | Without Mortgage | With Mortgage |
| Housing Units | 683 | 316 |
| Median Property Value | $87,600 | $126,700 |
| Median Household Income | $65,848 | $23 |
| Monthly Housing Costs | $431 | $21 |
| Real Estate Taxes | $766 | $0 |
Property Value by Mortgage Status in West Orange
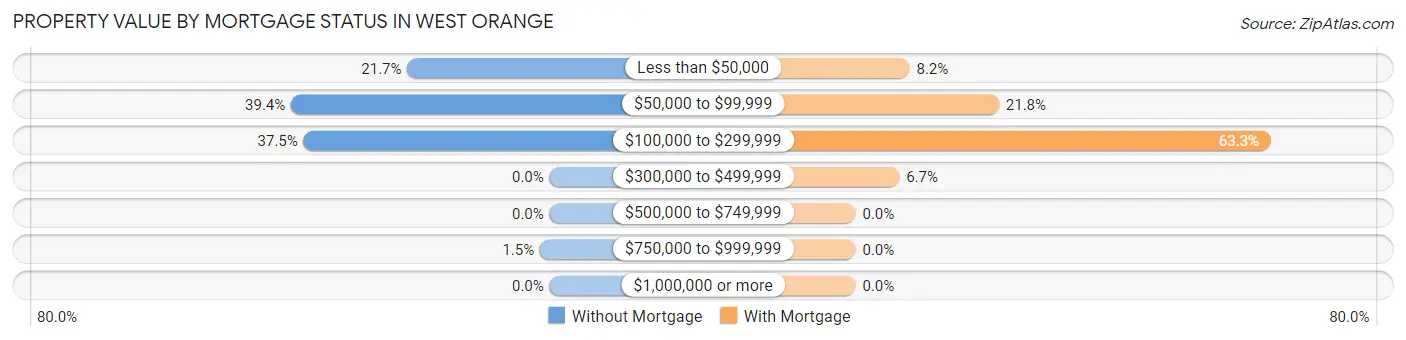
| Property Value | Without Mortgage | With Mortgage |
| Less than $50,000 | 148 (21.7%) | 26 (8.2%) |
| $50,000 to $99,999 | 269 (39.4%) | 69 (21.8%) |
| $100,000 to $299,999 | 256 (37.5%) | 200 (63.3%) |
| $300,000 to $499,999 | 0 (0.0%) | 21 (6.7%) |
| $500,000 to $749,999 | 0 (0.0%) | 0 (0.0%) |
| $750,000 to $999,999 | 10 (1.5%) | 0 (0.0%) |
| $1,000,000 or more | 0 (0.0%) | 0 (0.0%) |
| Total | 683 (100.0%) | 316 (100.0%) |
Household Income by Mortgage Status in West Orange
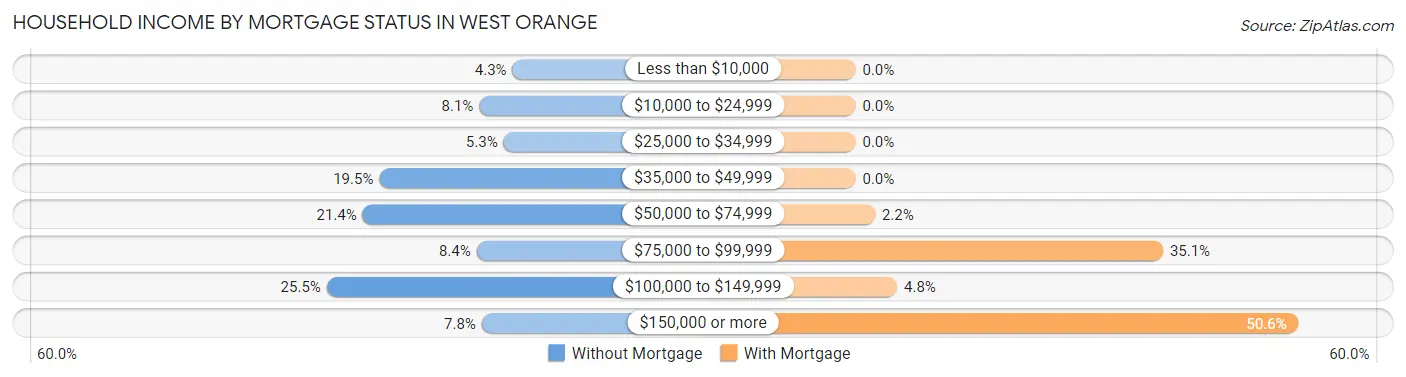
| Household Income | Without Mortgage | With Mortgage |
| Less than $10,000 | 29 (4.3%) | 0 (0.0%) |
| $10,000 to $24,999 | 55 (8.1%) | 0 (0.0%) |
| $25,000 to $34,999 | 36 (5.3%) | 0 (0.0%) |
| $35,000 to $49,999 | 133 (19.5%) | 0 (0.0%) |
| $50,000 to $74,999 | 146 (21.4%) | 7 (2.2%) |
| $75,000 to $99,999 | 57 (8.4%) | 111 (35.1%) |
| $100,000 to $149,999 | 174 (25.5%) | 15 (4.8%) |
| $150,000 or more | 53 (7.8%) | 160 (50.6%) |
| Total | 683 (100.0%) | 316 (100.0%) |
Property Value to Household Income Ratio in West Orange
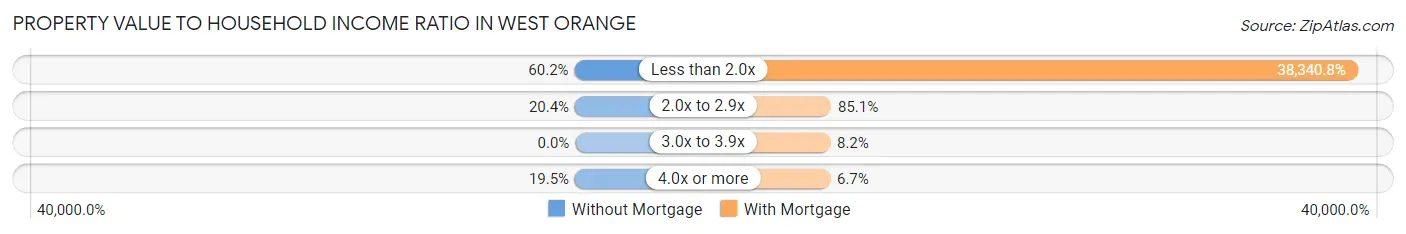
| Value-to-Income Ratio | Without Mortgage | With Mortgage |
| Less than 2.0x | 411 (60.2%) | 121,157 (38,340.8%) |
| 2.0x to 2.9x | 139 (20.3%) | 269 (85.1%) |
| 3.0x to 3.9x | 0 (0.0%) | 26 (8.2%) |
| 4.0x or more | 133 (19.5%) | 21 (6.7%) |
| Total | 683 (100.0%) | 316 (100.0%) |
Real Estate Taxes by Mortgage Status in West Orange
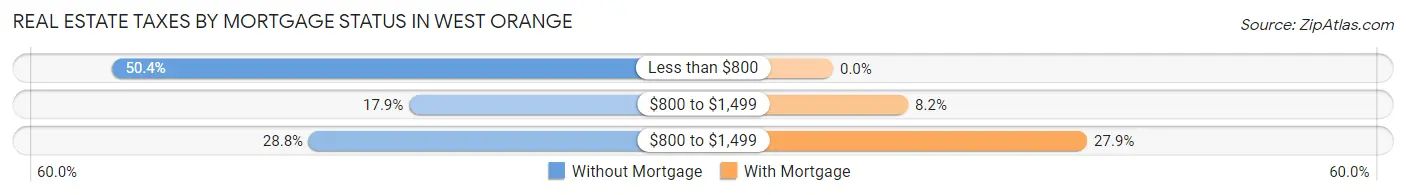
| Property Taxes | Without Mortgage | With Mortgage |
| Less than $800 | 344 (50.4%) | 0 (0.0%) |
| $800 to $1,499 | 122 (17.9%) | 26 (8.2%) |
| $800 to $1,499 | 197 (28.8%) | 88 (27.9%) |
| Total | 683 (100.0%) | 316 (100.0%) |
Health & Disability in West Orange
Health Insurance Coverage by Age in West Orange
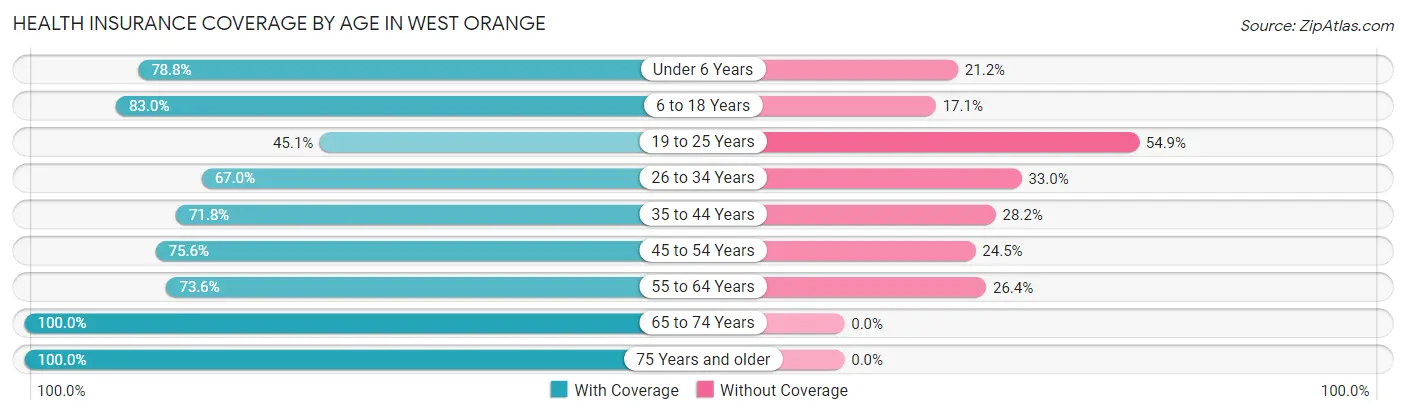
| Age Bracket | With Coverage | Without Coverage |
| Under 6 Years | 424 (78.8%) | 114 (21.2%) |
| 6 to 18 Years | 326 (83.0%) | 67 (17.1%) |
| 19 to 25 Years | 192 (45.1%) | 234 (54.9%) |
| 26 to 34 Years | 377 (67.0%) | 186 (33.0%) |
| 35 to 44 Years | 178 (71.8%) | 70 (28.2%) |
| 45 to 54 Years | 207 (75.5%) | 67 (24.4%) |
| 55 to 64 Years | 281 (73.6%) | 101 (26.4%) |
| 65 to 74 Years | 460 (100.0%) | 0 (0.0%) |
| 75 Years and older | 160 (100.0%) | 0 (0.0%) |
| Total | 2,605 (75.6%) | 839 (24.4%) |
Health Insurance Coverage by Citizenship Status in West Orange
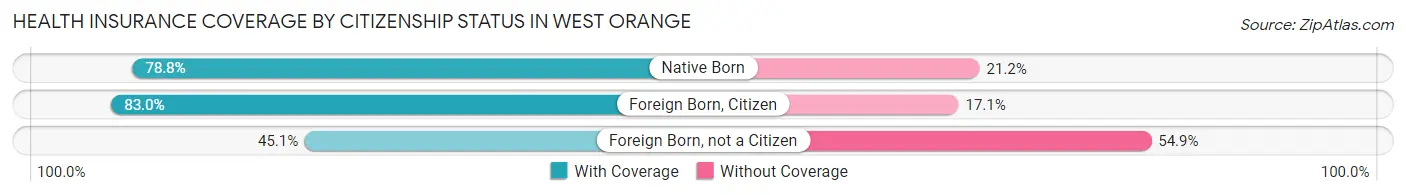
| Citizenship Status | With Coverage | Without Coverage |
| Native Born | 424 (78.8%) | 114 (21.2%) |
| Foreign Born, Citizen | 326 (83.0%) | 67 (17.1%) |
| Foreign Born, not a Citizen | 192 (45.1%) | 234 (54.9%) |
Health Insurance Coverage by Household Income in West Orange
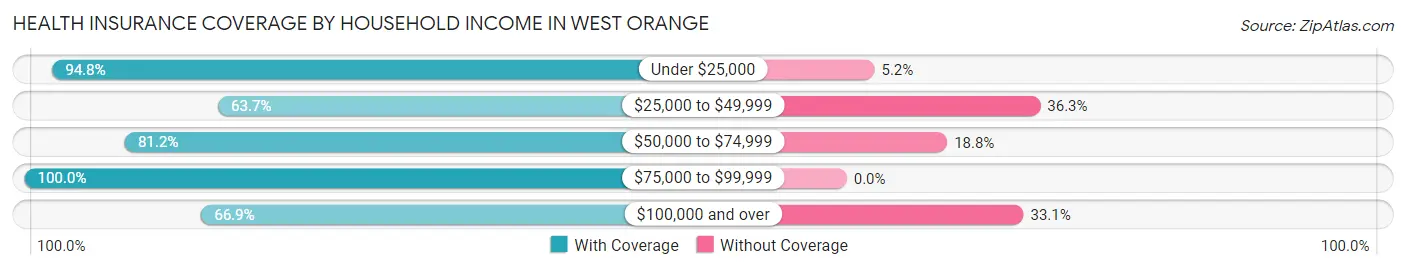
| Household Income | With Coverage | Without Coverage |
| Under $25,000 | 401 (94.8%) | 22 (5.2%) |
| $25,000 to $49,999 | 506 (63.7%) | 288 (36.3%) |
| $50,000 to $74,999 | 794 (81.2%) | 184 (18.8%) |
| $75,000 to $99,999 | 207 (100.0%) | 0 (0.0%) |
| $100,000 and over | 697 (66.9%) | 345 (33.1%) |
Public vs Private Health Insurance Coverage by Age in West Orange
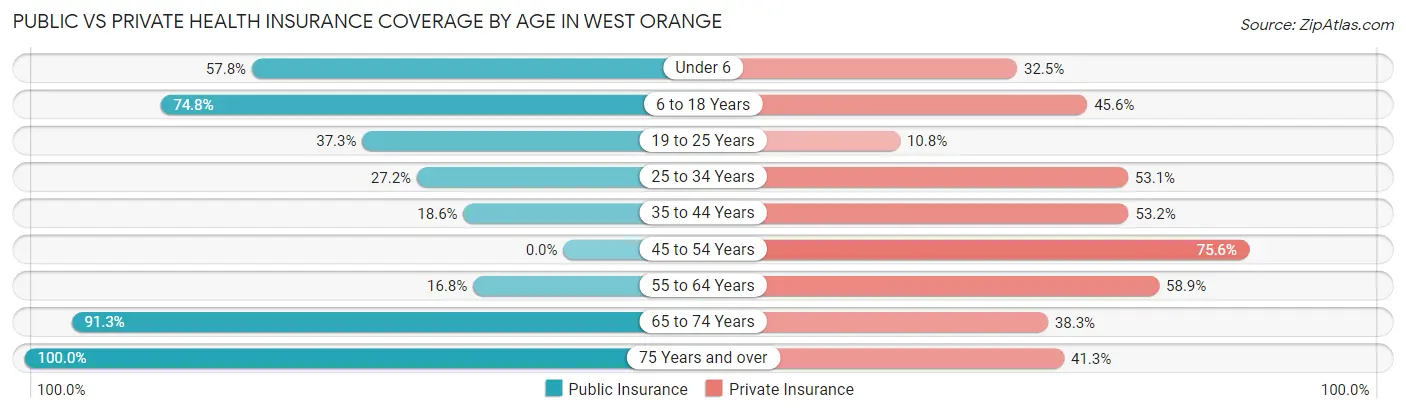
| Age Bracket | Public Insurance | Private Insurance |
| Under 6 | 311 (57.8%) | 175 (32.5%) |
| 6 to 18 Years | 294 (74.8%) | 179 (45.6%) |
| 19 to 25 Years | 159 (37.3%) | 46 (10.8%) |
| 25 to 34 Years | 153 (27.2%) | 299 (53.1%) |
| 35 to 44 Years | 46 (18.5%) | 132 (53.2%) |
| 45 to 54 Years | 0 (0.0%) | 207 (75.5%) |
| 55 to 64 Years | 64 (16.8%) | 225 (58.9%) |
| 65 to 74 Years | 420 (91.3%) | 176 (38.3%) |
| 75 Years and over | 160 (100.0%) | 66 (41.2%) |
| Total | 1,607 (46.7%) | 1,505 (43.7%) |
Disability Status by Sex by Age in West Orange
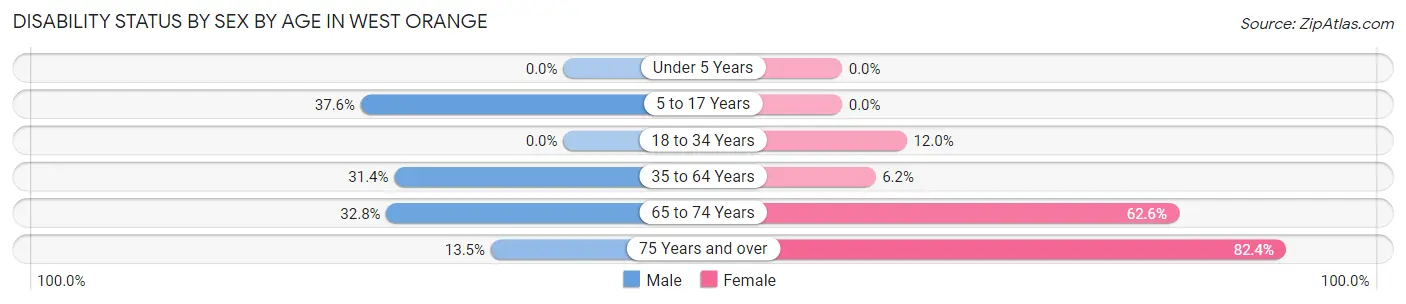
| Age Bracket | Male | Female |
| Under 5 Years | 0 (0.0%) | 0 (0.0%) |
| 5 to 17 Years | 100 (37.6%) | 0 (0.0%) |
| 18 to 34 Years | 0 (0.0%) | 71 (12.0%) |
| 35 to 64 Years | 117 (31.4%) | 33 (6.2%) |
| 65 to 74 Years | 66 (32.8%) | 162 (62.5%) |
| 75 Years and over | 7 (13.5%) | 89 (82.4%) |
Disability Class by Sex by Age in West Orange
Disability Class: Hearing Difficulty
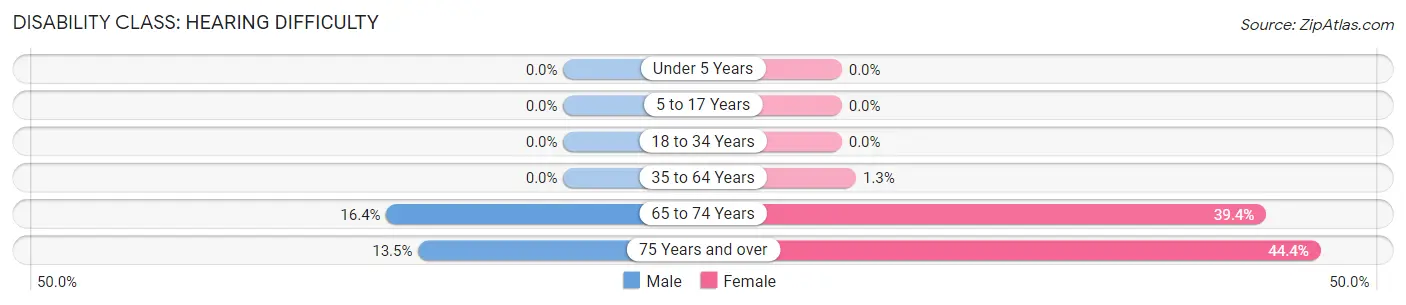
| Age Bracket | Male | Female |
| Under 5 Years | 0 (0.0%) | 0 (0.0%) |
| 5 to 17 Years | 0 (0.0%) | 0 (0.0%) |
| 18 to 34 Years | 0 (0.0%) | 0 (0.0%) |
| 35 to 64 Years | 0 (0.0%) | 7 (1.3%) |
| 65 to 74 Years | 33 (16.4%) | 102 (39.4%) |
| 75 Years and over | 7 (13.5%) | 48 (44.4%) |
Disability Class: Vision Difficulty
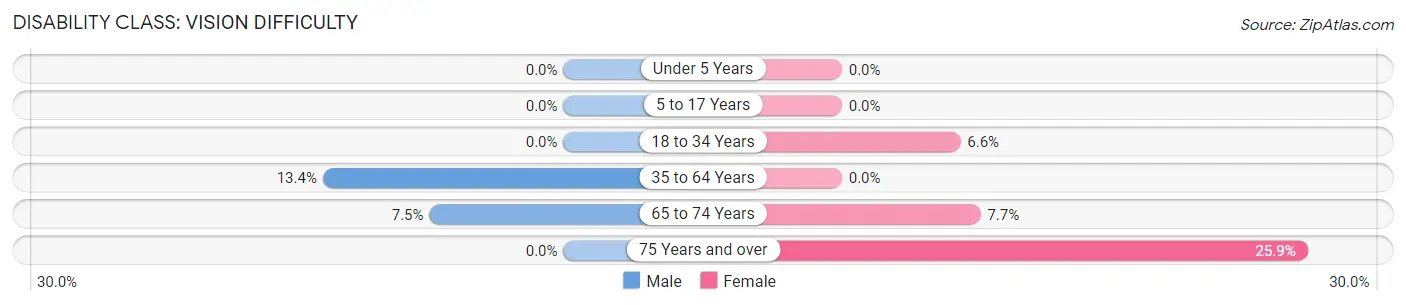
| Age Bracket | Male | Female |
| Under 5 Years | 0 (0.0%) | 0 (0.0%) |
| 5 to 17 Years | 0 (0.0%) | 0 (0.0%) |
| 18 to 34 Years | 0 (0.0%) | 39 (6.6%) |
| 35 to 64 Years | 50 (13.4%) | 0 (0.0%) |
| 65 to 74 Years | 15 (7.5%) | 20 (7.7%) |
| 75 Years and over | 0 (0.0%) | 28 (25.9%) |
Disability Class: Cognitive Difficulty
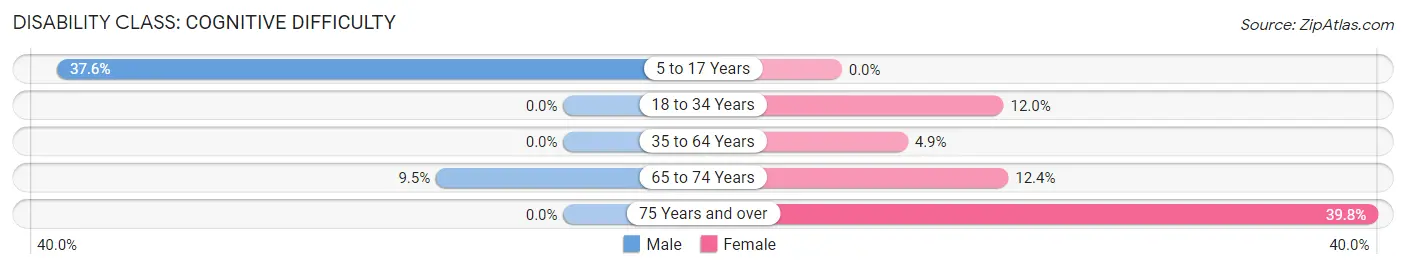
| Age Bracket | Male | Female |
| 5 to 17 Years | 100 (37.6%) | 0 (0.0%) |
| 18 to 34 Years | 0 (0.0%) | 71 (12.0%) |
| 35 to 64 Years | 0 (0.0%) | 26 (4.9%) |
| 65 to 74 Years | 19 (9.5%) | 32 (12.4%) |
| 75 Years and over | 0 (0.0%) | 43 (39.8%) |
Disability Class: Ambulatory Difficulty
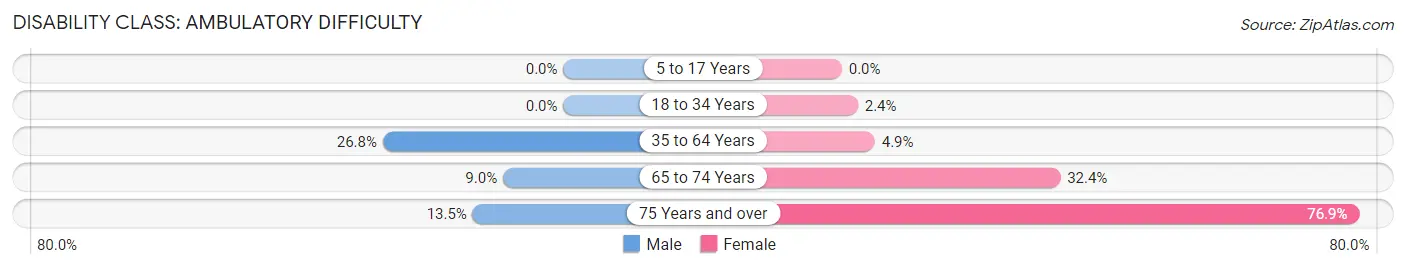
| Age Bracket | Male | Female |
| 5 to 17 Years | 0 (0.0%) | 0 (0.0%) |
| 18 to 34 Years | 0 (0.0%) | 14 (2.4%) |
| 35 to 64 Years | 100 (26.8%) | 26 (4.9%) |
| 65 to 74 Years | 18 (9.0%) | 84 (32.4%) |
| 75 Years and over | 7 (13.5%) | 83 (76.8%) |
Disability Class: Self-Care Difficulty
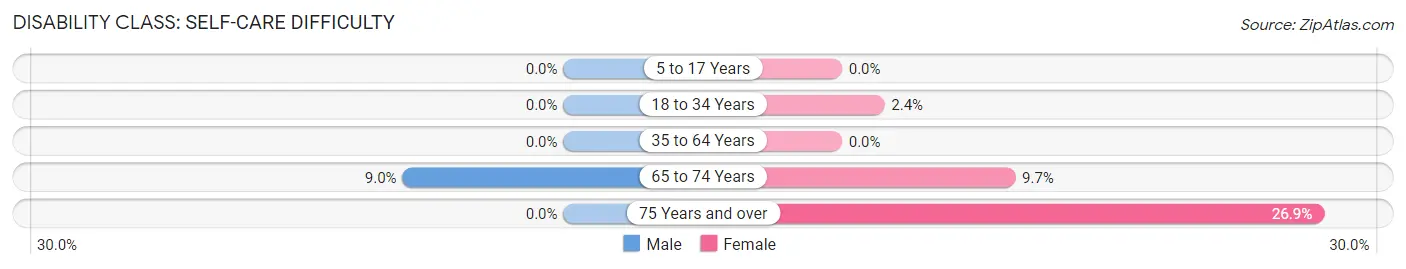
| Age Bracket | Male | Female |
| 5 to 17 Years | 0 (0.0%) | 0 (0.0%) |
| 18 to 34 Years | 0 (0.0%) | 14 (2.4%) |
| 35 to 64 Years | 0 (0.0%) | 0 (0.0%) |
| 65 to 74 Years | 18 (9.0%) | 25 (9.7%) |
| 75 Years and over | 0 (0.0%) | 29 (26.9%) |
Technology Access in West Orange
Computing Device Access in West Orange
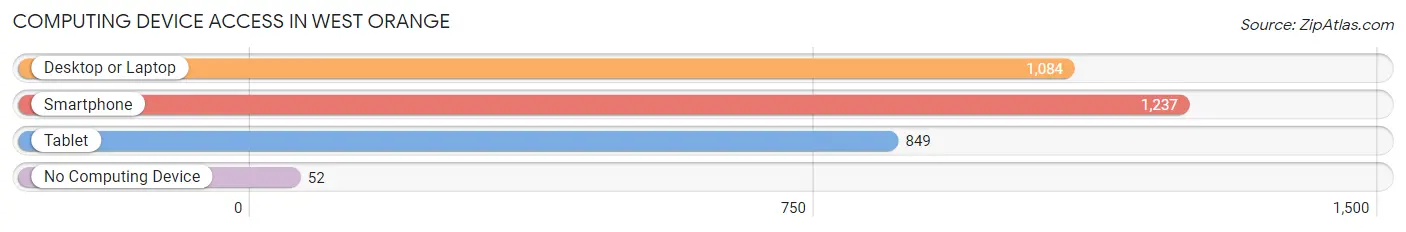
| Device Type | # Households | % Households |
| Desktop or Laptop | 1,084 | 81.5% |
| Smartphone | 1,237 | 93.0% |
| Tablet | 849 | 63.8% |
| No Computing Device | 52 | 3.9% |
| Total | 1,330 | 100.0% |
Internet Access in West Orange
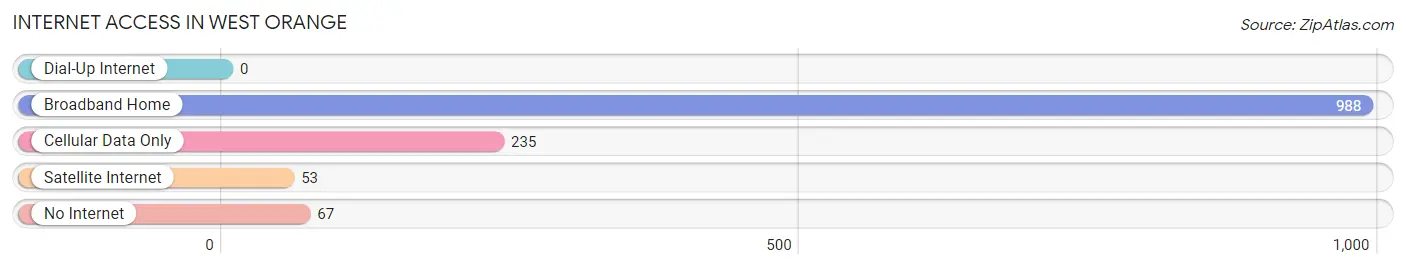
| Internet Type | # Households | % Households |
| Dial-Up Internet | 0 | 0.0% |
| Broadband Home | 988 | 74.3% |
| Cellular Data Only | 235 | 17.7% |
| Satellite Internet | 53 | 4.0% |
| No Internet | 67 | 5.0% |
| Total | 1,330 | 100.0% |
West Orange Summary
Orange County, Texas is located in the southeastern part of the state, and is bordered by Jefferson County to the north, Hardin County to the east, Jasper County to the south, and Newton County to the west. The county seat is Orange, and the largest city is West Orange. The county was established in 1852 and is named for the orange trees that were once abundant in the area.
Geography
Orange County is located in the southeastern part of Texas, and is bordered by Jefferson County to the north, Hardin County to the east, Jasper County to the south, and Newton County to the west. The county has a total area of 845 square miles, of which 843 square miles is land and 2 square miles is water. The terrain is mostly flat, with some rolling hills in the northern part of the county. The Sabine River forms the eastern border of the county, and the Neches River forms the western border.
The climate of Orange County is humid subtropical, with hot, humid summers and mild winters. The average annual temperature is 68°F, and the average annual precipitation is 48 inches.
Demographics
As of the 2010 census, the population of Orange County was 81,837, an increase of 8.3% since 2000. The population density was 97 people per square mile. The racial makeup of the county was 73.3% White, 18.2% African American, 0.5% Native American, 0.7% Asian, 5.7% from other races, and 1.6% from two or more races. Hispanic or Latino of any race were 14.3% of the population.
The median household income in Orange County was $45,837 in 2010, an increase of 8.3% since 2000. The per capita income was $21,845. About 14.3% of the population was below the poverty line.
Economy
Orange County’s economy is largely based on agriculture, with the main crops being cotton, corn, soybeans, and rice. The county is also home to several oil and gas production companies, as well as a number of manufacturing companies. The Port of Orange is a major port for the export of agricultural products.
West Orange
West Orange is the largest city in Orange County, with a population of 8,845 as of the 2010 census. The city is located on the western edge of the county, on the banks of the Neches River.
West Orange was founded in 1852, and was originally known as Orange. The city was renamed West Orange in 1875, when the town of Orange was established on the eastern side of the county.
West Orange is home to several historic sites, including the Stark House, the West Orange Cemetery, and the West Orange Museum. The city is also home to the West Orange-Stark High School, which is known for its football team, the West Orange-Stark Mustangs.
West Orange is served by the West Orange-Cove Consolidated Independent School District, which includes five elementary schools, two middle schools, and one high school. The city is also home to Lamar State College-Orange, a two-year college.
Conclusion
Orange County, Texas is located in the southeastern part of the state, and is bordered by Jefferson County to the north, Hardin County to the east, Jasper County to the south, and Newton County to the west. The county was established in 1852 and is named for the orange trees that were once abundant in the area. The county has a total area of 845 square miles, and the population was 81,837 as of the 2010 census. The economy of Orange County is largely based on agriculture, with the main crops being cotton, corn, soybeans, and rice. West Orange is the largest city in the county, with a population of 8,845 as of the 2010 census. The city is home to several historic sites, as well as the West Orange-Stark High School and Lamar State College-Orange.
Common Questions
What is Per Capita Income in West Orange?
Per Capita income in West Orange is $30,652.
What is the Median Family Income in West Orange?
Median Family Income in West Orange is $63,750.
What is the Median Household income in West Orange?
Median Household Income in West Orange is $63,409.
What is Inequality or Gini Index in West Orange?
Inequality or Gini Index in West Orange is 0.41.
What is the Total Population of West Orange?
Total Population of West Orange is 3,444.
What is the Total Male Population of West Orange?
Total Male Population of West Orange is 1,456.
What is the Total Female Population of West Orange?
Total Female Population of West Orange is 1,988.
What is the Ratio of Males per 100 Females in West Orange?
There are 73.24 Males per 100 Females in West Orange.
What is the Ratio of Females per 100 Males in West Orange?
There are 136.54 Females per 100 Males in West Orange.
What is the Median Population Age in West Orange?
Median Population Age in West Orange is 30.0 Years.
What is the Average Family Size in West Orange
Average Family Size in West Orange is 3.1 People.
What is the Average Household Size in West Orange
Average Household Size in West Orange is 2.6 People.
How Large is the Labor Force in West Orange?
There are 1,423 People in the Labor Forcein in West Orange.
What is the Percentage of People in the Labor Force in West Orange?
55.0% of People are in the Labor Force in West Orange.
What is the Unemployment Rate in West Orange?
Unemployment Rate in West Orange is 3.7%.