Panorama Village, TX Map & Demographics
Panorama Village Map
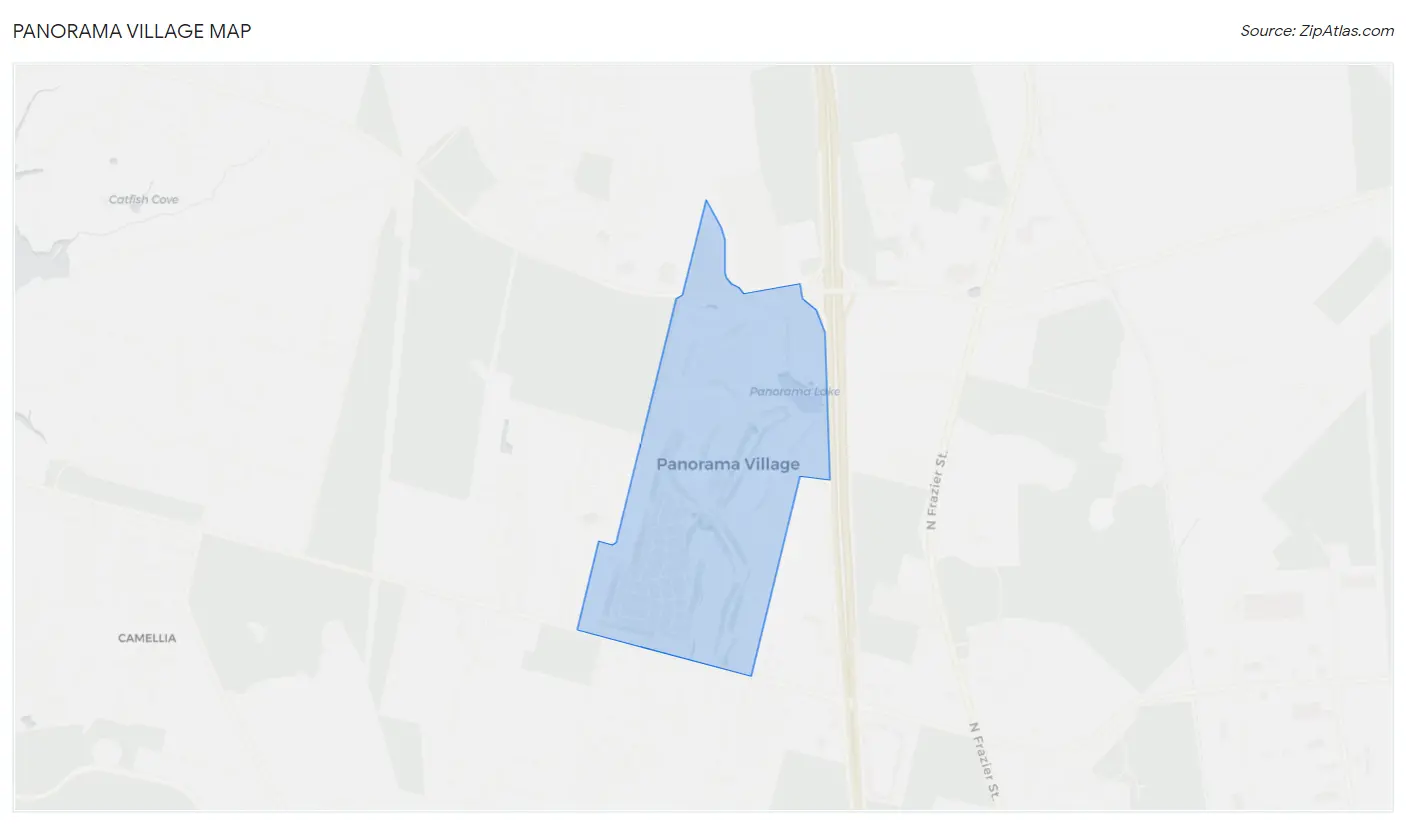
Panorama Village Overview
$35,885
PER CAPITA INCOME
$93,365
AVG FAMILY INCOME
$74,107
AVG HOUSEHOLD INCOME
50.3%
WAGE / INCOME GAP [ % ]
49.7¢/ $1
WAGE / INCOME GAP [ $ ]
0.36
INEQUALITY / GINI INDEX
2,513
TOTAL POPULATION
1,075
MALE POPULATION
1,438
FEMALE POPULATION
74.76
MALES / 100 FEMALES
133.77
FEMALES / 100 MALES
53.5
MEDIAN AGE
2.9
AVG FAMILY SIZE
2.4
AVG HOUSEHOLD SIZE
1,047
LABOR FORCE [ PEOPLE ]
50.4%
PERCENT IN LABOR FORCE
1.6%
UNEMPLOYMENT RATE
Panorama Village Area Codes
Income in Panorama Village
Income Overview in Panorama Village
Per Capita Income in Panorama Village is $35,885, while median incomes of families and households are $93,365 and $74,107 respectively.
| Characteristic | Number | Measure |
| Per Capita Income | 2,513 | $35,885 |
| Median Family Income | 723 | $93,365 |
| Mean Family Income | 723 | $100,578 |
| Median Household Income | 1,060 | $74,107 |
| Mean Household Income | 1,060 | $85,454 |
| Income Deficit | 723 | $0 |
| Wage / Income Gap (%) | 2,513 | 50.33% |
| Wage / Income Gap ($) | 2,513 | 49.67¢ per $1 |
| Gini / Inequality Index | 2,513 | 0.36 |
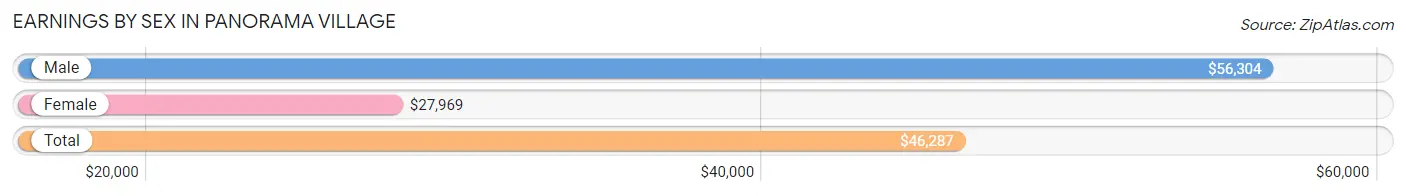
Earnings by Sex in Panorama Village
Average Earnings in Panorama Village are $46,287, $56,304 for men and $27,969 for women, a difference of 50.3%.
| Sex | Number | Average Earnings |
| Male | 590 (52.5%) | $56,304 |
| Female | 533 (47.5%) | $27,969 |
| Total | 1,123 (100.0%) | $46,287 |
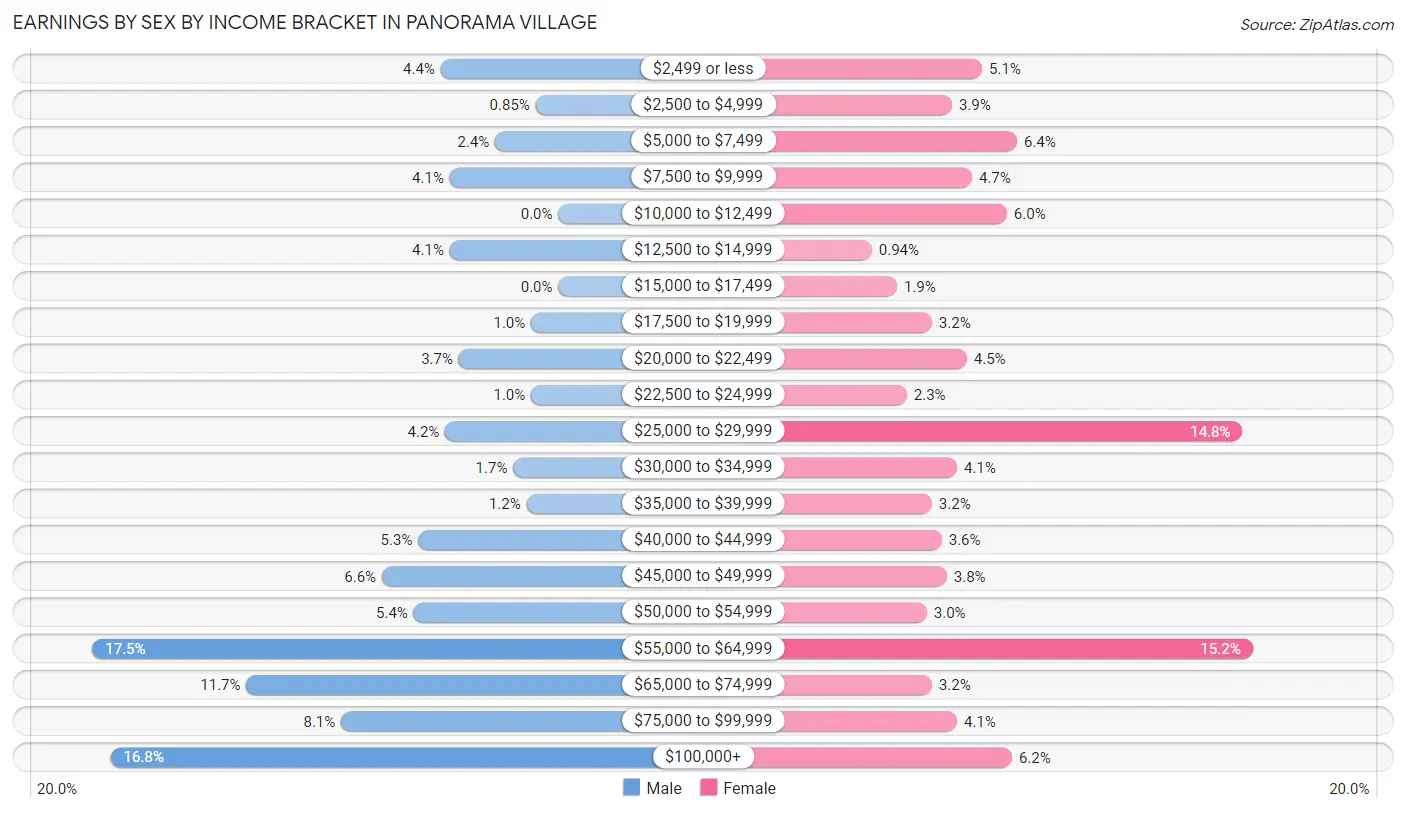
Earnings by Sex by Income Bracket in Panorama Village
The most common earnings brackets in Panorama Village are $55,000 to $64,999 for men (103 | 17.5%) and $55,000 to $64,999 for women (81 | 15.2%).
| Income | Male | Female |
| $2,499 or less | 26 (4.4%) | 27 (5.1%) |
| $2,500 to $4,999 | 5 (0.9%) | 21 (3.9%) |
| $5,000 to $7,499 | 14 (2.4%) | 34 (6.4%) |
| $7,500 to $9,999 | 24 (4.1%) | 25 (4.7%) |
| $10,000 to $12,499 | 0 (0.0%) | 32 (6.0%) |
| $12,500 to $14,999 | 24 (4.1%) | 5 (0.9%) |
| $15,000 to $17,499 | 0 (0.0%) | 10 (1.9%) |
| $17,500 to $19,999 | 6 (1.0%) | 17 (3.2%) |
| $20,000 to $22,499 | 22 (3.7%) | 24 (4.5%) |
| $22,500 to $24,999 | 6 (1.0%) | 12 (2.2%) |
| $25,000 to $29,999 | 25 (4.2%) | 79 (14.8%) |
| $30,000 to $34,999 | 10 (1.7%) | 22 (4.1%) |
| $35,000 to $39,999 | 7 (1.2%) | 17 (3.2%) |
| $40,000 to $44,999 | 31 (5.2%) | 19 (3.6%) |
| $45,000 to $49,999 | 39 (6.6%) | 20 (3.7%) |
| $50,000 to $54,999 | 32 (5.4%) | 16 (3.0%) |
| $55,000 to $64,999 | 103 (17.5%) | 81 (15.2%) |
| $65,000 to $74,999 | 69 (11.7%) | 17 (3.2%) |
| $75,000 to $99,999 | 48 (8.1%) | 22 (4.1%) |
| $100,000+ | 99 (16.8%) | 33 (6.2%) |
| Total | 590 (100.0%) | 533 (100.0%) |
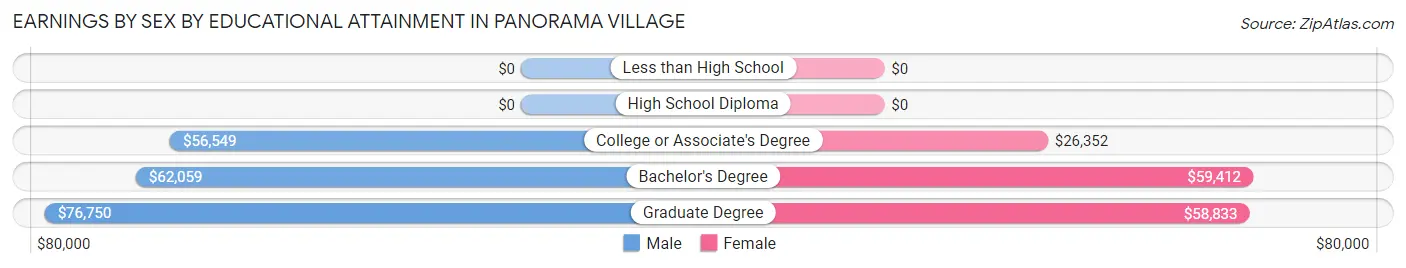
Earnings by Sex by Educational Attainment in Panorama Village
Average earnings in Panorama Village are $57,120 for men and $30,417 for women, a difference of 46.8%. Men with an educational attainment of graduate degree enjoy the highest average annual earnings of $76,750, while those with college or associate's degree education earn the least with $56,549. Women with an educational attainment of bachelor's degree earn the most with the average annual earnings of $59,412, while those with college or associate's degree education have the smallest earnings of $26,352.
| Educational Attainment | Male Income | Female Income |
| Less than High School | - | - |
| High School Diploma | - | - |
| College or Associate's Degree | $56,549 | $26,352 |
| Bachelor's Degree | $62,059 | $59,412 |
| Graduate Degree | $76,750 | $58,833 |
| Total | $57,120 | $30,417 |
Family Income in Panorama Village
Family Income Brackets in Panorama Village
According to the Panorama Village family income data, there are 202 families falling into the $100,000 to $149,999 income range, which is the most common income bracket and makes up 27.9% of all families.
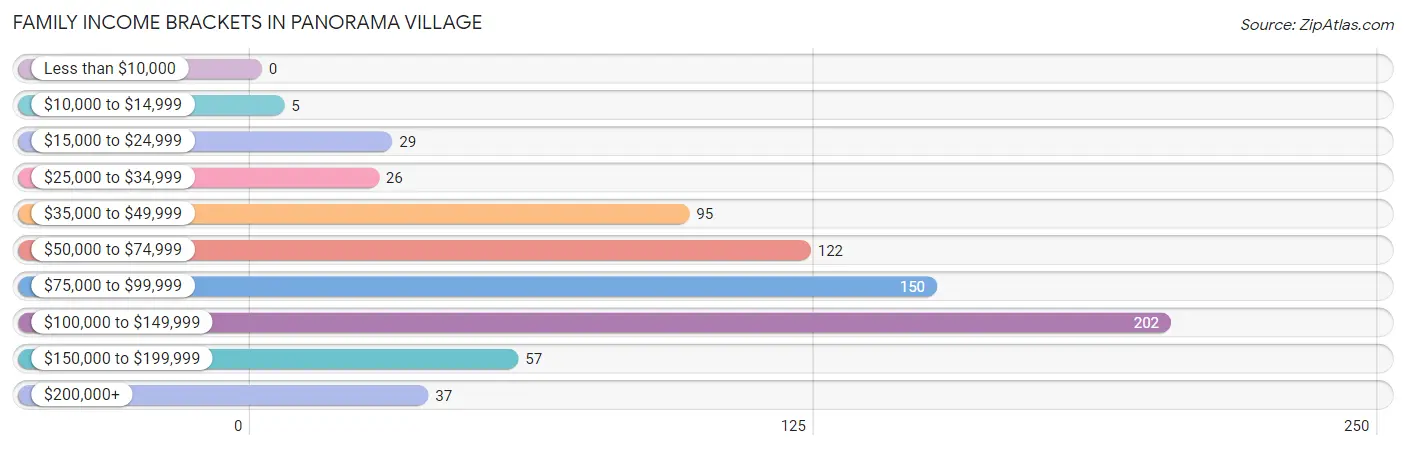
| Income Bracket | # Families | % Families |
| Less than $10,000 | 0 | 0.0% |
| $10,000 to $14,999 | 5 | 0.7% |
| $15,000 to $24,999 | 29 | 4.0% |
| $25,000 to $34,999 | 26 | 3.6% |
| $35,000 to $49,999 | 95 | 13.1% |
| $50,000 to $74,999 | 122 | 16.9% |
| $75,000 to $99,999 | 150 | 20.7% |
| $100,000 to $149,999 | 202 | 27.9% |
| $150,000 to $199,999 | 57 | 7.9% |
| $200,000+ | 37 | 5.1% |
Family Income by Famaliy Size in Panorama Village
4-person families (74 | 10.2%) account for the highest median family income in Panorama Village with $118,750 per family, while 2-person families (442 | 61.1%) have the highest median income of $38,203 per family member.
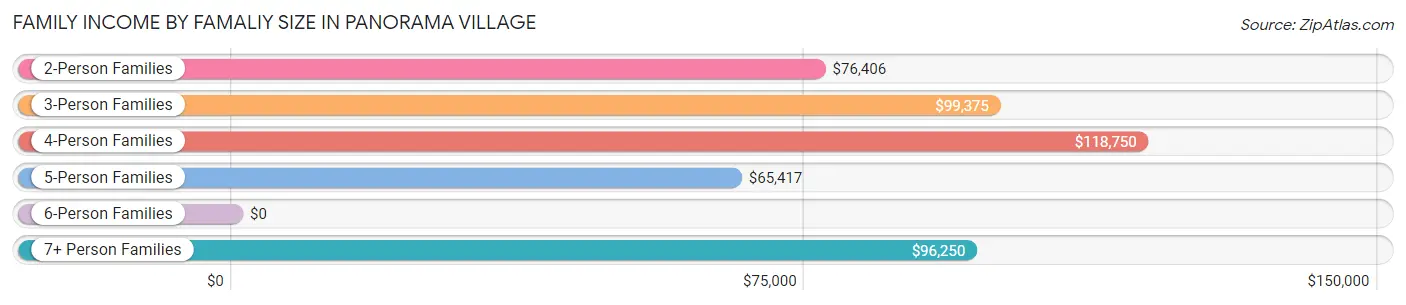
| Income Bracket | # Families | Median Income |
| 2-Person Families | 442 (61.1%) | $76,406 |
| 3-Person Families | 104 (14.4%) | $99,375 |
| 4-Person Families | 74 (10.2%) | $118,750 |
| 5-Person Families | 58 (8.0%) | $65,417 |
| 6-Person Families | 14 (1.9%) | $0 |
| 7+ Person Families | 31 (4.3%) | $96,250 |
| Total | 723 (100.0%) | $93,365 |
Family Income by Number of Earners in Panorama Village
The median family income in Panorama Village is $93,365, with families comprising 2 earners (257) having the highest median family income of $123,875, while families with no earners (161) have the lowest median family income of $52,813, accounting for 35.5% and 22.3% of families, respectively.
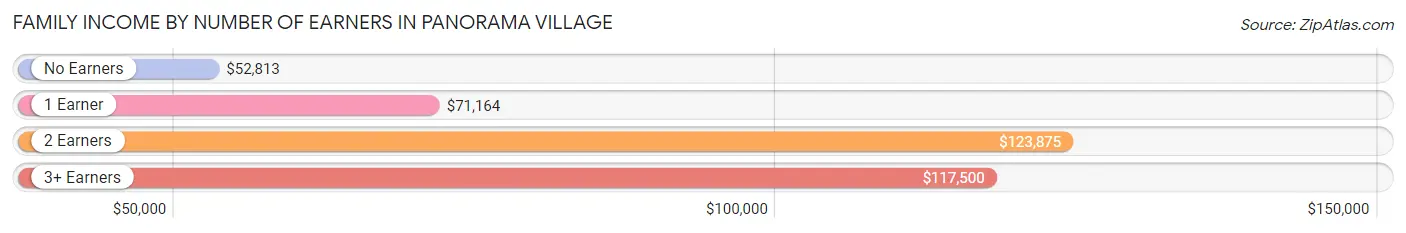
| Number of Earners | # Families | Median Income |
| No Earners | 161 (22.3%) | $52,813 |
| 1 Earner | 233 (32.2%) | $71,164 |
| 2 Earners | 257 (35.5%) | $123,875 |
| 3+ Earners | 72 (10.0%) | $117,500 |
| Total | 723 (100.0%) | $93,365 |
Household Income in Panorama Village
Household Income Brackets in Panorama Village
With 238 households falling in the category, the $100,000 to $149,999 income range is the most frequent in Panorama Village, accounting for 22.5% of all households. In contrast, only 10 households (0.9%) fall into the $10,000 to $14,999 income bracket, making it the least populous group.
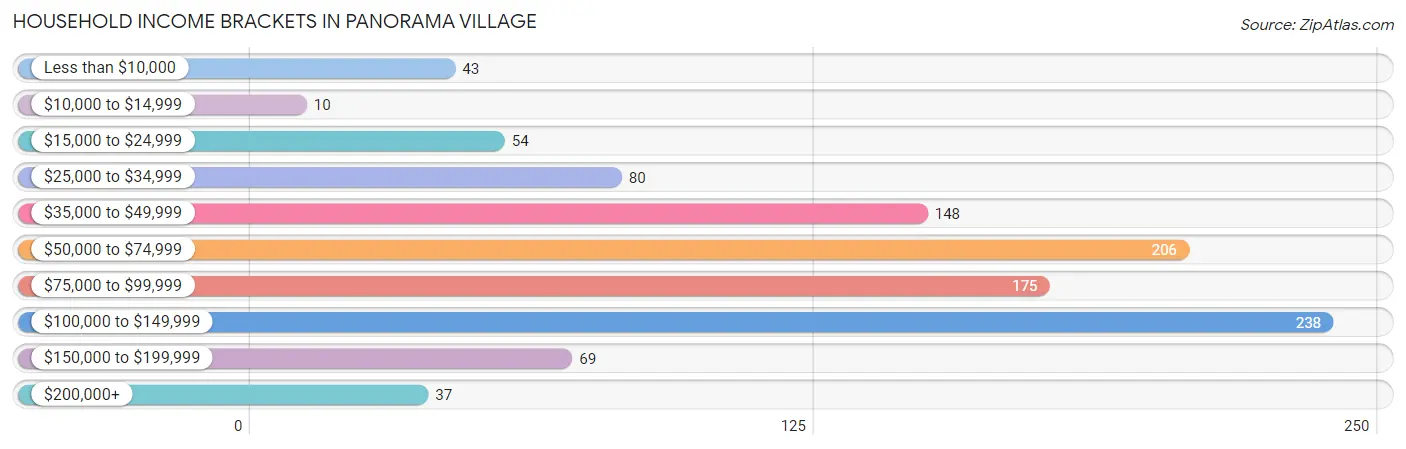
| Income Bracket | # Households | % Households |
| Less than $10,000 | 43 | 4.1% |
| $10,000 to $14,999 | 10 | 0.9% |
| $15,000 to $24,999 | 54 | 5.1% |
| $25,000 to $34,999 | 80 | 7.5% |
| $35,000 to $49,999 | 148 | 14.0% |
| $50,000 to $74,999 | 206 | 19.4% |
| $75,000 to $99,999 | 175 | 16.5% |
| $100,000 to $149,999 | 238 | 22.5% |
| $150,000 to $199,999 | 69 | 6.5% |
| $200,000+ | 37 | 3.5% |
Household Income by Householder Age in Panorama Village
The median household income in Panorama Village is $74,107, with the highest median household income of $118,929 found in the 25 to 44 years age bracket for the primary householder. A total of 190 households (17.9%) fall into this category.
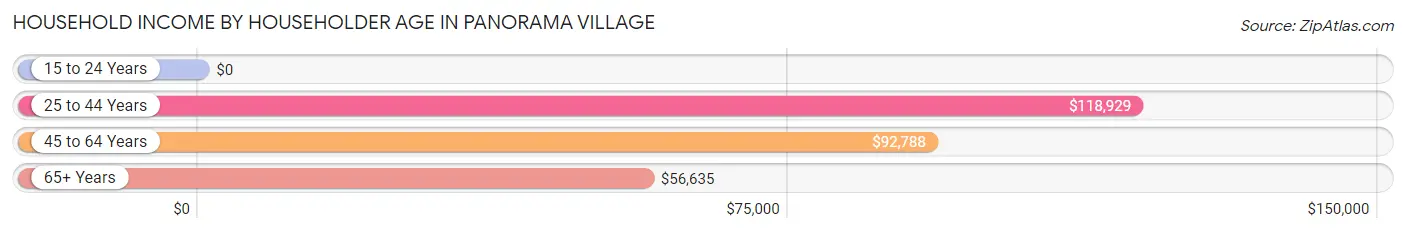
| Income Bracket | # Households | Median Income |
| 15 to 24 Years | 0 (0.0%) | $0 |
| 25 to 44 Years | 190 (17.9%) | $118,929 |
| 45 to 64 Years | 375 (35.4%) | $92,788 |
| 65+ Years | 495 (46.7%) | $56,635 |
| Total | 1,060 (100.0%) | $74,107 |
Poverty in Panorama Village
Income Below Poverty by Sex and Age in Panorama Village
With 5.1% poverty level for males and 6.1% for females among the residents of Panorama Village, 45 to 54 year old males and 75 year old and over females are the most vulnerable to poverty, with 20 males (15.9%) and 35 females (15.1%) in their respective age groups living below the poverty level.
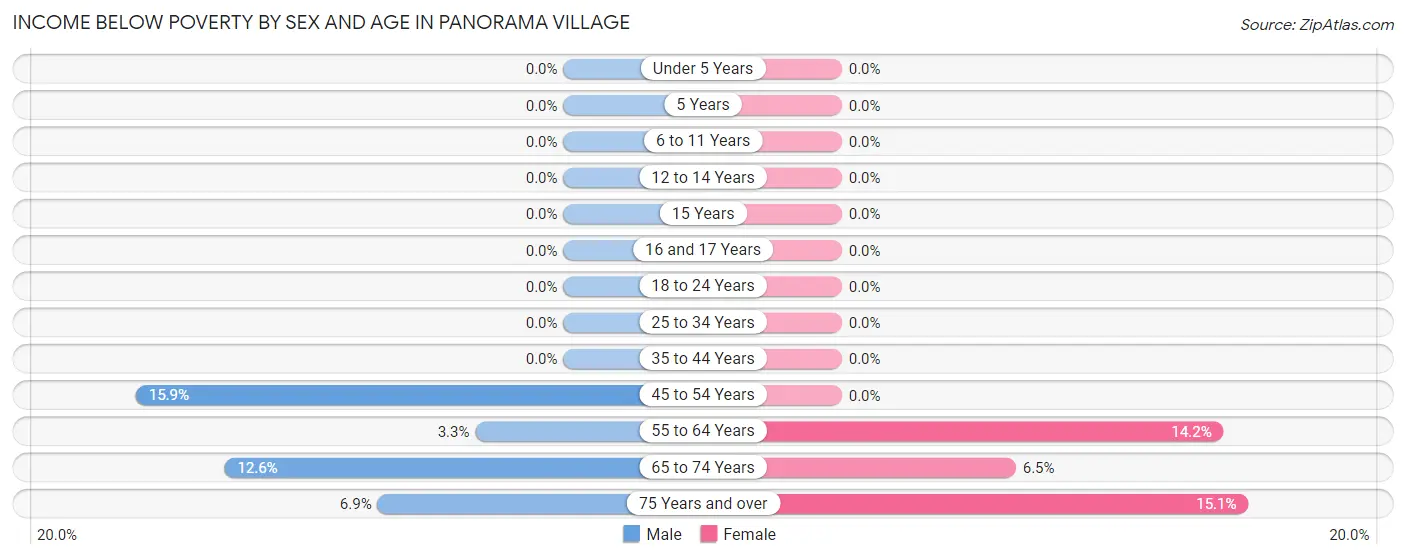
| Age Bracket | Male | Female |
| Under 5 Years | 0 (0.0%) | 0 (0.0%) |
| 5 Years | 0 (0.0%) | 0 (0.0%) |
| 6 to 11 Years | 0 (0.0%) | 0 (0.0%) |
| 12 to 14 Years | 0 (0.0%) | 0 (0.0%) |
| 15 Years | 0 (0.0%) | 0 (0.0%) |
| 16 and 17 Years | 0 (0.0%) | 0 (0.0%) |
| 18 to 24 Years | 0 (0.0%) | 0 (0.0%) |
| 25 to 34 Years | 0 (0.0%) | 0 (0.0%) |
| 35 to 44 Years | 0 (0.0%) | 0 (0.0%) |
| 45 to 54 Years | 20 (15.9%) | 0 (0.0%) |
| 55 to 64 Years | 5 (3.3%) | 34 (14.2%) |
| 65 to 74 Years | 19 (12.6%) | 19 (6.5%) |
| 75 Years and over | 10 (6.9%) | 35 (15.1%) |
| Total | 54 (5.1%) | 88 (6.1%) |
Income Above Poverty by Sex and Age in Panorama Village
According to the poverty statistics in Panorama Village, males aged under 5 years and females aged under 5 years are the age groups that are most secure financially, with 100.0% of males and 100.0% of females in these age groups living above the poverty line.
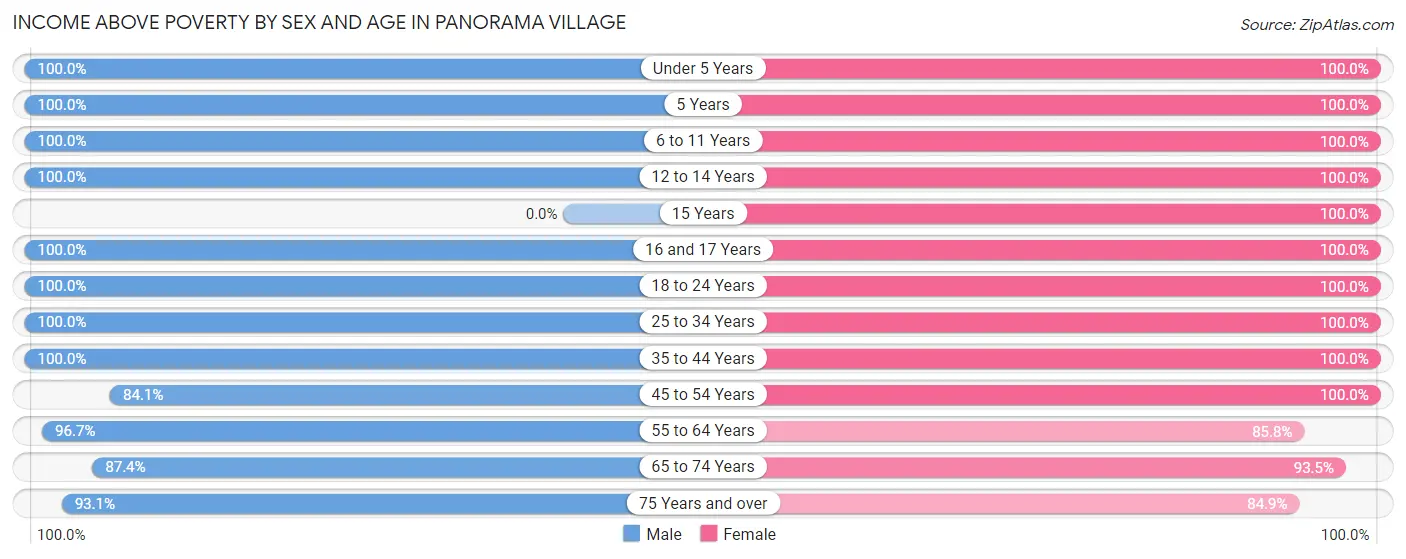
| Age Bracket | Male | Female |
| Under 5 Years | 67 (100.0%) | 60 (100.0%) |
| 5 Years | 20 (100.0%) | 17 (100.0%) |
| 6 to 11 Years | 84 (100.0%) | 119 (100.0%) |
| 12 to 14 Years | 21 (100.0%) | 24 (100.0%) |
| 15 Years | 0 (0.0%) | 11 (100.0%) |
| 16 and 17 Years | 30 (100.0%) | 10 (100.0%) |
| 18 to 24 Years | 32 (100.0%) | 60 (100.0%) |
| 25 to 34 Years | 125 (100.0%) | 150 (100.0%) |
| 35 to 44 Years | 115 (100.0%) | 112 (100.0%) |
| 45 to 54 Years | 106 (84.1%) | 103 (100.0%) |
| 55 to 64 Years | 148 (96.7%) | 206 (85.8%) |
| 65 to 74 Years | 132 (87.4%) | 275 (93.5%) |
| 75 Years and over | 135 (93.1%) | 197 (84.9%) |
| Total | 1,015 (95.0%) | 1,344 (93.9%) |
Income Below Poverty Among Married-Couple Families in Panorama Village
The poverty statistics for married-couple families in Panorama Village show that 2.2% or 14 of the total 623 families live below the poverty line. Families with no children have the highest poverty rate of 3.3%, comprising of 14 families. On the other hand, families with 1 or 2 children have the lowest poverty rate of 0.0%, which includes 0 families.
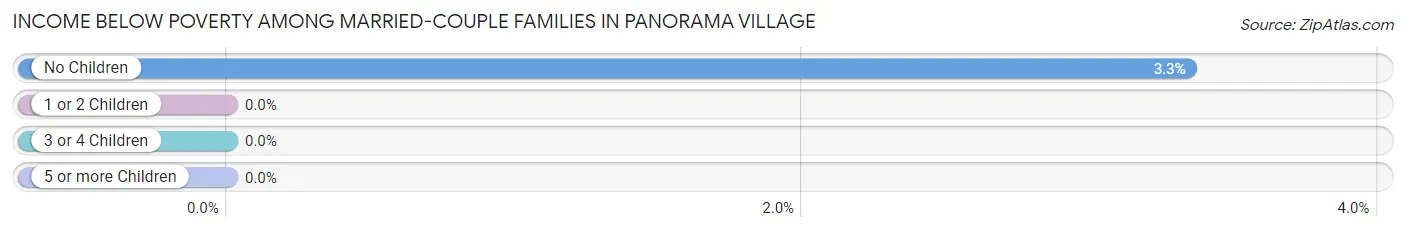
| Children | Above Poverty | Below Poverty |
| No Children | 405 (96.7%) | 14 (3.3%) |
| 1 or 2 Children | 128 (100.0%) | 0 (0.0%) |
| 3 or 4 Children | 70 (100.0%) | 0 (0.0%) |
| 5 or more Children | 6 (100.0%) | 0 (0.0%) |
| Total | 609 (97.8%) | 14 (2.2%) |
Income Below Poverty Among Single-Parent Households in Panorama Village
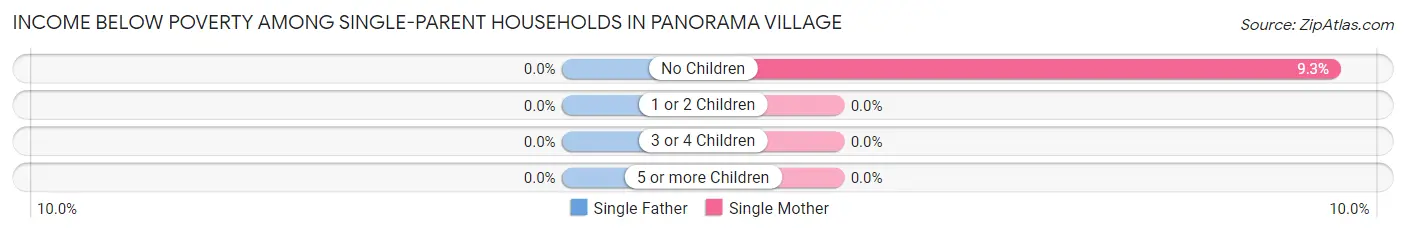
| Children | Single Father | Single Mother |
| No Children | 0 (0.0%) | 5 (9.3%) |
| 1 or 2 Children | 0 (0.0%) | 0 (0.0%) |
| 3 or 4 Children | 0 (0.0%) | 0 (0.0%) |
| 5 or more Children | 0 (0.0%) | 0 (0.0%) |
| Total | 0 (0.0%) | 5 (6.8%) |
Income Below Poverty Among Married-Couple vs Single-Parent Households in Panorama Village
The poverty data for Panorama Village shows that 14 of the married-couple family households (2.2%) and 5 of the single-parent households (5.0%) are living below the poverty level. Within the married-couple family households, those with no children have the highest poverty rate, with 14 households (3.3%) falling below the poverty line. Among the single-parent households, those with no children have the highest poverty rate, with 5 household (6.2%) living below poverty.
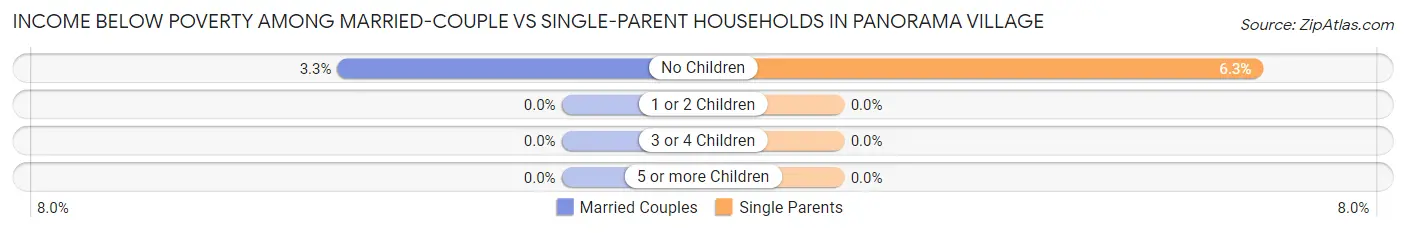
| Children | Married-Couple Families | Single-Parent Households |
| No Children | 14 (3.3%) | 5 (6.2%) |
| 1 or 2 Children | 0 (0.0%) | 0 (0.0%) |
| 3 or 4 Children | 0 (0.0%) | 0 (0.0%) |
| 5 or more Children | 0 (0.0%) | 0 (0.0%) |
| Total | 14 (2.2%) | 5 (5.0%) |
Race in Panorama Village
The most populous races in Panorama Village are White / Caucasian (2,233 | 88.9%), Hispanic or Latino (406 | 16.2%), and Two or more Races (185 | 7.4%).
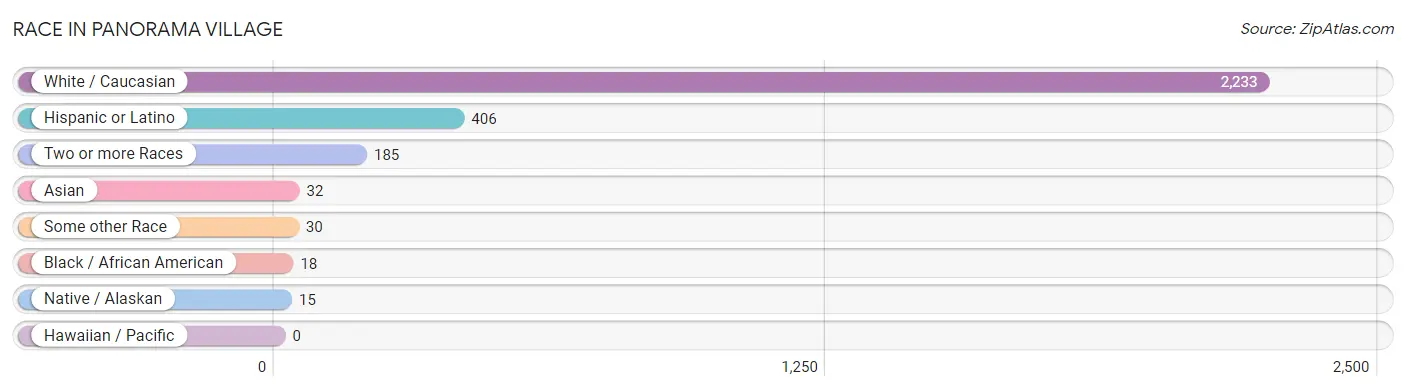
| Race | # Population | % Population |
| Asian | 32 | 1.3% |
| Black / African American | 18 | 0.7% |
| Hawaiian / Pacific | 0 | 0.0% |
| Hispanic or Latino | 406 | 16.2% |
| Native / Alaskan | 15 | 0.6% |
| White / Caucasian | 2,233 | 88.9% |
| Two or more Races | 185 | 7.4% |
| Some other Race | 30 | 1.2% |
| Total | 2,513 | 100.0% |
Ancestry in Panorama Village
The most populous ancestries reported in Panorama Village are German (490 | 19.5%), English (349 | 13.9%), Mexican (288 | 11.5%), Irish (265 | 10.5%), and American (188 | 7.5%), together accounting for 62.9% of all Panorama Village residents.
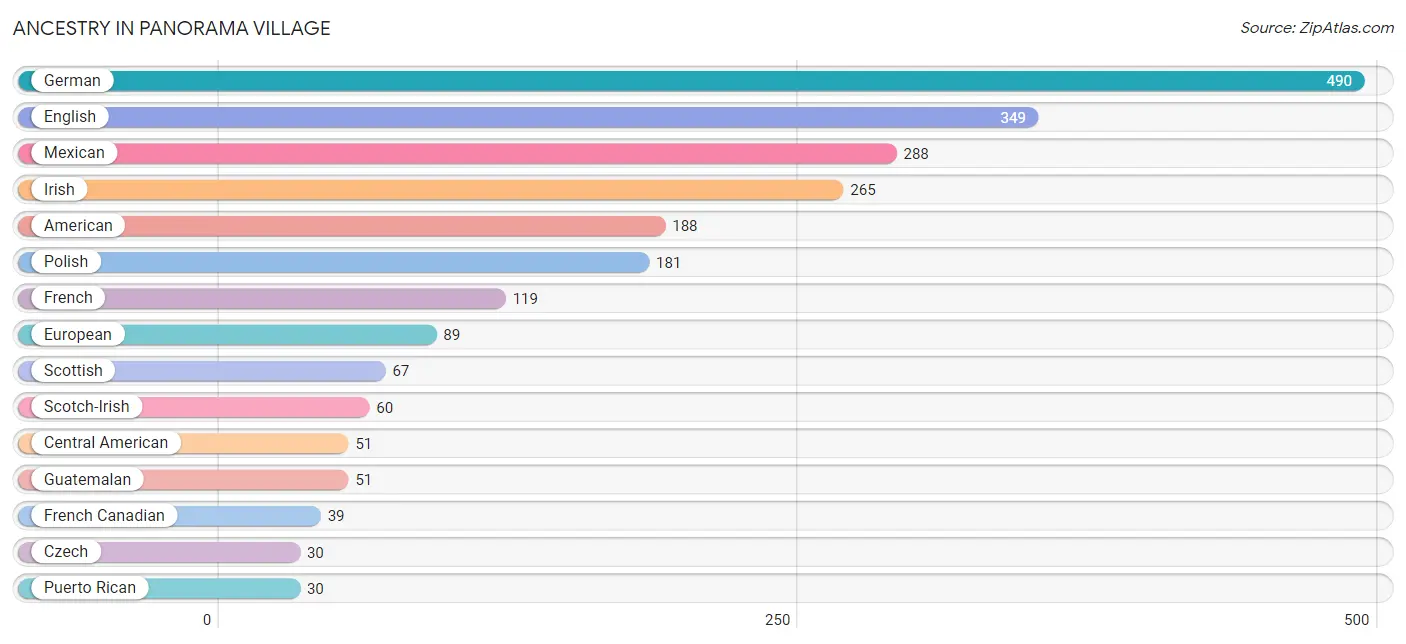
| Ancestry | # Population | % Population |
| Afghan | 6 | 0.2% |
| American | 188 | 7.5% |
| Austrian | 17 | 0.7% |
| British | 17 | 0.7% |
| Canadian | 6 | 0.2% |
| Central American | 51 | 2.0% |
| Cherokee | 12 | 0.5% |
| Chilean | 10 | 0.4% |
| Czech | 30 | 1.2% |
| Dutch | 28 | 1.1% |
| English | 349 | 13.9% |
| European | 89 | 3.5% |
| French | 119 | 4.7% |
| French Canadian | 39 | 1.5% |
| German | 490 | 19.5% |
| Greek | 17 | 0.7% |
| Guatemalan | 51 | 2.0% |
| Hungarian | 11 | 0.4% |
| Indian (Asian) | 21 | 0.8% |
| Irish | 265 | 10.5% |
| Italian | 26 | 1.0% |
| Jamaican | 6 | 0.2% |
| Korean | 4 | 0.2% |
| Mexican | 288 | 11.5% |
| Mexican American Indian | 15 | 0.6% |
| Norwegian | 22 | 0.9% |
| Pennsylvania German | 5 | 0.2% |
| Polish | 181 | 7.2% |
| Puerto Rican | 30 | 1.2% |
| Russian | 5 | 0.2% |
| Scotch-Irish | 60 | 2.4% |
| Scottish | 67 | 2.7% |
| South American | 10 | 0.4% |
| Spaniard | 7 | 0.3% |
| Swedish | 11 | 0.4% |
| Swiss | 11 | 0.4% |
| Thai | 16 | 0.6% |
| Welsh | 14 | 0.6% | View All 38 Rows |
Immigrants in Panorama Village
The most numerous immigrant groups reported in Panorama Village came from Asia (25 | 1.0%), Europe (15 | 0.6%), Northern Europe (15 | 0.6%), Scotland (15 | 0.6%), and Latin America (12 | 0.5%), together accounting for 3.3% of all Panorama Village residents.
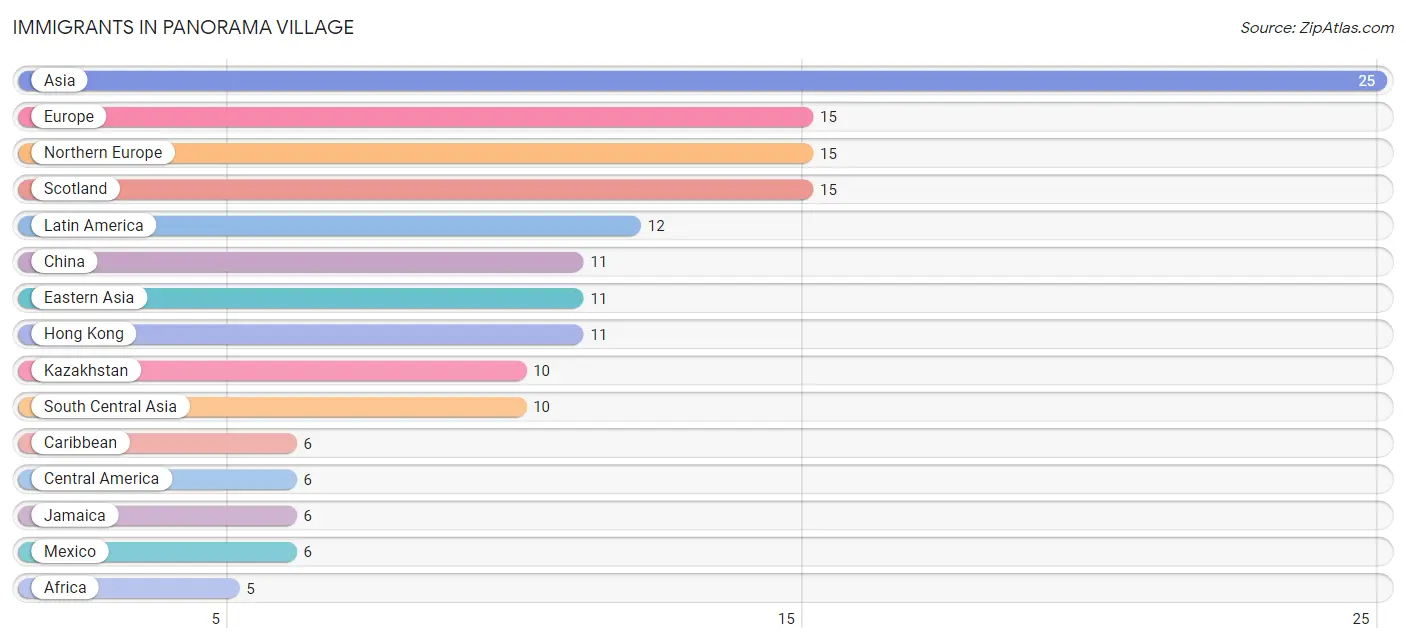
| Immigration Origin | # Population | % Population |
| Africa | 5 | 0.2% |
| Asia | 25 | 1.0% |
| Caribbean | 6 | 0.2% |
| Central America | 6 | 0.2% |
| China | 11 | 0.4% |
| Eastern Asia | 11 | 0.4% |
| Europe | 15 | 0.6% |
| Hong Kong | 11 | 0.4% |
| Jamaica | 6 | 0.2% |
| Kazakhstan | 10 | 0.4% |
| Latin America | 12 | 0.5% |
| Mexico | 6 | 0.2% |
| Northern Africa | 5 | 0.2% |
| Northern Europe | 15 | 0.6% |
| Philippines | 4 | 0.2% |
| Scotland | 15 | 0.6% |
| South Central Asia | 10 | 0.4% |
| South Eastern Asia | 4 | 0.2% | View All 18 Rows |
Sex and Age in Panorama Village
Sex and Age in Panorama Village
The most populous age groups in Panorama Village are 60 to 64 Years (130 | 12.1%) for men and 70 to 74 Years (161 | 11.2%) for women.
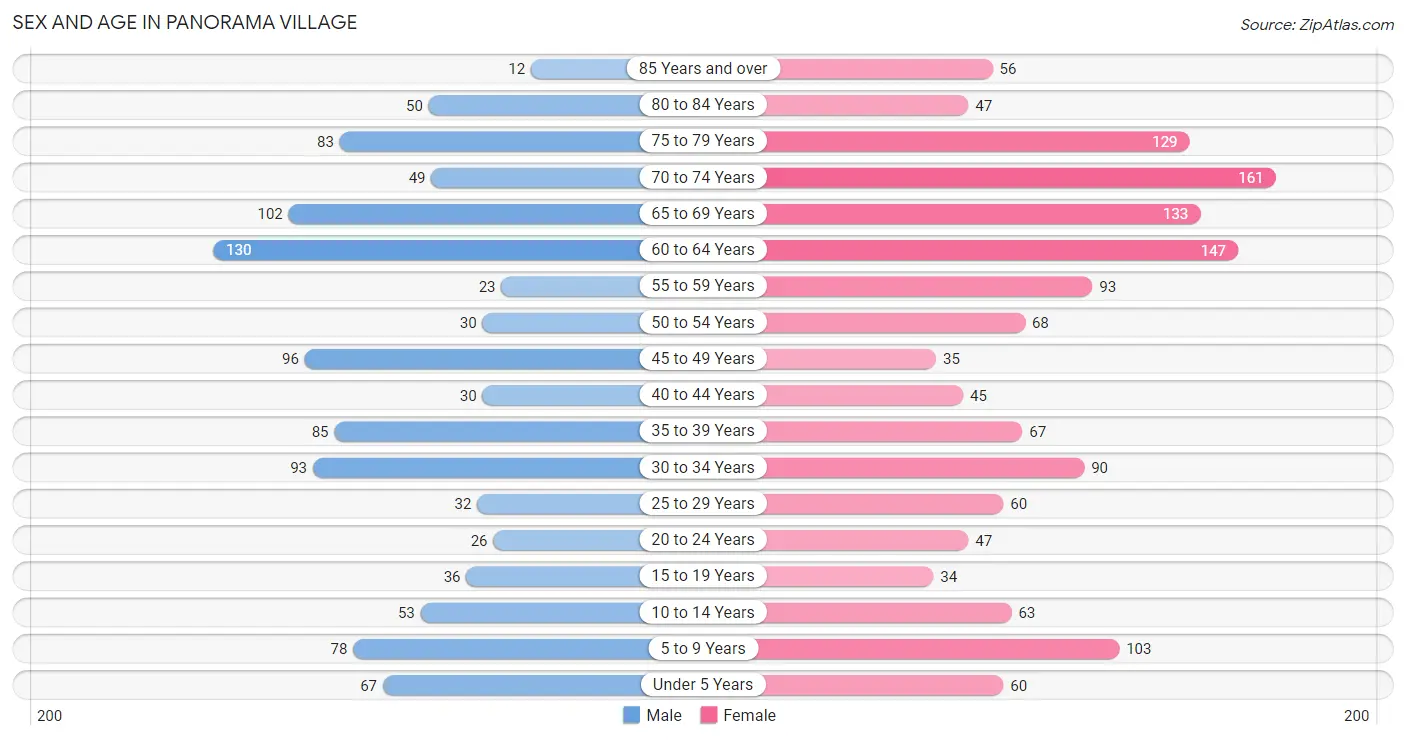
| Age Bracket | Male | Female |
| Under 5 Years | 67 (6.2%) | 60 (4.2%) |
| 5 to 9 Years | 78 (7.3%) | 103 (7.2%) |
| 10 to 14 Years | 53 (4.9%) | 63 (4.4%) |
| 15 to 19 Years | 36 (3.4%) | 34 (2.4%) |
| 20 to 24 Years | 26 (2.4%) | 47 (3.3%) |
| 25 to 29 Years | 32 (3.0%) | 60 (4.2%) |
| 30 to 34 Years | 93 (8.6%) | 90 (6.3%) |
| 35 to 39 Years | 85 (7.9%) | 67 (4.7%) |
| 40 to 44 Years | 30 (2.8%) | 45 (3.1%) |
| 45 to 49 Years | 96 (8.9%) | 35 (2.4%) |
| 50 to 54 Years | 30 (2.8%) | 68 (4.7%) |
| 55 to 59 Years | 23 (2.1%) | 93 (6.5%) |
| 60 to 64 Years | 130 (12.1%) | 147 (10.2%) |
| 65 to 69 Years | 102 (9.5%) | 133 (9.2%) |
| 70 to 74 Years | 49 (4.6%) | 161 (11.2%) |
| 75 to 79 Years | 83 (7.7%) | 129 (9.0%) |
| 80 to 84 Years | 50 (4.6%) | 47 (3.3%) |
| 85 Years and over | 12 (1.1%) | 56 (3.9%) |
| Total | 1,075 (100.0%) | 1,438 (100.0%) |
Families and Households in Panorama Village
Median Family Size in Panorama Village
The median family size in Panorama Village is 2.92 persons per family, with married-couple families (623 | 86.2%) accounting for the largest median family size of 2.97 persons per family. On the other hand, single male/father families (26 | 3.6%) represent the smallest median family size with 1.92 persons per family.
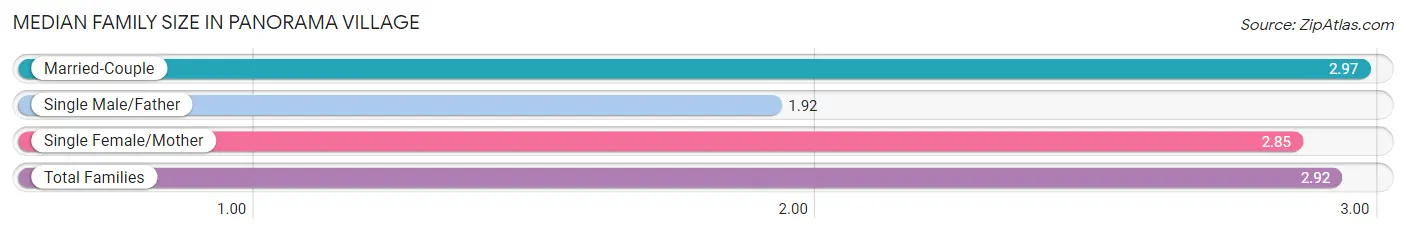
| Family Type | # Families | Family Size |
| Married-Couple | 623 (86.2%) | 2.97 |
| Single Male/Father | 26 (3.6%) | 1.92 |
| Single Female/Mother | 74 (10.2%) | 2.85 |
| Total Families | 723 (100.0%) | 2.92 |
Median Household Size in Panorama Village
The median household size in Panorama Village is 2.37 persons per household, with married-couple households (623 | 58.8%) accounting for the largest median household size of 2.99 persons per household. non-family households (337 | 31.8%) represent the smallest median household size with 1.15 persons per household.
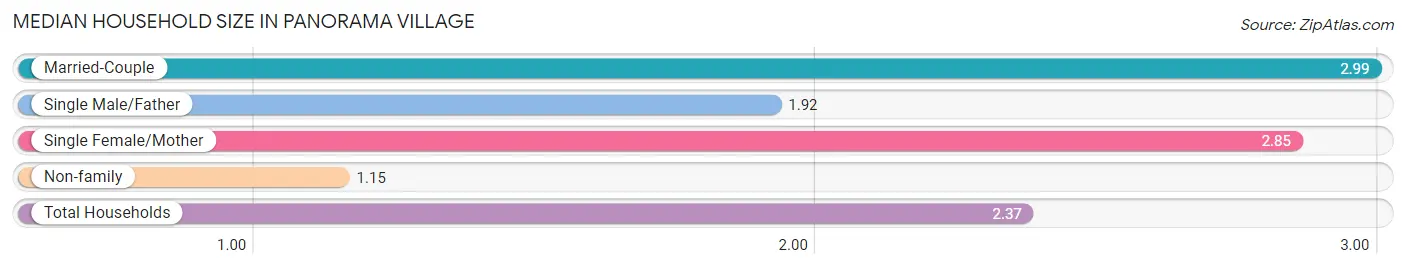
| Household Type | # Households | Household Size |
| Married-Couple | 623 (58.8%) | 2.99 |
| Single Male/Father | 26 (2.5%) | 1.92 |
| Single Female/Mother | 74 (7.0%) | 2.85 |
| Non-family | 337 (31.8%) | 1.15 |
| Total Households | 1,060 (100.0%) | 2.37 |
Household Size by Marriage Status in Panorama Village
Out of a total of 1,060 households in Panorama Village, 723 (68.2%) are family households, while 337 (31.8%) are nonfamily households. The most numerous type of family households are 2-person households, comprising 437, and the most common type of nonfamily households are 1-person households, comprising 299.
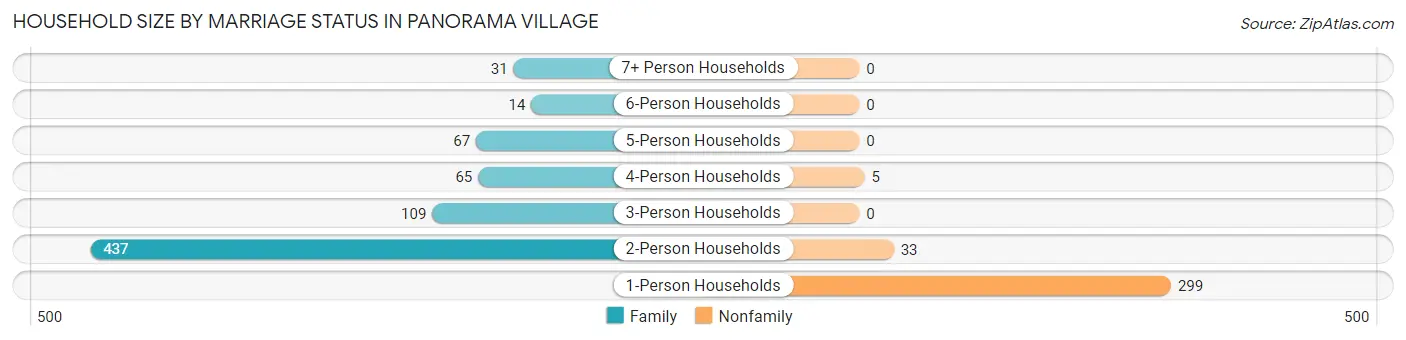
| Household Size | Family Households | Nonfamily Households |
| 1-Person Households | - | 299 (28.2%) |
| 2-Person Households | 437 (41.2%) | 33 (3.1%) |
| 3-Person Households | 109 (10.3%) | 0 (0.0%) |
| 4-Person Households | 65 (6.1%) | 5 (0.5%) |
| 5-Person Households | 67 (6.3%) | 0 (0.0%) |
| 6-Person Households | 14 (1.3%) | 0 (0.0%) |
| 7+ Person Households | 31 (2.9%) | 0 (0.0%) |
| Total | 723 (68.2%) | 337 (31.8%) |
Female Fertility in Panorama Village
Fertility by Age in Panorama Village
Average fertility rate in Panorama Village is 13.0 births per 1,000 women. Women in the age bracket of 20 to 34 years have the highest fertility rate with 25.0 births per 1,000 women. Women in the age bracket of 20 to 34 years acount for 100.0% of all women with births.
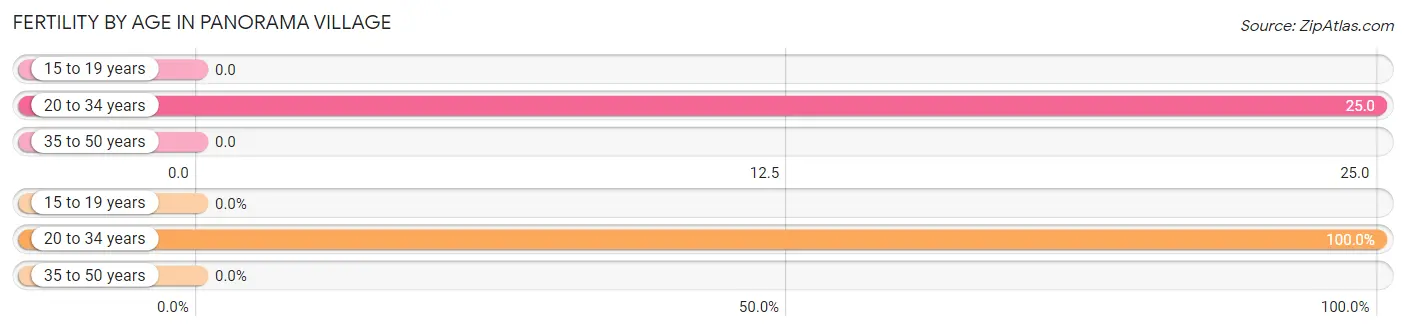
| Age Bracket | Women with Births | Births / 1,000 Women |
| 15 to 19 years | 0 (0.0%) | 0.0 |
| 20 to 34 years | 5 (100.0%) | 25.0 |
| 35 to 50 years | 0 (0.0%) | 0.0 |
| Total | 5 (100.0%) | 13.0 |
Fertility by Age by Marriage Status in Panorama Village
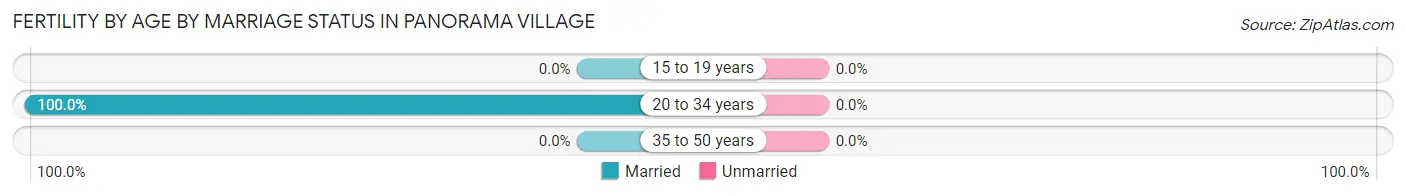
| Age Bracket | Married | Unmarried |
| 15 to 19 years | 0 (0.0%) | 0 (0.0%) |
| 20 to 34 years | 5 (100.0%) | 0 (0.0%) |
| 35 to 50 years | 0 (0.0%) | 0 (0.0%) |
| Total | 5 (100.0%) | 0 (0.0%) |
Fertility by Education in Panorama Village
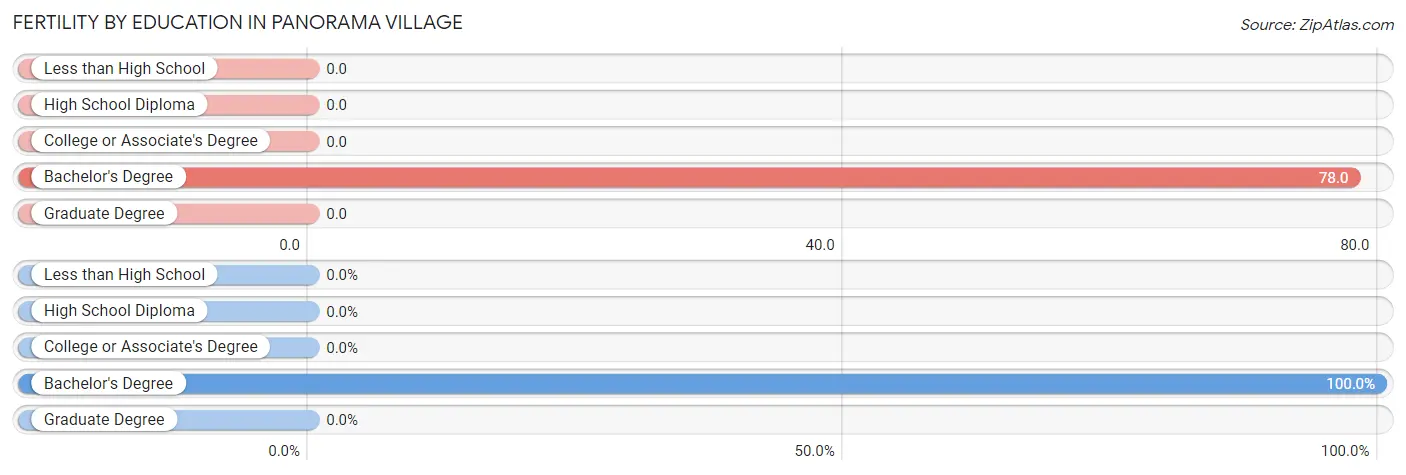
| Educational Attainment | Women with Births | Births / 1,000 Women |
| Less than High School | 0 (0.0%) | 0.0 |
| High School Diploma | 0 (0.0%) | 0.0 |
| College or Associate's Degree | 0 (0.0%) | 0.0 |
| Bachelor's Degree | 5 (100.0%) | 78.0 |
| Graduate Degree | 0 (0.0%) | 0.0 |
| Total | 5 (100.0%) | 13.0 |
Fertility by Education by Marriage Status in Panorama Village
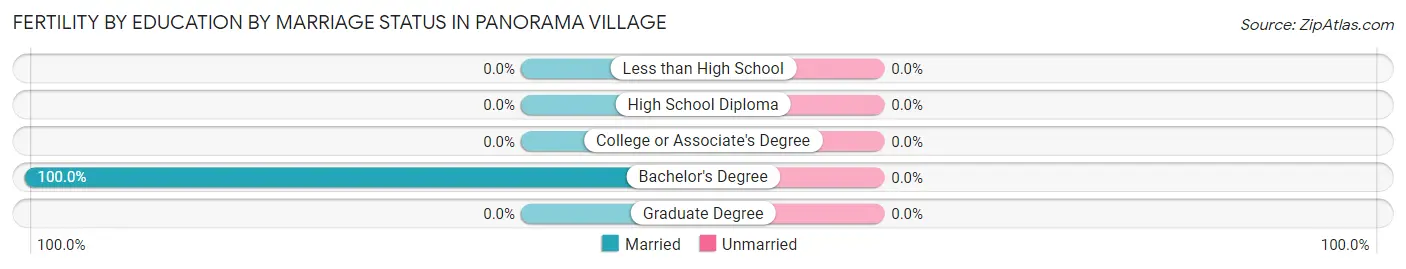
| Educational Attainment | Married | Unmarried |
| Less than High School | 0 (0.0%) | 0 (0.0%) |
| High School Diploma | 0 (0.0%) | 0 (0.0%) |
| College or Associate's Degree | 0 (0.0%) | 0 (0.0%) |
| Bachelor's Degree | 5 (100.0%) | 0 (0.0%) |
| Graduate Degree | 0 (0.0%) | 0 (0.0%) |
| Total | 5 (100.0%) | 0 (0.0%) |
Employment Characteristics in Panorama Village
Employment by Class of Employer in Panorama Village
Among the 1,011 employed individuals in Panorama Village, private company employees (591 | 58.5%), self-employed (not incorporated) (110 | 10.9%), and local government employees (108 | 10.7%) make up the most common classes of employment.
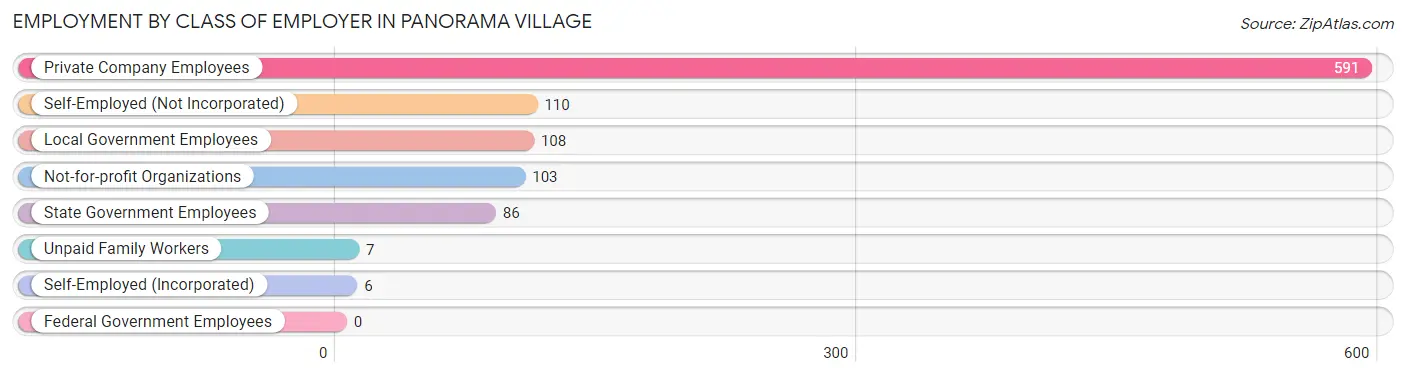
| Employer Class | # Employees | % Employees |
| Private Company Employees | 591 | 58.5% |
| Self-Employed (Incorporated) | 6 | 0.6% |
| Self-Employed (Not Incorporated) | 110 | 10.9% |
| Not-for-profit Organizations | 103 | 10.2% |
| Local Government Employees | 108 | 10.7% |
| State Government Employees | 86 | 8.5% |
| Federal Government Employees | 0 | 0.0% |
| Unpaid Family Workers | 7 | 0.7% |
| Total | 1,011 | 100.0% |
Employment Status by Age in Panorama Village
According to the labor force statistics for Panorama Village, out of the total population over 16 years of age (2,078), 50.4% or 1,047 individuals are in the labor force, with 1.6% or 17 of them unemployed. The age group with the highest labor force participation rate is 45 to 54 years, with 88.2% or 202 individuals in the labor force. Within the labor force, the 20 to 24 years age range has the highest percentage of unemployed individuals, with 26.8% or 11 of them being unemployed.
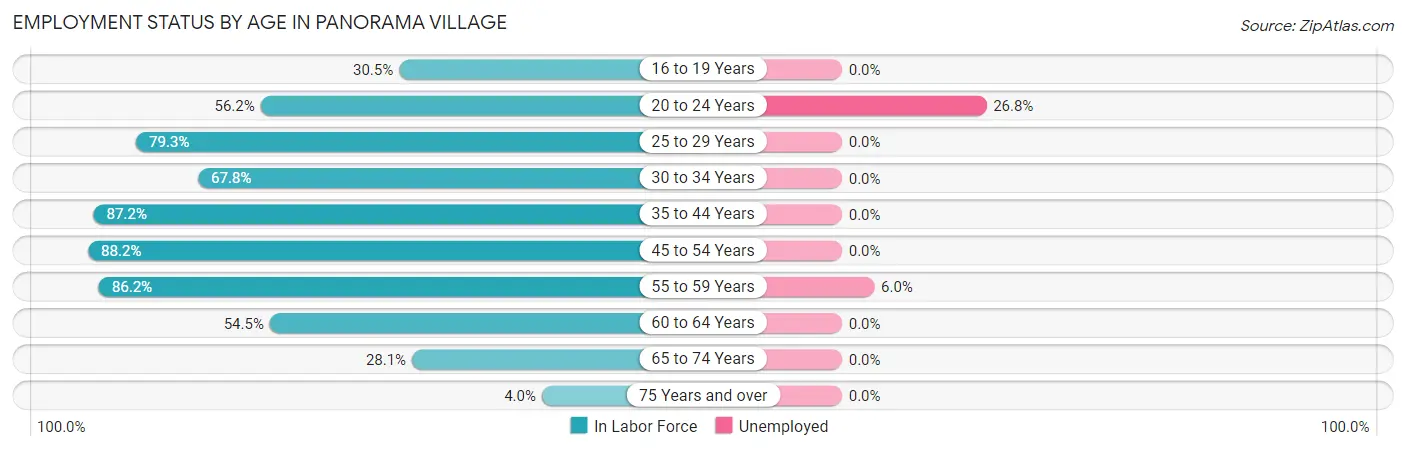
| Age Bracket | In Labor Force | Unemployed |
| 16 to 19 Years | 18 (30.5%) | 0 (0.0%) |
| 20 to 24 Years | 41 (56.2%) | 11 (26.8%) |
| 25 to 29 Years | 73 (79.3%) | 0 (0.0%) |
| 30 to 34 Years | 124 (67.8%) | 0 (0.0%) |
| 35 to 44 Years | 198 (87.2%) | 0 (0.0%) |
| 45 to 54 Years | 202 (88.2%) | 0 (0.0%) |
| 55 to 59 Years | 100 (86.2%) | 6 (6.0%) |
| 60 to 64 Years | 151 (54.5%) | 0 (0.0%) |
| 65 to 74 Years | 125 (28.1%) | 0 (0.0%) |
| 75 Years and over | 15 (4.0%) | 0 (0.0%) |
| Total | 1,047 (50.4%) | 17 (1.6%) |
Employment Status by Educational Attainment in Panorama Village
According to labor force statistics for Panorama Village, 75.4% of individuals (847) out of the total population between 25 and 64 years of age (1,124) are in the labor force, with 0.7% or 6 of them being unemployed. The group with the highest labor force participation rate are those with the educational attainment of less than high school, with 84.8% or 28 individuals in the labor force. Within the labor force, individuals with bachelor's degree or higher education have the highest percentage of unemployment, with 1.7% or 6 of them being unemployed.
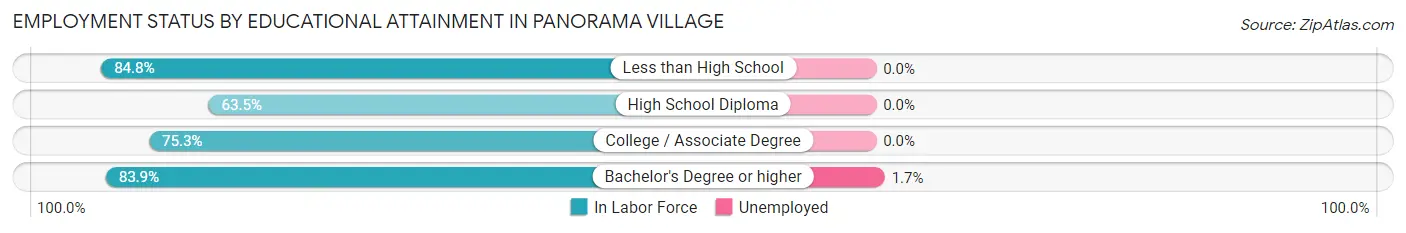
| Educational Attainment | In Labor Force | Unemployed |
| Less than High School | 28 (84.8%) | 0 (0.0%) |
| High School Diploma | 200 (63.5%) | 0 (0.0%) |
| College / Associate Degree | 275 (75.3%) | 0 (0.0%) |
| Bachelor's Degree or higher | 345 (83.9%) | 7 (1.7%) |
| Total | 847 (75.4%) | 8 (0.7%) |
Employment Occupations by Sex in Panorama Village
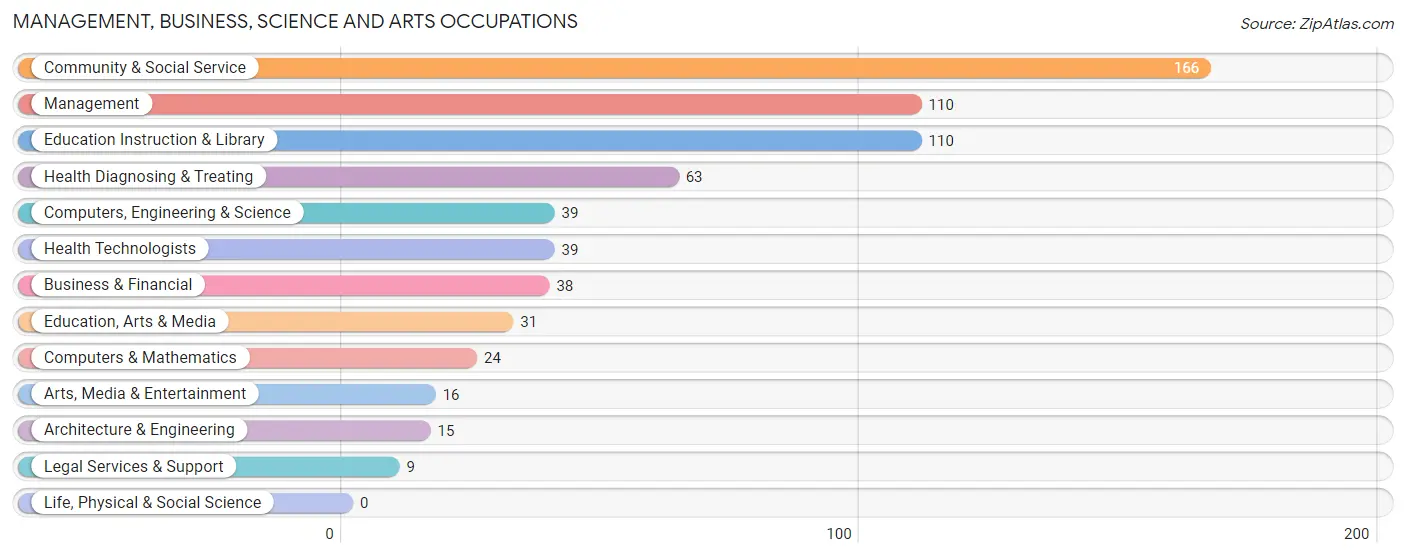
Management, Business, Science and Arts Occupations
The most common Management, Business, Science and Arts occupations in Panorama Village are Community & Social Service (166 | 16.1%), Management (110 | 10.7%), Education Instruction & Library (110 | 10.7%), Health Diagnosing & Treating (63 | 6.1%), and Computers, Engineering & Science (39 | 3.8%).
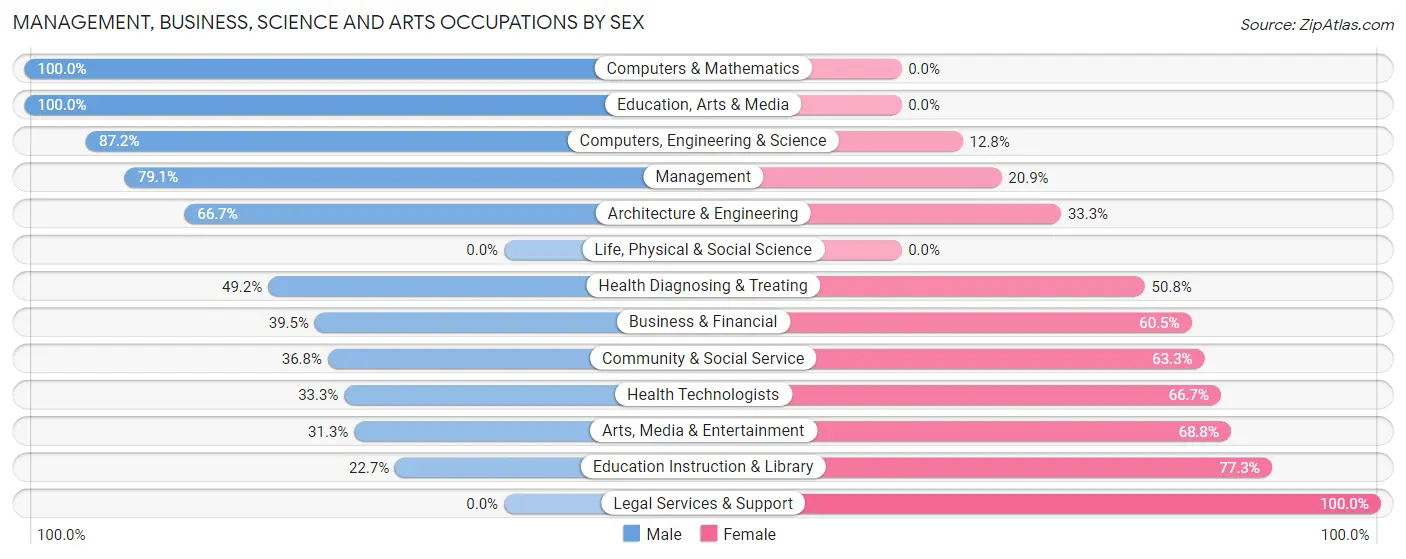
Management, Business, Science and Arts Occupations by Sex
Within the Management, Business, Science and Arts occupations in Panorama Village, the most male-oriented occupations are Computers & Mathematics (100.0%), Education, Arts & Media (100.0%), and Computers, Engineering & Science (87.2%), while the most female-oriented occupations are Legal Services & Support (100.0%), Education Instruction & Library (77.3%), and Arts, Media & Entertainment (68.8%).
| Occupation | Male | Female |
| Management | 87 (79.1%) | 23 (20.9%) |
| Business & Financial | 15 (39.5%) | 23 (60.5%) |
| Computers, Engineering & Science | 34 (87.2%) | 5 (12.8%) |
| Computers & Mathematics | 24 (100.0%) | 0 (0.0%) |
| Architecture & Engineering | 10 (66.7%) | 5 (33.3%) |
| Life, Physical & Social Science | 0 (0.0%) | 0 (0.0%) |
| Community & Social Service | 61 (36.7%) | 105 (63.2%) |
| Education, Arts & Media | 31 (100.0%) | 0 (0.0%) |
| Legal Services & Support | 0 (0.0%) | 9 (100.0%) |
| Education Instruction & Library | 25 (22.7%) | 85 (77.3%) |
| Arts, Media & Entertainment | 5 (31.2%) | 11 (68.8%) |
| Health Diagnosing & Treating | 31 (49.2%) | 32 (50.8%) |
| Health Technologists | 13 (33.3%) | 26 (66.7%) |
| Total (Category) | 228 (54.8%) | 188 (45.2%) |
| Total (Overall) | 547 (53.1%) | 483 (46.9%) |
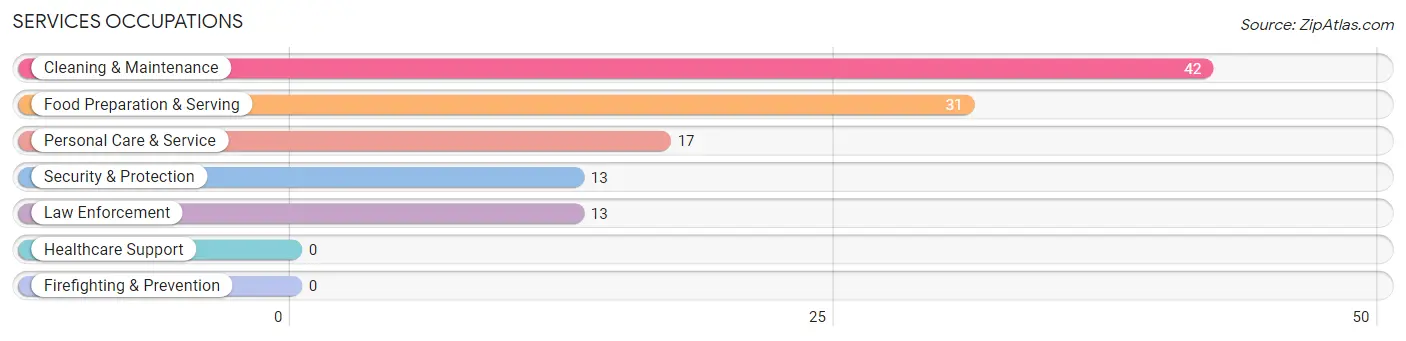
Services Occupations
The most common Services occupations in Panorama Village are Cleaning & Maintenance (42 | 4.1%), Food Preparation & Serving (31 | 3.0%), Personal Care & Service (17 | 1.7%), Security & Protection (13 | 1.3%), and Law Enforcement (13 | 1.3%).
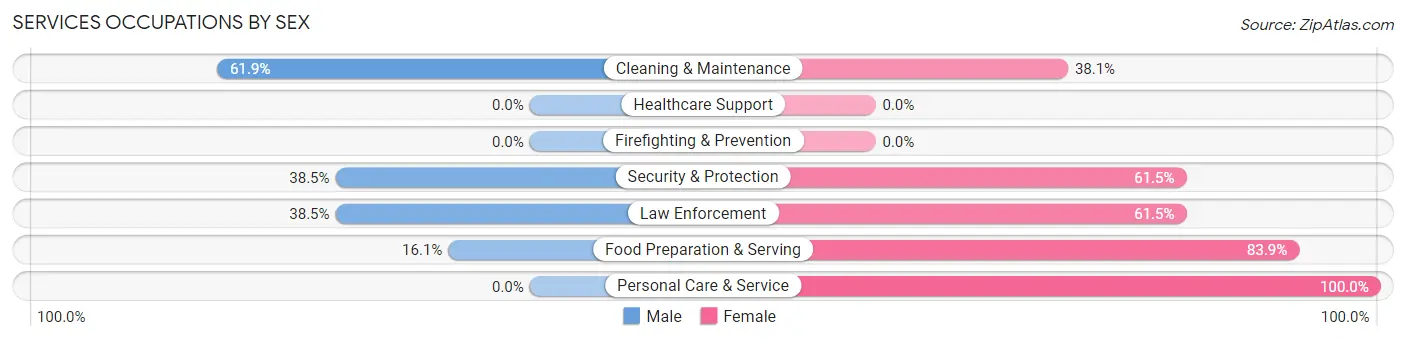
Services Occupations by Sex
Within the Services occupations in Panorama Village, the most male-oriented occupations are Cleaning & Maintenance (61.9%), Security & Protection (38.5%), and Law Enforcement (38.5%), while the most female-oriented occupations are Personal Care & Service (100.0%), Food Preparation & Serving (83.9%), and Security & Protection (61.5%).
| Occupation | Male | Female |
| Healthcare Support | 0 (0.0%) | 0 (0.0%) |
| Security & Protection | 5 (38.5%) | 8 (61.5%) |
| Firefighting & Prevention | 0 (0.0%) | 0 (0.0%) |
| Law Enforcement | 5 (38.5%) | 8 (61.5%) |
| Food Preparation & Serving | 5 (16.1%) | 26 (83.9%) |
| Cleaning & Maintenance | 26 (61.9%) | 16 (38.1%) |
| Personal Care & Service | 0 (0.0%) | 17 (100.0%) |
| Total (Category) | 36 (34.9%) | 67 (65.0%) |
| Total (Overall) | 547 (53.1%) | 483 (46.9%) |
Sales and Office Occupations
The most common Sales and Office occupations in Panorama Village are Office & Administration (123 | 11.9%), and Sales & Related (100 | 9.7%).
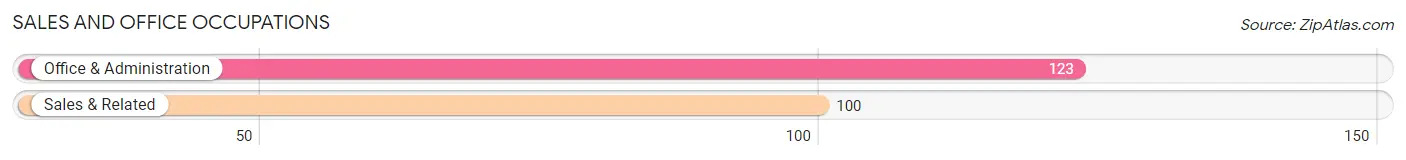
Sales and Office Occupations by Sex
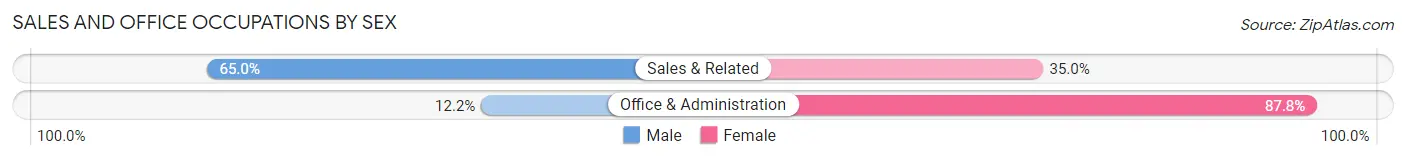
| Occupation | Male | Female |
| Sales & Related | 65 (65.0%) | 35 (35.0%) |
| Office & Administration | 15 (12.2%) | 108 (87.8%) |
| Total (Category) | 80 (35.9%) | 143 (64.1%) |
| Total (Overall) | 547 (53.1%) | 483 (46.9%) |
Natural Resources, Construction and Maintenance Occupations
The most common Natural Resources, Construction and Maintenance occupations in Panorama Village are Installation, Maintenance & Repair (50 | 4.9%), Construction & Extraction (46 | 4.5%), and Farming, Fishing & Forestry (17 | 1.7%).
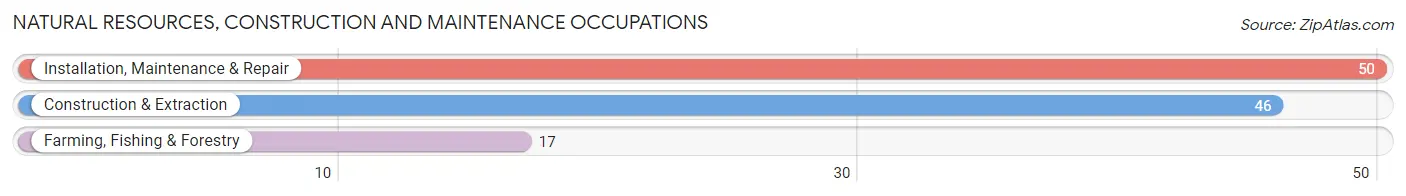
Natural Resources, Construction and Maintenance Occupations by Sex
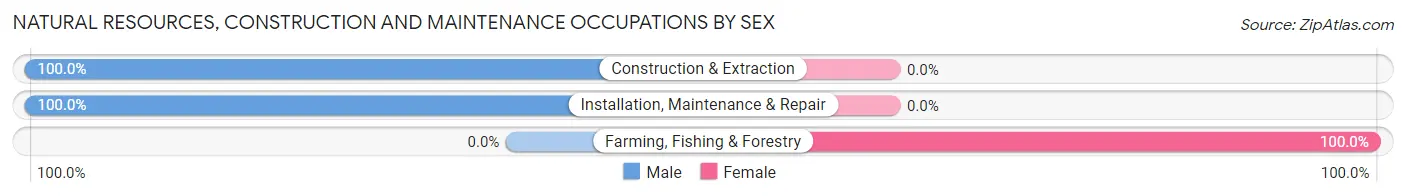
| Occupation | Male | Female |
| Farming, Fishing & Forestry | 0 (0.0%) | 17 (100.0%) |
| Construction & Extraction | 46 (100.0%) | 0 (0.0%) |
| Installation, Maintenance & Repair | 50 (100.0%) | 0 (0.0%) |
| Total (Category) | 96 (85.0%) | 17 (15.0%) |
| Total (Overall) | 547 (53.1%) | 483 (46.9%) |
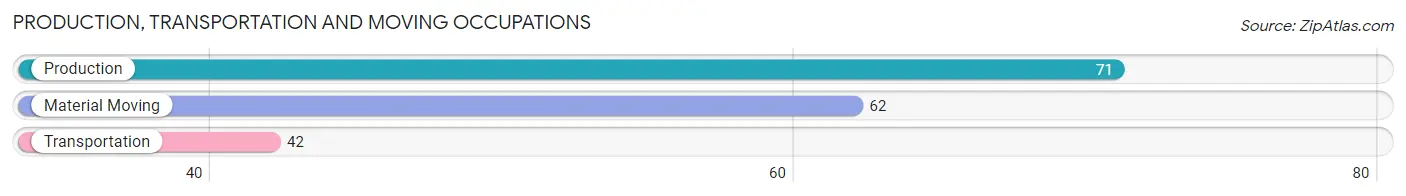
Production, Transportation and Moving Occupations
The most common Production, Transportation and Moving occupations in Panorama Village are Production (71 | 6.9%), Material Moving (62 | 6.0%), and Transportation (42 | 4.1%).
Production, Transportation and Moving Occupations by Sex
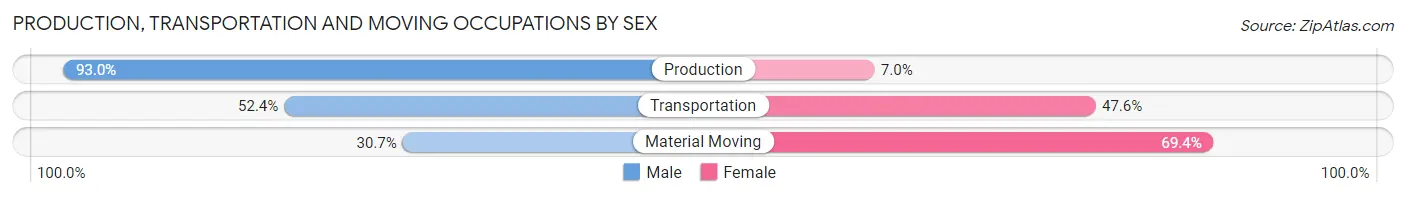
| Occupation | Male | Female |
| Production | 66 (93.0%) | 5 (7.0%) |
| Transportation | 22 (52.4%) | 20 (47.6%) |
| Material Moving | 19 (30.6%) | 43 (69.4%) |
| Total (Category) | 107 (61.1%) | 68 (38.9%) |
| Total (Overall) | 547 (53.1%) | 483 (46.9%) |
Employment Industries by Sex in Panorama Village
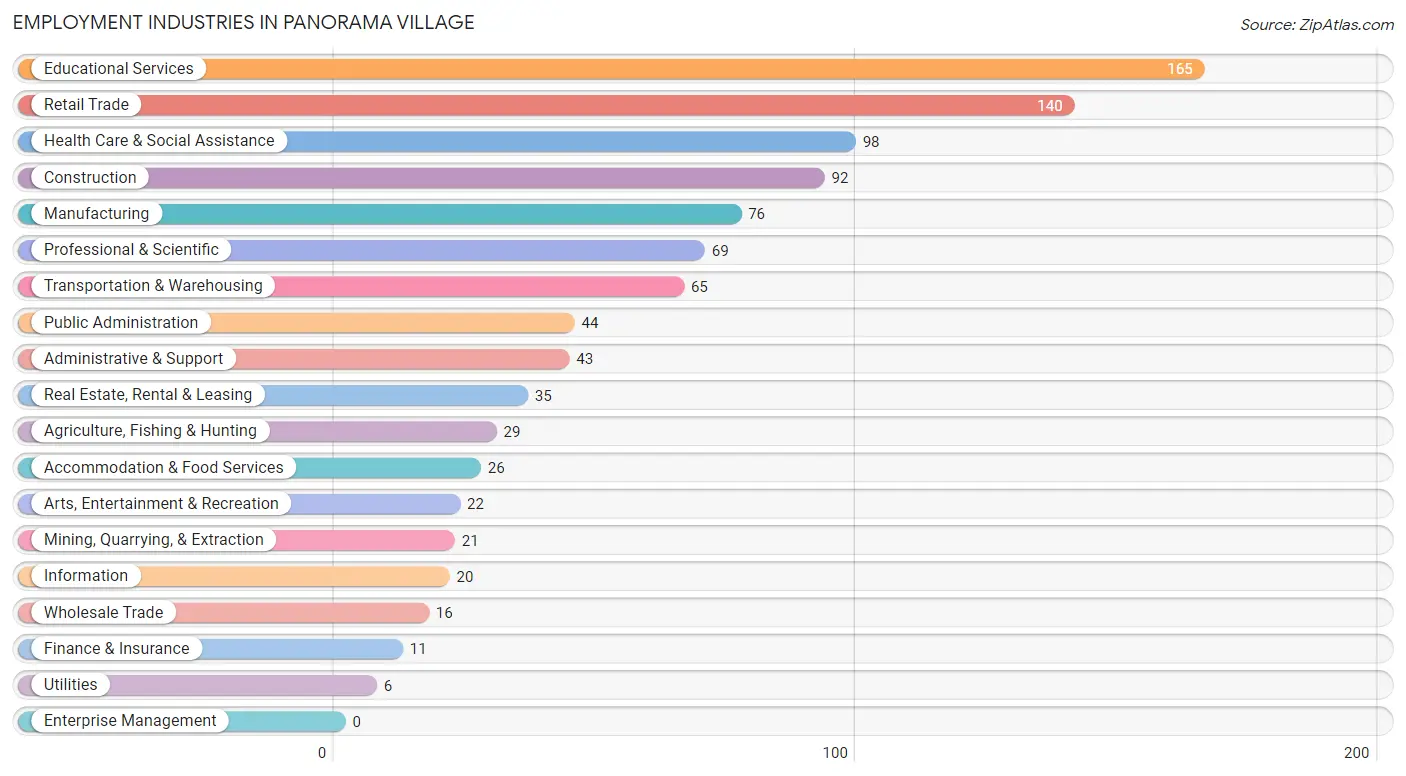
Employment Industries in Panorama Village
The major employment industries in Panorama Village include Educational Services (165 | 16.0%), Retail Trade (140 | 13.6%), Health Care & Social Assistance (98 | 9.5%), Construction (92 | 8.9%), and Manufacturing (76 | 7.4%).
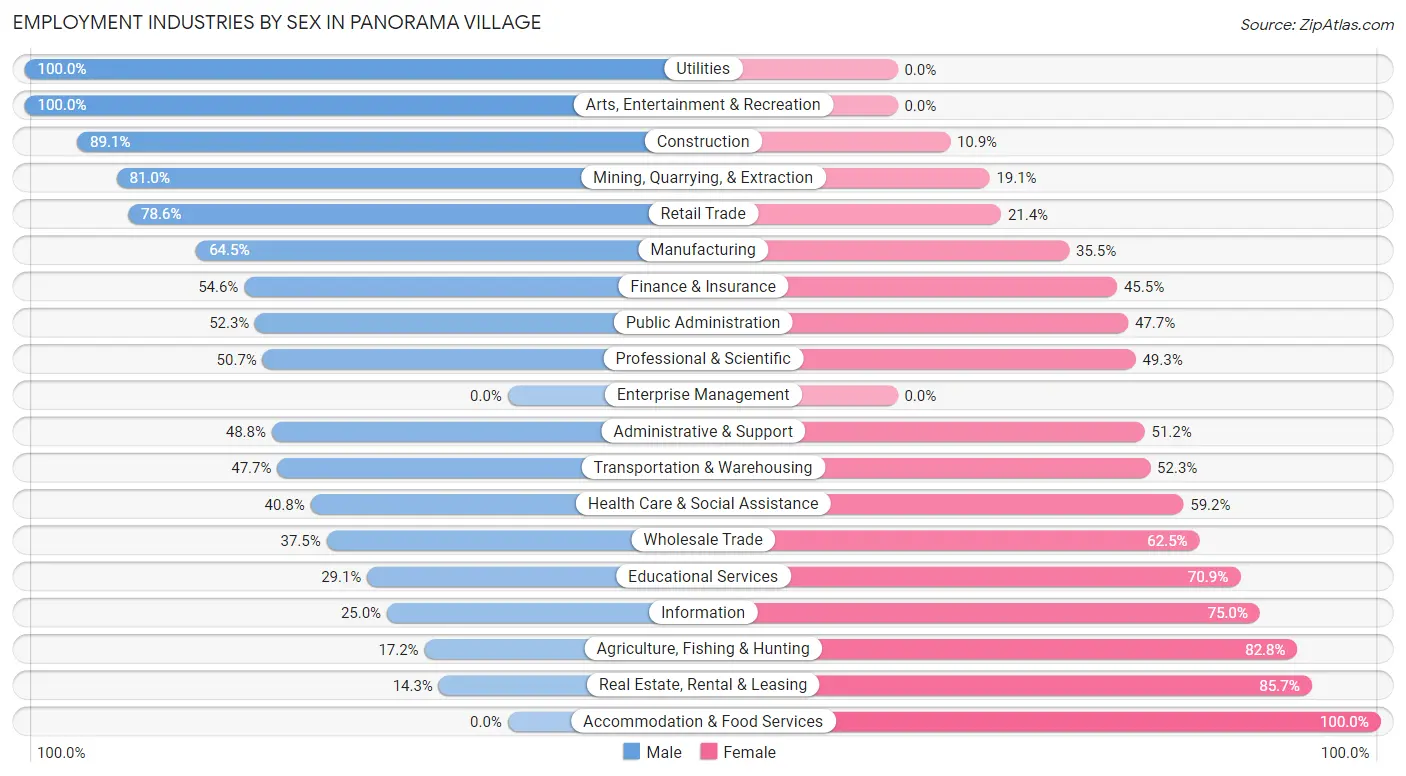
Employment Industries by Sex in Panorama Village
The Panorama Village industries that see more men than women are Utilities (100.0%), Arts, Entertainment & Recreation (100.0%), and Construction (89.1%), whereas the industries that tend to have a higher number of women are Accommodation & Food Services (100.0%), Real Estate, Rental & Leasing (85.7%), and Agriculture, Fishing & Hunting (82.8%).
| Industry | Male | Female |
| Agriculture, Fishing & Hunting | 5 (17.2%) | 24 (82.8%) |
| Mining, Quarrying, & Extraction | 17 (80.9%) | 4 (19.1%) |
| Construction | 82 (89.1%) | 10 (10.9%) |
| Manufacturing | 49 (64.5%) | 27 (35.5%) |
| Wholesale Trade | 6 (37.5%) | 10 (62.5%) |
| Retail Trade | 110 (78.6%) | 30 (21.4%) |
| Transportation & Warehousing | 31 (47.7%) | 34 (52.3%) |
| Utilities | 6 (100.0%) | 0 (0.0%) |
| Information | 5 (25.0%) | 15 (75.0%) |
| Finance & Insurance | 6 (54.5%) | 5 (45.5%) |
| Real Estate, Rental & Leasing | 5 (14.3%) | 30 (85.7%) |
| Professional & Scientific | 35 (50.7%) | 34 (49.3%) |
| Enterprise Management | 0 (0.0%) | 0 (0.0%) |
| Administrative & Support | 21 (48.8%) | 22 (51.2%) |
| Educational Services | 48 (29.1%) | 117 (70.9%) |
| Health Care & Social Assistance | 40 (40.8%) | 58 (59.2%) |
| Arts, Entertainment & Recreation | 22 (100.0%) | 0 (0.0%) |
| Accommodation & Food Services | 0 (0.0%) | 26 (100.0%) |
| Public Administration | 23 (52.3%) | 21 (47.7%) |
| Total | 547 (53.1%) | 483 (46.9%) |
Education in Panorama Village
School Enrollment in Panorama Village
The most common levels of schooling among the 425 students in Panorama Village are elementary school (143 | 33.7%), middle school (88 | 20.7%), and high school (69 | 16.2%).
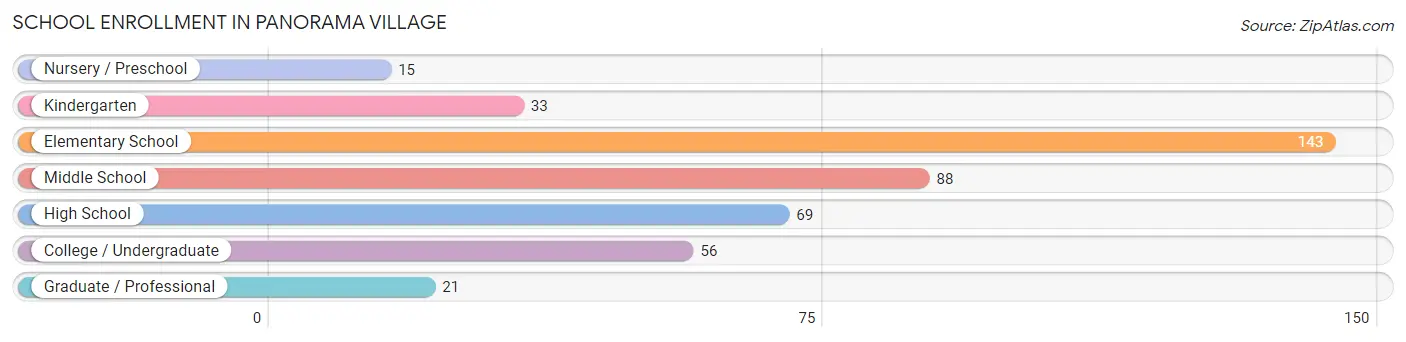
| School Level | # Students | % Students |
| Nursery / Preschool | 15 | 3.5% |
| Kindergarten | 33 | 7.8% |
| Elementary School | 143 | 33.7% |
| Middle School | 88 | 20.7% |
| High School | 69 | 16.2% |
| College / Undergraduate | 56 | 13.2% |
| Graduate / Professional | 21 | 4.9% |
| Total | 425 | 100.0% |
School Enrollment by Age by Funding Source in Panorama Village
Out of a total of 425 students who are enrolled in schools in Panorama Village, 118 (27.8%) attend a private institution, while the remaining 307 (72.2%) are enrolled in public schools. The age group of 3 to 4 year olds has the highest likelihood of being enrolled in private schools, with 10 (100.0% in the age bracket) enrolled. Conversely, the age group of 15 to 17 year olds has the lowest likelihood of being enrolled in a private school, with 51 (100.0% in the age bracket) attending a public institution.
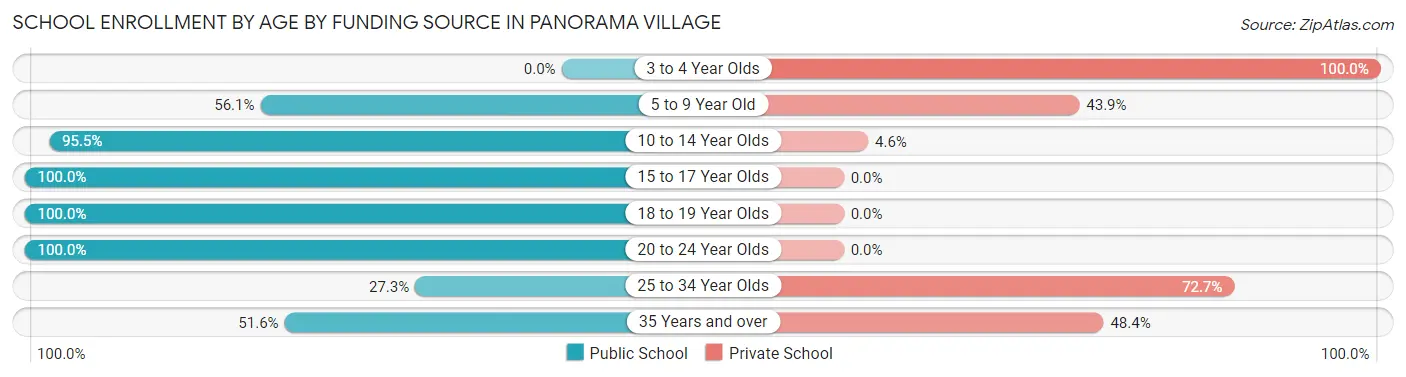
| Age Bracket | Public School | Private School |
| 3 to 4 Year Olds | 0 (0.0%) | 10 (100.0%) |
| 5 to 9 Year Old | 92 (56.1%) | 72 (43.9%) |
| 10 to 14 Year Olds | 105 (95.5%) | 5 (4.5%) |
| 15 to 17 Year Olds | 51 (100.0%) | 0 (0.0%) |
| 18 to 19 Year Olds | 7 (100.0%) | 0 (0.0%) |
| 20 to 24 Year Olds | 30 (100.0%) | 0 (0.0%) |
| 25 to 34 Year Olds | 6 (27.3%) | 16 (72.7%) |
| 35 Years and over | 16 (51.6%) | 15 (48.4%) |
| Total | 307 (72.2%) | 118 (27.8%) |
Educational Attainment by Field of Study in Panorama Village
Education (157 | 22.6%), business (125 | 18.0%), liberal arts & history (67 | 9.7%), literature & languages (57 | 8.2%), and science & technology (47 | 6.8%) are the most common fields of study among 694 individuals in Panorama Village who have obtained a bachelor's degree or higher.
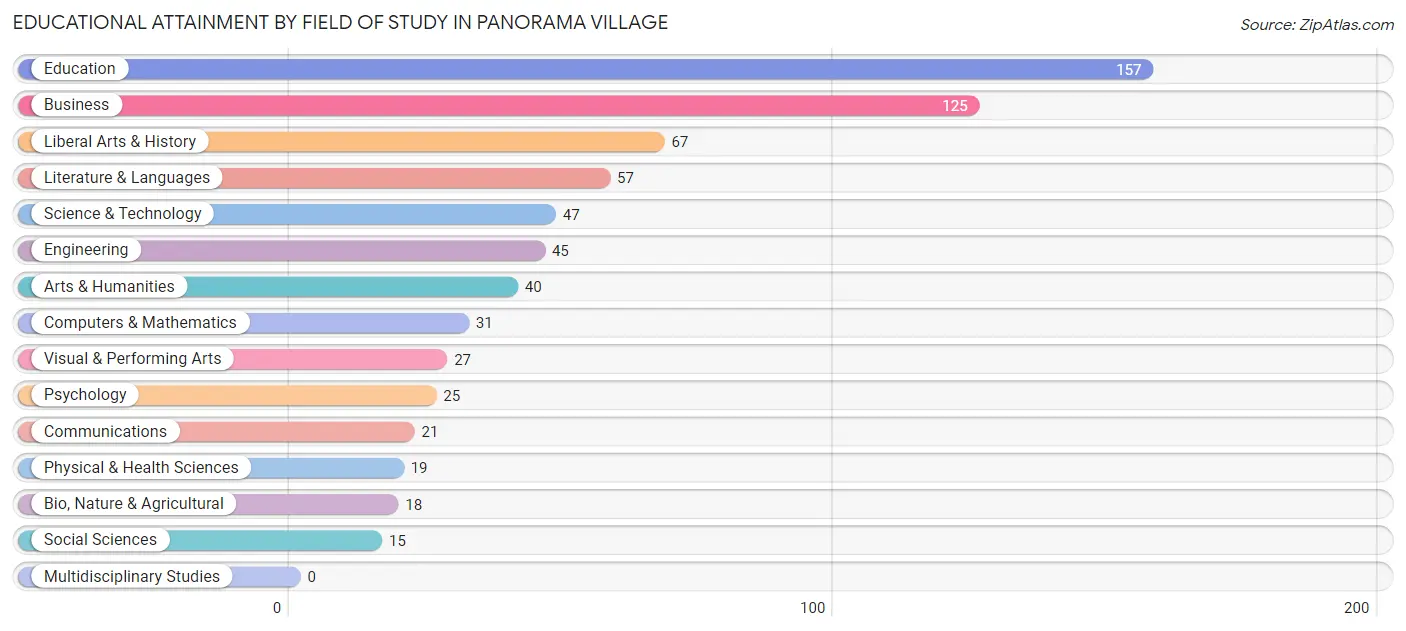
| Field of Study | # Graduates | % Graduates |
| Computers & Mathematics | 31 | 4.5% |
| Bio, Nature & Agricultural | 18 | 2.6% |
| Physical & Health Sciences | 19 | 2.7% |
| Psychology | 25 | 3.6% |
| Social Sciences | 15 | 2.2% |
| Engineering | 45 | 6.5% |
| Multidisciplinary Studies | 0 | 0.0% |
| Science & Technology | 47 | 6.8% |
| Business | 125 | 18.0% |
| Education | 157 | 22.6% |
| Literature & Languages | 57 | 8.2% |
| Liberal Arts & History | 67 | 9.7% |
| Visual & Performing Arts | 27 | 3.9% |
| Communications | 21 | 3.0% |
| Arts & Humanities | 40 | 5.8% |
| Total | 694 | 100.0% |
Transportation & Commute in Panorama Village
Vehicle Availability by Sex in Panorama Village
The most prevalent vehicle ownership categories in Panorama Village are males with 2 vehicles (294, accounting for 54.6%) and females with 2 vehicles (223, making up 62.2%).
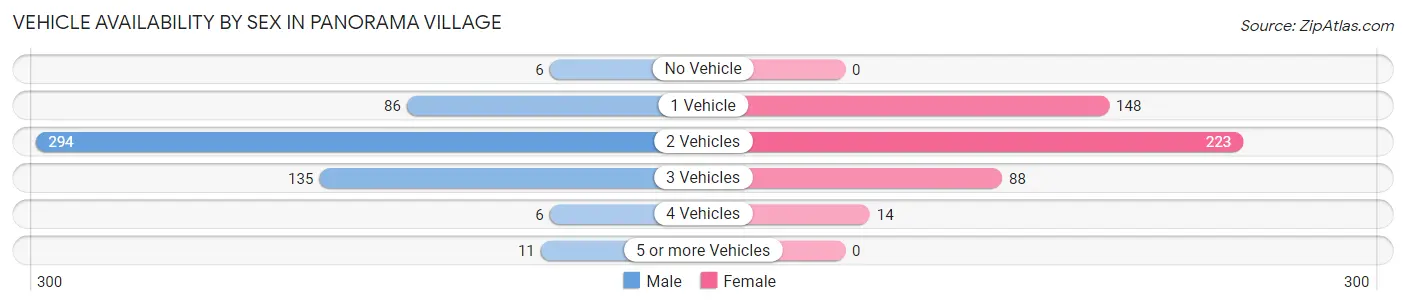
| Vehicles Available | Male | Female |
| No Vehicle | 6 (1.1%) | 0 (0.0%) |
| 1 Vehicle | 86 (16.0%) | 148 (31.3%) |
| 2 Vehicles | 294 (54.6%) | 223 (47.1%) |
| 3 Vehicles | 135 (25.1%) | 88 (18.6%) |
| 4 Vehicles | 6 (1.1%) | 14 (3.0%) |
| 5 or more Vehicles | 11 (2.0%) | 0 (0.0%) |
| Total | 538 (100.0%) | 473 (100.0%) |
Commute Time in Panorama Village
The most frequently occuring commute durations in Panorama Village are 20 to 24 minutes (157 commuters, 16.4%), 10 to 14 minutes (152 commuters, 15.9%), and 5 to 9 minutes (134 commuters, 14.0%).
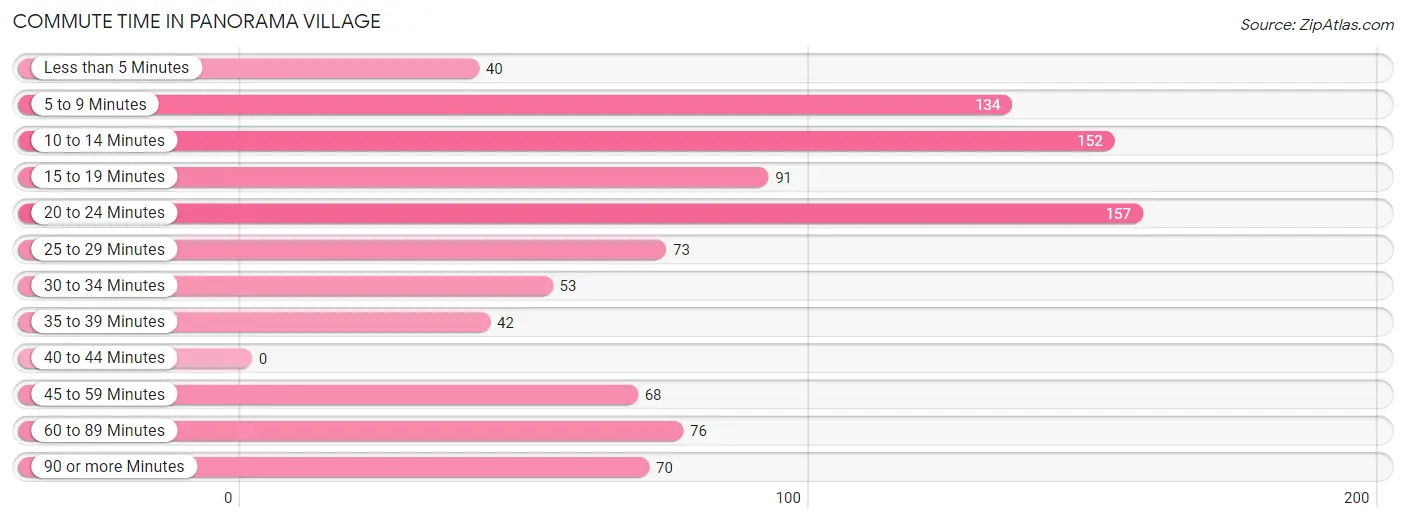
| Commute Time | # Commuters | % Commuters |
| Less than 5 Minutes | 40 | 4.2% |
| 5 to 9 Minutes | 134 | 14.0% |
| 10 to 14 Minutes | 152 | 15.9% |
| 15 to 19 Minutes | 91 | 9.5% |
| 20 to 24 Minutes | 157 | 16.4% |
| 25 to 29 Minutes | 73 | 7.6% |
| 30 to 34 Minutes | 53 | 5.5% |
| 35 to 39 Minutes | 42 | 4.4% |
| 40 to 44 Minutes | 0 | 0.0% |
| 45 to 59 Minutes | 68 | 7.1% |
| 60 to 89 Minutes | 76 | 8.0% |
| 90 or more Minutes | 70 | 7.3% |
Commute Time by Sex in Panorama Village
The most common commute times in Panorama Village are 20 to 24 minutes (75 commuters, 15.1%) for males and 10 to 14 minutes (112 commuters, 24.3%) for females.
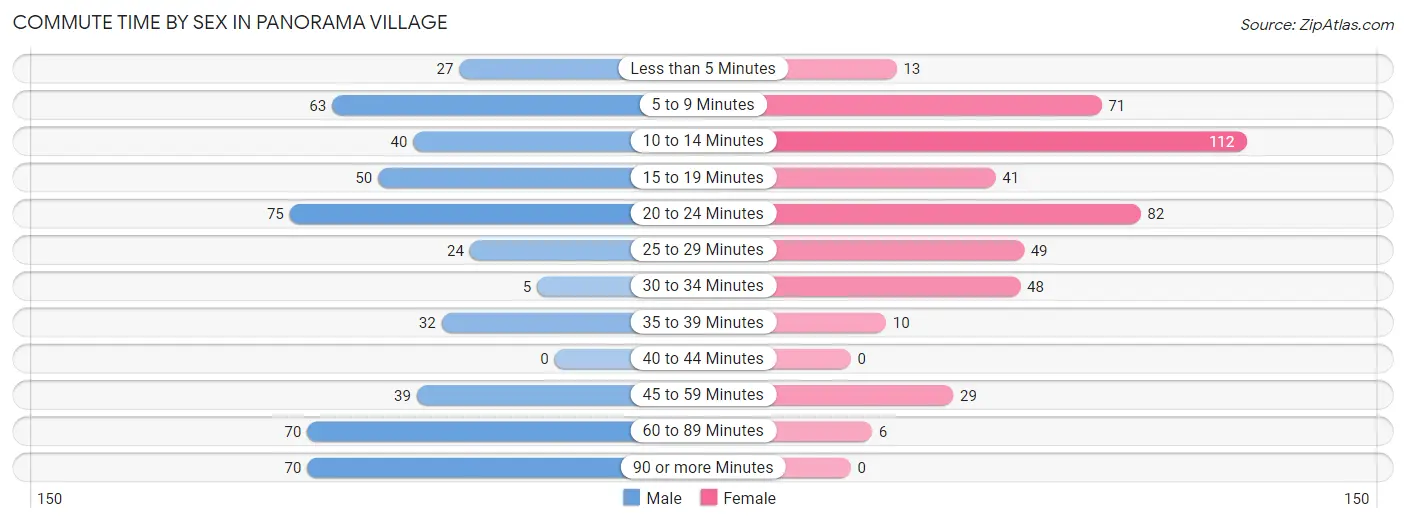
| Commute Time | Male | Female |
| Less than 5 Minutes | 27 (5.4%) | 13 (2.8%) |
| 5 to 9 Minutes | 63 (12.7%) | 71 (15.4%) |
| 10 to 14 Minutes | 40 (8.1%) | 112 (24.3%) |
| 15 to 19 Minutes | 50 (10.1%) | 41 (8.9%) |
| 20 to 24 Minutes | 75 (15.1%) | 82 (17.8%) |
| 25 to 29 Minutes | 24 (4.9%) | 49 (10.6%) |
| 30 to 34 Minutes | 5 (1.0%) | 48 (10.4%) |
| 35 to 39 Minutes | 32 (6.5%) | 10 (2.2%) |
| 40 to 44 Minutes | 0 (0.0%) | 0 (0.0%) |
| 45 to 59 Minutes | 39 (7.9%) | 29 (6.3%) |
| 60 to 89 Minutes | 70 (14.1%) | 6 (1.3%) |
| 90 or more Minutes | 70 (14.1%) | 0 (0.0%) |
Time of Departure to Work by Sex in Panorama Village
The most frequent times of departure to work in Panorama Village are 7:00 AM to 7:29 AM (86, 17.4%) for males and 6:30 AM to 6:59 AM (89, 19.3%) for females.
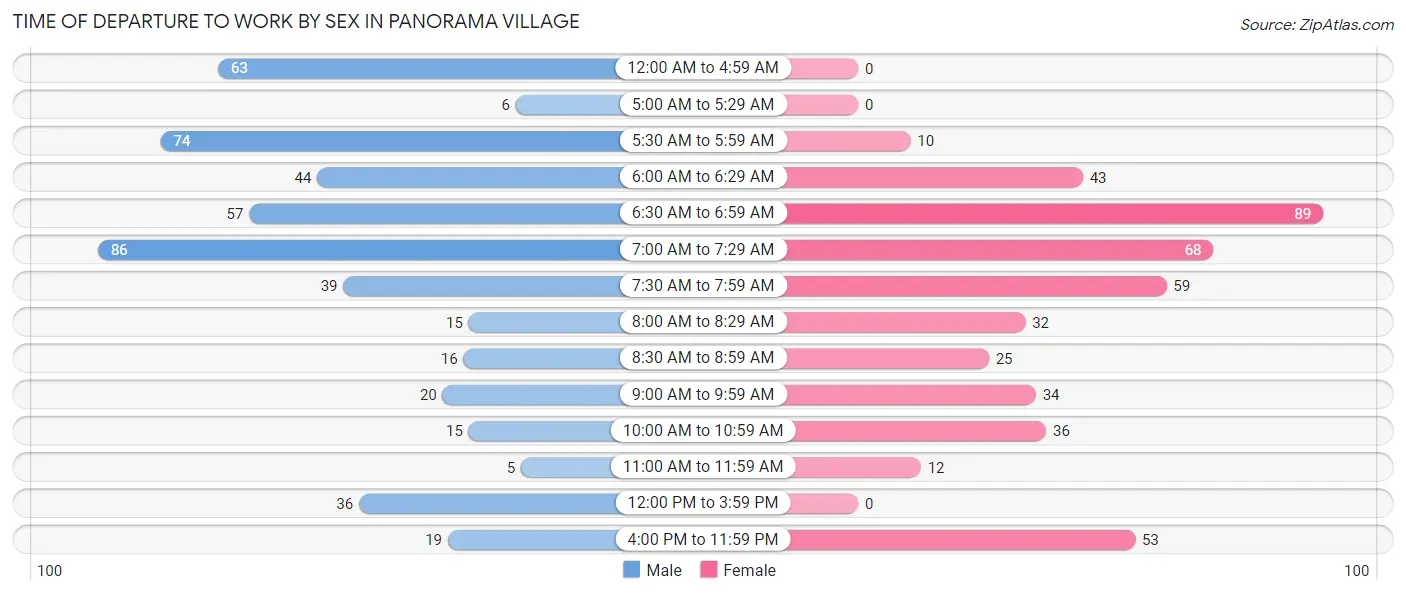
| Time of Departure | Male | Female |
| 12:00 AM to 4:59 AM | 63 (12.7%) | 0 (0.0%) |
| 5:00 AM to 5:29 AM | 6 (1.2%) | 0 (0.0%) |
| 5:30 AM to 5:59 AM | 74 (14.9%) | 10 (2.2%) |
| 6:00 AM to 6:29 AM | 44 (8.9%) | 43 (9.3%) |
| 6:30 AM to 6:59 AM | 57 (11.5%) | 89 (19.3%) |
| 7:00 AM to 7:29 AM | 86 (17.4%) | 68 (14.7%) |
| 7:30 AM to 7:59 AM | 39 (7.9%) | 59 (12.8%) |
| 8:00 AM to 8:29 AM | 15 (3.0%) | 32 (6.9%) |
| 8:30 AM to 8:59 AM | 16 (3.2%) | 25 (5.4%) |
| 9:00 AM to 9:59 AM | 20 (4.0%) | 34 (7.4%) |
| 10:00 AM to 10:59 AM | 15 (3.0%) | 36 (7.8%) |
| 11:00 AM to 11:59 AM | 5 (1.0%) | 12 (2.6%) |
| 12:00 PM to 3:59 PM | 36 (7.3%) | 0 (0.0%) |
| 4:00 PM to 11:59 PM | 19 (3.8%) | 53 (11.5%) |
| Total | 495 (100.0%) | 461 (100.0%) |
Housing Occupancy in Panorama Village
Occupancy by Ownership in Panorama Village
Of the total 1,060 dwellings in Panorama Village, owner-occupied units account for 964 (90.9%), while renter-occupied units make up 96 (9.1%).
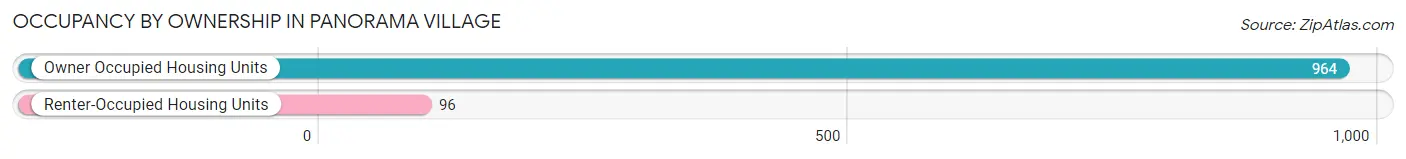
| Occupancy | # Housing Units | % Housing Units |
| Owner Occupied Housing Units | 964 | 90.9% |
| Renter-Occupied Housing Units | 96 | 9.1% |
| Total Occupied Housing Units | 1,060 | 100.0% |
Occupancy by Household Size in Panorama Village
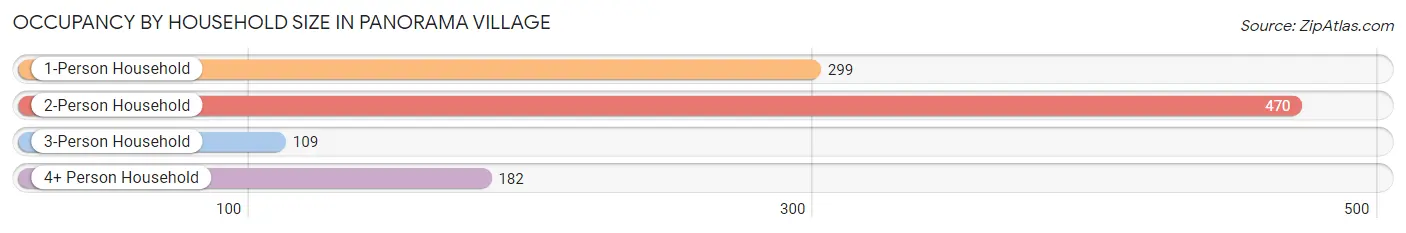
| Household Size | # Housing Units | % Housing Units |
| 1-Person Household | 299 | 28.2% |
| 2-Person Household | 470 | 44.3% |
| 3-Person Household | 109 | 10.3% |
| 4+ Person Household | 182 | 17.2% |
| Total Housing Units | 1,060 | 100.0% |
Occupancy by Ownership by Household Size in Panorama Village
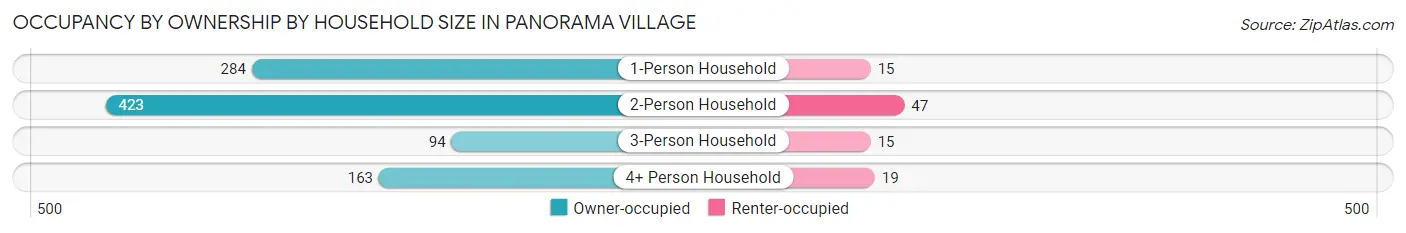
| Household Size | Owner-occupied | Renter-occupied |
| 1-Person Household | 284 (95.0%) | 15 (5.0%) |
| 2-Person Household | 423 (90.0%) | 47 (10.0%) |
| 3-Person Household | 94 (86.2%) | 15 (13.8%) |
| 4+ Person Household | 163 (89.6%) | 19 (10.4%) |
| Total Housing Units | 964 (90.9%) | 96 (9.1%) |
Occupancy by Educational Attainment in Panorama Village
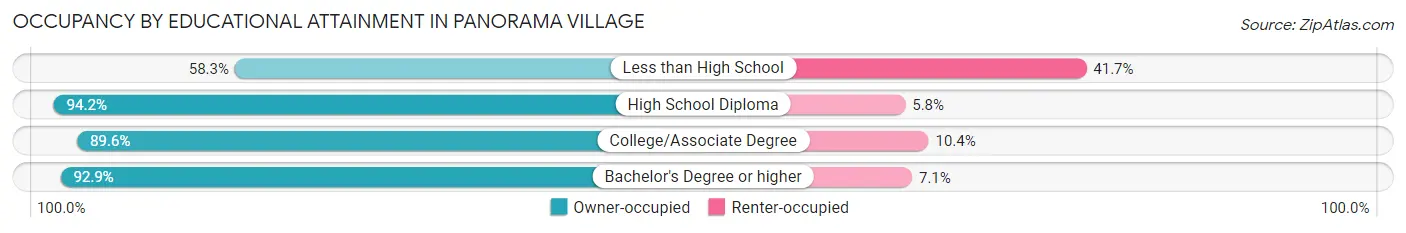
| Household Size | Owner-occupied | Renter-occupied |
| Less than High School | 21 (58.3%) | 15 (41.7%) |
| High School Diploma | 245 (94.2%) | 15 (5.8%) |
| College/Associate Degree | 319 (89.6%) | 37 (10.4%) |
| Bachelor's Degree or higher | 379 (92.9%) | 29 (7.1%) |
Occupancy by Age of Householder in Panorama Village
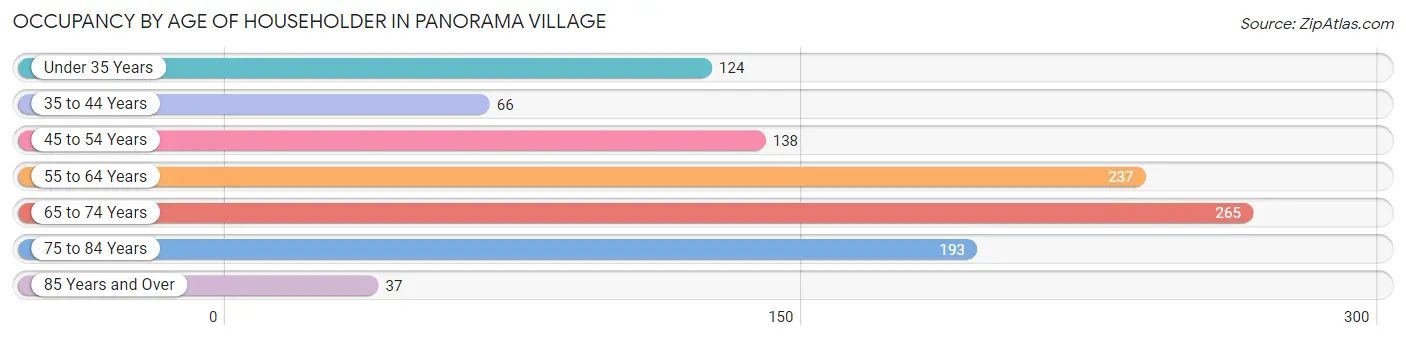
| Age Bracket | # Households | % Households |
| Under 35 Years | 124 | 11.7% |
| 35 to 44 Years | 66 | 6.2% |
| 45 to 54 Years | 138 | 13.0% |
| 55 to 64 Years | 237 | 22.4% |
| 65 to 74 Years | 265 | 25.0% |
| 75 to 84 Years | 193 | 18.2% |
| 85 Years and Over | 37 | 3.5% |
| Total | 1,060 | 100.0% |
Housing Finances in Panorama Village
Median Income by Occupancy in Panorama Village
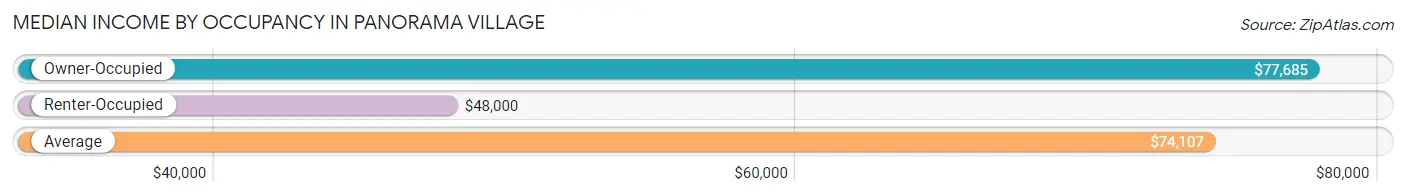
| Occupancy Type | # Households | Median Income |
| Owner-Occupied | 964 (90.9%) | $77,685 |
| Renter-Occupied | 96 (9.1%) | $48,000 |
| Average | 1,060 (100.0%) | $74,107 |
Occupancy by Householder Income Bracket in Panorama Village
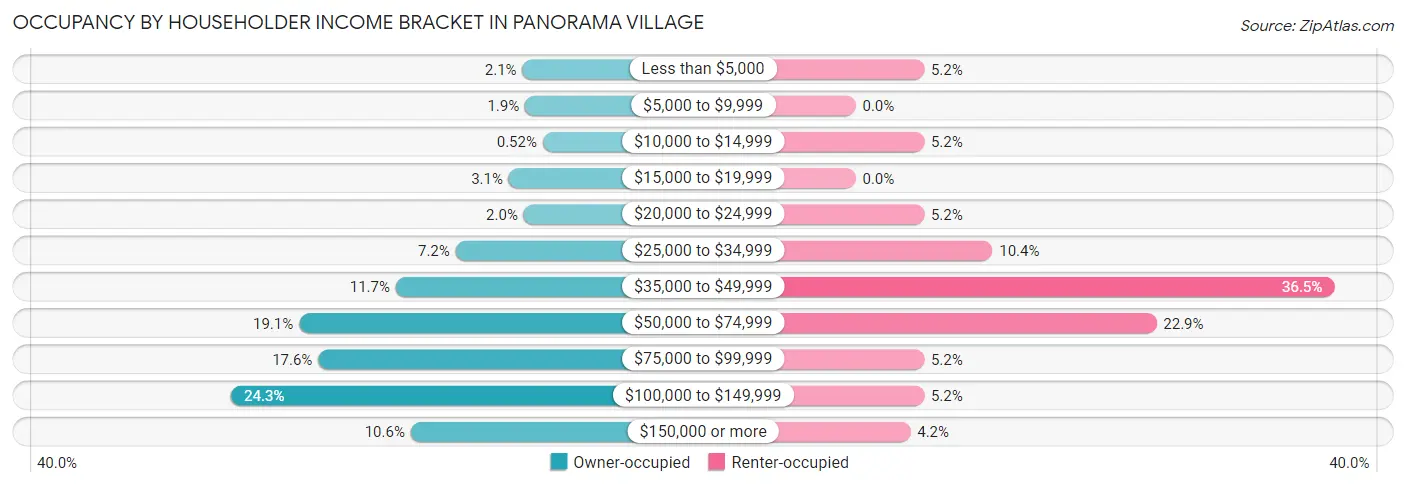
| Income Bracket | Owner-occupied | Renter-occupied |
| Less than $5,000 | 20 (2.1%) | 5 (5.2%) |
| $5,000 to $9,999 | 18 (1.9%) | 0 (0.0%) |
| $10,000 to $14,999 | 5 (0.5%) | 5 (5.2%) |
| $15,000 to $19,999 | 30 (3.1%) | 0 (0.0%) |
| $20,000 to $24,999 | 19 (2.0%) | 5 (5.2%) |
| $25,000 to $34,999 | 69 (7.2%) | 10 (10.4%) |
| $35,000 to $49,999 | 113 (11.7%) | 35 (36.5%) |
| $50,000 to $74,999 | 184 (19.1%) | 22 (22.9%) |
| $75,000 to $99,999 | 170 (17.6%) | 5 (5.2%) |
| $100,000 to $149,999 | 234 (24.3%) | 5 (5.2%) |
| $150,000 or more | 102 (10.6%) | 4 (4.2%) |
| Total | 964 (100.0%) | 96 (100.0%) |
Monthly Housing Cost Tiers in Panorama Village

| Monthly Cost | Owner-occupied | Renter-occupied |
| Less than $300 | 0 (0.0%) | 0 (0.0%) |
| $300 to $499 | 75 (7.8%) | 5 (5.2%) |
| $500 to $799 | 238 (24.7%) | 5 (5.2%) |
| $800 to $999 | 140 (14.5%) | 0 (0.0%) |
| $1,000 to $1,499 | 189 (19.6%) | 42 (43.8%) |
| $1,500 to $1,999 | 195 (20.2%) | 35 (36.5%) |
| $2,000 to $2,499 | 88 (9.1%) | 4 (4.2%) |
| $2,500 to $2,999 | 33 (3.4%) | 0 (0.0%) |
| $3,000 or more | 6 (0.6%) | 0 (0.0%) |
| Total | 964 (100.0%) | 96 (100.0%) |
Physical Housing Characteristics in Panorama Village
Housing Structures in Panorama Village
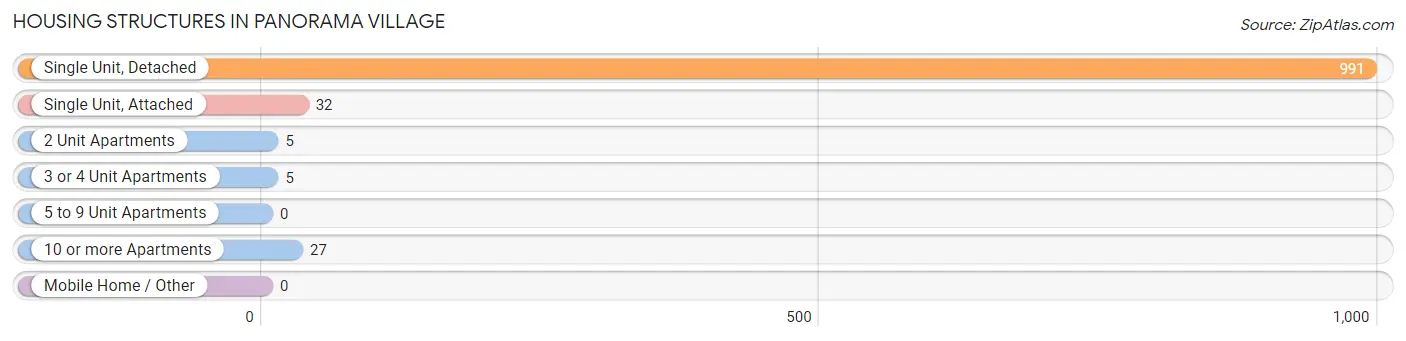
| Structure Type | # Housing Units | % Housing Units |
| Single Unit, Detached | 991 | 93.5% |
| Single Unit, Attached | 32 | 3.0% |
| 2 Unit Apartments | 5 | 0.5% |
| 3 or 4 Unit Apartments | 5 | 0.5% |
| 5 to 9 Unit Apartments | 0 | 0.0% |
| 10 or more Apartments | 27 | 2.5% |
| Mobile Home / Other | 0 | 0.0% |
| Total | 1,060 | 100.0% |
Housing Structures by Occupancy in Panorama Village
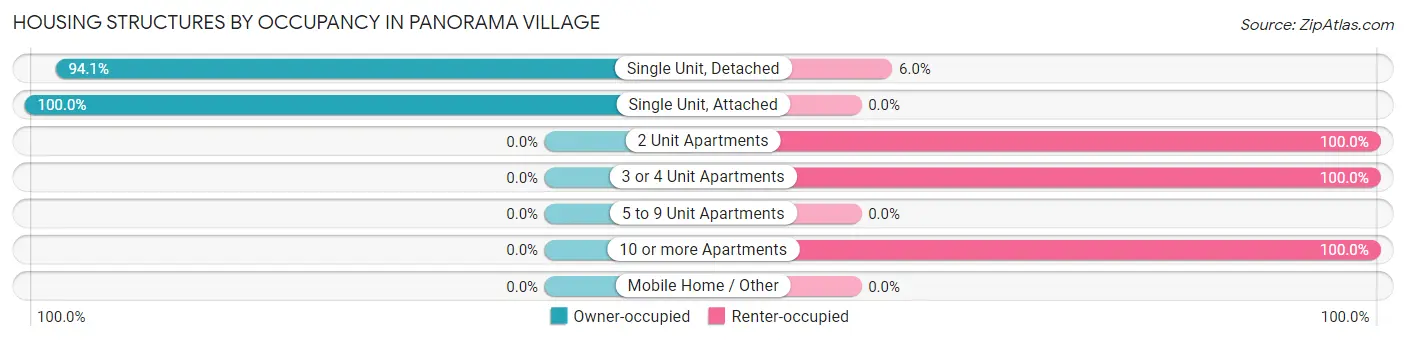
| Structure Type | Owner-occupied | Renter-occupied |
| Single Unit, Detached | 932 (94.1%) | 59 (5.9%) |
| Single Unit, Attached | 32 (100.0%) | 0 (0.0%) |
| 2 Unit Apartments | 0 (0.0%) | 5 (100.0%) |
| 3 or 4 Unit Apartments | 0 (0.0%) | 5 (100.0%) |
| 5 to 9 Unit Apartments | 0 (0.0%) | 0 (0.0%) |
| 10 or more Apartments | 0 (0.0%) | 27 (100.0%) |
| Mobile Home / Other | 0 (0.0%) | 0 (0.0%) |
| Total | 964 (90.9%) | 96 (9.1%) |
Housing Structures by Number of Rooms in Panorama Village
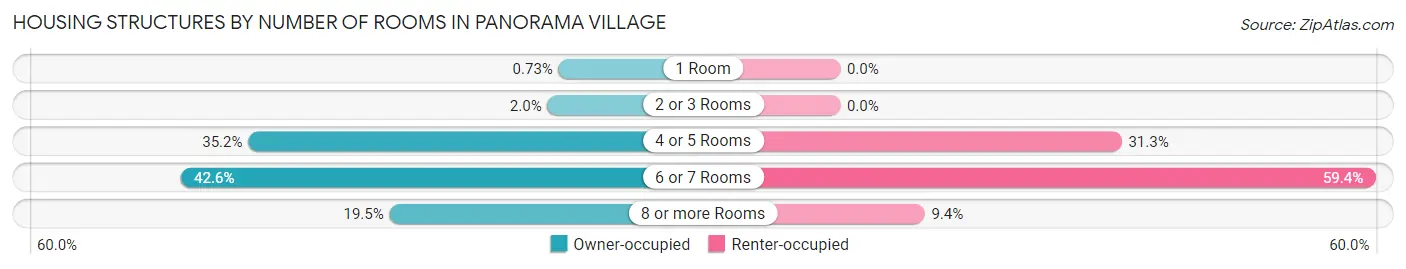
| Number of Rooms | Owner-occupied | Renter-occupied |
| 1 Room | 7 (0.7%) | 0 (0.0%) |
| 2 or 3 Rooms | 19 (2.0%) | 0 (0.0%) |
| 4 or 5 Rooms | 339 (35.2%) | 30 (31.2%) |
| 6 or 7 Rooms | 411 (42.6%) | 57 (59.4%) |
| 8 or more Rooms | 188 (19.5%) | 9 (9.4%) |
| Total | 964 (100.0%) | 96 (100.0%) |
Housing Structure by Heating Type in Panorama Village
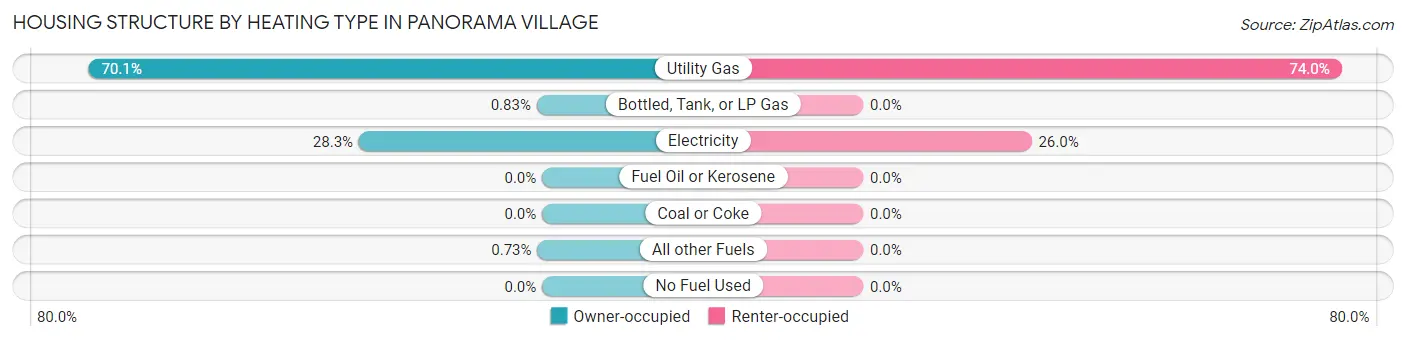
| Heating Type | Owner-occupied | Renter-occupied |
| Utility Gas | 676 (70.1%) | 71 (74.0%) |
| Bottled, Tank, or LP Gas | 8 (0.8%) | 0 (0.0%) |
| Electricity | 273 (28.3%) | 25 (26.0%) |
| Fuel Oil or Kerosene | 0 (0.0%) | 0 (0.0%) |
| Coal or Coke | 0 (0.0%) | 0 (0.0%) |
| All other Fuels | 7 (0.7%) | 0 (0.0%) |
| No Fuel Used | 0 (0.0%) | 0 (0.0%) |
| Total | 964 (100.0%) | 96 (100.0%) |
Household Vehicle Usage in Panorama Village
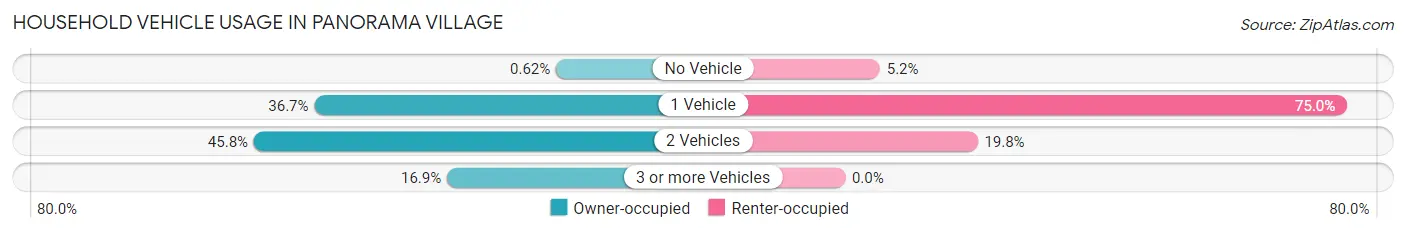
| Vehicles per Household | Owner-occupied | Renter-occupied |
| No Vehicle | 6 (0.6%) | 5 (5.2%) |
| 1 Vehicle | 354 (36.7%) | 72 (75.0%) |
| 2 Vehicles | 441 (45.8%) | 19 (19.8%) |
| 3 or more Vehicles | 163 (16.9%) | 0 (0.0%) |
| Total | 964 (100.0%) | 96 (100.0%) |
Real Estate & Mortgages in Panorama Village
Real Estate and Mortgage Overview in Panorama Village
| Characteristic | Without Mortgage | With Mortgage |
| Housing Units | 499 | 465 |
| Median Property Value | $235,500 | $240,700 |
| Median Household Income | $71,581 | $51 |
| Monthly Housing Costs | $710 | $6 |
| Real Estate Taxes | $4,274 | $40 |
Property Value by Mortgage Status in Panorama Village
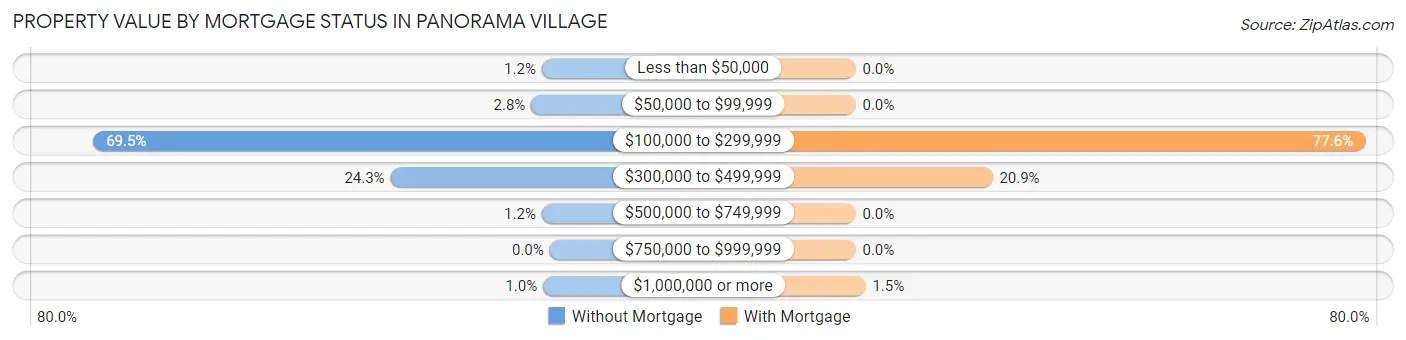
| Property Value | Without Mortgage | With Mortgage |
| Less than $50,000 | 6 (1.2%) | 0 (0.0%) |
| $50,000 to $99,999 | 14 (2.8%) | 0 (0.0%) |
| $100,000 to $299,999 | 347 (69.5%) | 361 (77.6%) |
| $300,000 to $499,999 | 121 (24.2%) | 97 (20.9%) |
| $500,000 to $749,999 | 6 (1.2%) | 0 (0.0%) |
| $750,000 to $999,999 | 0 (0.0%) | 0 (0.0%) |
| $1,000,000 or more | 5 (1.0%) | 7 (1.5%) |
| Total | 499 (100.0%) | 465 (100.0%) |
Household Income by Mortgage Status in Panorama Village
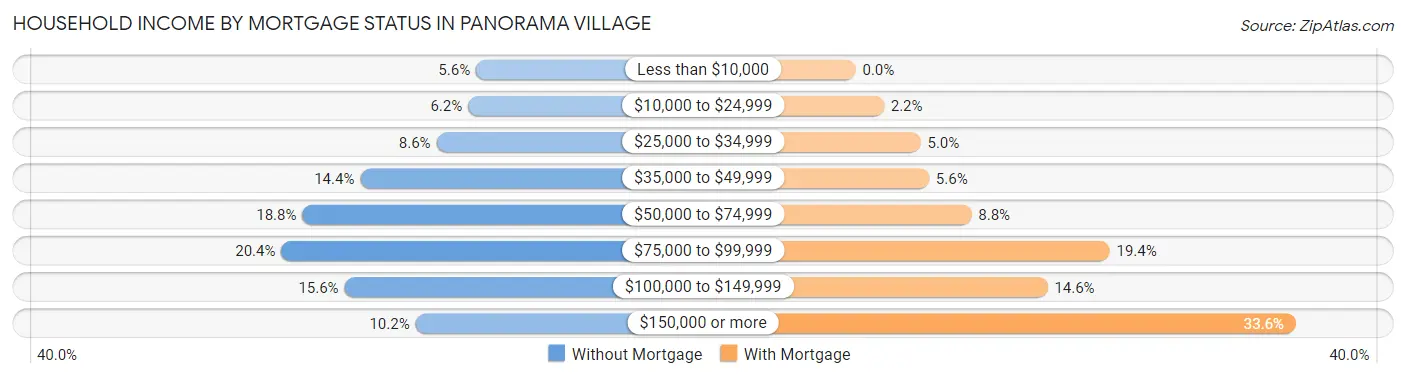
| Household Income | Without Mortgage | With Mortgage |
| Less than $10,000 | 28 (5.6%) | 0 (0.0%) |
| $10,000 to $24,999 | 31 (6.2%) | 10 (2.1%) |
| $25,000 to $34,999 | 43 (8.6%) | 23 (5.0%) |
| $35,000 to $49,999 | 72 (14.4%) | 26 (5.6%) |
| $50,000 to $74,999 | 94 (18.8%) | 41 (8.8%) |
| $75,000 to $99,999 | 102 (20.4%) | 90 (19.4%) |
| $100,000 to $149,999 | 78 (15.6%) | 68 (14.6%) |
| $150,000 or more | 51 (10.2%) | 156 (33.6%) |
| Total | 499 (100.0%) | 465 (100.0%) |
Property Value to Household Income Ratio in Panorama Village
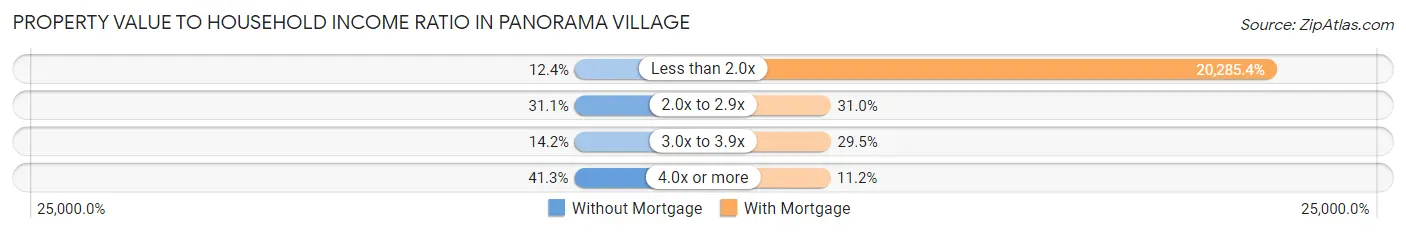
| Value-to-Income Ratio | Without Mortgage | With Mortgage |
| Less than 2.0x | 62 (12.4%) | 94,327 (20,285.4%) |
| 2.0x to 2.9x | 155 (31.1%) | 144 (31.0%) |
| 3.0x to 3.9x | 71 (14.2%) | 137 (29.5%) |
| 4.0x or more | 206 (41.3%) | 52 (11.2%) |
| Total | 499 (100.0%) | 465 (100.0%) |
Real Estate Taxes by Mortgage Status in Panorama Village
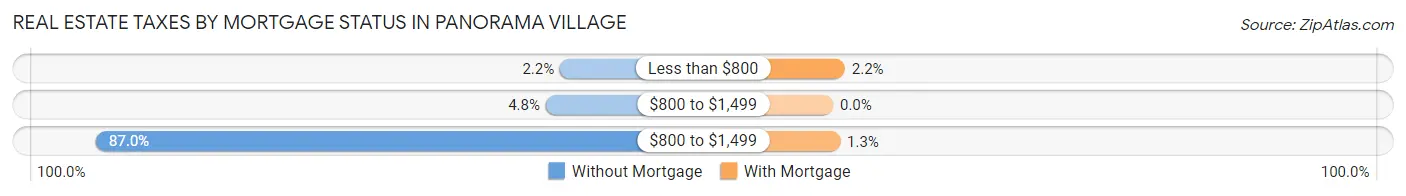
| Property Taxes | Without Mortgage | With Mortgage |
| Less than $800 | 11 (2.2%) | 10 (2.1%) |
| $800 to $1,499 | 24 (4.8%) | 0 (0.0%) |
| $800 to $1,499 | 434 (87.0%) | 6 (1.3%) |
| Total | 499 (100.0%) | 465 (100.0%) |
Health & Disability in Panorama Village
Health Insurance Coverage by Age in Panorama Village
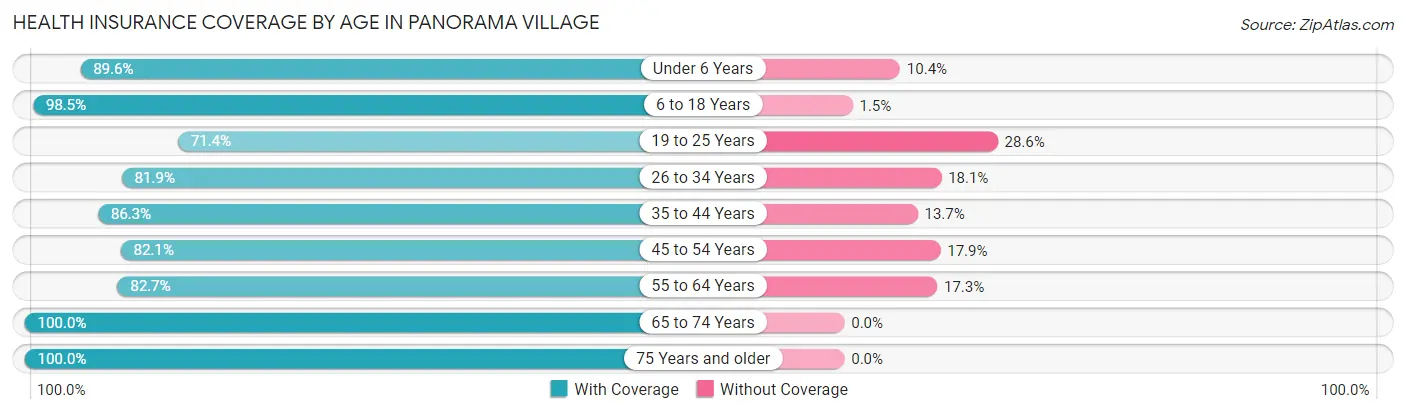
| Age Bracket | With Coverage | Without Coverage |
| Under 6 Years | 147 (89.6%) | 17 (10.4%) |
| 6 to 18 Years | 319 (98.5%) | 5 (1.5%) |
| 19 to 25 Years | 75 (71.4%) | 30 (28.6%) |
| 26 to 34 Years | 204 (81.9%) | 45 (18.1%) |
| 35 to 44 Years | 196 (86.3%) | 31 (13.7%) |
| 45 to 54 Years | 188 (82.1%) | 41 (17.9%) |
| 55 to 64 Years | 325 (82.7%) | 68 (17.3%) |
| 65 to 74 Years | 445 (100.0%) | 0 (0.0%) |
| 75 Years and older | 377 (100.0%) | 0 (0.0%) |
| Total | 2,276 (90.6%) | 237 (9.4%) |
Health Insurance Coverage by Citizenship Status in Panorama Village
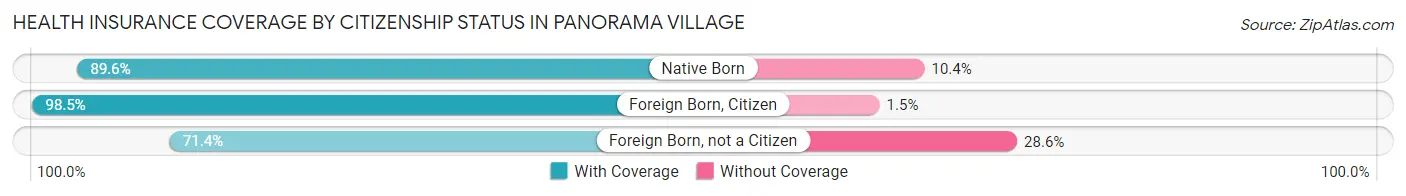
| Citizenship Status | With Coverage | Without Coverage |
| Native Born | 147 (89.6%) | 17 (10.4%) |
| Foreign Born, Citizen | 319 (98.5%) | 5 (1.5%) |
| Foreign Born, not a Citizen | 75 (71.4%) | 30 (28.6%) |
Health Insurance Coverage by Household Income in Panorama Village
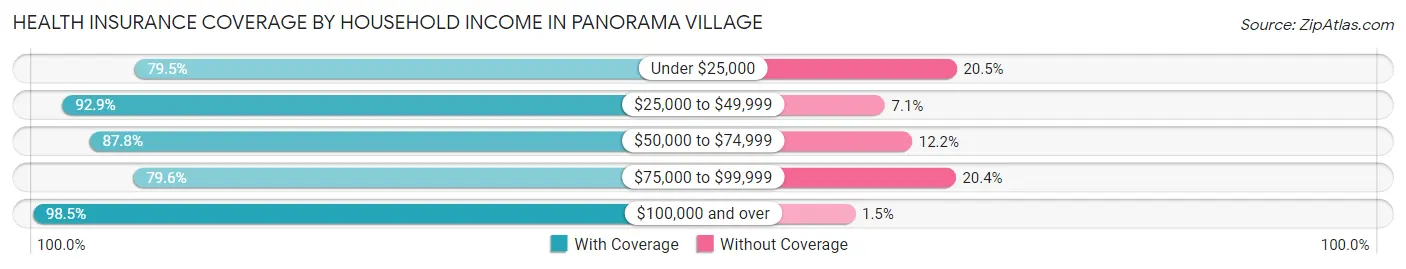
| Household Income | With Coverage | Without Coverage |
| Under $25,000 | 147 (79.5%) | 38 (20.5%) |
| $25,000 to $49,999 | 394 (92.9%) | 30 (7.1%) |
| $50,000 to $74,999 | 375 (87.8%) | 52 (12.2%) |
| $75,000 to $99,999 | 399 (79.6%) | 102 (20.4%) |
| $100,000 and over | 961 (98.5%) | 15 (1.5%) |
Public vs Private Health Insurance Coverage by Age in Panorama Village
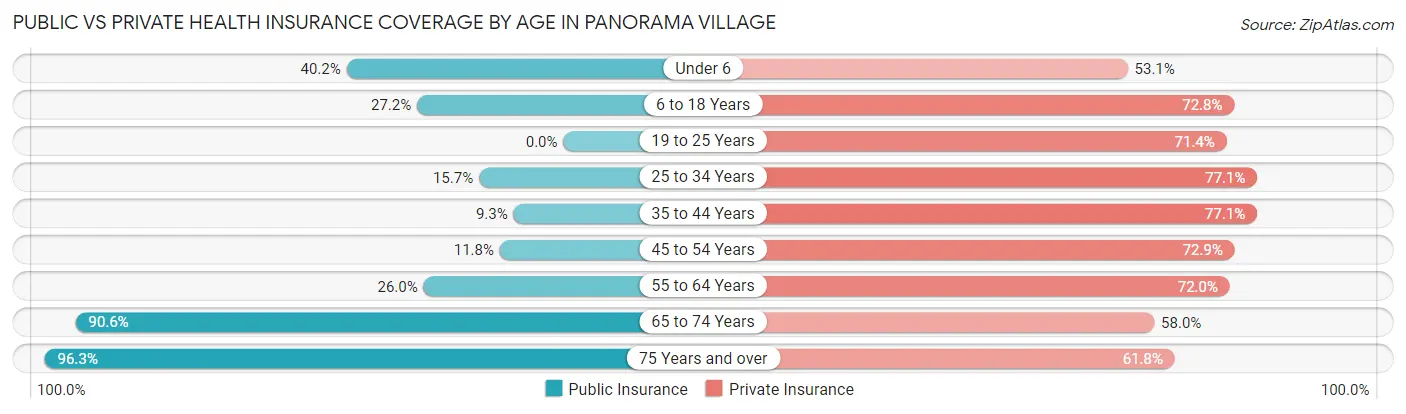
| Age Bracket | Public Insurance | Private Insurance |
| Under 6 | 66 (40.2%) | 87 (53.0%) |
| 6 to 18 Years | 88 (27.2%) | 236 (72.8%) |
| 19 to 25 Years | 0 (0.0%) | 75 (71.4%) |
| 25 to 34 Years | 39 (15.7%) | 192 (77.1%) |
| 35 to 44 Years | 21 (9.2%) | 175 (77.1%) |
| 45 to 54 Years | 27 (11.8%) | 167 (72.9%) |
| 55 to 64 Years | 102 (26.0%) | 283 (72.0%) |
| 65 to 74 Years | 403 (90.6%) | 258 (58.0%) |
| 75 Years and over | 363 (96.3%) | 233 (61.8%) |
| Total | 1,109 (44.1%) | 1,706 (67.9%) |
Disability Status by Sex by Age in Panorama Village
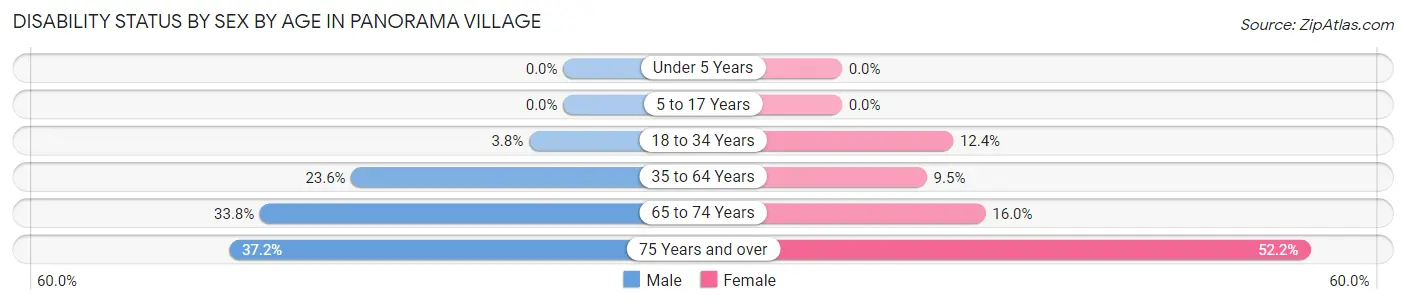
| Age Bracket | Male | Female |
| Under 5 Years | 0 (0.0%) | 0 (0.0%) |
| 5 to 17 Years | 0 (0.0%) | 0 (0.0%) |
| 18 to 34 Years | 6 (3.8%) | 26 (12.4%) |
| 35 to 64 Years | 93 (23.6%) | 43 (9.5%) |
| 65 to 74 Years | 51 (33.8%) | 47 (16.0%) |
| 75 Years and over | 54 (37.2%) | 121 (52.2%) |
Disability Class by Sex by Age in Panorama Village
Disability Class: Hearing Difficulty
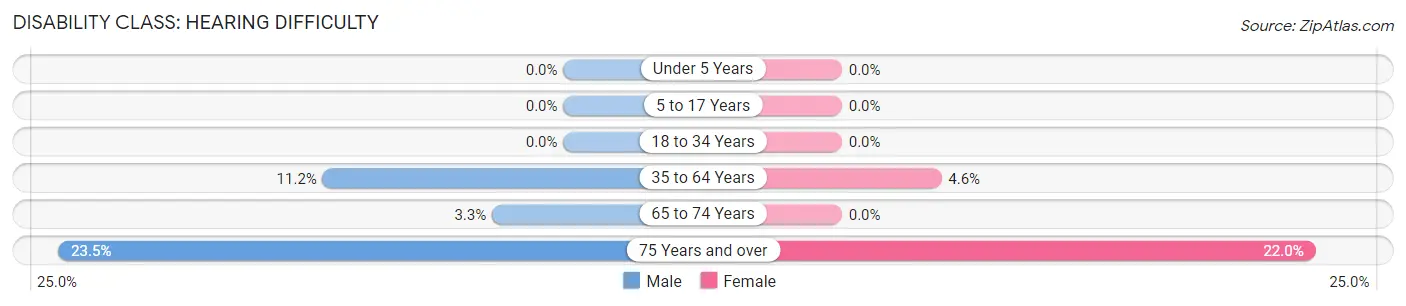
| Age Bracket | Male | Female |
| Under 5 Years | 0 (0.0%) | 0 (0.0%) |
| 5 to 17 Years | 0 (0.0%) | 0 (0.0%) |
| 18 to 34 Years | 0 (0.0%) | 0 (0.0%) |
| 35 to 64 Years | 44 (11.2%) | 21 (4.6%) |
| 65 to 74 Years | 5 (3.3%) | 0 (0.0%) |
| 75 Years and over | 34 (23.4%) | 51 (22.0%) |
Disability Class: Vision Difficulty
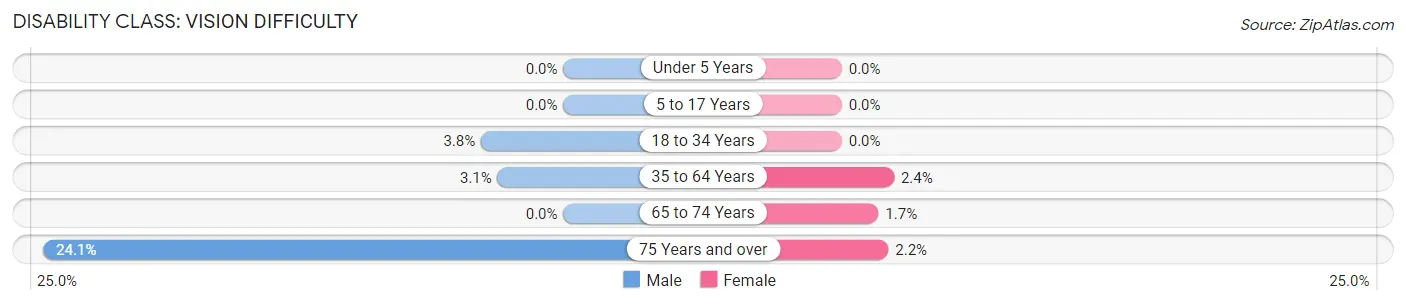
| Age Bracket | Male | Female |
| Under 5 Years | 0 (0.0%) | 0 (0.0%) |
| 5 to 17 Years | 0 (0.0%) | 0 (0.0%) |
| 18 to 34 Years | 6 (3.8%) | 0 (0.0%) |
| 35 to 64 Years | 12 (3.0%) | 11 (2.4%) |
| 65 to 74 Years | 0 (0.0%) | 5 (1.7%) |
| 75 Years and over | 35 (24.1%) | 5 (2.2%) |
Disability Class: Cognitive Difficulty
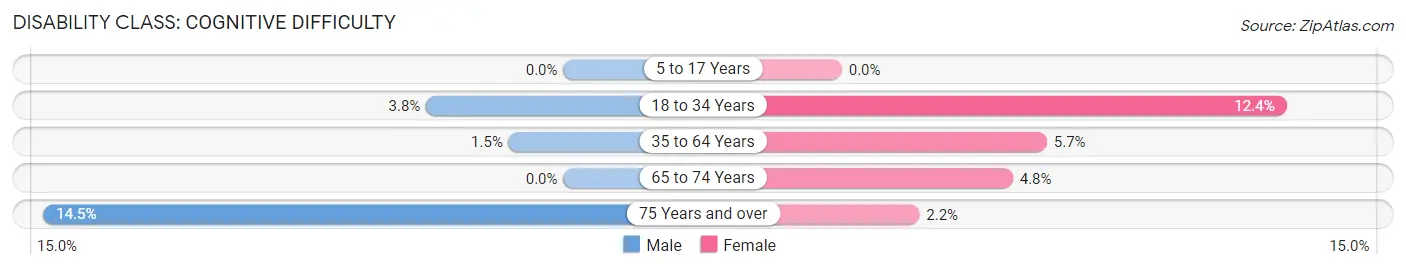
| Age Bracket | Male | Female |
| 5 to 17 Years | 0 (0.0%) | 0 (0.0%) |
| 18 to 34 Years | 6 (3.8%) | 26 (12.4%) |
| 35 to 64 Years | 6 (1.5%) | 26 (5.7%) |
| 65 to 74 Years | 0 (0.0%) | 14 (4.8%) |
| 75 Years and over | 21 (14.5%) | 5 (2.2%) |
Disability Class: Ambulatory Difficulty
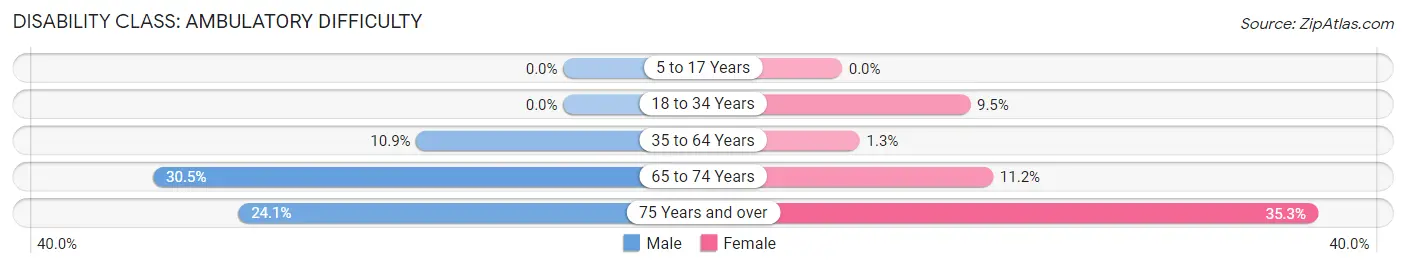
| Age Bracket | Male | Female |
| 5 to 17 Years | 0 (0.0%) | 0 (0.0%) |
| 18 to 34 Years | 0 (0.0%) | 20 (9.5%) |
| 35 to 64 Years | 43 (10.9%) | 6 (1.3%) |
| 65 to 74 Years | 46 (30.5%) | 33 (11.2%) |
| 75 Years and over | 35 (24.1%) | 82 (35.3%) |
Disability Class: Self-Care Difficulty
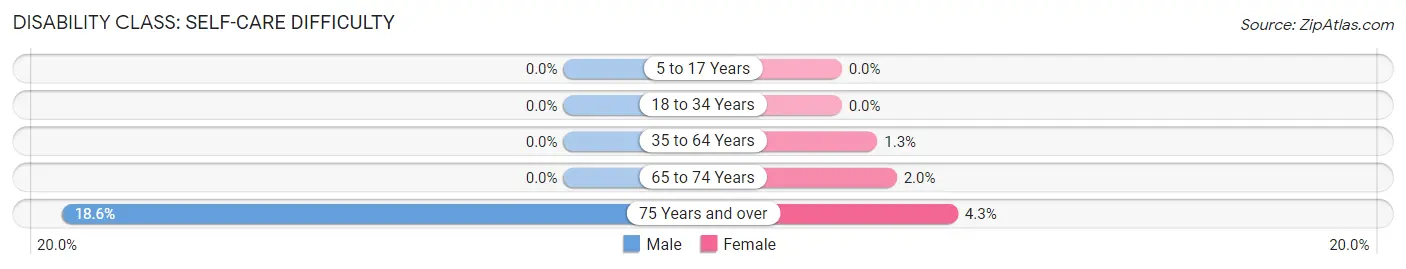
| Age Bracket | Male | Female |
| 5 to 17 Years | 0 (0.0%) | 0 (0.0%) |
| 18 to 34 Years | 0 (0.0%) | 0 (0.0%) |
| 35 to 64 Years | 0 (0.0%) | 6 (1.3%) |
| 65 to 74 Years | 0 (0.0%) | 6 (2.0%) |
| 75 Years and over | 27 (18.6%) | 10 (4.3%) |
Technology Access in Panorama Village
Computing Device Access in Panorama Village
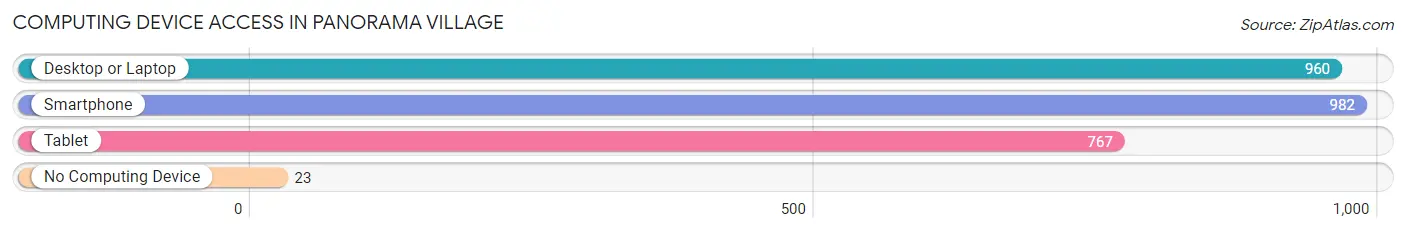
| Device Type | # Households | % Households |
| Desktop or Laptop | 960 | 90.6% |
| Smartphone | 982 | 92.6% |
| Tablet | 767 | 72.4% |
| No Computing Device | 23 | 2.2% |
| Total | 1,060 | 100.0% |
Internet Access in Panorama Village
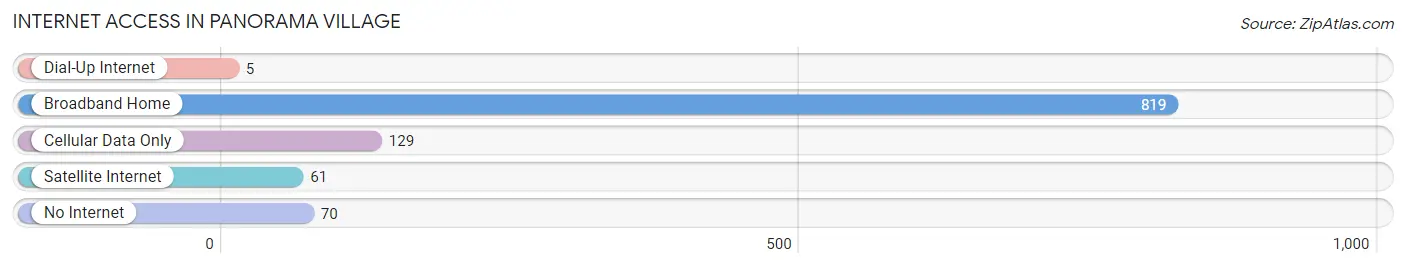
| Internet Type | # Households | % Households |
| Dial-Up Internet | 5 | 0.5% |
| Broadband Home | 819 | 77.3% |
| Cellular Data Only | 129 | 12.2% |
| Satellite Internet | 61 | 5.8% |
| No Internet | 70 | 6.6% |
| Total | 1,060 | 100.0% |
Panorama Village Summary
Panorama Village is a small city located in Montgomery County, Texas, United States. It is situated approximately 25 miles north of Houston and is part of the Houston–The Woodlands–Sugar Land metropolitan area. The city has a population of approximately 1,500 people and is known for its small-town charm and friendly atmosphere.
History
Panorama Village was founded in the late 1950s by a group of developers who wanted to create a community that was close to Houston but still had a rural feel. The city was named after the panoramic views of the surrounding countryside that could be seen from the area. The city was incorporated in 1965 and has since grown to become a popular destination for those looking for a quiet, rural lifestyle.
Geography
Panorama Village is located in Montgomery County, Texas, approximately 25 miles north of Houston. The city is situated on the western edge of Lake Conroe, a large reservoir created by the damming of the West Fork of the San Jacinto River. The city is surrounded by rolling hills and wooded areas, providing a picturesque backdrop for the city.
Economy
The economy of Panorama Village is largely based on tourism and small businesses. The city is home to several small businesses, including restaurants, retail stores, and professional services. The city also has a number of recreational activities, such as golf courses, parks, and fishing spots.
Demographics
As of the 2010 census, the population of Panorama Village was 1,500. The racial makeup of the city was 94.2% White, 0.7% African American, 0.3% Native American, 0.7% Asian, 0.1% Pacific Islander, 2.3% from other races, and 1.9% from two or more races. Hispanic or Latino of any race were 5.3% of the population.
The median income for a household in the city was $45,000, and the median income for a family was $50,000. The per capita income for the city was $20,000. About 8.3% of families and 10.3% of the population were below the poverty line, including 14.3% of those under age 18 and 6.7% of those age 65 or over.
Conclusion
Panorama Village is a small city located in Montgomery County, Texas, United States. It is situated approximately 25 miles north of Houston and is part of the Houston–The Woodlands–Sugar Land metropolitan area. The city has a population of approximately 1,500 people and is known for its small-town charm and friendly atmosphere. The economy of Panorama Village is largely based on tourism and small businesses, and the city is home to a variety of recreational activities. The population of the city is predominantly White, with a small percentage of African American, Native American, Asian, and Pacific Islander residents. The median income for a household in the city is $45,000, and the per capita income is $20,000.
Common Questions
What is Per Capita Income in Panorama Village?
Per Capita income in Panorama Village is $35,885.
What is the Median Family Income in Panorama Village?
Median Family Income in Panorama Village is $93,365.
What is the Median Household income in Panorama Village?
Median Household Income in Panorama Village is $74,107.
What is Income or Wage Gap in Panorama Village?
Income or Wage Gap in Panorama Village is 50.3%.
Women in Panorama Village earn 49.7 cents for every dollar earned by a man.
What is Inequality or Gini Index in Panorama Village?
Inequality or Gini Index in Panorama Village is 0.36.
What is the Total Population of Panorama Village?
Total Population of Panorama Village is 2,513.
What is the Total Male Population of Panorama Village?
Total Male Population of Panorama Village is 1,075.
What is the Total Female Population of Panorama Village?
Total Female Population of Panorama Village is 1,438.
What is the Ratio of Males per 100 Females in Panorama Village?
There are 74.76 Males per 100 Females in Panorama Village.
What is the Ratio of Females per 100 Males in Panorama Village?
There are 133.77 Females per 100 Males in Panorama Village.
What is the Median Population Age in Panorama Village?
Median Population Age in Panorama Village is 53.5 Years.
What is the Average Family Size in Panorama Village
Average Family Size in Panorama Village is 2.9 People.
What is the Average Household Size in Panorama Village
Average Household Size in Panorama Village is 2.4 People.
How Large is the Labor Force in Panorama Village?
There are 1,047 People in the Labor Forcein in Panorama Village.
What is the Percentage of People in the Labor Force in Panorama Village?
50.4% of People are in the Labor Force in Panorama Village.
What is the Unemployment Rate in Panorama Village?
Unemployment Rate in Panorama Village is 1.6%.