Mont Belvieu, TX Map & Demographics
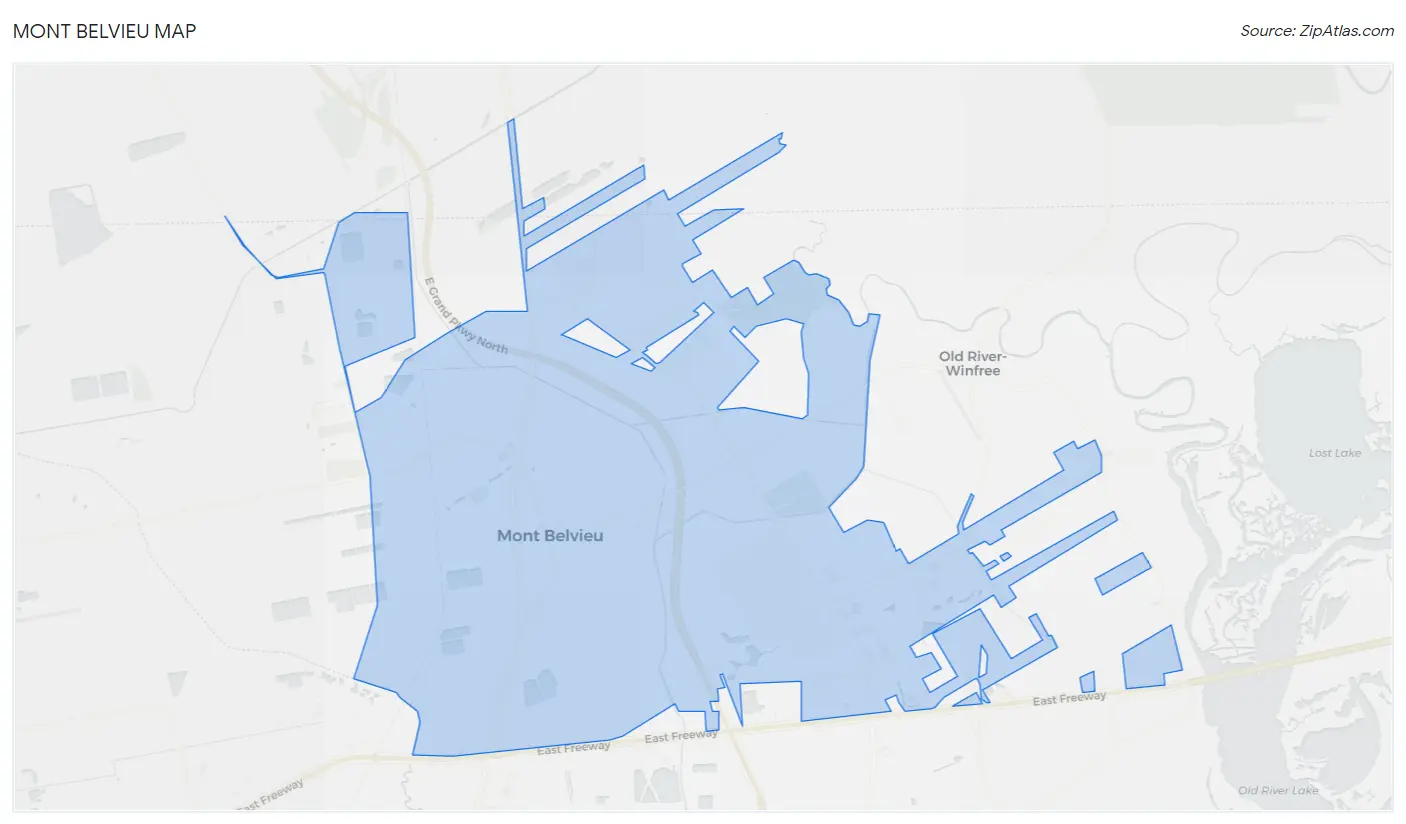
Mont Belvieu Map
Mont Belvieu Overview
$50,664
PER CAPITA INCOME
$143,875
AVG FAMILY INCOME
$132,010
AVG HOUSEHOLD INCOME
53.7%
WAGE / INCOME GAP [ % ]
46.3¢/ $1
WAGE / INCOME GAP [ $ ]
0.38
INEQUALITY / GINI INDEX
7,868
TOTAL POPULATION
3,672
MALE POPULATION
4,196
FEMALE POPULATION
87.51
MALES / 100 FEMALES
114.27
FEMALES / 100 MALES
36.0
MEDIAN AGE
3.1
AVG FAMILY SIZE
2.8
AVG HOUSEHOLD SIZE
4,044
LABOR FORCE [ PEOPLE ]
71.8%
PERCENT IN LABOR FORCE
2.0%
UNEMPLOYMENT RATE
Income in Mont Belvieu
Income Overview in Mont Belvieu
Per Capita Income in Mont Belvieu is $50,664, while median incomes of families and households are $143,875 and $132,010 respectively.
| Characteristic | Number | Measure |
| Per Capita Income | 7,868 | $50,664 |
| Median Family Income | 2,342 | $143,875 |
| Mean Family Income | 2,342 | $150,864 |
| Median Household Income | 2,844 | $132,010 |
| Mean Household Income | 2,844 | $138,323 |
| Income Deficit | 2,342 | $0 |
| Wage / Income Gap (%) | 7,868 | 53.66% |
| Wage / Income Gap ($) | 7,868 | 46.34¢ per $1 |
| Gini / Inequality Index | 7,868 | 0.38 |
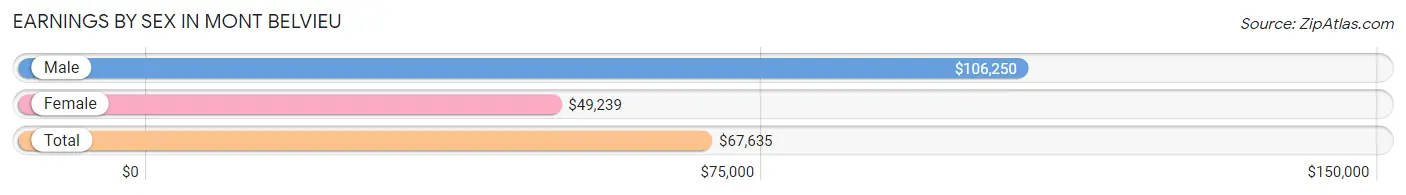
Earnings by Sex in Mont Belvieu
Average Earnings in Mont Belvieu are $67,635, $106,250 for men and $49,239 for women, a difference of 53.7%.
| Sex | Number | Average Earnings |
| Male | 2,225 (54.3%) | $106,250 |
| Female | 1,871 (45.7%) | $49,239 |
| Total | 4,096 (100.0%) | $67,635 |
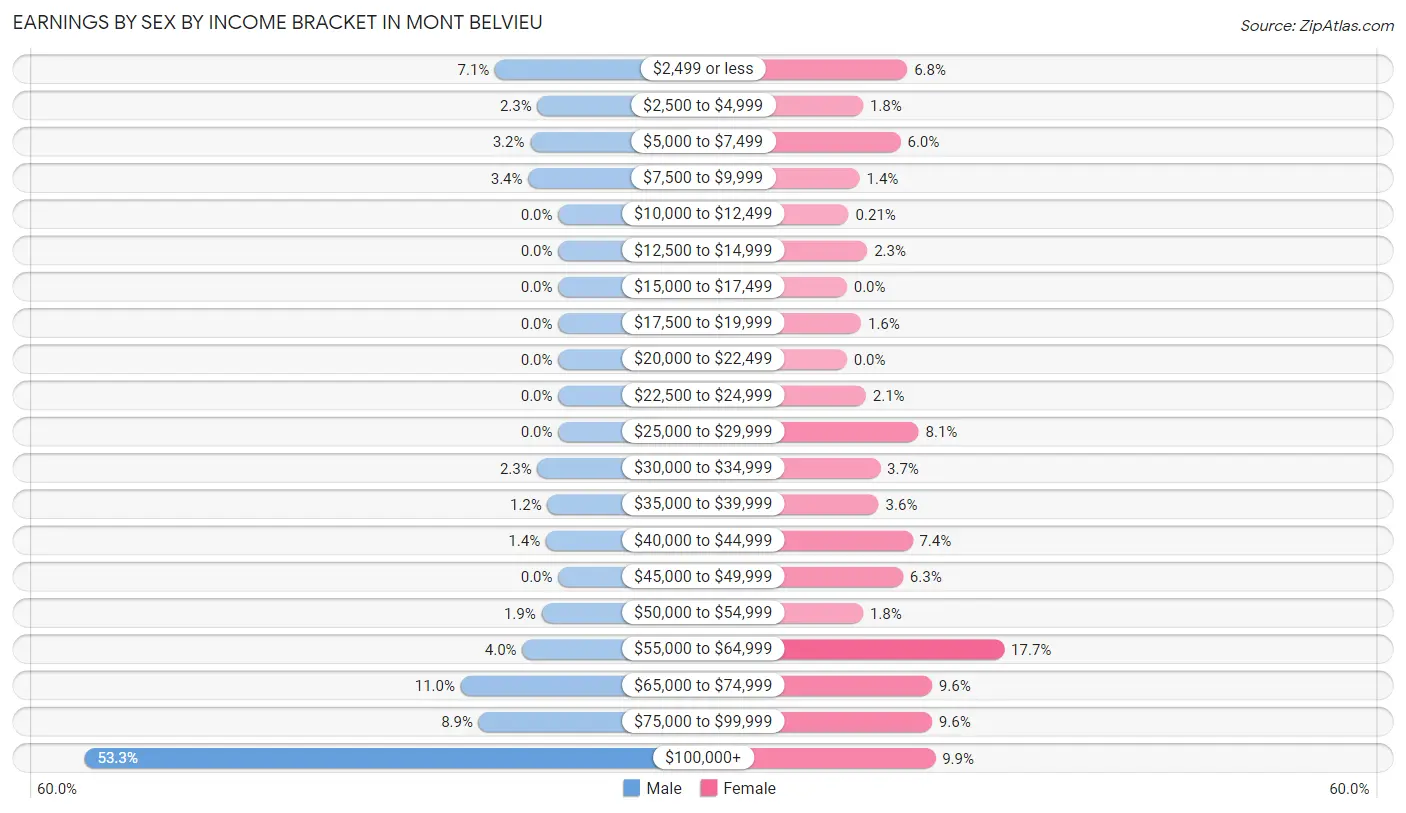
Earnings by Sex by Income Bracket in Mont Belvieu
The most common earnings brackets in Mont Belvieu are $100,000+ for men (1,185 | 53.3%) and $55,000 to $64,999 for women (331 | 17.7%).
| Income | Male | Female |
| $2,499 or less | 158 (7.1%) | 127 (6.8%) |
| $2,500 to $4,999 | 52 (2.3%) | 34 (1.8%) |
| $5,000 to $7,499 | 70 (3.2%) | 113 (6.0%) |
| $7,500 to $9,999 | 75 (3.4%) | 27 (1.4%) |
| $10,000 to $12,499 | 0 (0.0%) | 4 (0.2%) |
| $12,500 to $14,999 | 0 (0.0%) | 43 (2.3%) |
| $15,000 to $17,499 | 0 (0.0%) | 0 (0.0%) |
| $17,500 to $19,999 | 0 (0.0%) | 30 (1.6%) |
| $20,000 to $22,499 | 0 (0.0%) | 0 (0.0%) |
| $22,500 to $24,999 | 0 (0.0%) | 40 (2.1%) |
| $25,000 to $29,999 | 0 (0.0%) | 151 (8.1%) |
| $30,000 to $34,999 | 52 (2.3%) | 70 (3.7%) |
| $35,000 to $39,999 | 27 (1.2%) | 67 (3.6%) |
| $40,000 to $44,999 | 31 (1.4%) | 138 (7.4%) |
| $45,000 to $49,999 | 0 (0.0%) | 118 (6.3%) |
| $50,000 to $54,999 | 42 (1.9%) | 34 (1.8%) |
| $55,000 to $64,999 | 90 (4.0%) | 331 (17.7%) |
| $65,000 to $74,999 | 244 (11.0%) | 179 (9.6%) |
| $75,000 to $99,999 | 199 (8.9%) | 179 (9.6%) |
| $100,000+ | 1,185 (53.3%) | 186 (9.9%) |
| Total | 2,225 (100.0%) | 1,871 (100.0%) |
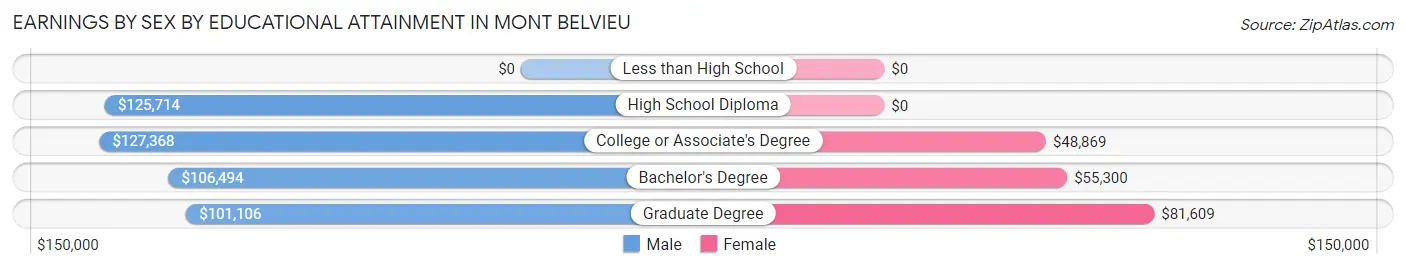
Earnings by Sex by Educational Attainment in Mont Belvieu
Average earnings in Mont Belvieu are $114,324 for men and $56,711 for women, a difference of 50.4%. Men with an educational attainment of college or associate's degree enjoy the highest average annual earnings of $127,368, while those with graduate degree education earn the least with $101,106. Women with an educational attainment of graduate degree earn the most with the average annual earnings of $81,609, while those with college or associate's degree education have the smallest earnings of $48,869.
| Educational Attainment | Male Income | Female Income |
| Less than High School | - | - |
| High School Diploma | $125,714 | $0 |
| College or Associate's Degree | $127,368 | $48,869 |
| Bachelor's Degree | $106,494 | $55,300 |
| Graduate Degree | $101,106 | $81,609 |
| Total | $114,324 | $56,711 |
Family Income in Mont Belvieu
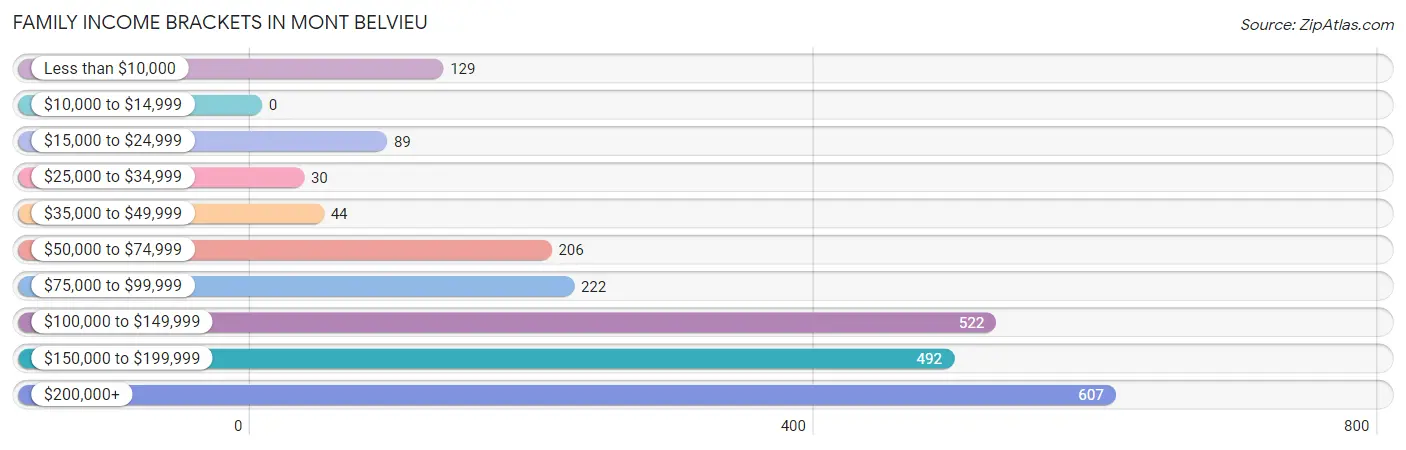
Family Income Brackets in Mont Belvieu
According to the Mont Belvieu family income data, there are 607 families falling into the $200,000+ income range, which is the most common income bracket and makes up 25.9% of all families.
| Income Bracket | # Families | % Families |
| Less than $10,000 | 129 | 5.5% |
| $10,000 to $14,999 | 0 | 0.0% |
| $15,000 to $24,999 | 89 | 3.8% |
| $25,000 to $34,999 | 30 | 1.3% |
| $35,000 to $49,999 | 44 | 1.9% |
| $50,000 to $74,999 | 206 | 8.8% |
| $75,000 to $99,999 | 222 | 9.5% |
| $100,000 to $149,999 | 522 | 22.3% |
| $150,000 to $199,999 | 492 | 21.0% |
| $200,000+ | 607 | 25.9% |
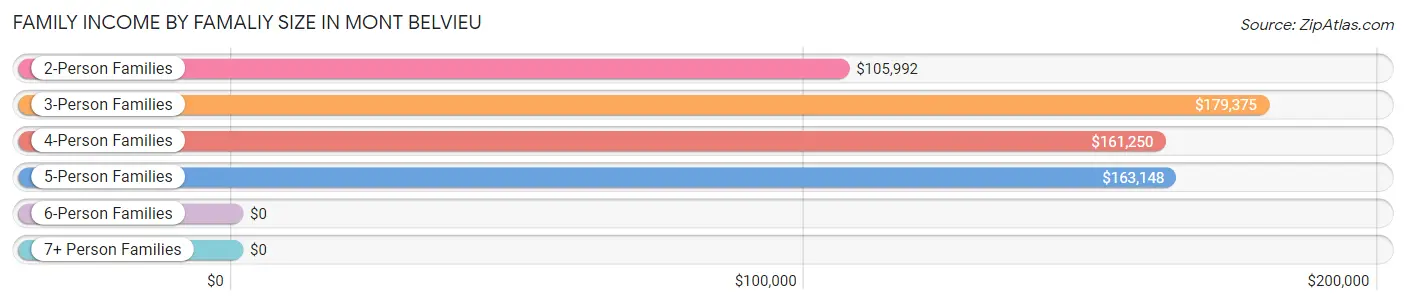
Family Income by Famaliy Size in Mont Belvieu
3-person families (328 | 14.0%) account for the highest median family income in Mont Belvieu with $179,375 per family, while 3-person families (328 | 14.0%) have the highest median income of $59,792 per family member.
| Income Bracket | # Families | Median Income |
| 2-Person Families | 1,200 (51.2%) | $105,992 |
| 3-Person Families | 328 (14.0%) | $179,375 |
| 4-Person Families | 674 (28.8%) | $161,250 |
| 5-Person Families | 120 (5.1%) | $163,148 |
| 6-Person Families | 20 (0.9%) | $0 |
| 7+ Person Families | 0 (0.0%) | $0 |
| Total | 2,342 (100.0%) | $143,875 |
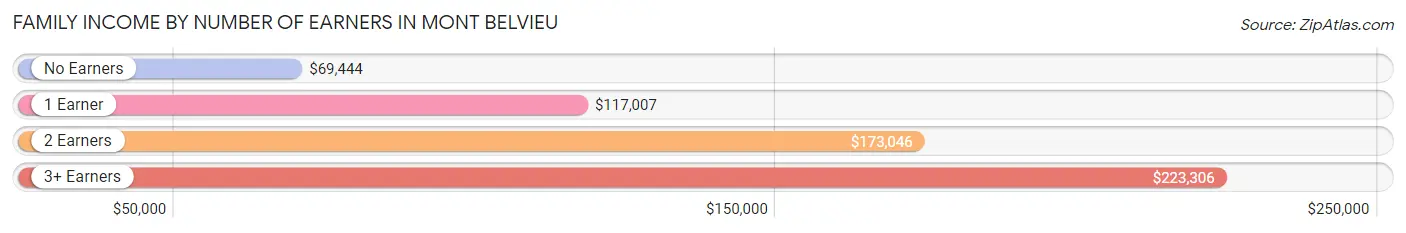
Family Income by Number of Earners in Mont Belvieu
The median family income in Mont Belvieu is $143,875, with families comprising 3+ earners (160) having the highest median family income of $223,306, while families with no earners (468) have the lowest median family income of $69,444, accounting for 6.8% and 20.0% of families, respectively.
| Number of Earners | # Families | Median Income |
| No Earners | 468 (20.0%) | $69,444 |
| 1 Earner | 571 (24.4%) | $117,007 |
| 2 Earners | 1,143 (48.8%) | $173,046 |
| 3+ Earners | 160 (6.8%) | $223,306 |
| Total | 2,342 (100.0%) | $143,875 |
Household Income in Mont Belvieu
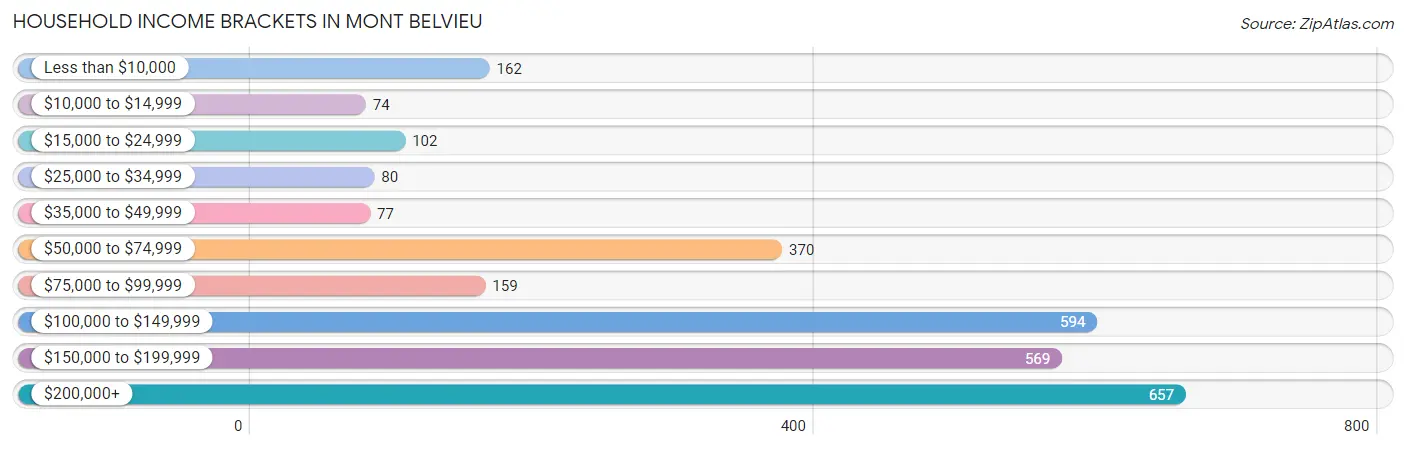
Household Income Brackets in Mont Belvieu
With 657 households falling in the category, the $200,000+ income range is the most frequent in Mont Belvieu, accounting for 23.1% of all households. In contrast, only 74 households (2.6%) fall into the $10,000 to $14,999 income bracket, making it the least populous group.
| Income Bracket | # Households | % Households |
| Less than $10,000 | 162 | 5.7% |
| $10,000 to $14,999 | 74 | 2.6% |
| $15,000 to $24,999 | 102 | 3.6% |
| $25,000 to $34,999 | 80 | 2.8% |
| $35,000 to $49,999 | 77 | 2.7% |
| $50,000 to $74,999 | 370 | 13.0% |
| $75,000 to $99,999 | 159 | 5.6% |
| $100,000 to $149,999 | 594 | 20.9% |
| $150,000 to $199,999 | 569 | 20.0% |
| $200,000+ | 657 | 23.1% |
Household Income by Householder Age in Mont Belvieu
The median household income in Mont Belvieu is $132,010, with the highest median household income of $171,042 found in the 45 to 64 years age bracket for the primary householder. A total of 950 households (33.4%) fall into this category. Meanwhile, the 15 to 24 years age bracket for the primary householder has the lowest median household income of $0, with 76 households (2.7%) in this group.
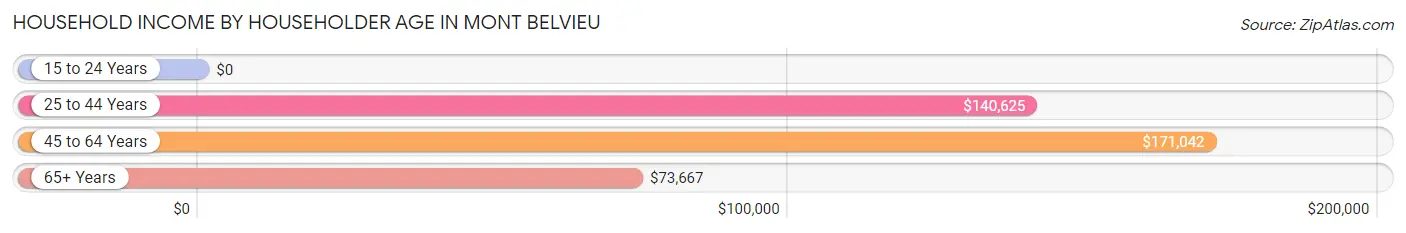
| Income Bracket | # Households | Median Income |
| 15 to 24 Years | 76 (2.7%) | $0 |
| 25 to 44 Years | 1,390 (48.9%) | $140,625 |
| 45 to 64 Years | 950 (33.4%) | $171,042 |
| 65+ Years | 428 (15.0%) | $73,667 |
| Total | 2,844 (100.0%) | $132,010 |
Poverty in Mont Belvieu
Income Below Poverty by Sex and Age in Mont Belvieu
With 11.2% poverty level for males and 10.7% for females among the residents of Mont Belvieu, 65 to 74 year old males and 15 year old females are the most vulnerable to poverty, with 111 males (33.4%) and 15 females (33.3%) in their respective age groups living below the poverty level.
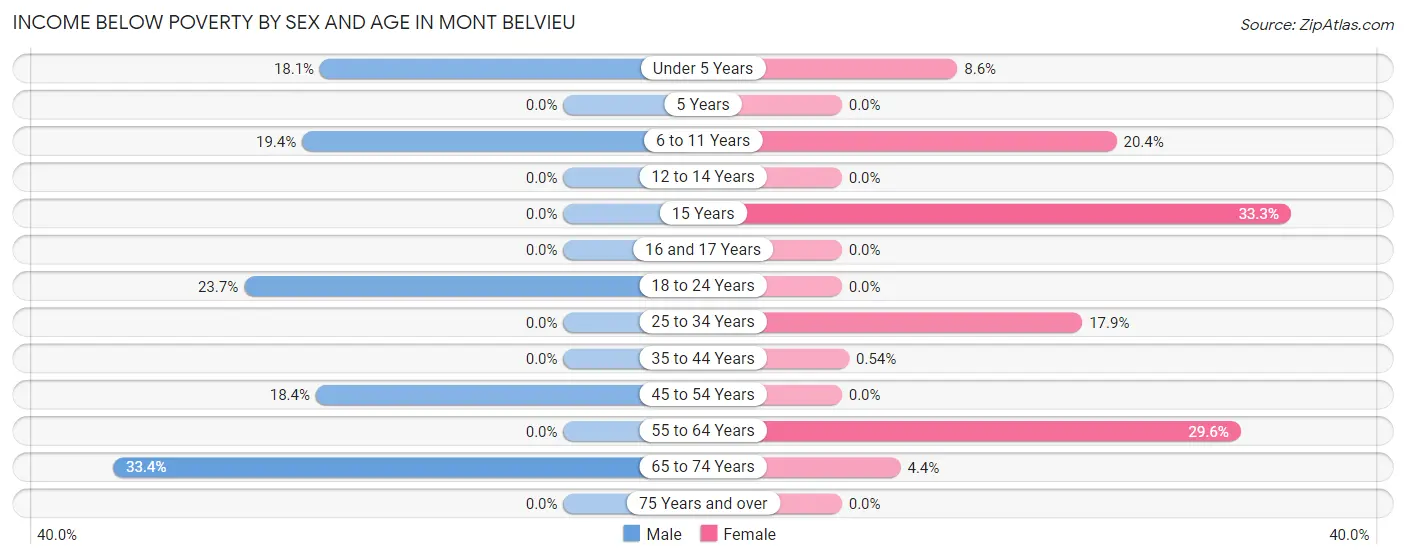
| Age Bracket | Male | Female |
| Under 5 Years | 43 (18.1%) | 35 (8.6%) |
| 5 Years | 0 (0.0%) | 0 (0.0%) |
| 6 to 11 Years | 109 (19.4%) | 131 (20.4%) |
| 12 to 14 Years | 0 (0.0%) | 0 (0.0%) |
| 15 Years | 0 (0.0%) | 15 (33.3%) |
| 16 and 17 Years | 0 (0.0%) | 0 (0.0%) |
| 18 to 24 Years | 69 (23.7%) | 0 (0.0%) |
| 25 to 34 Years | 0 (0.0%) | 113 (17.8%) |
| 35 to 44 Years | 0 (0.0%) | 4 (0.5%) |
| 45 to 54 Years | 75 (18.4%) | 0 (0.0%) |
| 55 to 64 Years | 0 (0.0%) | 135 (29.6%) |
| 65 to 74 Years | 111 (33.4%) | 14 (4.4%) |
| 75 Years and over | 0 (0.0%) | 0 (0.0%) |
| Total | 407 (11.2%) | 447 (10.7%) |
Income Above Poverty by Sex and Age in Mont Belvieu
According to the poverty statistics in Mont Belvieu, males aged 12 to 14 years and females aged 5 years are the age groups that are most secure financially, with 100.0% of males and 100.0% of females in these age groups living above the poverty line.
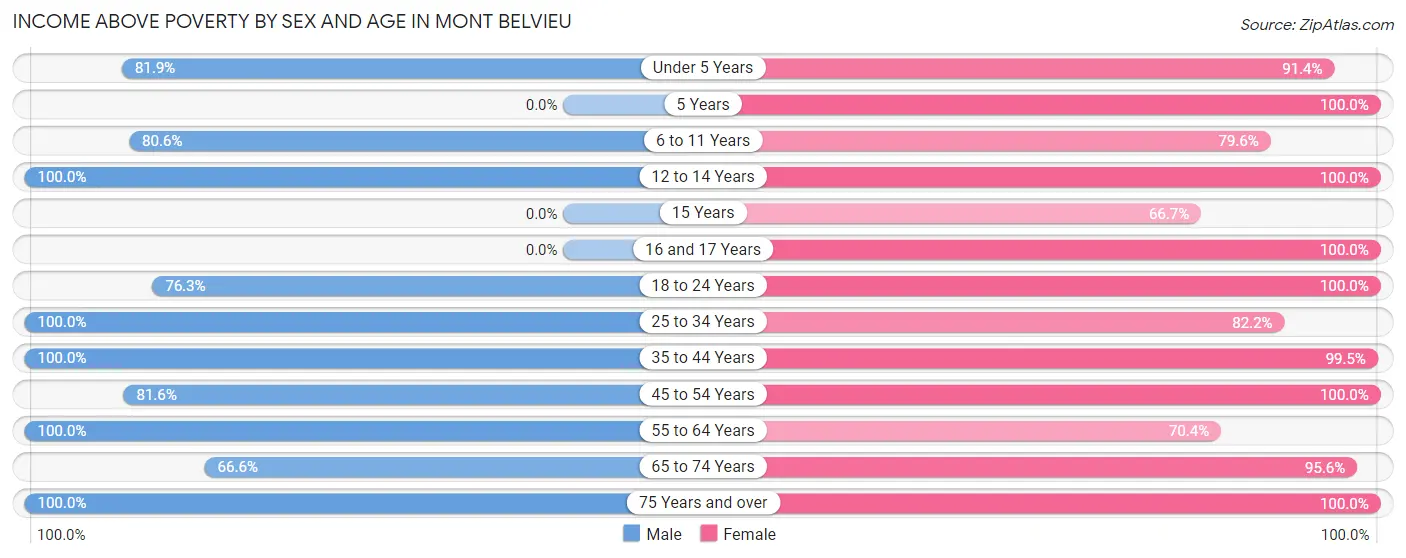
| Age Bracket | Male | Female |
| Under 5 Years | 195 (81.9%) | 373 (91.4%) |
| 5 Years | 0 (0.0%) | 112 (100.0%) |
| 6 to 11 Years | 453 (80.6%) | 511 (79.6%) |
| 12 to 14 Years | 137 (100.0%) | 70 (100.0%) |
| 15 Years | 0 (0.0%) | 30 (66.7%) |
| 16 and 17 Years | 0 (0.0%) | 18 (100.0%) |
| 18 to 24 Years | 222 (76.3%) | 244 (100.0%) |
| 25 to 34 Years | 423 (100.0%) | 520 (82.2%) |
| 35 to 44 Years | 678 (100.0%) | 741 (99.5%) |
| 45 to 54 Years | 333 (81.6%) | 427 (100.0%) |
| 55 to 64 Years | 471 (100.0%) | 321 (70.4%) |
| 65 to 74 Years | 221 (66.6%) | 307 (95.6%) |
| 75 Years and over | 110 (100.0%) | 67 (100.0%) |
| Total | 3,243 (88.8%) | 3,741 (89.3%) |
Income Below Poverty Among Married-Couple Families in Mont Belvieu
The poverty statistics for married-couple families in Mont Belvieu show that 6.2% or 119 of the total 1,922 families live below the poverty line. Families with no children have the highest poverty rate of 7.9%, comprising of 89 families. On the other hand, families with 3 or 4 children have the lowest poverty rate of 0.0%, which includes 0 families.
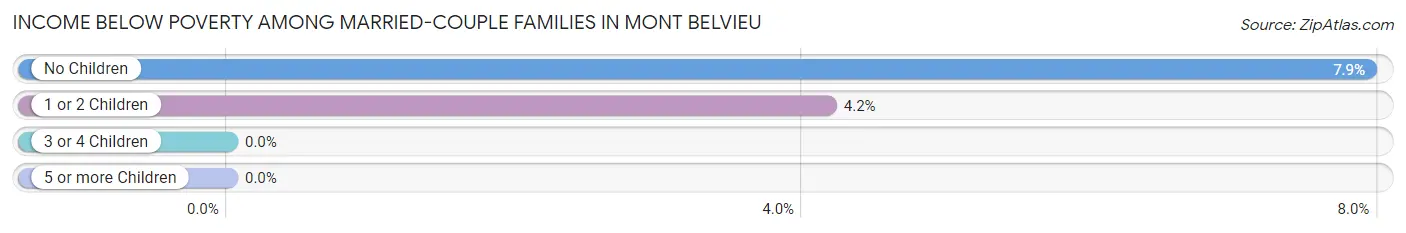
| Children | Above Poverty | Below Poverty |
| No Children | 1,034 (92.1%) | 89 (7.9%) |
| 1 or 2 Children | 690 (95.8%) | 30 (4.2%) |
| 3 or 4 Children | 79 (100.0%) | 0 (0.0%) |
| 5 or more Children | 0 (0.0%) | 0 (0.0%) |
| Total | 1,803 (93.8%) | 119 (6.2%) |
Income Below Poverty Among Single-Parent Households in Mont Belvieu
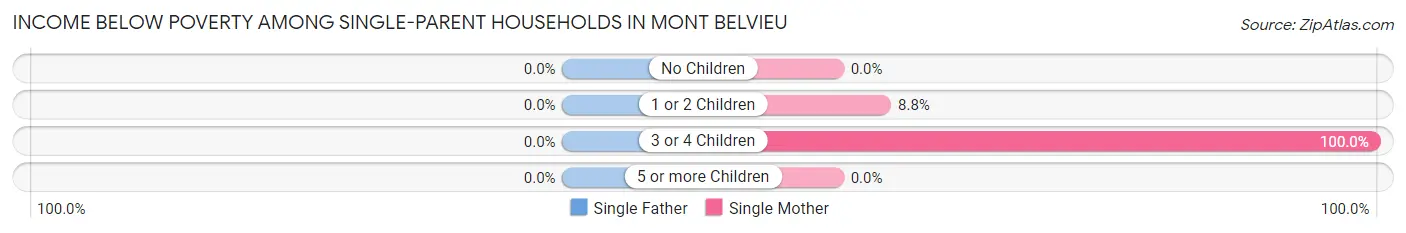
| Children | Single Father | Single Mother |
| No Children | 0 (0.0%) | 0 (0.0%) |
| 1 or 2 Children | 0 (0.0%) | 16 (8.8%) |
| 3 or 4 Children | 0 (0.0%) | 113 (100.0%) |
| 5 or more Children | 0 (0.0%) | 0 (0.0%) |
| Total | 0 (0.0%) | 129 (41.2%) |
Income Below Poverty Among Married-Couple vs Single-Parent Households in Mont Belvieu
The poverty data for Mont Belvieu shows that 119 of the married-couple family households (6.2%) and 129 of the single-parent households (30.7%) are living below the poverty level. Within the married-couple family households, those with no children have the highest poverty rate, with 89 households (7.9%) falling below the poverty line. Among the single-parent households, those with 3 or 4 children have the highest poverty rate, with 113 household (100.0%) living below poverty.
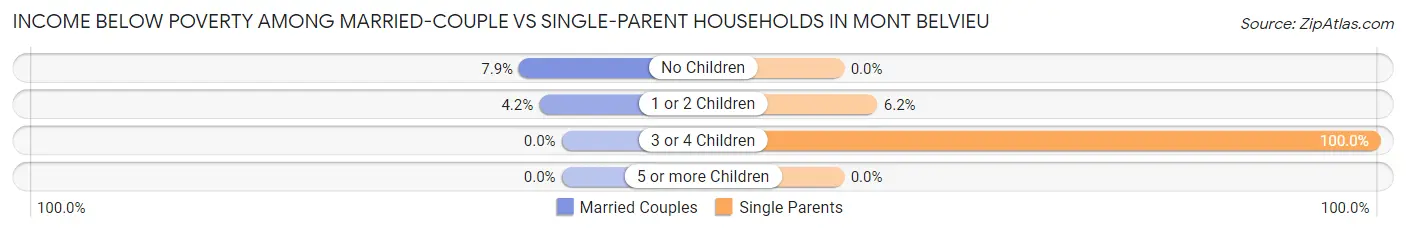
| Children | Married-Couple Families | Single-Parent Households |
| No Children | 89 (7.9%) | 0 (0.0%) |
| 1 or 2 Children | 30 (4.2%) | 16 (6.2%) |
| 3 or 4 Children | 0 (0.0%) | 113 (100.0%) |
| 5 or more Children | 0 (0.0%) | 0 (0.0%) |
| Total | 119 (6.2%) | 129 (30.7%) |
Race in Mont Belvieu
The most populous races in Mont Belvieu are White / Caucasian (6,138 | 78.0%), Hispanic or Latino (1,232 | 15.7%), and Some other Race (587 | 7.5%).
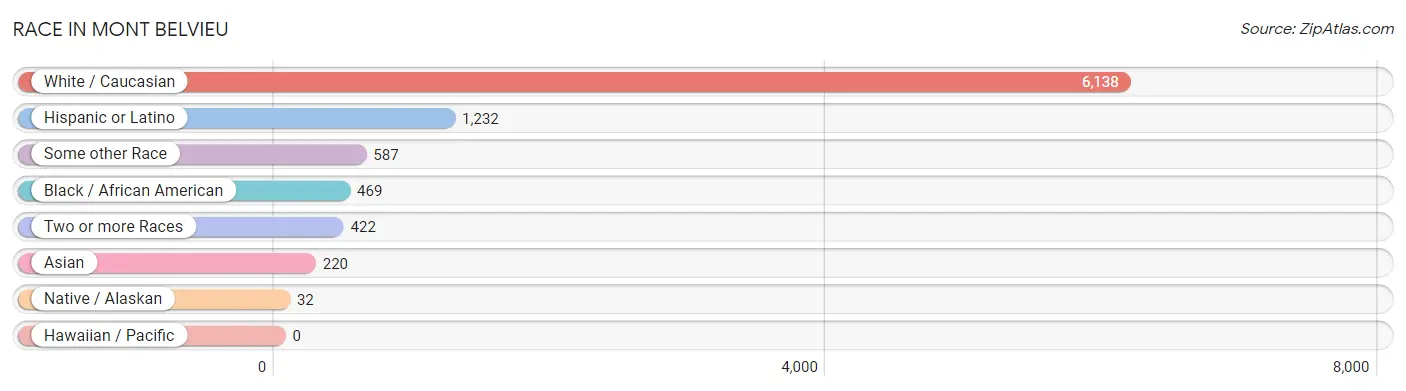
| Race | # Population | % Population |
| Asian | 220 | 2.8% |
| Black / African American | 469 | 6.0% |
| Hawaiian / Pacific | 0 | 0.0% |
| Hispanic or Latino | 1,232 | 15.7% |
| Native / Alaskan | 32 | 0.4% |
| White / Caucasian | 6,138 | 78.0% |
| Two or more Races | 422 | 5.4% |
| Some other Race | 587 | 7.5% |
| Total | 7,868 | 100.0% |
Ancestry in Mont Belvieu
The most populous ancestries reported in Mont Belvieu are German (1,413 | 18.0%), Mexican (1,174 | 14.9%), Irish (891 | 11.3%), English (863 | 11.0%), and American (542 | 6.9%), together accounting for 62.1% of all Mont Belvieu residents.
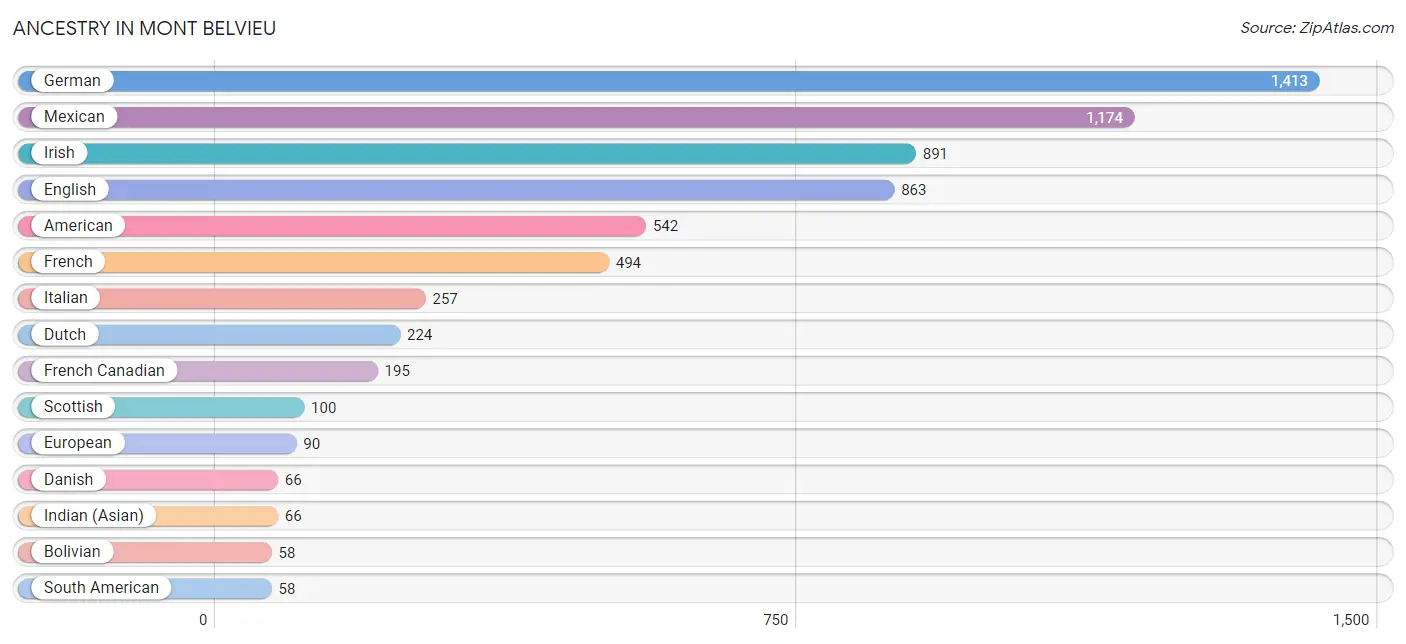
| Ancestry | # Population | % Population |
| American | 542 | 6.9% |
| Arab | 44 | 0.6% |
| Austrian | 55 | 0.7% |
| Bolivian | 58 | 0.7% |
| Cherokee | 32 | 0.4% |
| Choctaw | 9 | 0.1% |
| Czech | 39 | 0.5% |
| Danish | 66 | 0.8% |
| Dutch | 224 | 2.9% |
| English | 863 | 11.0% |
| Estonian | 20 | 0.3% |
| European | 90 | 1.1% |
| Finnish | 27 | 0.3% |
| French | 494 | 6.3% |
| French Canadian | 195 | 2.5% |
| German | 1,413 | 18.0% |
| Indian (Asian) | 66 | 0.8% |
| Irish | 891 | 11.3% |
| Italian | 257 | 3.3% |
| Korean | 46 | 0.6% |
| Lebanese | 44 | 0.6% |
| Mexican | 1,174 | 14.9% |
| Norwegian | 29 | 0.4% |
| Polish | 25 | 0.3% |
| Scandinavian | 15 | 0.2% |
| Scotch-Irish | 42 | 0.5% |
| Scottish | 100 | 1.3% |
| South American | 58 | 0.7% |
| Swedish | 15 | 0.2% | View All 29 Rows |
Immigrants in Mont Belvieu
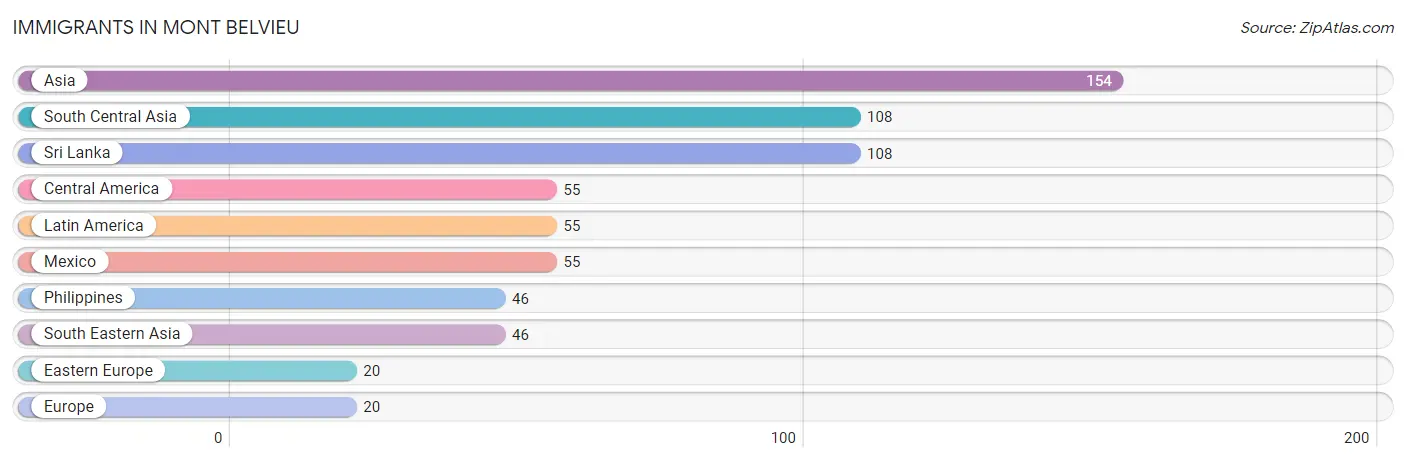
The most numerous immigrant groups reported in Mont Belvieu came from Asia (154 | 2.0%), South Central Asia (108 | 1.4%), Sri Lanka (108 | 1.4%), Central America (55 | 0.7%), and Latin America (55 | 0.7%), together accounting for 6.1% of all Mont Belvieu residents.
| Immigration Origin | # Population | % Population |
| Asia | 154 | 2.0% |
| Central America | 55 | 0.7% |
| Eastern Europe | 20 | 0.3% |
| Europe | 20 | 0.3% |
| Latin America | 55 | 0.7% |
| Mexico | 55 | 0.7% |
| Philippines | 46 | 0.6% |
| South Central Asia | 108 | 1.4% |
| South Eastern Asia | 46 | 0.6% |
| Sri Lanka | 108 | 1.4% | View All 10 Rows |
Sex and Age in Mont Belvieu
Sex and Age in Mont Belvieu
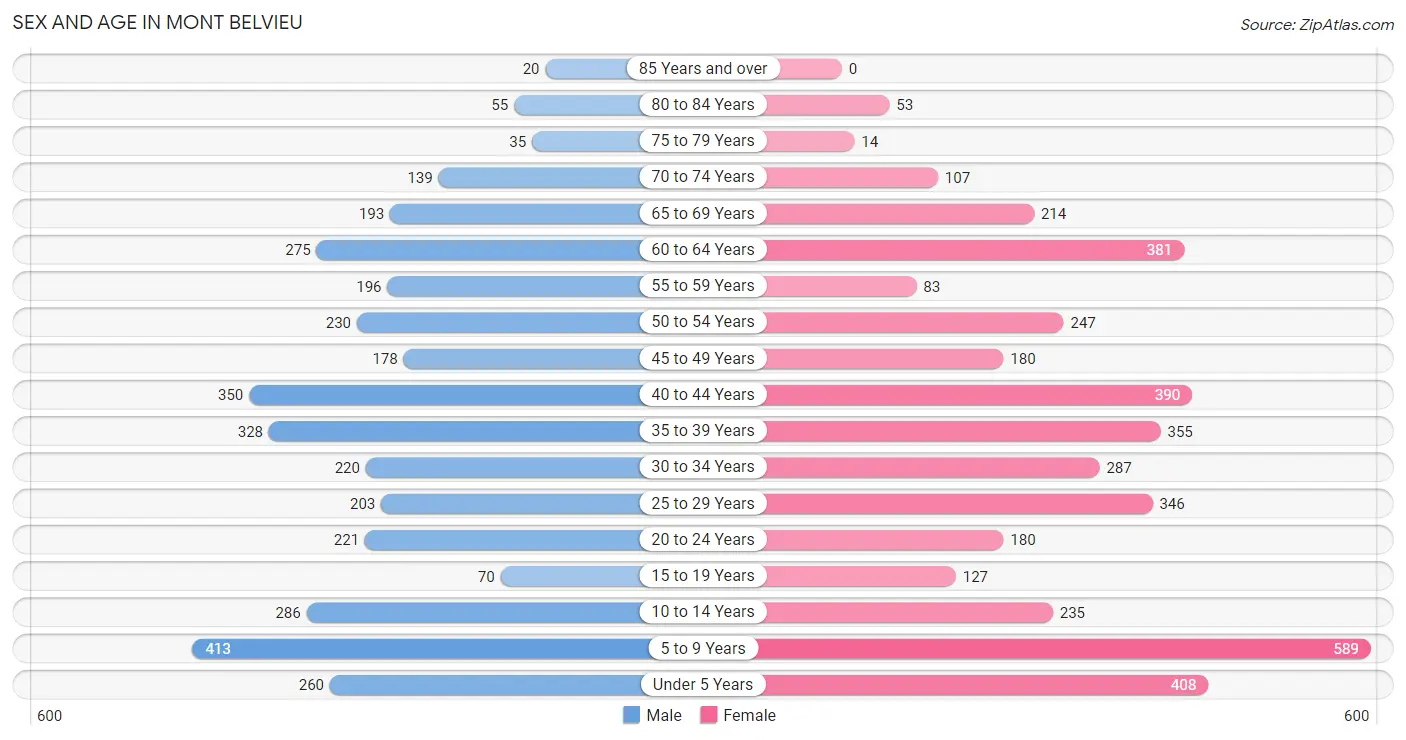
The most populous age groups in Mont Belvieu are 5 to 9 Years (413 | 11.3%) for men and 5 to 9 Years (589 | 14.0%) for women.
| Age Bracket | Male | Female |
| Under 5 Years | 260 (7.1%) | 408 (9.7%) |
| 5 to 9 Years | 413 (11.3%) | 589 (14.0%) |
| 10 to 14 Years | 286 (7.8%) | 235 (5.6%) |
| 15 to 19 Years | 70 (1.9%) | 127 (3.0%) |
| 20 to 24 Years | 221 (6.0%) | 180 (4.3%) |
| 25 to 29 Years | 203 (5.5%) | 346 (8.3%) |
| 30 to 34 Years | 220 (6.0%) | 287 (6.8%) |
| 35 to 39 Years | 328 (8.9%) | 355 (8.5%) |
| 40 to 44 Years | 350 (9.5%) | 390 (9.3%) |
| 45 to 49 Years | 178 (4.9%) | 180 (4.3%) |
| 50 to 54 Years | 230 (6.3%) | 247 (5.9%) |
| 55 to 59 Years | 196 (5.3%) | 83 (2.0%) |
| 60 to 64 Years | 275 (7.5%) | 381 (9.1%) |
| 65 to 69 Years | 193 (5.3%) | 214 (5.1%) |
| 70 to 74 Years | 139 (3.8%) | 107 (2.5%) |
| 75 to 79 Years | 35 (0.9%) | 14 (0.3%) |
| 80 to 84 Years | 55 (1.5%) | 53 (1.3%) |
| 85 Years and over | 20 (0.5%) | 0 (0.0%) |
| Total | 3,672 (100.0%) | 4,196 (100.0%) |
Families and Households in Mont Belvieu
Median Family Size in Mont Belvieu
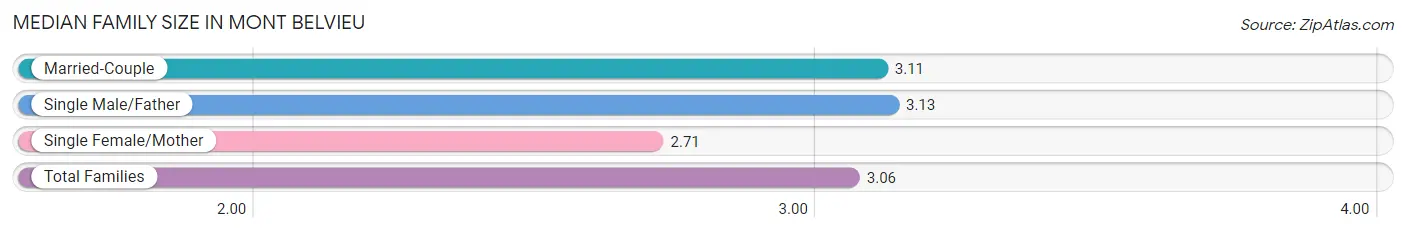
The median family size in Mont Belvieu is 3.06 persons per family, with single male/father families (107 | 4.6%) accounting for the largest median family size of 3.13 persons per family. On the other hand, single female/mother families (313 | 13.4%) represent the smallest median family size with 2.71 persons per family.
| Family Type | # Families | Family Size |
| Married-Couple | 1,922 (82.1%) | 3.11 |
| Single Male/Father | 107 (4.6%) | 3.13 |
| Single Female/Mother | 313 (13.4%) | 2.71 |
| Total Families | 2,342 (100.0%) | 3.06 |
Median Household Size in Mont Belvieu
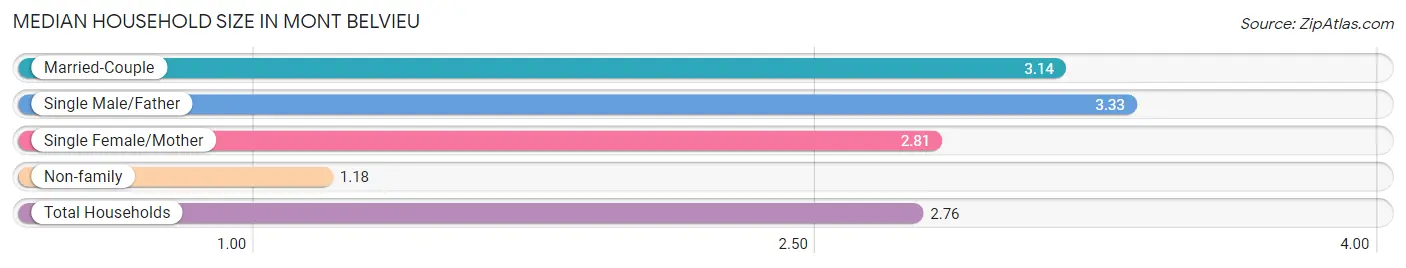
The median household size in Mont Belvieu is 2.76 persons per household, with single male/father households (107 | 3.8%) accounting for the largest median household size of 3.33 persons per household. non-family households (502 | 17.6%) represent the smallest median household size with 1.18 persons per household.
| Household Type | # Households | Household Size |
| Married-Couple | 1,922 (67.6%) | 3.14 |
| Single Male/Father | 107 (3.8%) | 3.33 |
| Single Female/Mother | 313 (11.0%) | 2.81 |
| Non-family | 502 (17.6%) | 1.18 |
| Total Households | 2,844 (100.0%) | 2.76 |
Household Size by Marriage Status in Mont Belvieu
Out of a total of 2,844 households in Mont Belvieu, 2,342 (82.4%) are family households, while 502 (17.6%) are nonfamily households. The most numerous type of family households are 2-person households, comprising 1,088, and the most common type of nonfamily households are 1-person households, comprising 417.
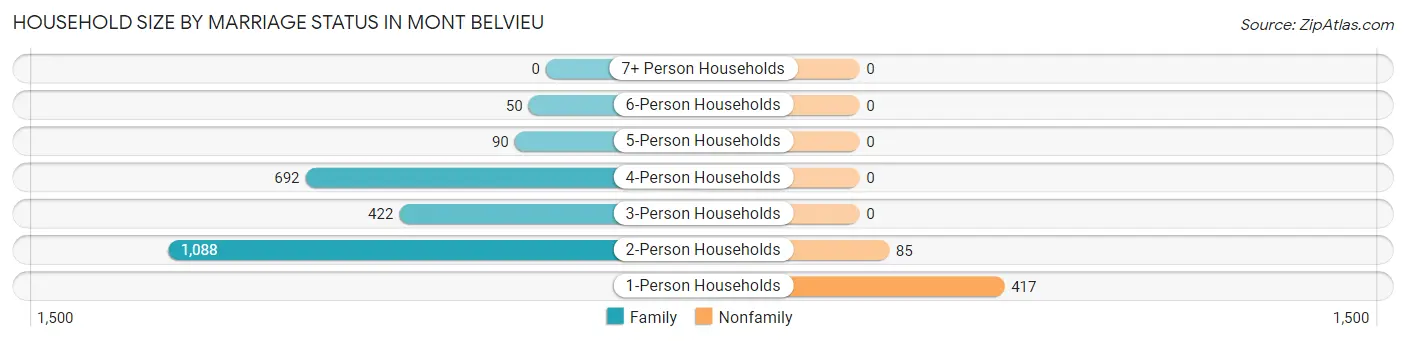
| Household Size | Family Households | Nonfamily Households |
| 1-Person Households | - | 417 (14.7%) |
| 2-Person Households | 1,088 (38.3%) | 85 (3.0%) |
| 3-Person Households | 422 (14.8%) | 0 (0.0%) |
| 4-Person Households | 692 (24.3%) | 0 (0.0%) |
| 5-Person Households | 90 (3.2%) | 0 (0.0%) |
| 6-Person Households | 50 (1.8%) | 0 (0.0%) |
| 7+ Person Households | 0 (0.0%) | 0 (0.0%) |
| Total | 2,342 (82.4%) | 502 (17.6%) |
Female Fertility in Mont Belvieu
Fertility by Age in Mont Belvieu
Average fertility rate in Mont Belvieu is 47.0 births per 1,000 women. Women in the age bracket of 20 to 34 years have the highest fertility rate with 57.0 births per 1,000 women. Women in the age bracket of 20 to 34 years acount for 52.3% of all women with births.
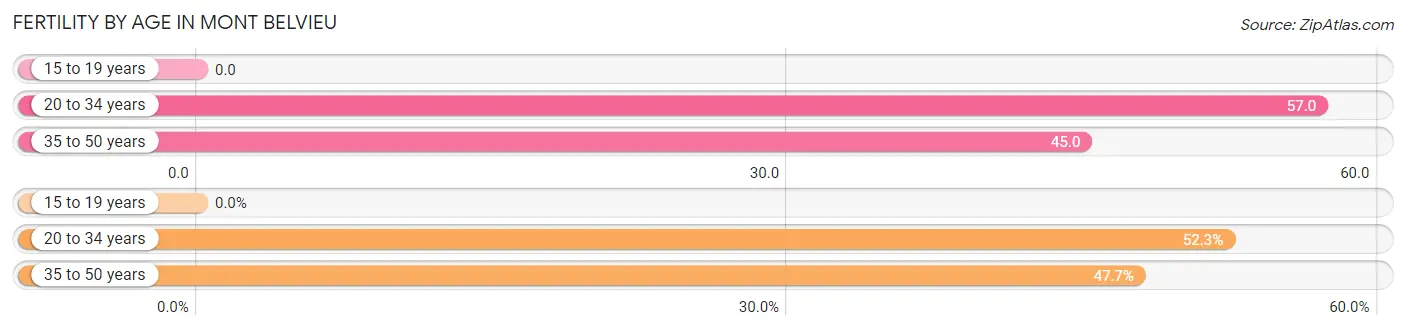
| Age Bracket | Women with Births | Births / 1,000 Women |
| 15 to 19 years | 0 (0.0%) | 0.0 |
| 20 to 34 years | 46 (52.3%) | 57.0 |
| 35 to 50 years | 42 (47.7%) | 45.0 |
| Total | 88 (100.0%) | 47.0 |
Fertility by Age by Marriage Status in Mont Belvieu
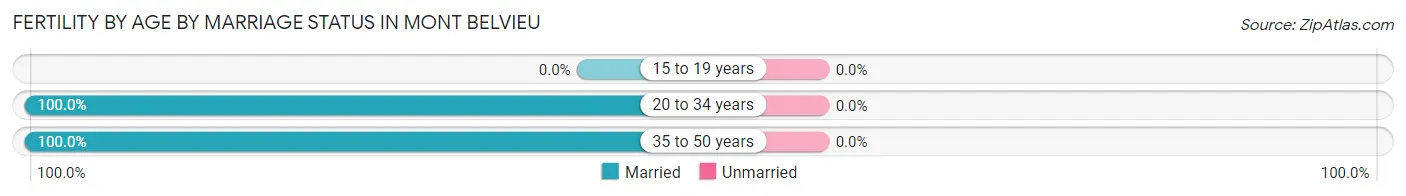
| Age Bracket | Married | Unmarried |
| 15 to 19 years | 0 (0.0%) | 0 (0.0%) |
| 20 to 34 years | 46 (100.0%) | 0 (0.0%) |
| 35 to 50 years | 42 (100.0%) | 0 (0.0%) |
| Total | 88 (100.0%) | 0 (0.0%) |
Fertility by Education in Mont Belvieu
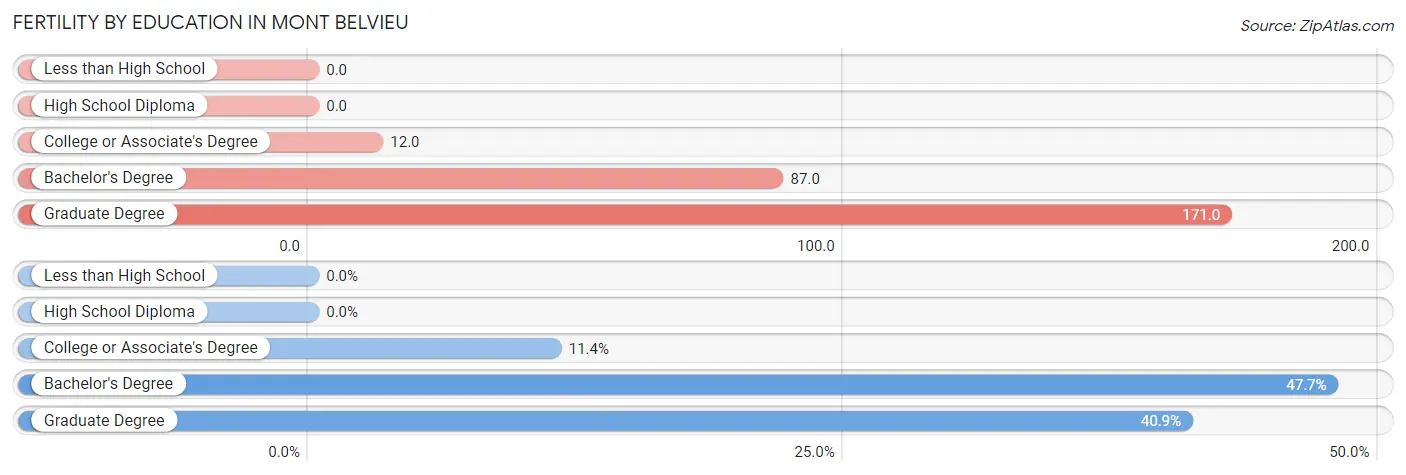
| Educational Attainment | Women with Births | Births / 1,000 Women |
| Less than High School | 0 (0.0%) | 0.0 |
| High School Diploma | 0 (0.0%) | 0.0 |
| College or Associate's Degree | 10 (11.4%) | 12.0 |
| Bachelor's Degree | 42 (47.7%) | 87.0 |
| Graduate Degree | 36 (40.9%) | 171.0 |
| Total | 88 (100.0%) | 47.0 |
Fertility by Education by Marriage Status in Mont Belvieu
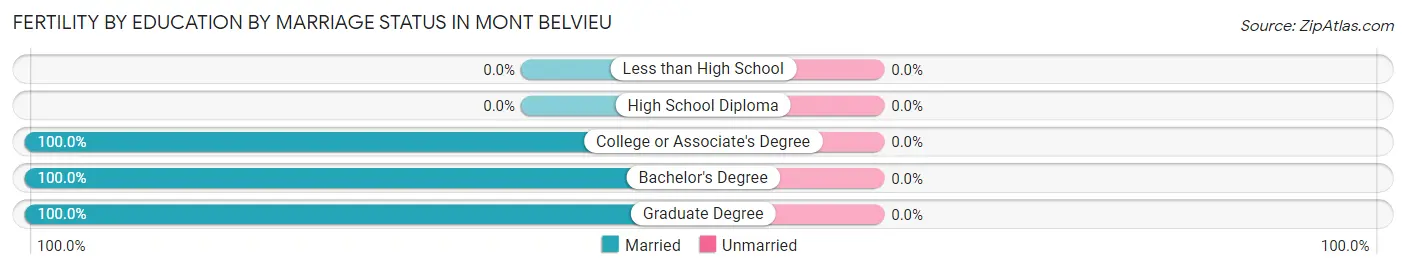
| Educational Attainment | Married | Unmarried |
| Less than High School | 0 (0.0%) | 0 (0.0%) |
| High School Diploma | 0 (0.0%) | 0 (0.0%) |
| College or Associate's Degree | 10 (100.0%) | 0 (0.0%) |
| Bachelor's Degree | 42 (100.0%) | 0 (0.0%) |
| Graduate Degree | 36 (100.0%) | 0 (0.0%) |
| Total | 88 (100.0%) | 0 (0.0%) |
Employment Characteristics in Mont Belvieu
Employment by Class of Employer in Mont Belvieu
Among the 3,962 employed individuals in Mont Belvieu, private company employees (2,953 | 74.5%), local government employees (379 | 9.6%), and self-employed (not incorporated) (258 | 6.5%) make up the most common classes of employment.
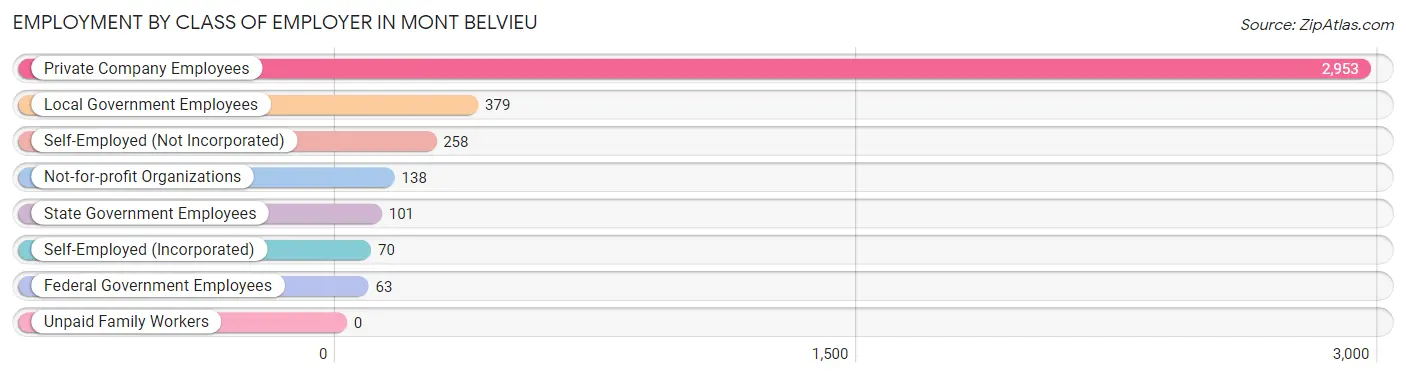
| Employer Class | # Employees | % Employees |
| Private Company Employees | 2,953 | 74.5% |
| Self-Employed (Incorporated) | 70 | 1.8% |
| Self-Employed (Not Incorporated) | 258 | 6.5% |
| Not-for-profit Organizations | 138 | 3.5% |
| Local Government Employees | 379 | 9.6% |
| State Government Employees | 101 | 2.5% |
| Federal Government Employees | 63 | 1.6% |
| Unpaid Family Workers | 0 | 0.0% |
| Total | 3,962 | 100.0% |
Employment Status by Age in Mont Belvieu
According to the labor force statistics for Mont Belvieu, out of the total population over 16 years of age (5,632), 71.8% or 4,044 individuals are in the labor force, with 2.0% or 81 of them unemployed. The age group with the highest labor force participation rate is 16 to 19 years, with 100.0% or 152 individuals in the labor force. Within the labor force, the 20 to 24 years age range has the highest percentage of unemployed individuals, with 12.1% or 46 of them being unemployed.
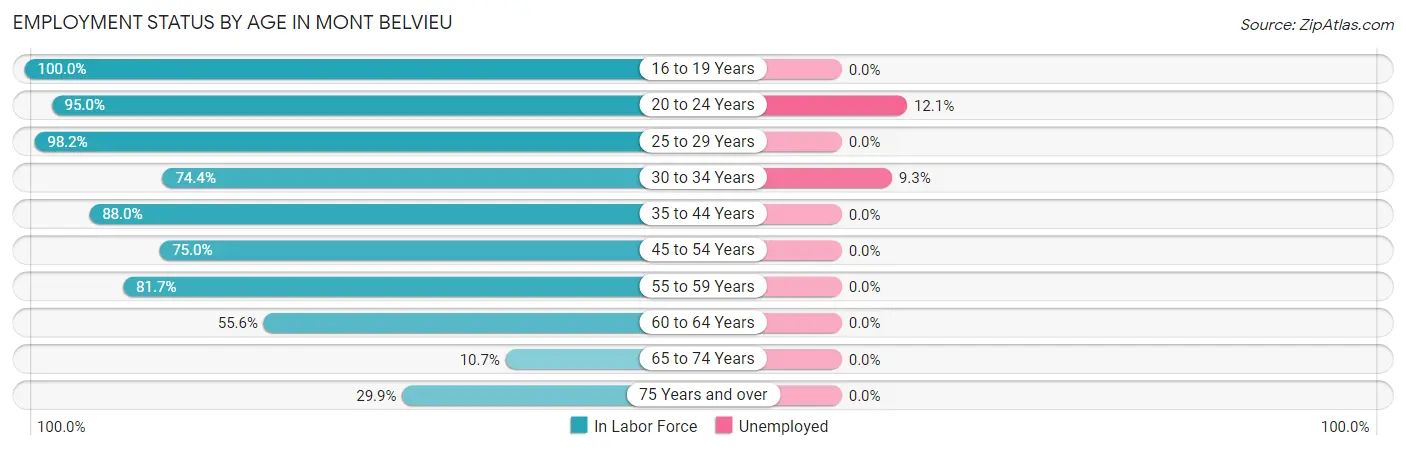
| Age Bracket | In Labor Force | Unemployed |
| 16 to 19 Years | 152 (100.0%) | 0 (0.0%) |
| 20 to 24 Years | 381 (95.0%) | 46 (12.1%) |
| 25 to 29 Years | 539 (98.2%) | 0 (0.0%) |
| 30 to 34 Years | 377 (74.4%) | 35 (9.3%) |
| 35 to 44 Years | 1,252 (88.0%) | 0 (0.0%) |
| 45 to 54 Years | 626 (75.0%) | 0 (0.0%) |
| 55 to 59 Years | 228 (81.7%) | 0 (0.0%) |
| 60 to 64 Years | 365 (55.6%) | 0 (0.0%) |
| 65 to 74 Years | 70 (10.7%) | 0 (0.0%) |
| 75 Years and over | 53 (29.9%) | 0 (0.0%) |
| Total | 4,044 (71.8%) | 81 (2.0%) |
Employment Status by Educational Attainment in Mont Belvieu
According to labor force statistics for Mont Belvieu, 79.7% of individuals (3,386) out of the total population between 25 and 64 years of age (4,249) are in the labor force, with 1.0% or 34 of them being unemployed. The group with the highest labor force participation rate are those with the educational attainment of bachelor's degree or higher, with 93.9% or 1,368 individuals in the labor force. Within the labor force, individuals with high school diploma education have the highest percentage of unemployment, with 8.4% or 20 of them being unemployed.
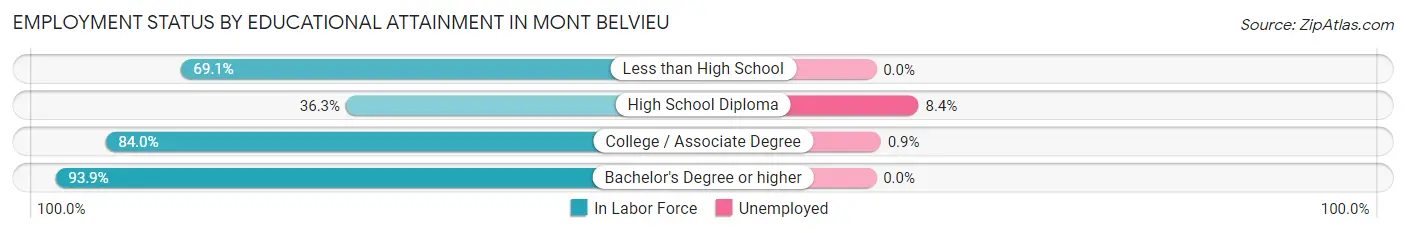
| Educational Attainment | In Labor Force | Unemployed |
| Less than High School | 67 (69.1%) | 0 (0.0%) |
| High School Diploma | 238 (36.3%) | 55 (8.4%) |
| College / Associate Degree | 1,714 (84.0%) | 18 (0.9%) |
| Bachelor's Degree or higher | 1,368 (93.9%) | 0 (0.0%) |
| Total | 3,386 (79.7%) | 42 (1.0%) |
Employment Occupations by Sex in Mont Belvieu
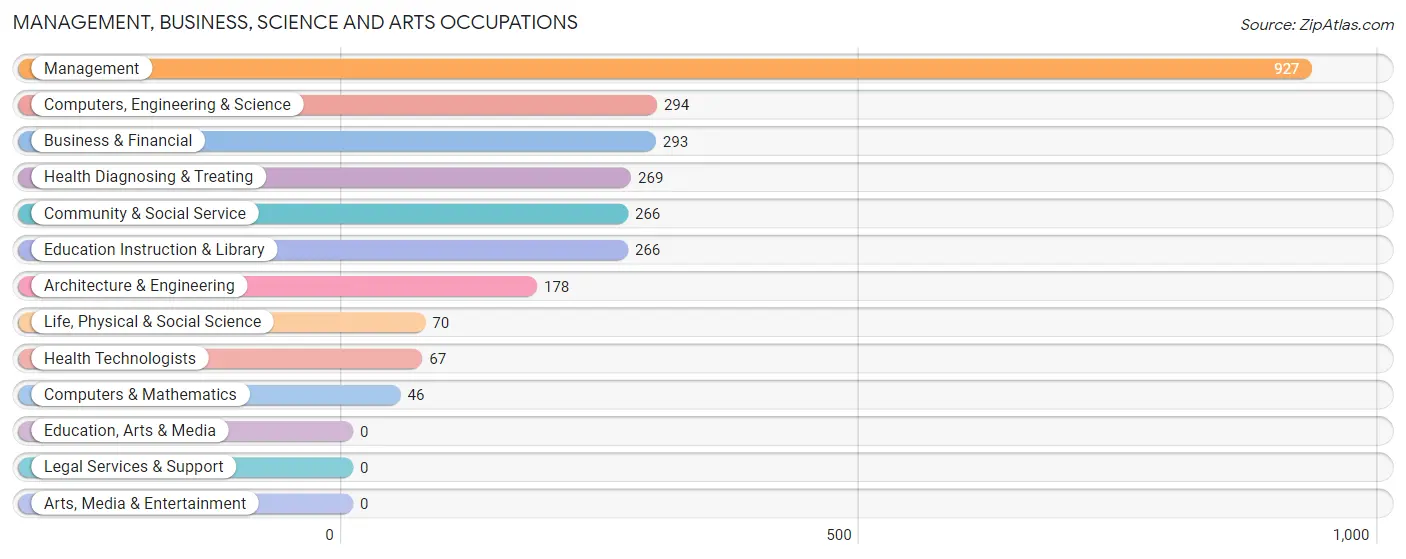
Management, Business, Science and Arts Occupations
The most common Management, Business, Science and Arts occupations in Mont Belvieu are Management (927 | 23.7%), Computers, Engineering & Science (294 | 7.5%), Business & Financial (293 | 7.5%), Health Diagnosing & Treating (269 | 6.9%), and Community & Social Service (266 | 6.8%).
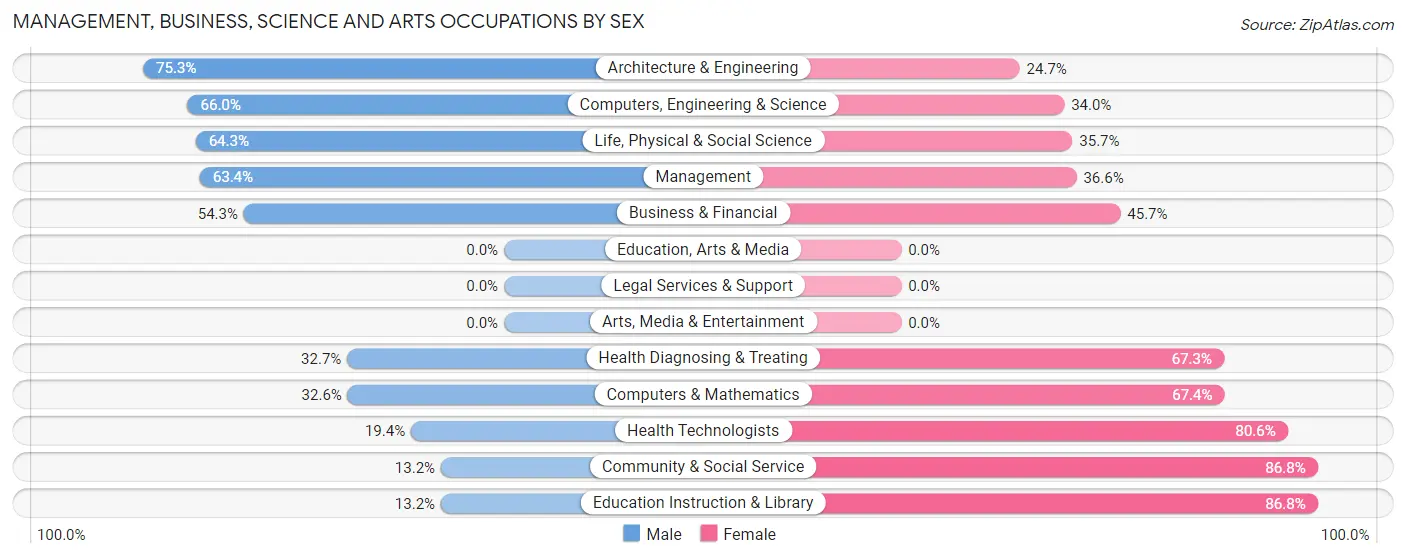
Management, Business, Science and Arts Occupations by Sex
Within the Management, Business, Science and Arts occupations in Mont Belvieu, the most male-oriented occupations are Architecture & Engineering (75.3%), Computers, Engineering & Science (66.0%), and Life, Physical & Social Science (64.3%), while the most female-oriented occupations are Community & Social Service (86.8%), Education Instruction & Library (86.8%), and Health Technologists (80.6%).
| Occupation | Male | Female |
| Management | 588 (63.4%) | 339 (36.6%) |
| Business & Financial | 159 (54.3%) | 134 (45.7%) |
| Computers, Engineering & Science | 194 (66.0%) | 100 (34.0%) |
| Computers & Mathematics | 15 (32.6%) | 31 (67.4%) |
| Architecture & Engineering | 134 (75.3%) | 44 (24.7%) |
| Life, Physical & Social Science | 45 (64.3%) | 25 (35.7%) |
| Community & Social Service | 35 (13.2%) | 231 (86.8%) |
| Education, Arts & Media | 0 (0.0%) | 0 (0.0%) |
| Legal Services & Support | 0 (0.0%) | 0 (0.0%) |
| Education Instruction & Library | 35 (13.2%) | 231 (86.8%) |
| Arts, Media & Entertainment | 0 (0.0%) | 0 (0.0%) |
| Health Diagnosing & Treating | 88 (32.7%) | 181 (67.3%) |
| Health Technologists | 13 (19.4%) | 54 (80.6%) |
| Total (Category) | 1,064 (51.9%) | 985 (48.1%) |
| Total (Overall) | 2,128 (54.4%) | 1,781 (45.6%) |
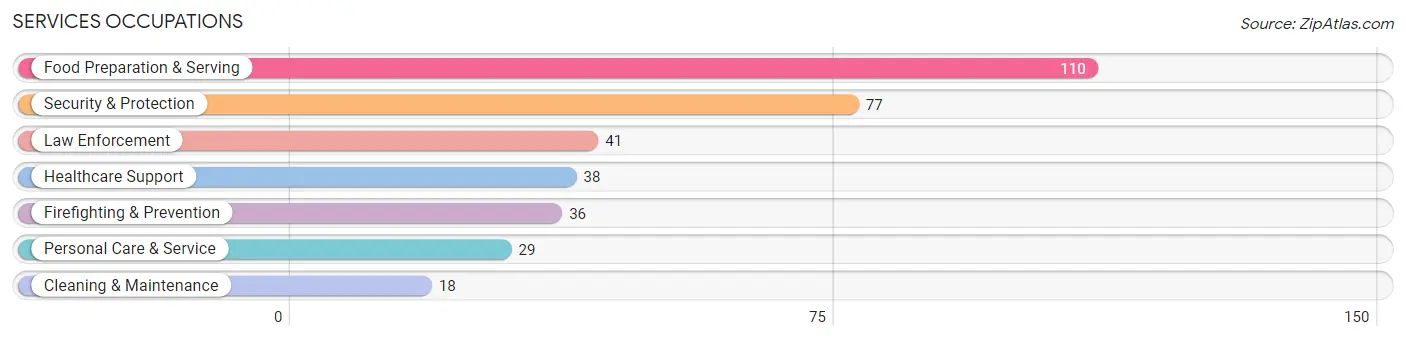
Services Occupations
The most common Services occupations in Mont Belvieu are Food Preparation & Serving (110 | 2.8%), Security & Protection (77 | 2.0%), Law Enforcement (41 | 1.1%), Healthcare Support (38 | 1.0%), and Firefighting & Prevention (36 | 0.9%).
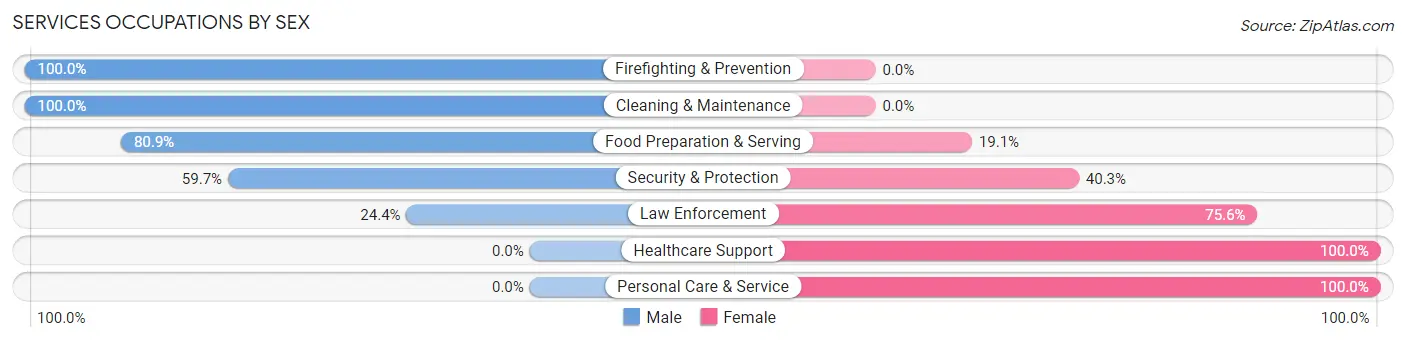
Services Occupations by Sex
Within the Services occupations in Mont Belvieu, the most male-oriented occupations are Firefighting & Prevention (100.0%), Cleaning & Maintenance (100.0%), and Food Preparation & Serving (80.9%), while the most female-oriented occupations are Healthcare Support (100.0%), Personal Care & Service (100.0%), and Law Enforcement (75.6%).
| Occupation | Male | Female |
| Healthcare Support | 0 (0.0%) | 38 (100.0%) |
| Security & Protection | 46 (59.7%) | 31 (40.3%) |
| Firefighting & Prevention | 36 (100.0%) | 0 (0.0%) |
| Law Enforcement | 10 (24.4%) | 31 (75.6%) |
| Food Preparation & Serving | 89 (80.9%) | 21 (19.1%) |
| Cleaning & Maintenance | 18 (100.0%) | 0 (0.0%) |
| Personal Care & Service | 0 (0.0%) | 29 (100.0%) |
| Total (Category) | 153 (56.2%) | 119 (43.8%) |
| Total (Overall) | 2,128 (54.4%) | 1,781 (45.6%) |
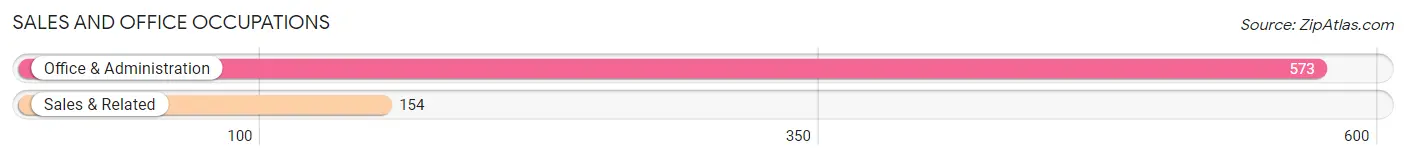
Sales and Office Occupations
The most common Sales and Office occupations in Mont Belvieu are Office & Administration (573 | 14.7%), and Sales & Related (154 | 3.9%).
Sales and Office Occupations by Sex
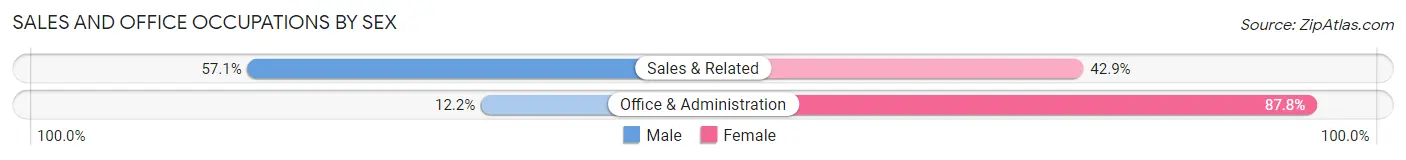
| Occupation | Male | Female |
| Sales & Related | 88 (57.1%) | 66 (42.9%) |
| Office & Administration | 70 (12.2%) | 503 (87.8%) |
| Total (Category) | 158 (21.7%) | 569 (78.3%) |
| Total (Overall) | 2,128 (54.4%) | 1,781 (45.6%) |
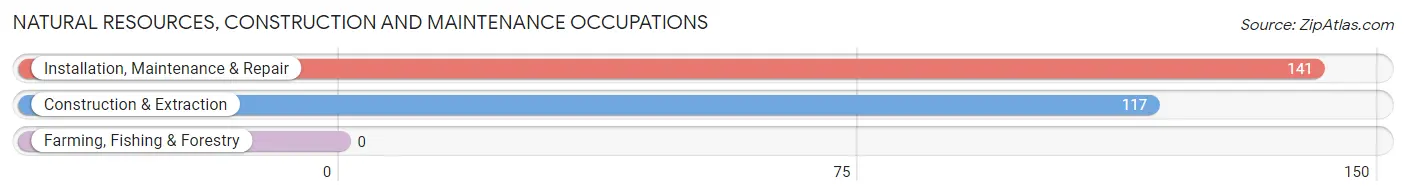
Natural Resources, Construction and Maintenance Occupations
The most common Natural Resources, Construction and Maintenance occupations in Mont Belvieu are Installation, Maintenance & Repair (141 | 3.6%), and Construction & Extraction (117 | 3.0%).
Natural Resources, Construction and Maintenance Occupations by Sex
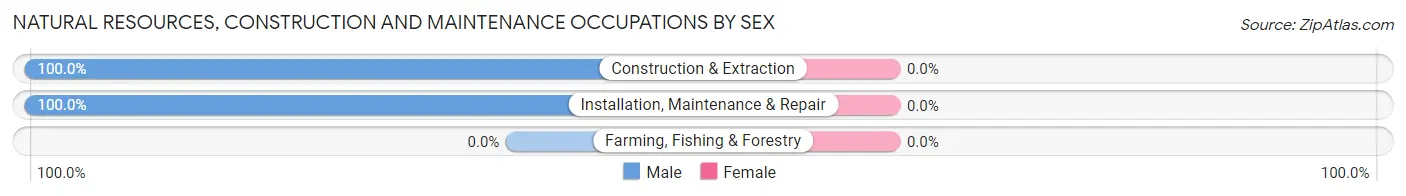
| Occupation | Male | Female |
| Farming, Fishing & Forestry | 0 (0.0%) | 0 (0.0%) |
| Construction & Extraction | 117 (100.0%) | 0 (0.0%) |
| Installation, Maintenance & Repair | 141 (100.0%) | 0 (0.0%) |
| Total (Category) | 258 (100.0%) | 0 (0.0%) |
| Total (Overall) | 2,128 (54.4%) | 1,781 (45.6%) |
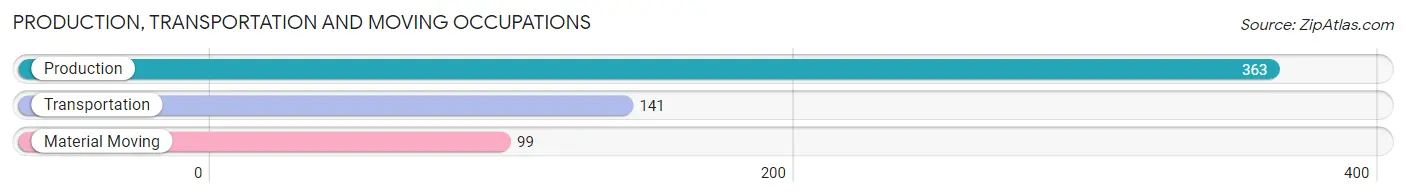
Production, Transportation and Moving Occupations
The most common Production, Transportation and Moving occupations in Mont Belvieu are Production (363 | 9.3%), Transportation (141 | 3.6%), and Material Moving (99 | 2.5%).
Production, Transportation and Moving Occupations by Sex
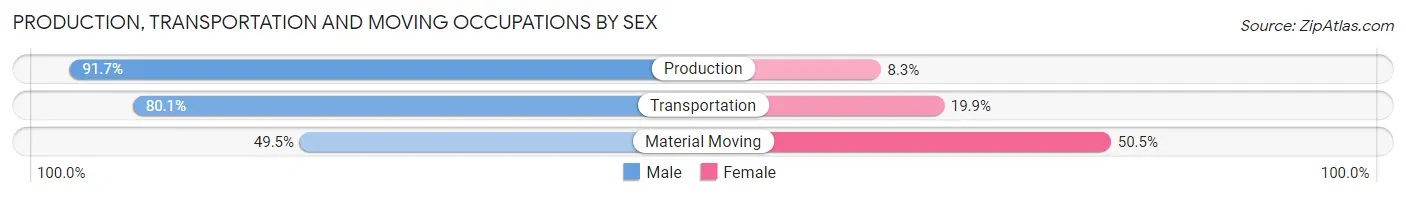
| Occupation | Male | Female |
| Production | 333 (91.7%) | 30 (8.3%) |
| Transportation | 113 (80.1%) | 28 (19.9%) |
| Material Moving | 49 (49.5%) | 50 (50.5%) |
| Total (Category) | 495 (82.1%) | 108 (17.9%) |
| Total (Overall) | 2,128 (54.4%) | 1,781 (45.6%) |
Employment Industries by Sex in Mont Belvieu
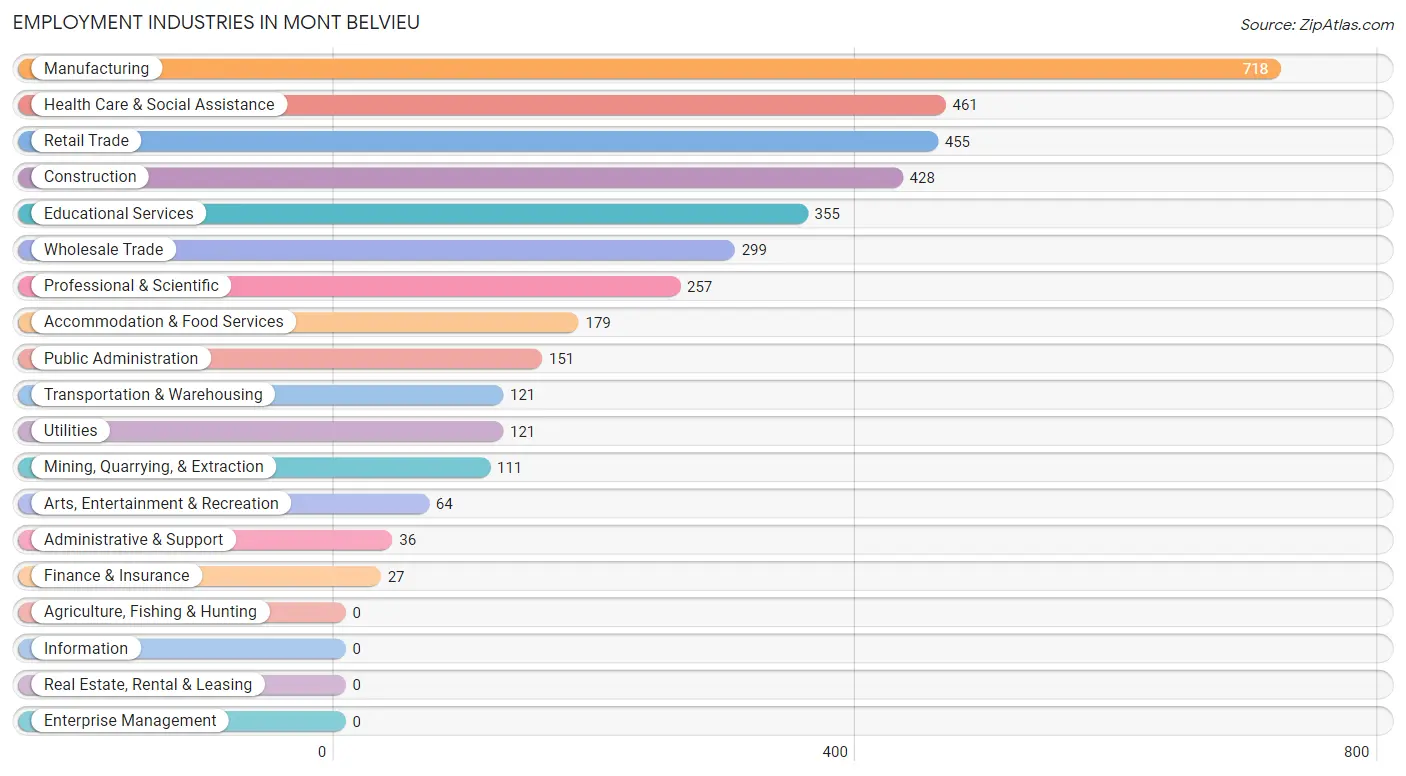
Employment Industries in Mont Belvieu
The major employment industries in Mont Belvieu include Manufacturing (718 | 18.4%), Health Care & Social Assistance (461 | 11.8%), Retail Trade (455 | 11.6%), Construction (428 | 11.0%), and Educational Services (355 | 9.1%).
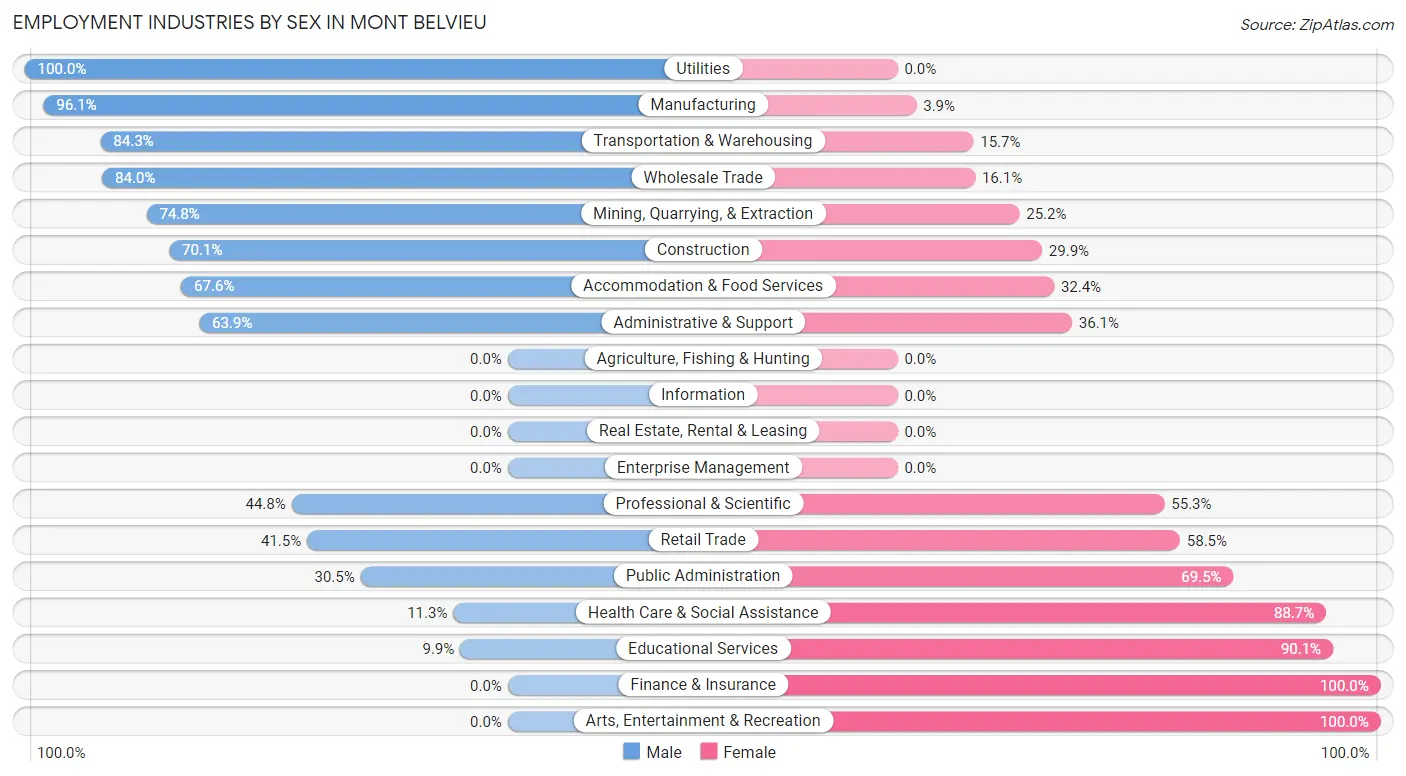
Employment Industries by Sex in Mont Belvieu
The Mont Belvieu industries that see more men than women are Utilities (100.0%), Manufacturing (96.1%), and Transportation & Warehousing (84.3%), whereas the industries that tend to have a higher number of women are Finance & Insurance (100.0%), Arts, Entertainment & Recreation (100.0%), and Educational Services (90.1%).
| Industry | Male | Female |
| Agriculture, Fishing & Hunting | 0 (0.0%) | 0 (0.0%) |
| Mining, Quarrying, & Extraction | 83 (74.8%) | 28 (25.2%) |
| Construction | 300 (70.1%) | 128 (29.9%) |
| Manufacturing | 690 (96.1%) | 28 (3.9%) |
| Wholesale Trade | 251 (84.0%) | 48 (16.1%) |
| Retail Trade | 189 (41.5%) | 266 (58.5%) |
| Transportation & Warehousing | 102 (84.3%) | 19 (15.7%) |
| Utilities | 121 (100.0%) | 0 (0.0%) |
| Information | 0 (0.0%) | 0 (0.0%) |
| Finance & Insurance | 0 (0.0%) | 27 (100.0%) |
| Real Estate, Rental & Leasing | 0 (0.0%) | 0 (0.0%) |
| Professional & Scientific | 115 (44.8%) | 142 (55.2%) |
| Enterprise Management | 0 (0.0%) | 0 (0.0%) |
| Administrative & Support | 23 (63.9%) | 13 (36.1%) |
| Educational Services | 35 (9.9%) | 320 (90.1%) |
| Health Care & Social Assistance | 52 (11.3%) | 409 (88.7%) |
| Arts, Entertainment & Recreation | 0 (0.0%) | 64 (100.0%) |
| Accommodation & Food Services | 121 (67.6%) | 58 (32.4%) |
| Public Administration | 46 (30.5%) | 105 (69.5%) |
| Total | 2,128 (54.4%) | 1,781 (45.6%) |
Education in Mont Belvieu
School Enrollment in Mont Belvieu
The most common levels of schooling among the 1,993 students in Mont Belvieu are elementary school (871 | 43.7%), middle school (321 | 16.1%), and college / undergraduate (279 | 14.0%).
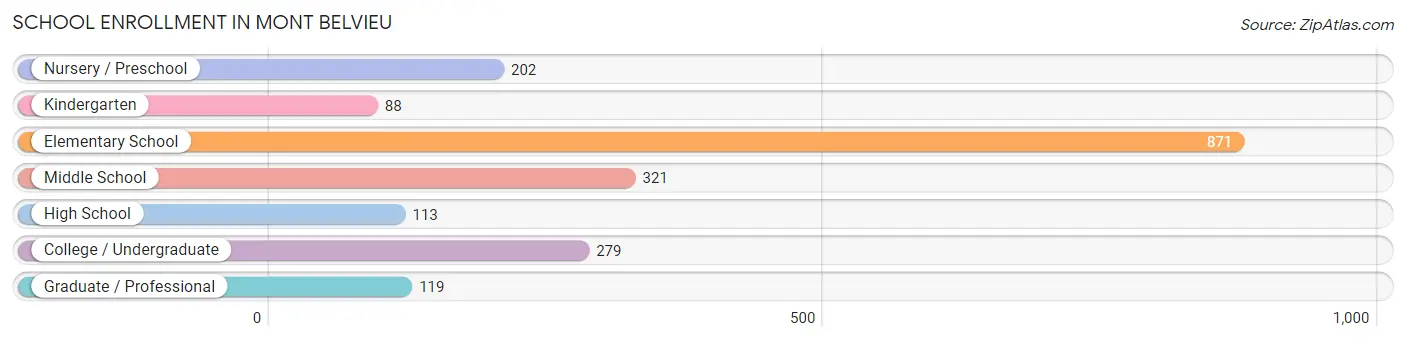
| School Level | # Students | % Students |
| Nursery / Preschool | 202 | 10.1% |
| Kindergarten | 88 | 4.4% |
| Elementary School | 871 | 43.7% |
| Middle School | 321 | 16.1% |
| High School | 113 | 5.7% |
| College / Undergraduate | 279 | 14.0% |
| Graduate / Professional | 119 | 6.0% |
| Total | 1,993 | 100.0% |
School Enrollment by Age by Funding Source in Mont Belvieu
Out of a total of 1,993 students who are enrolled in schools in Mont Belvieu, 98 (4.9%) attend a private institution, while the remaining 1,895 (95.1%) are enrolled in public schools. The age group of 3 to 4 year olds has the highest likelihood of being enrolled in private schools, with 98 (45.0% in the age bracket) enrolled. Conversely, the age group of 5 to 9 year old has the lowest likelihood of being enrolled in a private school, with 793 (100.0% in the age bracket) attending a public institution.
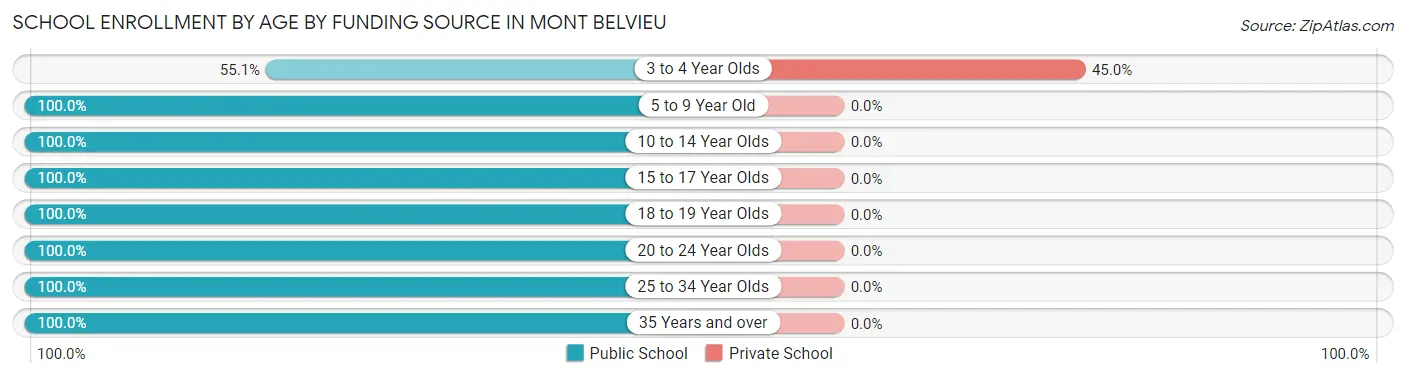
| Age Bracket | Public School | Private School |
| 3 to 4 Year Olds | 120 (55.0%) | 98 (45.0%) |
| 5 to 9 Year Old | 793 (100.0%) | 0 (0.0%) |
| 10 to 14 Year Olds | 521 (100.0%) | 0 (0.0%) |
| 15 to 17 Year Olds | 63 (100.0%) | 0 (0.0%) |
| 18 to 19 Year Olds | 134 (100.0%) | 0 (0.0%) |
| 20 to 24 Year Olds | 106 (100.0%) | 0 (0.0%) |
| 25 to 34 Year Olds | 55 (100.0%) | 0 (0.0%) |
| 35 Years and over | 103 (100.0%) | 0 (0.0%) |
| Total | 1,895 (95.1%) | 98 (4.9%) |
Educational Attainment by Field of Study in Mont Belvieu
Business (858 | 45.1%), engineering (252 | 13.2%), education (214 | 11.3%), science & technology (123 | 6.5%), and bio, nature & agricultural (120 | 6.3%) are the most common fields of study among 1,903 individuals in Mont Belvieu who have obtained a bachelor's degree or higher.
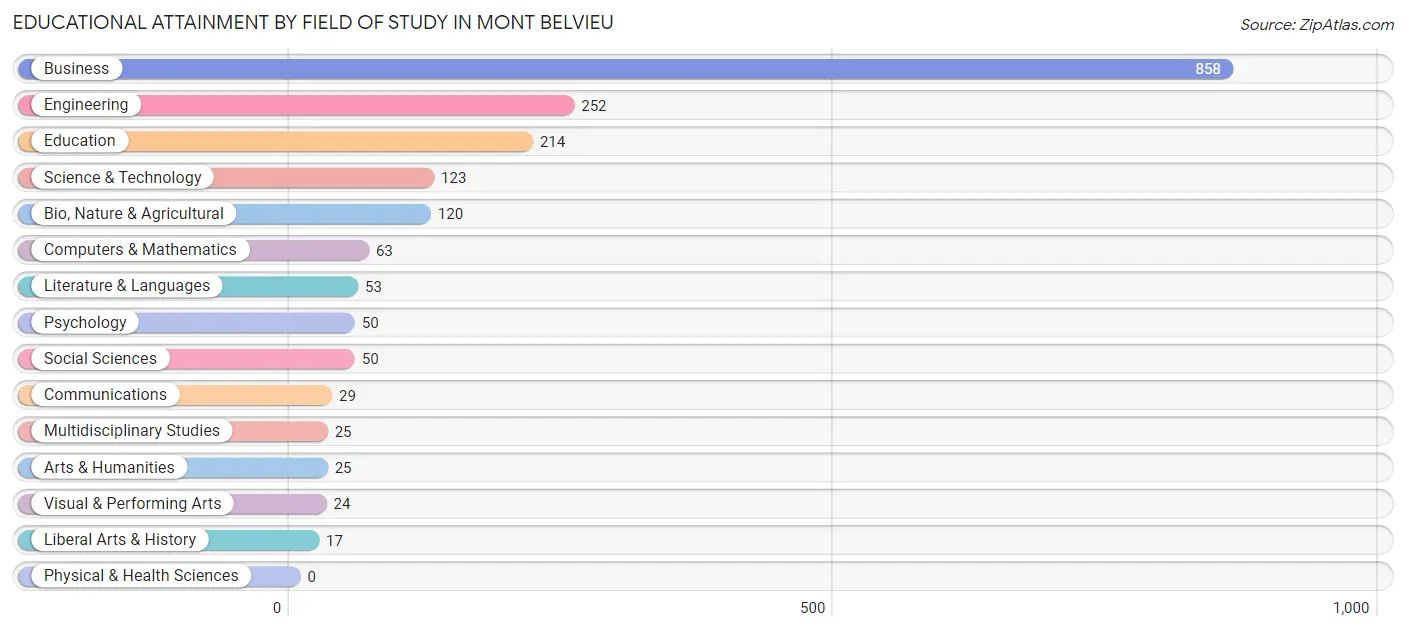
| Field of Study | # Graduates | % Graduates |
| Computers & Mathematics | 63 | 3.3% |
| Bio, Nature & Agricultural | 120 | 6.3% |
| Physical & Health Sciences | 0 | 0.0% |
| Psychology | 50 | 2.6% |
| Social Sciences | 50 | 2.6% |
| Engineering | 252 | 13.2% |
| Multidisciplinary Studies | 25 | 1.3% |
| Science & Technology | 123 | 6.5% |
| Business | 858 | 45.1% |
| Education | 214 | 11.3% |
| Literature & Languages | 53 | 2.8% |
| Liberal Arts & History | 17 | 0.9% |
| Visual & Performing Arts | 24 | 1.3% |
| Communications | 29 | 1.5% |
| Arts & Humanities | 25 | 1.3% |
| Total | 1,903 | 100.0% |
Transportation & Commute in Mont Belvieu
Vehicle Availability by Sex in Mont Belvieu
The most prevalent vehicle ownership categories in Mont Belvieu are males with 2 vehicles (953, accounting for 43.7%) and females with 2 vehicles (550, making up 53.5%).
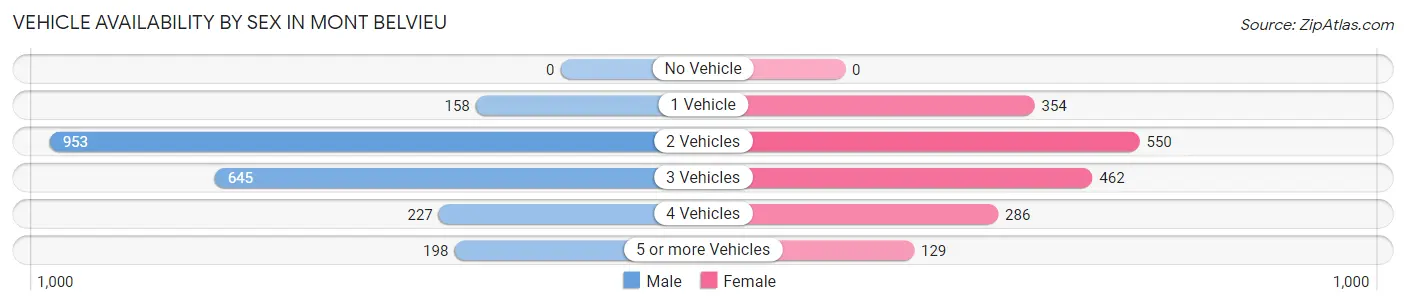
| Vehicles Available | Male | Female |
| No Vehicle | 0 (0.0%) | 0 (0.0%) |
| 1 Vehicle | 158 (7.2%) | 354 (19.9%) |
| 2 Vehicles | 953 (43.7%) | 550 (30.9%) |
| 3 Vehicles | 645 (29.6%) | 462 (25.9%) |
| 4 Vehicles | 227 (10.4%) | 286 (16.1%) |
| 5 or more Vehicles | 198 (9.1%) | 129 (7.2%) |
| Total | 2,181 (100.0%) | 1,781 (100.0%) |
Commute Time in Mont Belvieu
The most frequently occuring commute durations in Mont Belvieu are 15 to 19 minutes (584 commuters, 16.2%), 45 to 59 minutes (488 commuters, 13.6%), and 30 to 34 minutes (404 commuters, 11.2%).
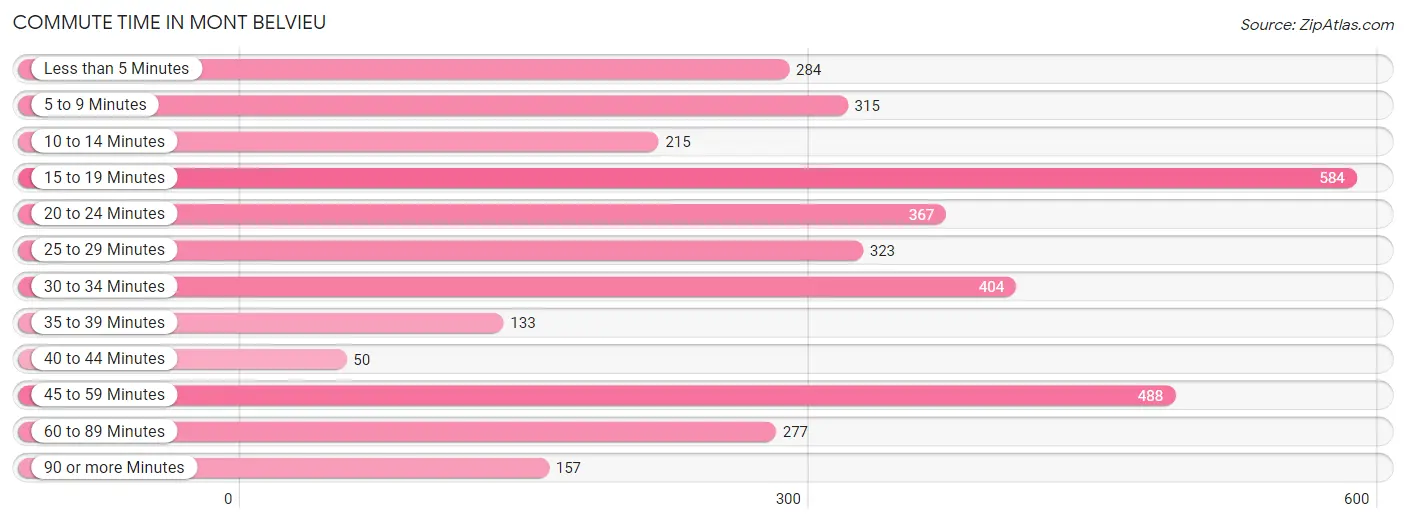
| Commute Time | # Commuters | % Commuters |
| Less than 5 Minutes | 284 | 7.9% |
| 5 to 9 Minutes | 315 | 8.8% |
| 10 to 14 Minutes | 215 | 6.0% |
| 15 to 19 Minutes | 584 | 16.2% |
| 20 to 24 Minutes | 367 | 10.2% |
| 25 to 29 Minutes | 323 | 9.0% |
| 30 to 34 Minutes | 404 | 11.2% |
| 35 to 39 Minutes | 133 | 3.7% |
| 40 to 44 Minutes | 50 | 1.4% |
| 45 to 59 Minutes | 488 | 13.6% |
| 60 to 89 Minutes | 277 | 7.7% |
| 90 or more Minutes | 157 | 4.4% |
Commute Time by Sex in Mont Belvieu
The most common commute times in Mont Belvieu are 15 to 19 minutes (427 commuters, 21.1%) for males and less than 5 minutes (268 commuters, 17.0%) for females.
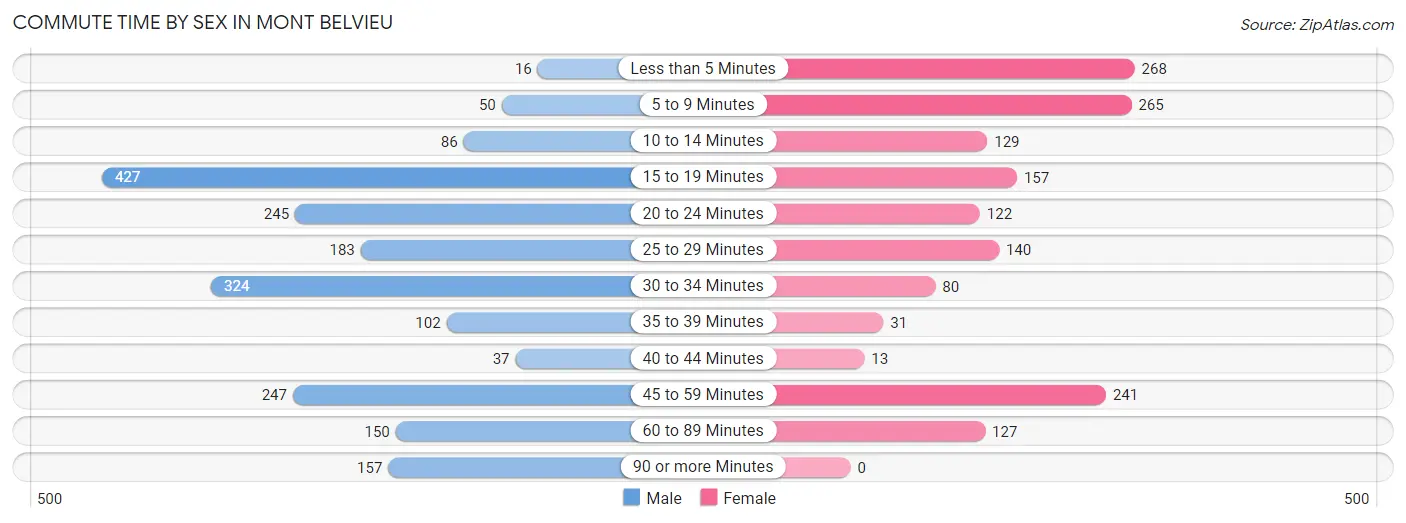
| Commute Time | Male | Female |
| Less than 5 Minutes | 16 (0.8%) | 268 (17.0%) |
| 5 to 9 Minutes | 50 (2.5%) | 265 (16.9%) |
| 10 to 14 Minutes | 86 (4.3%) | 129 (8.2%) |
| 15 to 19 Minutes | 427 (21.1%) | 157 (10.0%) |
| 20 to 24 Minutes | 245 (12.1%) | 122 (7.8%) |
| 25 to 29 Minutes | 183 (9.0%) | 140 (8.9%) |
| 30 to 34 Minutes | 324 (16.0%) | 80 (5.1%) |
| 35 to 39 Minutes | 102 (5.0%) | 31 (2.0%) |
| 40 to 44 Minutes | 37 (1.8%) | 13 (0.8%) |
| 45 to 59 Minutes | 247 (12.2%) | 241 (15.3%) |
| 60 to 89 Minutes | 150 (7.4%) | 127 (8.1%) |
| 90 or more Minutes | 157 (7.8%) | 0 (0.0%) |
Time of Departure to Work by Sex in Mont Belvieu
The most frequent times of departure to work in Mont Belvieu are 12:00 AM to 4:59 AM (522, 25.8%) for males and 6:30 AM to 6:59 AM (256, 16.3%) for females.
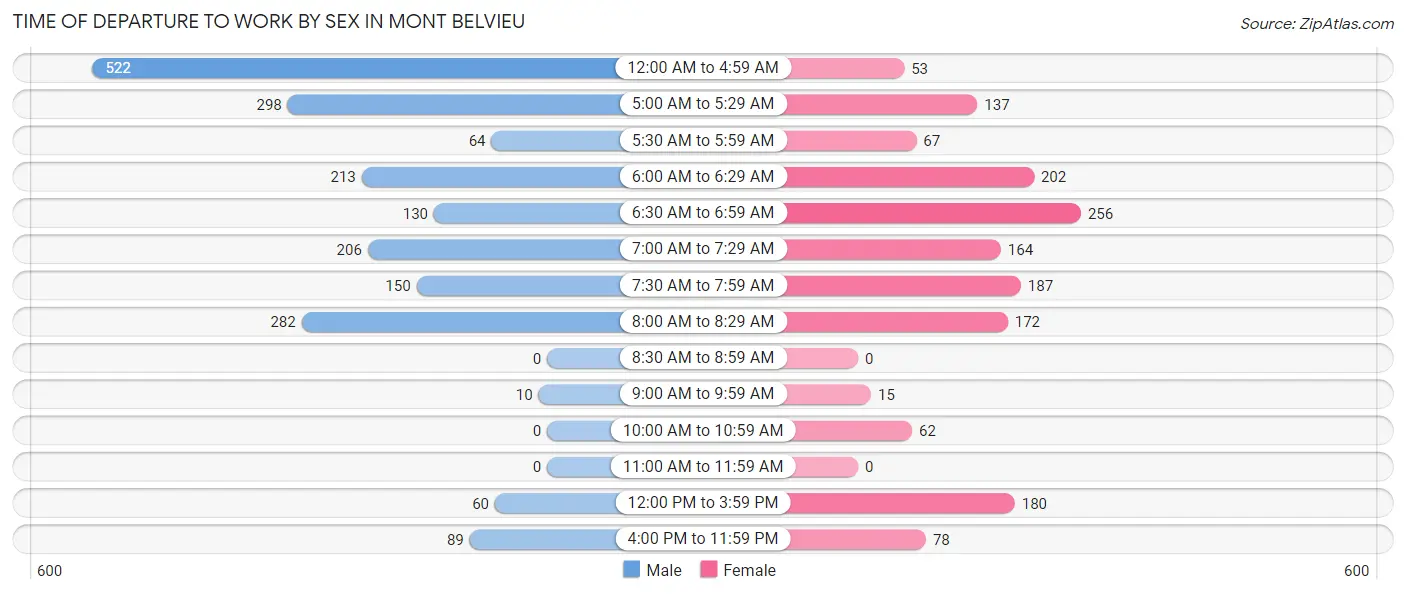
| Time of Departure | Male | Female |
| 12:00 AM to 4:59 AM | 522 (25.8%) | 53 (3.4%) |
| 5:00 AM to 5:29 AM | 298 (14.7%) | 137 (8.7%) |
| 5:30 AM to 5:59 AM | 64 (3.2%) | 67 (4.3%) |
| 6:00 AM to 6:29 AM | 213 (10.5%) | 202 (12.8%) |
| 6:30 AM to 6:59 AM | 130 (6.4%) | 256 (16.3%) |
| 7:00 AM to 7:29 AM | 206 (10.2%) | 164 (10.4%) |
| 7:30 AM to 7:59 AM | 150 (7.4%) | 187 (11.9%) |
| 8:00 AM to 8:29 AM | 282 (13.9%) | 172 (10.9%) |
| 8:30 AM to 8:59 AM | 0 (0.0%) | 0 (0.0%) |
| 9:00 AM to 9:59 AM | 10 (0.5%) | 15 (0.9%) |
| 10:00 AM to 10:59 AM | 0 (0.0%) | 62 (3.9%) |
| 11:00 AM to 11:59 AM | 0 (0.0%) | 0 (0.0%) |
| 12:00 PM to 3:59 PM | 60 (3.0%) | 180 (11.4%) |
| 4:00 PM to 11:59 PM | 89 (4.4%) | 78 (5.0%) |
| Total | 2,024 (100.0%) | 1,573 (100.0%) |
Housing Occupancy in Mont Belvieu
Occupancy by Ownership in Mont Belvieu
Of the total 2,844 dwellings in Mont Belvieu, owner-occupied units account for 2,387 (83.9%), while renter-occupied units make up 457 (16.1%).
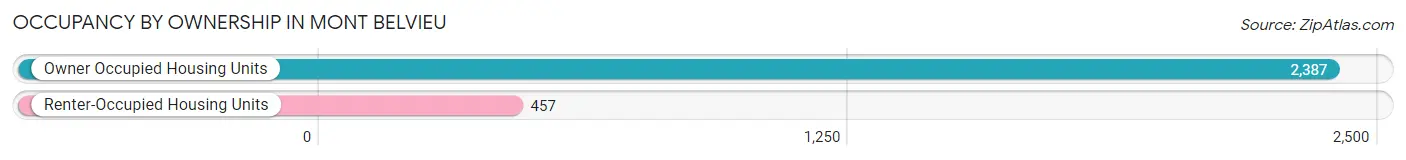
| Occupancy | # Housing Units | % Housing Units |
| Owner Occupied Housing Units | 2,387 | 83.9% |
| Renter-Occupied Housing Units | 457 | 16.1% |
| Total Occupied Housing Units | 2,844 | 100.0% |
Occupancy by Household Size in Mont Belvieu
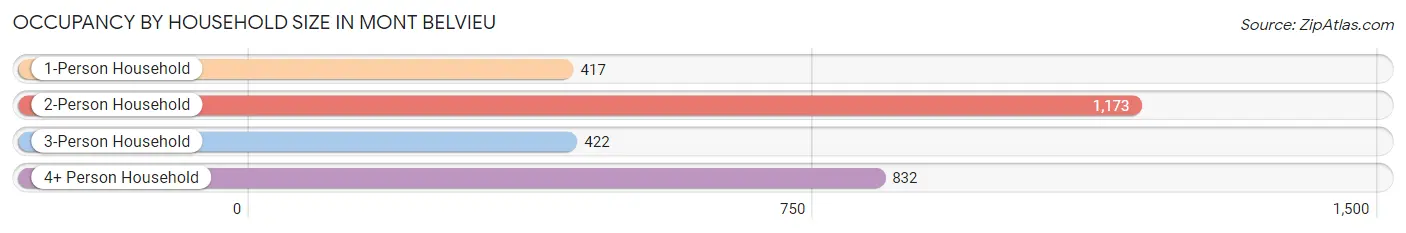
| Household Size | # Housing Units | % Housing Units |
| 1-Person Household | 417 | 14.7% |
| 2-Person Household | 1,173 | 41.2% |
| 3-Person Household | 422 | 14.8% |
| 4+ Person Household | 832 | 29.2% |
| Total Housing Units | 2,844 | 100.0% |
Occupancy by Ownership by Household Size in Mont Belvieu
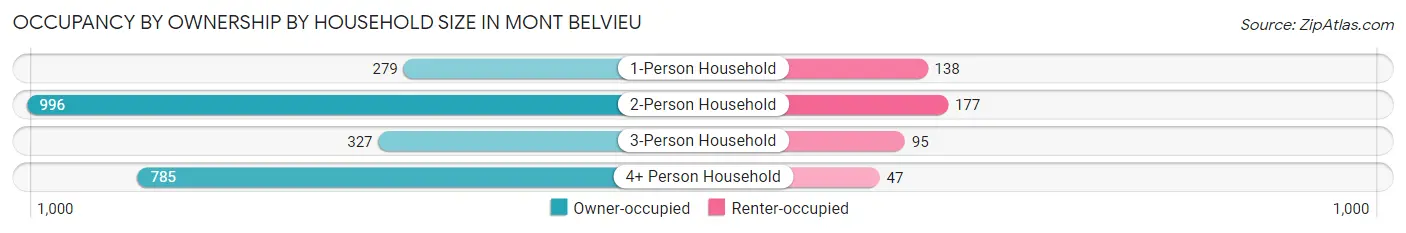
| Household Size | Owner-occupied | Renter-occupied |
| 1-Person Household | 279 (66.9%) | 138 (33.1%) |
| 2-Person Household | 996 (84.9%) | 177 (15.1%) |
| 3-Person Household | 327 (77.5%) | 95 (22.5%) |
| 4+ Person Household | 785 (94.4%) | 47 (5.7%) |
| Total Housing Units | 2,387 (83.9%) | 457 (16.1%) |
Occupancy by Educational Attainment in Mont Belvieu
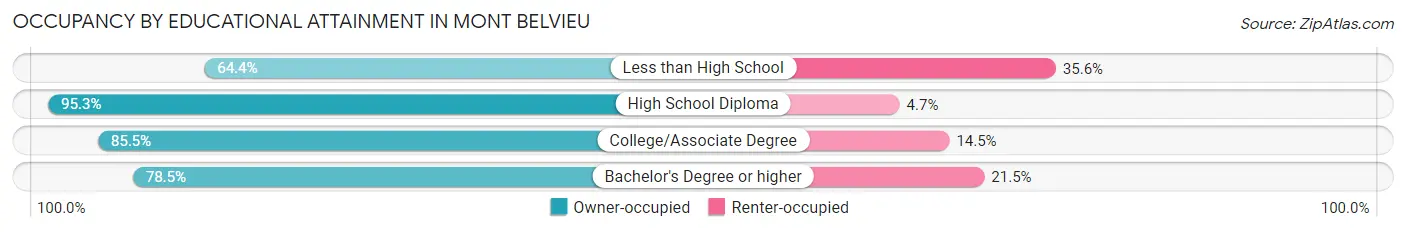
| Household Size | Owner-occupied | Renter-occupied |
| Less than High School | 56 (64.4%) | 31 (35.6%) |
| High School Diploma | 450 (95.3%) | 22 (4.7%) |
| College/Associate Degree | 1,065 (85.5%) | 181 (14.5%) |
| Bachelor's Degree or higher | 816 (78.5%) | 223 (21.5%) |
Occupancy by Age of Householder in Mont Belvieu
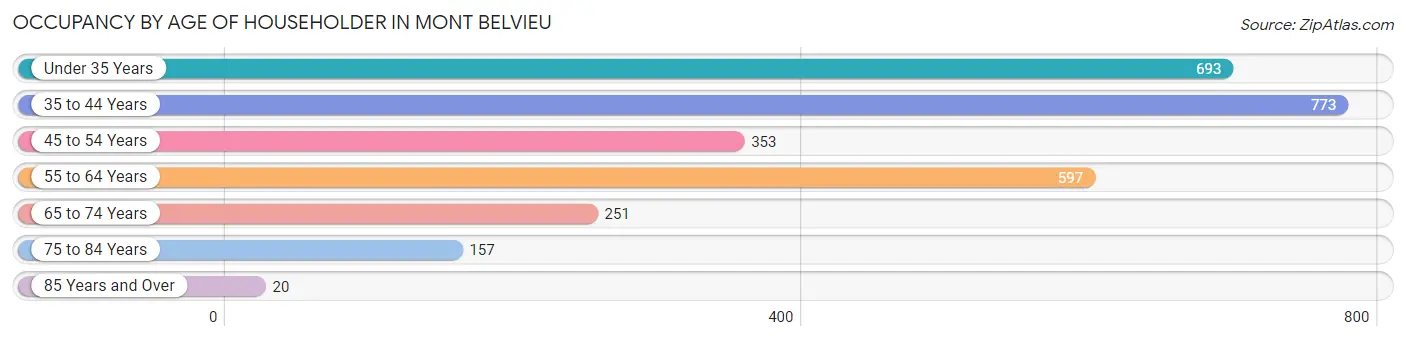
| Age Bracket | # Households | % Households |
| Under 35 Years | 693 | 24.4% |
| 35 to 44 Years | 773 | 27.2% |
| 45 to 54 Years | 353 | 12.4% |
| 55 to 64 Years | 597 | 21.0% |
| 65 to 74 Years | 251 | 8.8% |
| 75 to 84 Years | 157 | 5.5% |
| 85 Years and Over | 20 | 0.7% |
| Total | 2,844 | 100.0% |
Housing Finances in Mont Belvieu
Median Income by Occupancy in Mont Belvieu
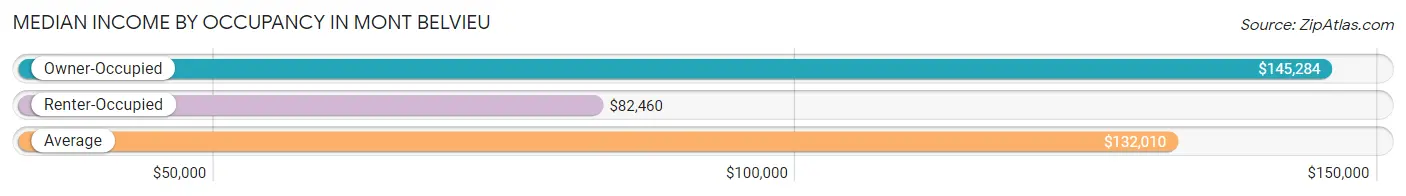
| Occupancy Type | # Households | Median Income |
| Owner-Occupied | 2,387 (83.9%) | $145,284 |
| Renter-Occupied | 457 (16.1%) | $82,460 |
| Average | 2,844 (100.0%) | $132,010 |
Occupancy by Householder Income Bracket in Mont Belvieu
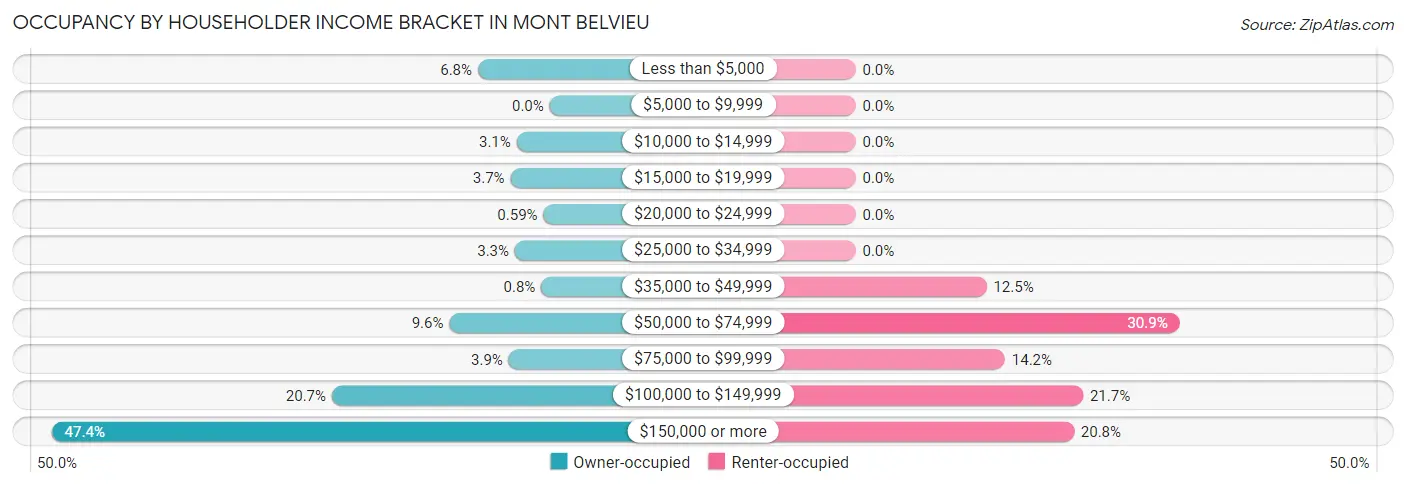
| Income Bracket | Owner-occupied | Renter-occupied |
| Less than $5,000 | 163 (6.8%) | 0 (0.0%) |
| $5,000 to $9,999 | 0 (0.0%) | 0 (0.0%) |
| $10,000 to $14,999 | 75 (3.1%) | 0 (0.0%) |
| $15,000 to $19,999 | 89 (3.7%) | 0 (0.0%) |
| $20,000 to $24,999 | 14 (0.6%) | 0 (0.0%) |
| $25,000 to $34,999 | 79 (3.3%) | 0 (0.0%) |
| $35,000 to $49,999 | 19 (0.8%) | 57 (12.5%) |
| $50,000 to $74,999 | 228 (9.6%) | 141 (30.8%) |
| $75,000 to $99,999 | 93 (3.9%) | 65 (14.2%) |
| $100,000 to $149,999 | 495 (20.7%) | 99 (21.7%) |
| $150,000 or more | 1,132 (47.4%) | 95 (20.8%) |
| Total | 2,387 (100.0%) | 457 (100.0%) |
Monthly Housing Cost Tiers in Mont Belvieu
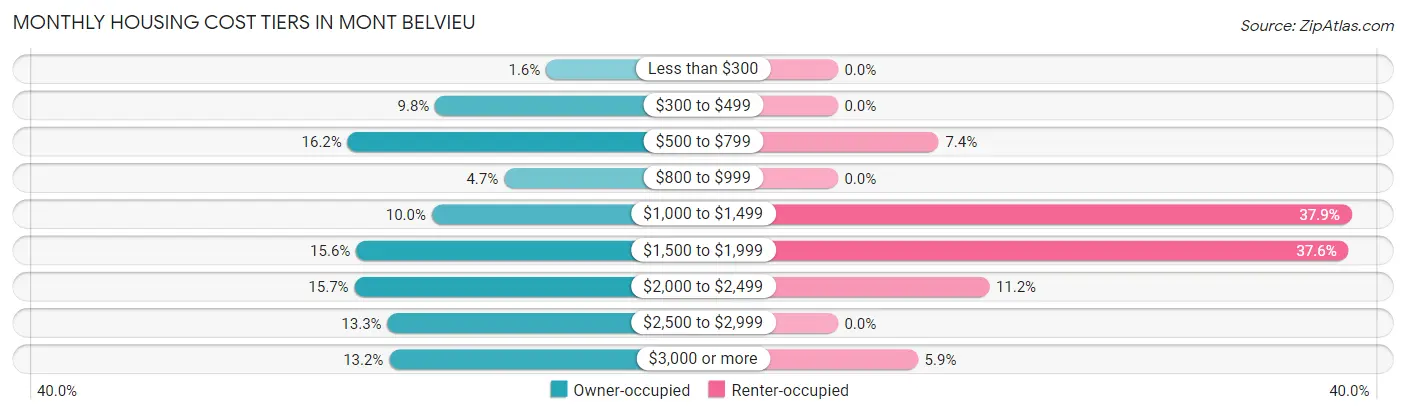
| Monthly Cost | Owner-occupied | Renter-occupied |
| Less than $300 | 38 (1.6%) | 0 (0.0%) |
| $300 to $499 | 233 (9.8%) | 0 (0.0%) |
| $500 to $799 | 387 (16.2%) | 34 (7.4%) |
| $800 to $999 | 112 (4.7%) | 0 (0.0%) |
| $1,000 to $1,499 | 239 (10.0%) | 173 (37.9%) |
| $1,500 to $1,999 | 372 (15.6%) | 172 (37.6%) |
| $2,000 to $2,499 | 375 (15.7%) | 51 (11.2%) |
| $2,500 to $2,999 | 317 (13.3%) | 0 (0.0%) |
| $3,000 or more | 314 (13.2%) | 27 (5.9%) |
| Total | 2,387 (100.0%) | 457 (100.0%) |
Physical Housing Characteristics in Mont Belvieu
Housing Structures in Mont Belvieu
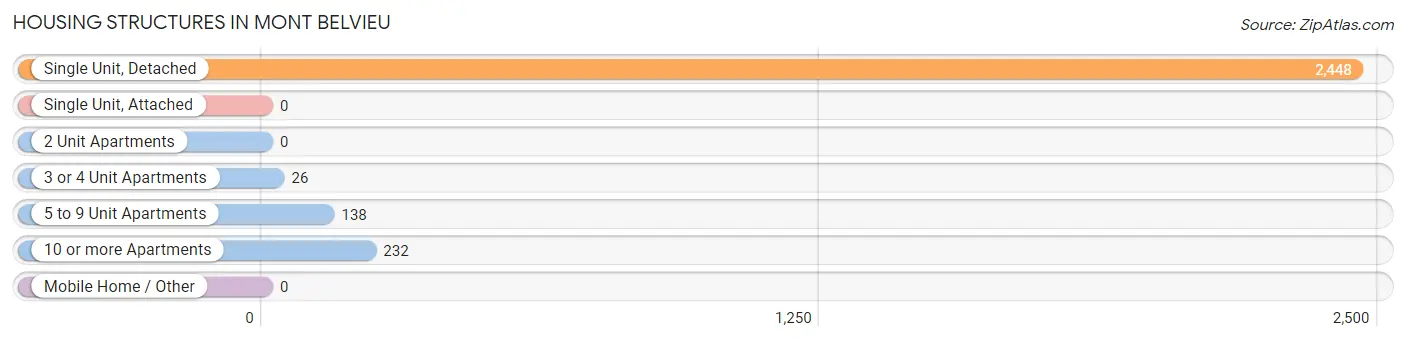
| Structure Type | # Housing Units | % Housing Units |
| Single Unit, Detached | 2,448 | 86.1% |
| Single Unit, Attached | 0 | 0.0% |
| 2 Unit Apartments | 0 | 0.0% |
| 3 or 4 Unit Apartments | 26 | 0.9% |
| 5 to 9 Unit Apartments | 138 | 4.9% |
| 10 or more Apartments | 232 | 8.2% |
| Mobile Home / Other | 0 | 0.0% |
| Total | 2,844 | 100.0% |
Housing Structures by Occupancy in Mont Belvieu
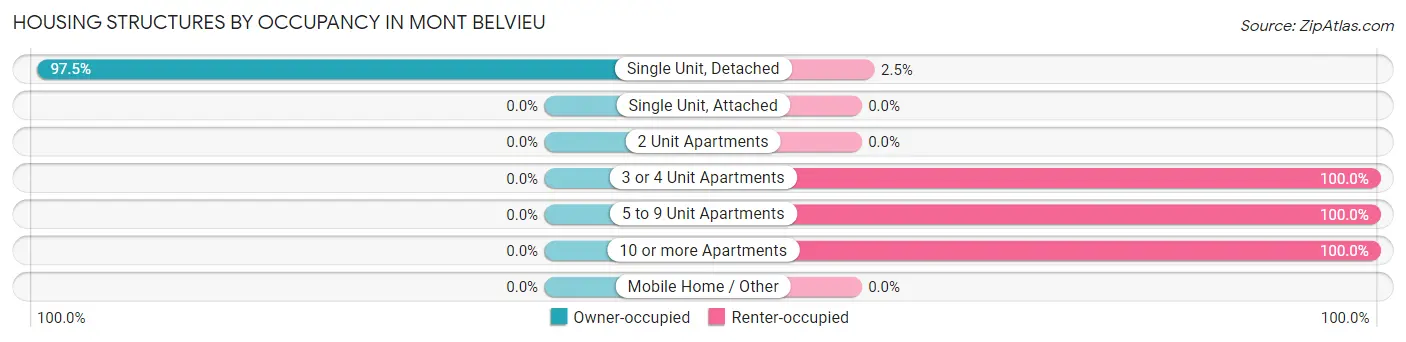
| Structure Type | Owner-occupied | Renter-occupied |
| Single Unit, Detached | 2,387 (97.5%) | 61 (2.5%) |
| Single Unit, Attached | 0 (0.0%) | 0 (0.0%) |
| 2 Unit Apartments | 0 (0.0%) | 0 (0.0%) |
| 3 or 4 Unit Apartments | 0 (0.0%) | 26 (100.0%) |
| 5 to 9 Unit Apartments | 0 (0.0%) | 138 (100.0%) |
| 10 or more Apartments | 0 (0.0%) | 232 (100.0%) |
| Mobile Home / Other | 0 (0.0%) | 0 (0.0%) |
| Total | 2,387 (83.9%) | 457 (16.1%) |
Housing Structures by Number of Rooms in Mont Belvieu
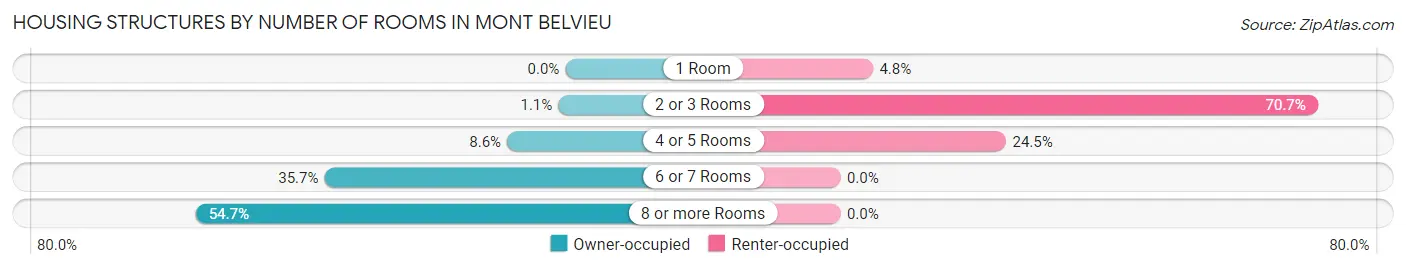
| Number of Rooms | Owner-occupied | Renter-occupied |
| 1 Room | 0 (0.0%) | 22 (4.8%) |
| 2 or 3 Rooms | 25 (1.1%) | 323 (70.7%) |
| 4 or 5 Rooms | 206 (8.6%) | 112 (24.5%) |
| 6 or 7 Rooms | 851 (35.6%) | 0 (0.0%) |
| 8 or more Rooms | 1,305 (54.7%) | 0 (0.0%) |
| Total | 2,387 (100.0%) | 457 (100.0%) |
Housing Structure by Heating Type in Mont Belvieu
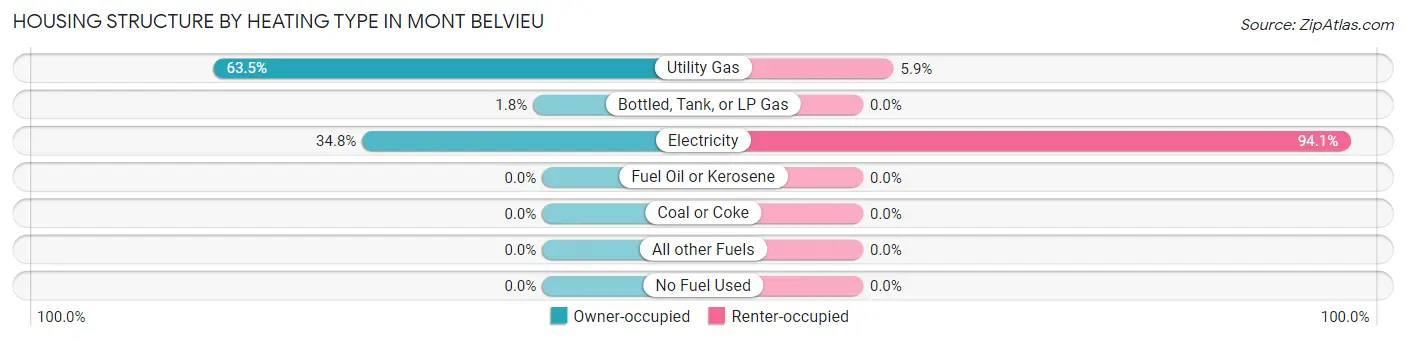
| Heating Type | Owner-occupied | Renter-occupied |
| Utility Gas | 1,515 (63.5%) | 27 (5.9%) |
| Bottled, Tank, or LP Gas | 42 (1.8%) | 0 (0.0%) |
| Electricity | 830 (34.8%) | 430 (94.1%) |
| Fuel Oil or Kerosene | 0 (0.0%) | 0 (0.0%) |
| Coal or Coke | 0 (0.0%) | 0 (0.0%) |
| All other Fuels | 0 (0.0%) | 0 (0.0%) |
| No Fuel Used | 0 (0.0%) | 0 (0.0%) |
| Total | 2,387 (100.0%) | 457 (100.0%) |
Household Vehicle Usage in Mont Belvieu
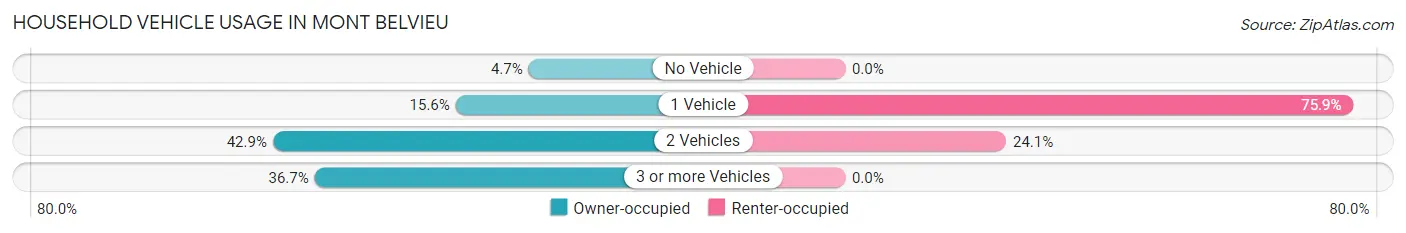
| Vehicles per Household | Owner-occupied | Renter-occupied |
| No Vehicle | 113 (4.7%) | 0 (0.0%) |
| 1 Vehicle | 373 (15.6%) | 347 (75.9%) |
| 2 Vehicles | 1,025 (42.9%) | 110 (24.1%) |
| 3 or more Vehicles | 876 (36.7%) | 0 (0.0%) |
| Total | 2,387 (100.0%) | 457 (100.0%) |
Real Estate & Mortgages in Mont Belvieu
Real Estate and Mortgage Overview in Mont Belvieu
| Characteristic | Without Mortgage | With Mortgage |
| Housing Units | 990 | 1,397 |
| Median Property Value | $312,300 | $414,600 |
| Median Household Income | $72,806 | $831 |
| Monthly Housing Costs | $655 | $314 |
| Real Estate Taxes | $2,835 | $28 |
Property Value by Mortgage Status in Mont Belvieu
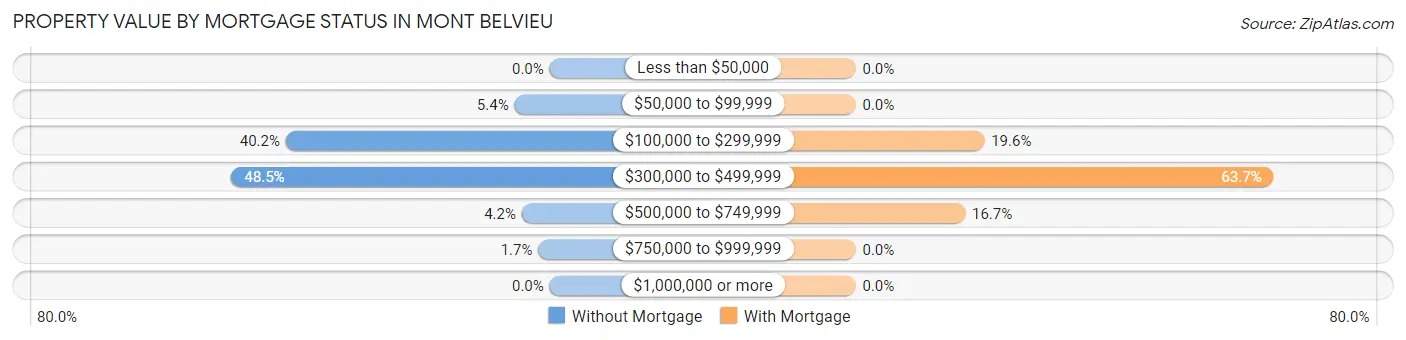
| Property Value | Without Mortgage | With Mortgage |
| Less than $50,000 | 0 (0.0%) | 0 (0.0%) |
| $50,000 to $99,999 | 53 (5.3%) | 0 (0.0%) |
| $100,000 to $299,999 | 398 (40.2%) | 274 (19.6%) |
| $300,000 to $499,999 | 480 (48.5%) | 890 (63.7%) |
| $500,000 to $749,999 | 42 (4.2%) | 233 (16.7%) |
| $750,000 to $999,999 | 17 (1.7%) | 0 (0.0%) |
| $1,000,000 or more | 0 (0.0%) | 0 (0.0%) |
| Total | 990 (100.0%) | 1,397 (100.0%) |
Household Income by Mortgage Status in Mont Belvieu
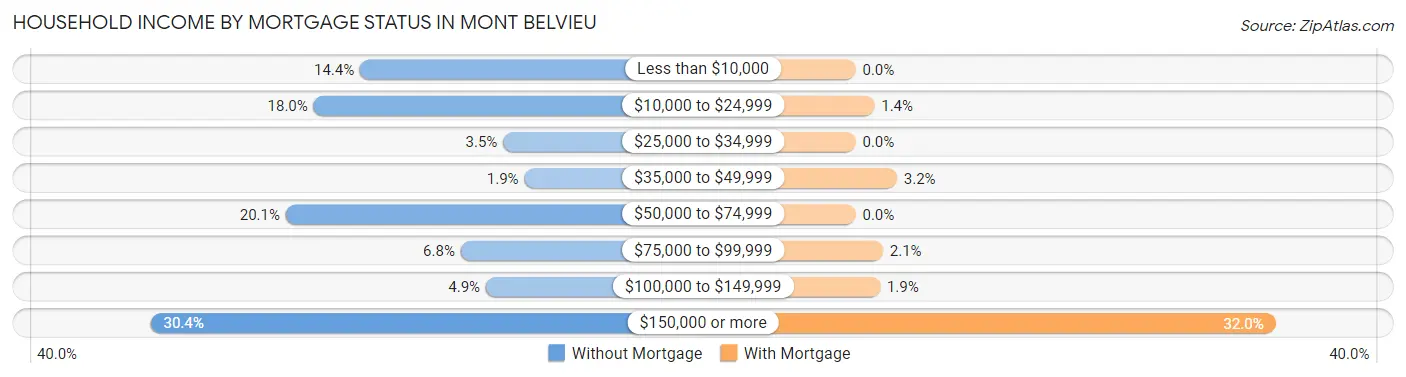
| Household Income | Without Mortgage | With Mortgage |
| Less than $10,000 | 143 (14.4%) | 0 (0.0%) |
| $10,000 to $24,999 | 178 (18.0%) | 20 (1.4%) |
| $25,000 to $34,999 | 35 (3.5%) | 0 (0.0%) |
| $35,000 to $49,999 | 19 (1.9%) | 44 (3.2%) |
| $50,000 to $74,999 | 199 (20.1%) | 0 (0.0%) |
| $75,000 to $99,999 | 67 (6.8%) | 29 (2.1%) |
| $100,000 to $149,999 | 48 (4.9%) | 26 (1.9%) |
| $150,000 or more | 301 (30.4%) | 447 (32.0%) |
| Total | 990 (100.0%) | 1,397 (100.0%) |
Property Value to Household Income Ratio in Mont Belvieu
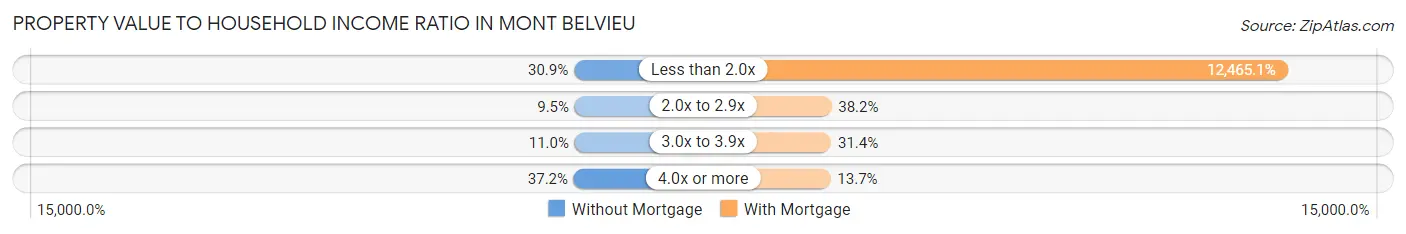
| Value-to-Income Ratio | Without Mortgage | With Mortgage |
| Less than 2.0x | 306 (30.9%) | 174,137 (12,465.1%) |
| 2.0x to 2.9x | 94 (9.5%) | 533 (38.2%) |
| 3.0x to 3.9x | 109 (11.0%) | 439 (31.4%) |
| 4.0x or more | 368 (37.2%) | 191 (13.7%) |
| Total | 990 (100.0%) | 1,397 (100.0%) |
Real Estate Taxes by Mortgage Status in Mont Belvieu
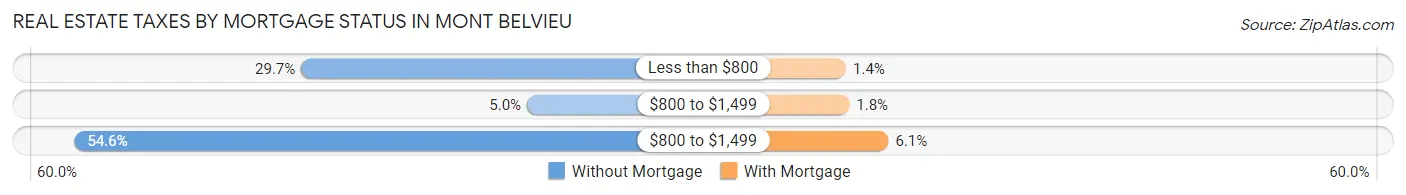
| Property Taxes | Without Mortgage | With Mortgage |
| Less than $800 | 294 (29.7%) | 20 (1.4%) |
| $800 to $1,499 | 49 (5.0%) | 25 (1.8%) |
| $800 to $1,499 | 540 (54.5%) | 85 (6.1%) |
| Total | 990 (100.0%) | 1,397 (100.0%) |
Health & Disability in Mont Belvieu
Health Insurance Coverage by Age in Mont Belvieu
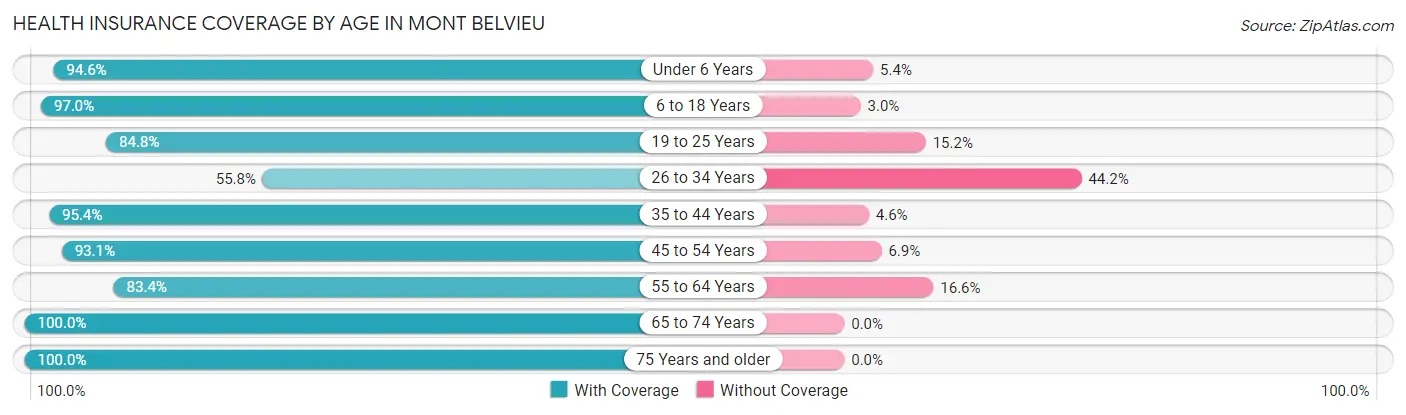
| Age Bracket | With Coverage | Without Coverage |
| Under 6 Years | 738 (94.6%) | 42 (5.4%) |
| 6 to 18 Years | 1,533 (97.0%) | 48 (3.0%) |
| 19 to 25 Years | 480 (84.8%) | 86 (15.2%) |
| 26 to 34 Years | 512 (55.8%) | 406 (44.2%) |
| 35 to 44 Years | 1,333 (95.4%) | 64 (4.6%) |
| 45 to 54 Years | 752 (93.1%) | 56 (6.9%) |
| 55 to 64 Years | 773 (83.4%) | 154 (16.6%) |
| 65 to 74 Years | 653 (100.0%) | 0 (0.0%) |
| 75 Years and older | 177 (100.0%) | 0 (0.0%) |
| Total | 6,951 (89.0%) | 856 (11.0%) |
Health Insurance Coverage by Citizenship Status in Mont Belvieu
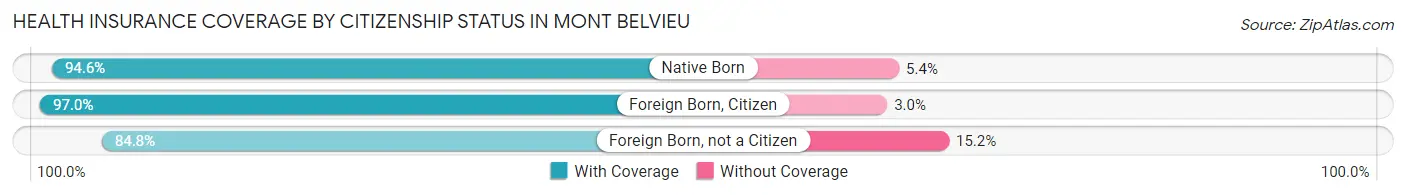
| Citizenship Status | With Coverage | Without Coverage |
| Native Born | 738 (94.6%) | 42 (5.4%) |
| Foreign Born, Citizen | 1,533 (97.0%) | 48 (3.0%) |
| Foreign Born, not a Citizen | 480 (84.8%) | 86 (15.2%) |
Health Insurance Coverage by Household Income in Mont Belvieu
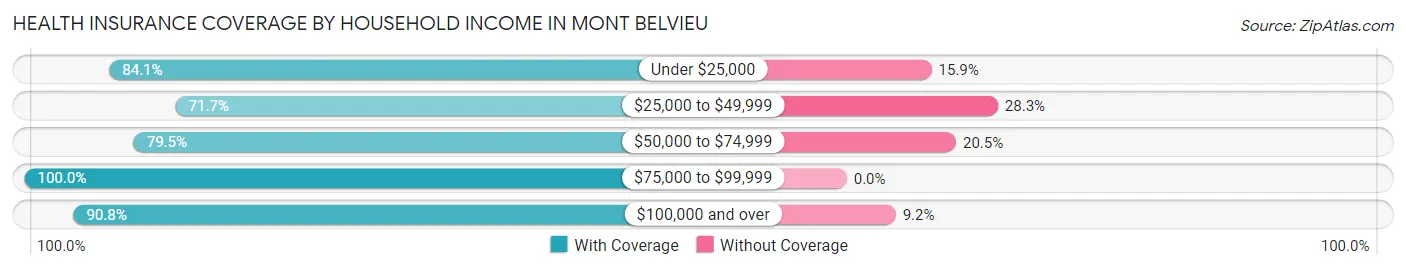
| Household Income | With Coverage | Without Coverage |
| Under $25,000 | 598 (84.1%) | 113 (15.9%) |
| $25,000 to $49,999 | 238 (71.7%) | 94 (28.3%) |
| $50,000 to $74,999 | 513 (79.5%) | 132 (20.5%) |
| $75,000 to $99,999 | 479 (100.0%) | 0 (0.0%) |
| $100,000 and over | 5,123 (90.8%) | 517 (9.2%) |
Public vs Private Health Insurance Coverage by Age in Mont Belvieu
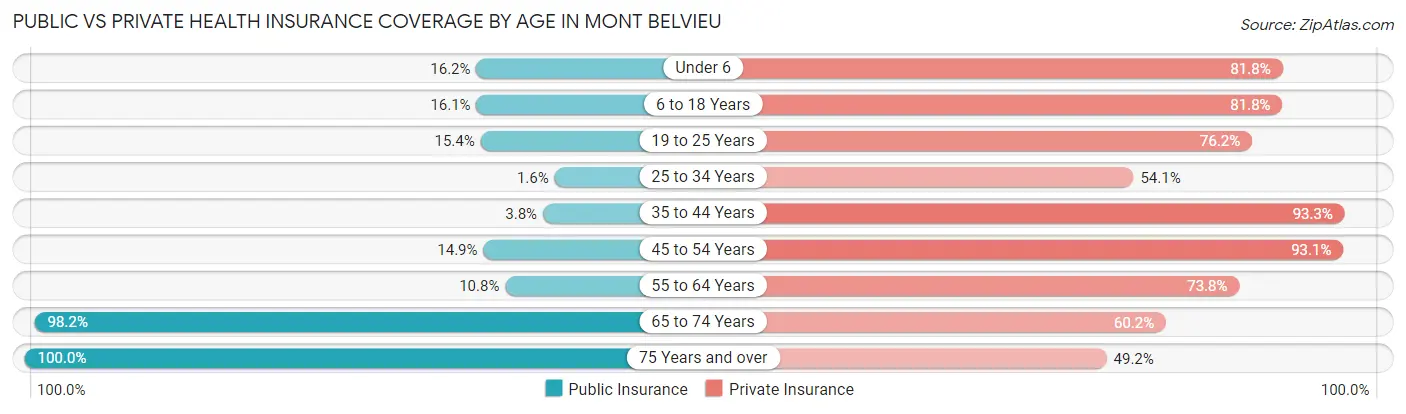
| Age Bracket | Public Insurance | Private Insurance |
| Under 6 | 126 (16.2%) | 638 (81.8%) |
| 6 to 18 Years | 255 (16.1%) | 1,293 (81.8%) |
| 19 to 25 Years | 87 (15.4%) | 431 (76.1%) |
| 25 to 34 Years | 15 (1.6%) | 497 (54.1%) |
| 35 to 44 Years | 53 (3.8%) | 1,304 (93.3%) |
| 45 to 54 Years | 120 (14.8%) | 752 (93.1%) |
| 55 to 64 Years | 100 (10.8%) | 684 (73.8%) |
| 65 to 74 Years | 641 (98.2%) | 393 (60.2%) |
| 75 Years and over | 177 (100.0%) | 87 (49.1%) |
| Total | 1,574 (20.2%) | 6,079 (77.9%) |
Disability Status by Sex by Age in Mont Belvieu
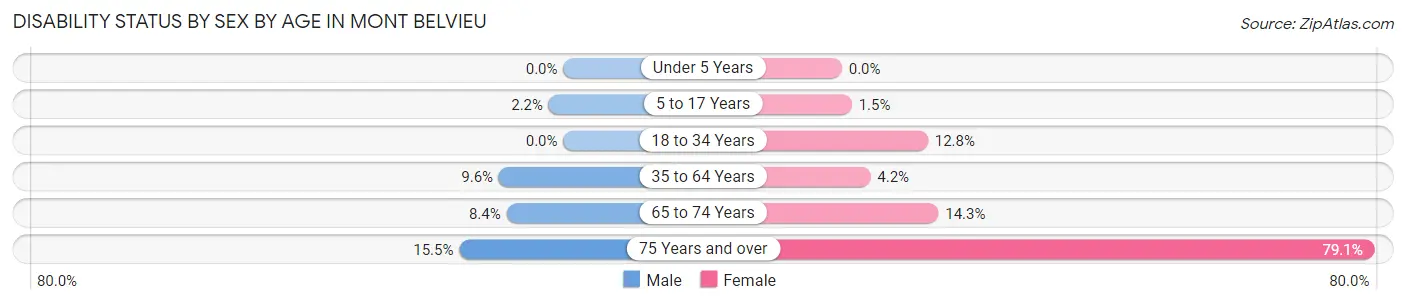
| Age Bracket | Male | Female |
| Under 5 Years | 0 (0.0%) | 0 (0.0%) |
| 5 to 17 Years | 15 (2.1%) | 13 (1.5%) |
| 18 to 34 Years | 0 (0.0%) | 112 (12.8%) |
| 35 to 64 Years | 144 (9.6%) | 69 (4.2%) |
| 65 to 74 Years | 28 (8.4%) | 46 (14.3%) |
| 75 Years and over | 17 (15.4%) | 53 (79.1%) |
Disability Class by Sex by Age in Mont Belvieu
Disability Class: Hearing Difficulty
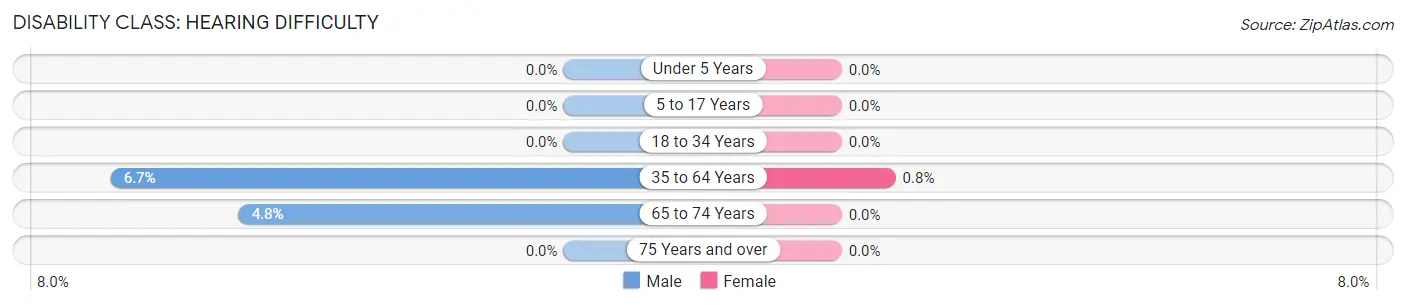
| Age Bracket | Male | Female |
| Under 5 Years | 0 (0.0%) | 0 (0.0%) |
| 5 to 17 Years | 0 (0.0%) | 0 (0.0%) |
| 18 to 34 Years | 0 (0.0%) | 0 (0.0%) |
| 35 to 64 Years | 101 (6.7%) | 13 (0.8%) |
| 65 to 74 Years | 16 (4.8%) | 0 (0.0%) |
| 75 Years and over | 0 (0.0%) | 0 (0.0%) |
Disability Class: Vision Difficulty
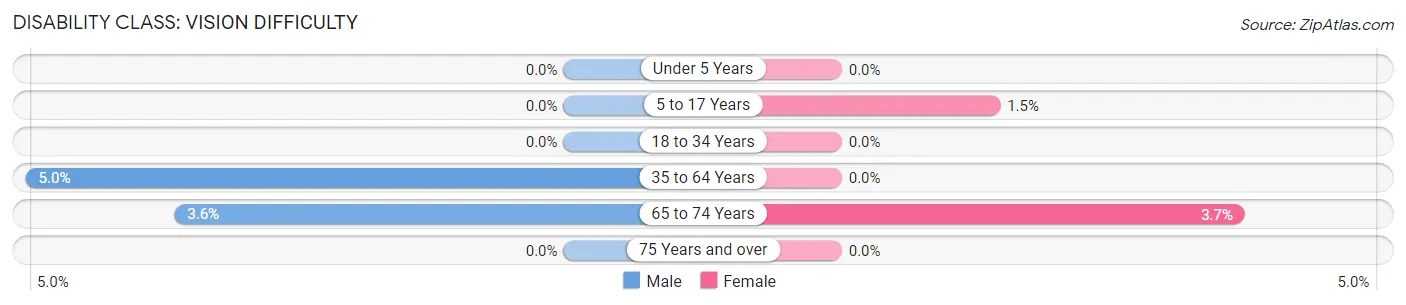
| Age Bracket | Male | Female |
| Under 5 Years | 0 (0.0%) | 0 (0.0%) |
| 5 to 17 Years | 0 (0.0%) | 13 (1.5%) |
| 18 to 34 Years | 0 (0.0%) | 0 (0.0%) |
| 35 to 64 Years | 75 (5.0%) | 0 (0.0%) |
| 65 to 74 Years | 12 (3.6%) | 12 (3.7%) |
| 75 Years and over | 0 (0.0%) | 0 (0.0%) |
Disability Class: Cognitive Difficulty
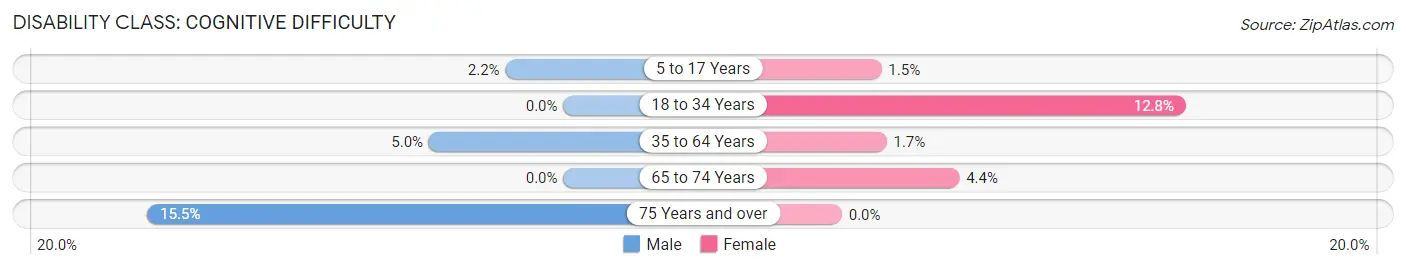
| Age Bracket | Male | Female |
| 5 to 17 Years | 15 (2.1%) | 13 (1.5%) |
| 18 to 34 Years | 0 (0.0%) | 112 (12.8%) |
| 35 to 64 Years | 75 (5.0%) | 27 (1.7%) |
| 65 to 74 Years | 0 (0.0%) | 14 (4.4%) |
| 75 Years and over | 17 (15.4%) | 0 (0.0%) |
Disability Class: Ambulatory Difficulty
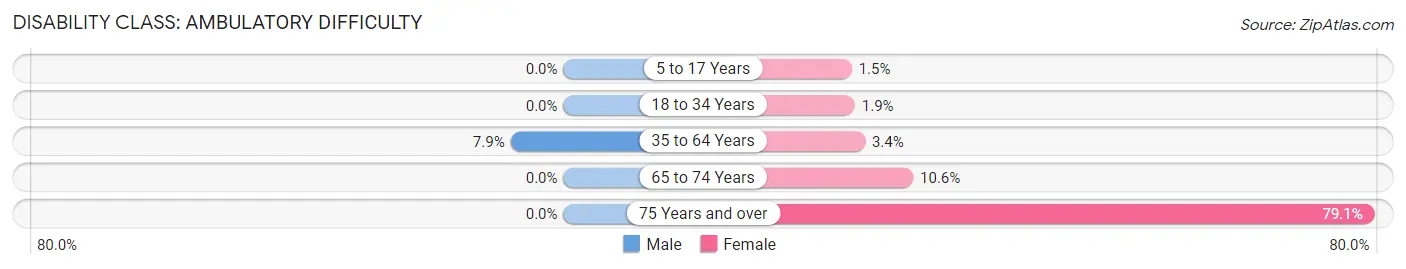
| Age Bracket | Male | Female |
| 5 to 17 Years | 0 (0.0%) | 13 (1.5%) |
| 18 to 34 Years | 0 (0.0%) | 17 (1.9%) |
| 35 to 64 Years | 118 (7.9%) | 56 (3.4%) |
| 65 to 74 Years | 0 (0.0%) | 34 (10.6%) |
| 75 Years and over | 0 (0.0%) | 53 (79.1%) |
Disability Class: Self-Care Difficulty
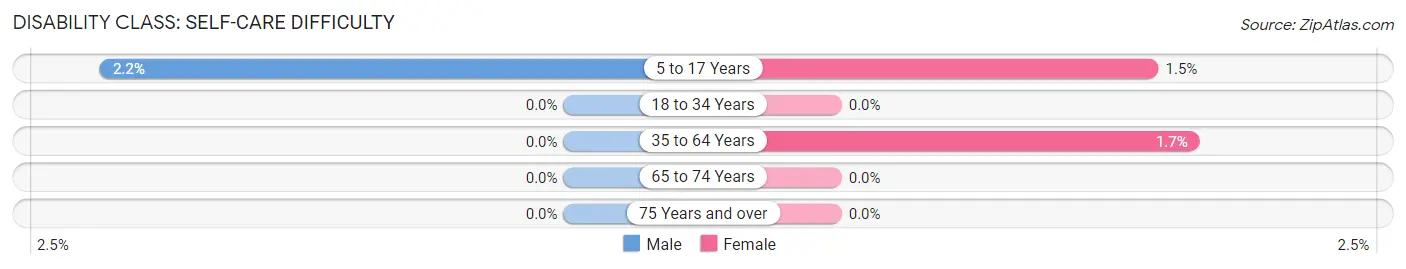
| Age Bracket | Male | Female |
| 5 to 17 Years | 15 (2.1%) | 13 (1.5%) |
| 18 to 34 Years | 0 (0.0%) | 0 (0.0%) |
| 35 to 64 Years | 0 (0.0%) | 27 (1.7%) |
| 65 to 74 Years | 0 (0.0%) | 0 (0.0%) |
| 75 Years and over | 0 (0.0%) | 0 (0.0%) |
Technology Access in Mont Belvieu
Computing Device Access in Mont Belvieu
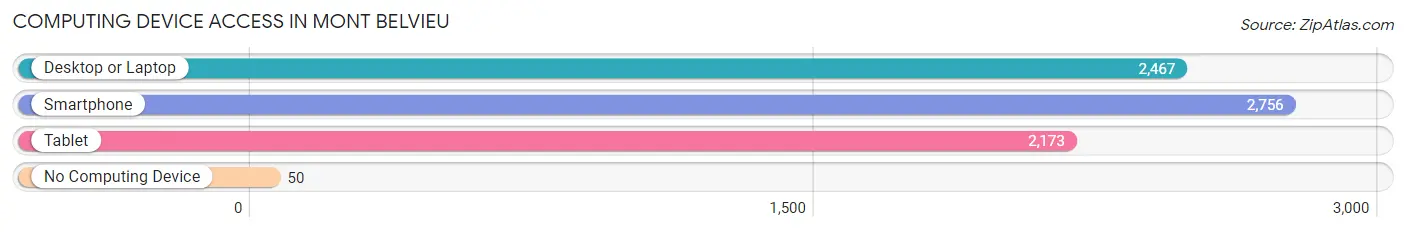
| Device Type | # Households | % Households |
| Desktop or Laptop | 2,467 | 86.7% |
| Smartphone | 2,756 | 96.9% |
| Tablet | 2,173 | 76.4% |
| No Computing Device | 50 | 1.8% |
| Total | 2,844 | 100.0% |
Internet Access in Mont Belvieu
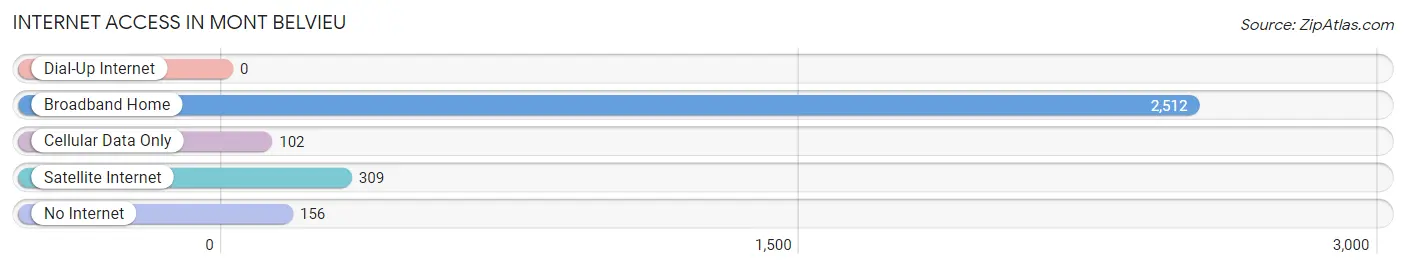
| Internet Type | # Households | % Households |
| Dial-Up Internet | 0 | 0.0% |
| Broadband Home | 2,512 | 88.3% |
| Cellular Data Only | 102 | 3.6% |
| Satellite Internet | 309 | 10.9% |
| No Internet | 156 | 5.5% |
| Total | 2,844 | 100.0% |
Mont Belvieu Summary
History
The town of Mont Belvieu, Texas is located in Chambers County, Texas, and is part of the Houston–The Woodlands–Sugar Land metropolitan area. The town was founded in 1845 by a group of settlers from Louisiana, led by William J. Kyle. The town was originally named “Kyle’s Settlement”, but was later changed to Mont Belvieu in 1856. The name is derived from the French phrase “mont belle vue”, which translates to “beautiful view”.
The town was originally a farming community, but in the early 1900s, the discovery of oil in the area changed the town’s economy. The first oil well was drilled in Mont Belvieu in 1912, and the town quickly became a center for oil production. The town’s population grew rapidly, and by the 1930s, Mont Belvieu was a thriving oil town.
In the 1950s, the town began to diversify its economy, and today, Mont Belvieu is home to a variety of industries, including oil and gas, manufacturing, and retail. The town is also home to several large chemical plants, including the Mont Belvieu Refinery, which is the largest refinery in the United States.
Geography
Mont Belvieu is located in Chambers County, Texas, and is part of the Houston–The Woodlands–Sugar Land metropolitan area. The town is situated on the western edge of the Houston metropolitan area, and is located approximately 30 miles east of downtown Houston.
The town is located on the northern edge of the Gulf Coastal Plain, and is surrounded by flat, low-lying terrain. The town is located near the Trinity River, and is situated on the western edge of the Trinity River Basin.
The town has a humid subtropical climate, with hot, humid summers and mild winters. The average annual temperature is 68°F, and the average annual precipitation is 48 inches.
Economy
Mont Belvieu’s economy is largely based on oil and gas production, manufacturing, and retail. The town is home to several large chemical plants, including the Mont Belvieu Refinery, which is the largest refinery in the United States.
The town is also home to several large retail stores, including Walmart, Home Depot, and Lowe’s. The town is also home to several restaurants, including McDonald’s, Burger King, and Sonic Drive-In.
Demographics
As of the 2010 census, the population of Mont Belvieu was 6,671. The town has a population density of 1,092 people per square mile. The median age of the population is 37.7 years, and the median household income is $63,945.
The town is predominantly white, with 78.3% of the population identifying as white. The town is also home to a large Hispanic population, with 17.3% of the population identifying as Hispanic or Latino. The town is also home to a small African American population, with 4.3% of the population identifying as African American.
Conclusion
Mont Belvieu, Texas is a small town located in Chambers County, Texas, and is part of the Houston–The Woodlands–Sugar Land metropolitan area. The town was founded in 1845, and was originally a farming community. In the early 1900s, the discovery of oil in the area changed the town’s economy, and today, Mont Belvieu is home to a variety of industries, including oil and gas, manufacturing, and retail. The town has a population of 6,671, and is predominantly white, with 78.3% of the population identifying as white. The town is also home to a large Hispanic population, with 17.3% of the population identifying as Hispanic or Latino. The town is also home to several large chemical plants, including the Mont Belvieu Refinery, which is the largest refinery in the United States.
Common Questions
What is Per Capita Income in Mont Belvieu?
Per Capita income in Mont Belvieu is $50,664.
What is the Median Family Income in Mont Belvieu?
Median Family Income in Mont Belvieu is $143,875.
What is the Median Household income in Mont Belvieu?
Median Household Income in Mont Belvieu is $132,010.
What is Income or Wage Gap in Mont Belvieu?
Income or Wage Gap in Mont Belvieu is 53.7%.
Women in Mont Belvieu earn 46.3 cents for every dollar earned by a man.
What is Inequality or Gini Index in Mont Belvieu?
Inequality or Gini Index in Mont Belvieu is 0.38.
What is the Total Population of Mont Belvieu?
Total Population of Mont Belvieu is 7,868.
What is the Total Male Population of Mont Belvieu?
Total Male Population of Mont Belvieu is 3,672.
What is the Total Female Population of Mont Belvieu?
Total Female Population of Mont Belvieu is 4,196.
What is the Ratio of Males per 100 Females in Mont Belvieu?
There are 87.51 Males per 100 Females in Mont Belvieu.
What is the Ratio of Females per 100 Males in Mont Belvieu?
There are 114.27 Females per 100 Males in Mont Belvieu.
What is the Median Population Age in Mont Belvieu?
Median Population Age in Mont Belvieu is 36.0 Years.
What is the Average Family Size in Mont Belvieu
Average Family Size in Mont Belvieu is 3.1 People.
What is the Average Household Size in Mont Belvieu
Average Household Size in Mont Belvieu is 2.8 People.
How Large is the Labor Force in Mont Belvieu?
There are 4,044 People in the Labor Forcein in Mont Belvieu.
What is the Percentage of People in the Labor Force in Mont Belvieu?
71.8% of People are in the Labor Force in Mont Belvieu.
What is the Unemployment Rate in Mont Belvieu?
Unemployment Rate in Mont Belvieu is 2.0%.