Zip Codes with the Highest Percentage of Population Employed in Firefighting & Prevention in Houston, TX
RELATED REPORTS & OPTIONS
Firefighting & Prevention
Houston
Compare Zip Codes
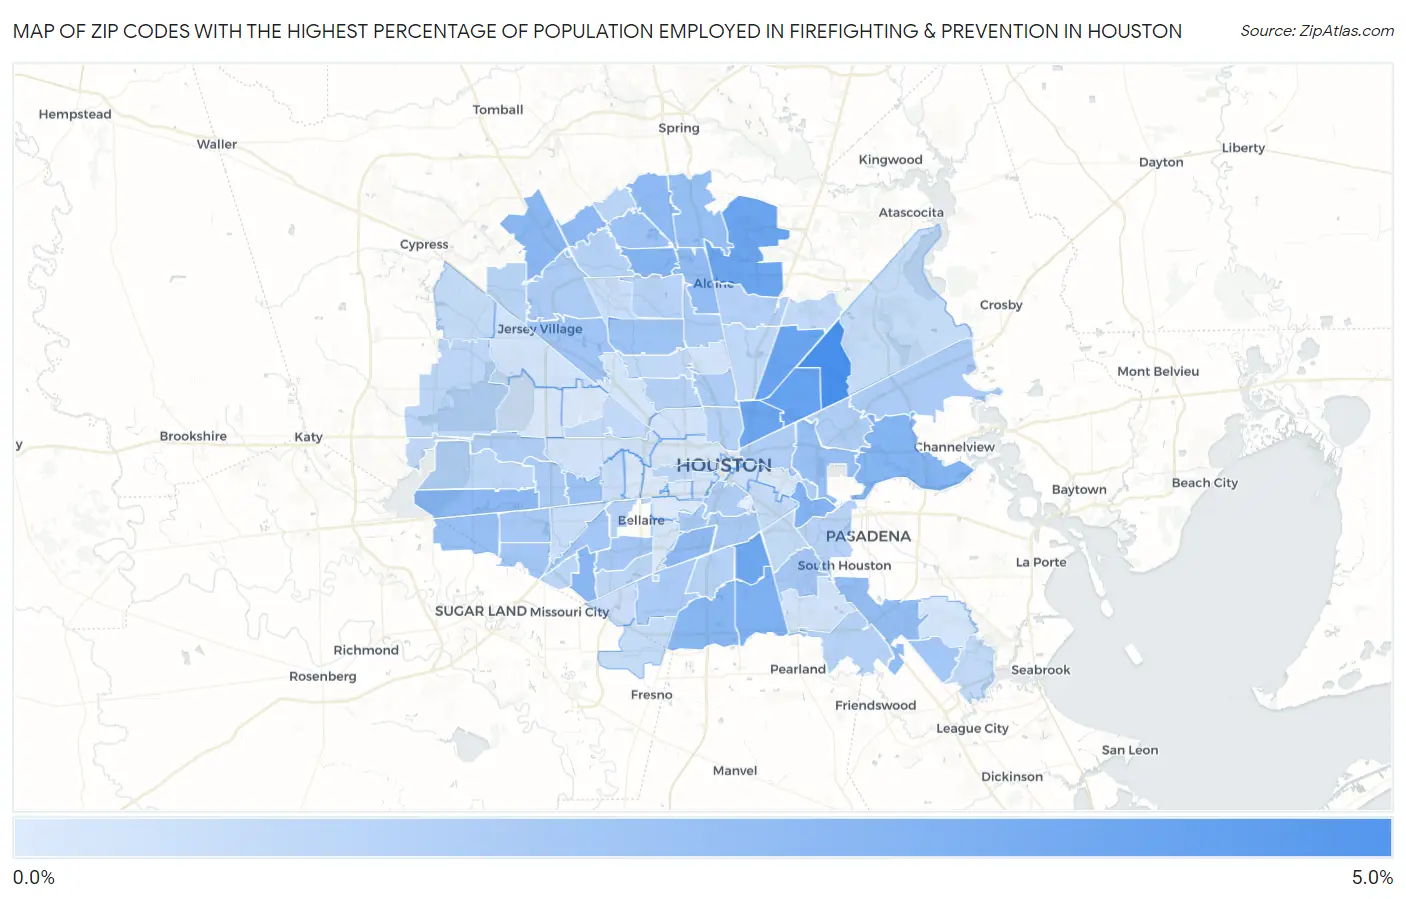
Map of Zip Codes with the Highest Percentage of Population Employed in Firefighting & Prevention in Houston
0.047%
4.3%
Zip Codes with the Highest Percentage of Population Employed in Firefighting & Prevention in Houston, TX
| Zip Code | % Employed | vs State | vs National | |
| 1. | 77078 | 4.3% | 1.1%(+3.12)#68 | 1.2%(+3.07)#1,225 |
| 2. | 77028 | 3.4% | 1.1%(+2.27)#104 | 1.2%(+2.21)#1,811 |
| 3. | 77016 | 3.2% | 1.1%(+2.12)#113 | 1.2%(+2.06)#1,959 |
| 4. | 77032 | 3.2% | 1.1%(+2.09)#118 | 1.2%(+2.04)#1,997 |
| 5. | 77026 | 3.2% | 1.1%(+2.06)#122 | 1.2%(+2.01)#2,031 |
| 6. | 77033 | 3.1% | 1.1%(+2.02)#129 | 1.2%(+1.96)#2,082 |
| 7. | 77048 | 2.7% | 1.1%(+1.53)#167 | 1.2%(+1.47)#2,786 |
| 8. | 77067 | 2.6% | 1.1%(+1.45)#181 | 1.2%(+1.40)#2,931 |
| 9. | 77015 | 2.6% | 1.1%(+1.43)#186 | 1.2%(+1.38)#2,968 |
| 10. | 77012 | 2.5% | 1.1%(+1.33)#201 | 1.2%(+1.27)#3,190 |
| 11. | 77047 | 2.4% | 1.1%(+1.30)#207 | 1.2%(+1.24)#3,265 |
| 12. | 77071 | 2.4% | 1.1%(+1.26)#214 | 1.2%(+1.20)#3,372 |
| 13. | 77070 | 2.4% | 1.1%(+1.25)#215 | 1.2%(+1.19)#3,386 |
| 14. | 77082 | 2.3% | 1.1%(+1.17)#230 | 1.2%(+1.11)#3,562 |
| 15. | 77069 | 2.2% | 1.1%(+1.12)#240 | 1.2%(+1.06)#3,714 |
| 16. | 77090 | 2.2% | 1.1%(+1.09)#245 | 1.2%(+1.03)#3,812 |
| 17. | 77054 | 2.2% | 1.1%(+1.07)#246 | 1.2%(+1.02)#3,855 |
| 18. | 77060 | 2.2% | 1.1%(+1.05)#249 | 1.2%(+0.990)#3,942 |
| 19. | 77034 | 2.1% | 1.1%(+0.976)#265 | 1.2%(+0.919)#4,141 |
| 20. | 77073 | 2.0% | 1.1%(+0.904)#278 | 1.2%(+0.847)#4,395 |
| 21. | 77083 | 2.0% | 1.1%(+0.843)#293 | 1.2%(+0.786)#4,619 |
| 22. | 77029 | 2.0% | 1.1%(+0.839)#294 | 1.2%(+0.781)#4,638 |
| 23. | 77014 | 1.8% | 1.1%(+0.709)#321 | 1.2%(+0.652)#5,188 |
| 24. | 77063 | 1.8% | 1.1%(+0.687)#326 | 1.2%(+0.630)#5,282 |
| 25. | 77088 | 1.8% | 1.1%(+0.663)#331 | 1.2%(+0.606)#5,394 |
| 26. | 77040 | 1.7% | 1.1%(+0.576)#363 | 1.2%(+0.518)#5,817 |
| 27. | 77062 | 1.7% | 1.1%(+0.543)#373 | 1.2%(+0.486)#5,992 |
| 28. | 77074 | 1.6% | 1.1%(+0.520)#386 | 1.2%(+0.463)#6,104 |
| 29. | 77099 | 1.6% | 1.1%(+0.515)#391 | 1.2%(+0.457)#6,143 |
| 30. | 77072 | 1.6% | 1.1%(+0.475)#402 | 1.2%(+0.417)#6,367 |
| 31. | 77061 | 1.6% | 1.1%(+0.445)#413 | 1.2%(+0.388)#6,527 |
| 32. | 77096 | 1.6% | 1.1%(+0.442)#414 | 1.2%(+0.385)#6,544 |
| 33. | 77021 | 1.5% | 1.1%(+0.416)#424 | 1.2%(+0.359)#6,689 |
| 34. | 77042 | 1.5% | 1.1%(+0.343)#457 | 1.2%(+0.286)#7,159 |
| 35. | 77045 | 1.5% | 1.1%(+0.337)#459 | 1.2%(+0.280)#7,199 |
| 36. | 77030 | 1.4% | 1.1%(+0.321)#462 | 1.2%(+0.264)#7,307 |
| 37. | 77049 | 1.4% | 1.1%(+0.315)#464 | 1.2%(+0.258)#7,358 |
| 38. | 77037 | 1.4% | 1.1%(+0.279)#480 | 1.2%(+0.222)#7,595 |
| 39. | 77022 | 1.4% | 1.1%(+0.273)#483 | 1.2%(+0.216)#7,635 |
| 40. | 77064 | 1.4% | 1.1%(+0.265)#487 | 1.2%(+0.208)#7,689 |
| 41. | 77079 | 1.4% | 1.1%(+0.225)#507 | 1.2%(+0.168)#7,952 |
| 42. | 77004 | 1.4% | 1.1%(+0.225)#508 | 1.2%(+0.168)#7,954 |
| 43. | 77020 | 1.3% | 1.1%(+0.184)#528 | 1.2%(+0.127)#8,257 |
| 44. | 77013 | 1.3% | 1.1%(+0.159)#544 | 1.2%(+0.102)#8,446 |
| 45. | 77039 | 1.2% | 1.1%(+0.083)#585 | 1.2%(+0.025)#9,055 |
| 46. | 77081 | 1.2% | 1.1%(+0.028)#615 | 1.2%(-0.029)#9,541 |
| 47. | 77066 | 1.2% | 1.1%(+0.028)#616 | 1.2%(-0.030)#9,551 |
| 48. | 77051 | 1.1% | 1.1%(+0.020)#623 | 1.2%(-0.037)#9,638 |
| 49. | 77018 | 1.1% | 1.1%(+0.016)#629 | 1.2%(-0.042)#9,672 |
| 50. | 77089 | 1.1% | 1.1%(-0.007)#646 | 1.2%(-0.064)#9,906 |
| 51. | 77009 | 1.1% | 1.1%(-0.015)#649 | 1.2%(-0.073)#9,983 |
| 52. | 77017 | 1.1% | 1.1%(-0.066)#674 | 1.2%(-0.123)#10,450 |
| 53. | 77038 | 1.0% | 1.1%(-0.091)#686 | 1.2%(-0.149)#10,712 |
| 54. | 77068 | 1.0% | 1.1%(-0.099)#691 | 1.2%(-0.157)#10,791 |
| 55. | 77031 | 1.0% | 1.1%(-0.100)#692 | 1.2%(-0.157)#10,797 |
| 56. | 77065 | 0.97% | 1.1%(-0.157)#731 | 1.2%(-0.214)#11,403 |
| 57. | 77077 | 0.96% | 1.1%(-0.169)#743 | 1.2%(-0.226)#11,545 |
| 58. | 77019 | 0.94% | 1.1%(-0.185)#751 | 1.2%(-0.242)#11,707 |
| 59. | 77084 | 0.92% | 1.1%(-0.206)#764 | 1.2%(-0.263)#11,915 |
| 60. | 77035 | 0.91% | 1.1%(-0.217)#772 | 1.2%(-0.275)#12,044 |
| 61. | 77093 | 0.86% | 1.1%(-0.271)#814 | 1.2%(-0.328)#12,596 |
| 62. | 77091 | 0.84% | 1.1%(-0.293)#824 | 1.2%(-0.351)#12,817 |
| 63. | 77094 | 0.79% | 1.1%(-0.335)#849 | 1.2%(-0.392)#13,299 |
| 64. | 77055 | 0.79% | 1.1%(-0.336)#852 | 1.2%(-0.394)#13,312 |
| 65. | 77050 | 0.79% | 1.1%(-0.342)#862 | 1.2%(-0.399)#13,373 |
| 66. | 77058 | 0.78% | 1.1%(-0.348)#865 | 1.2%(-0.405)#13,430 |
| 67. | 77087 | 0.73% | 1.1%(-0.403)#900 | 1.2%(-0.461)#14,040 |
| 68. | 77053 | 0.69% | 1.1%(-0.439)#921 | 1.2%(-0.497)#14,474 |
| 69. | 77023 | 0.68% | 1.1%(-0.452)#925 | 1.2%(-0.510)#14,598 |
| 70. | 77044 | 0.67% | 1.1%(-0.457)#931 | 1.2%(-0.514)#14,639 |
| 71. | 77095 | 0.67% | 1.1%(-0.462)#941 | 1.2%(-0.520)#14,713 |
| 72. | 77036 | 0.65% | 1.1%(-0.480)#951 | 1.2%(-0.537)#14,913 |
| 73. | 77057 | 0.61% | 1.1%(-0.515)#969 | 1.2%(-0.572)#15,270 |
| 74. | 77086 | 0.59% | 1.1%(-0.538)#984 | 1.2%(-0.596)#15,525 |
| 75. | 77085 | 0.56% | 1.1%(-0.573)#1,010 | 1.2%(-0.630)#15,897 |
| 76. | 77046 | 0.52% | 1.1%(-0.604)#1,037 | 1.2%(-0.661)#16,268 |
| 77. | 77003 | 0.47% | 1.1%(-0.659)#1,076 | 1.2%(-0.716)#16,884 |
| 78. | 77008 | 0.40% | 1.1%(-0.733)#1,119 | 1.2%(-0.790)#17,698 |
| 79. | 77075 | 0.39% | 1.1%(-0.739)#1,127 | 1.2%(-0.797)#17,782 |
| 80. | 77024 | 0.38% | 1.1%(-0.747)#1,131 | 1.2%(-0.805)#17,871 |
| 81. | 77041 | 0.37% | 1.1%(-0.762)#1,140 | 1.2%(-0.819)#18,043 |
| 82. | 77006 | 0.35% | 1.1%(-0.776)#1,144 | 1.2%(-0.833)#18,195 |
| 83. | 77076 | 0.35% | 1.1%(-0.783)#1,147 | 1.2%(-0.840)#18,284 |
| 84. | 77059 | 0.27% | 1.1%(-0.856)#1,187 | 1.2%(-0.913)#19,032 |
| 85. | 77092 | 0.22% | 1.1%(-0.907)#1,212 | 1.2%(-0.965)#19,497 |
| 86. | 77005 | 0.20% | 1.1%(-0.928)#1,225 | 1.2%(-0.985)#19,677 |
| 87. | 77043 | 0.20% | 1.1%(-0.931)#1,226 | 1.2%(-0.989)#19,699 |
| 88. | 77025 | 0.18% | 1.1%(-0.947)#1,239 | 1.2%(-1.00)#19,825 |
| 89. | 77007 | 0.17% | 1.1%(-0.959)#1,245 | 1.2%(-1.02)#19,897 |
| 90. | 77056 | 0.15% | 1.1%(-0.976)#1,251 | 1.2%(-1.03)#20,016 |
| 91. | 77011 | 0.14% | 1.1%(-0.992)#1,257 | 1.2%(-1.05)#20,118 |
| 92. | 77080 | 0.13% | 1.1%(-1.00)#1,266 | 1.2%(-1.06)#20,192 |
| 93. | 77098 | 0.080% | 1.1%(-1.05)#1,279 | 1.2%(-1.11)#20,396 |
| 94. | 77027 | 0.047% | 1.1%(-1.08)#1,289 | 1.2%(-1.14)#20,516 |
1
Common Questions
What are the Top 10 Zip Codes with the Highest Percentage of Population Employed in Firefighting & Prevention in Houston, TX?
Top 10 Zip Codes with the Highest Percentage of Population Employed in Firefighting & Prevention in Houston, TX are:
What zip code has the Highest Percentage of Population Employed in Firefighting & Prevention in Houston, TX?
77078 has the Highest Percentage of Population Employed in Firefighting & Prevention in Houston, TX with 4.3%.
What is the Percentage of Population Employed in Firefighting & Prevention in Houston, TX?
Percentage of Population Employed in Firefighting & Prevention in Houston is 1.2%.
What is the Percentage of Population Employed in Firefighting & Prevention in Texas?
Percentage of Population Employed in Firefighting & Prevention in Texas is 1.1%.
What is the Percentage of Population Employed in Firefighting & Prevention in the United States?
Percentage of Population Employed in Firefighting & Prevention in the United States is 1.2%.