Liberty City, TX Map & Demographics
Liberty City Map
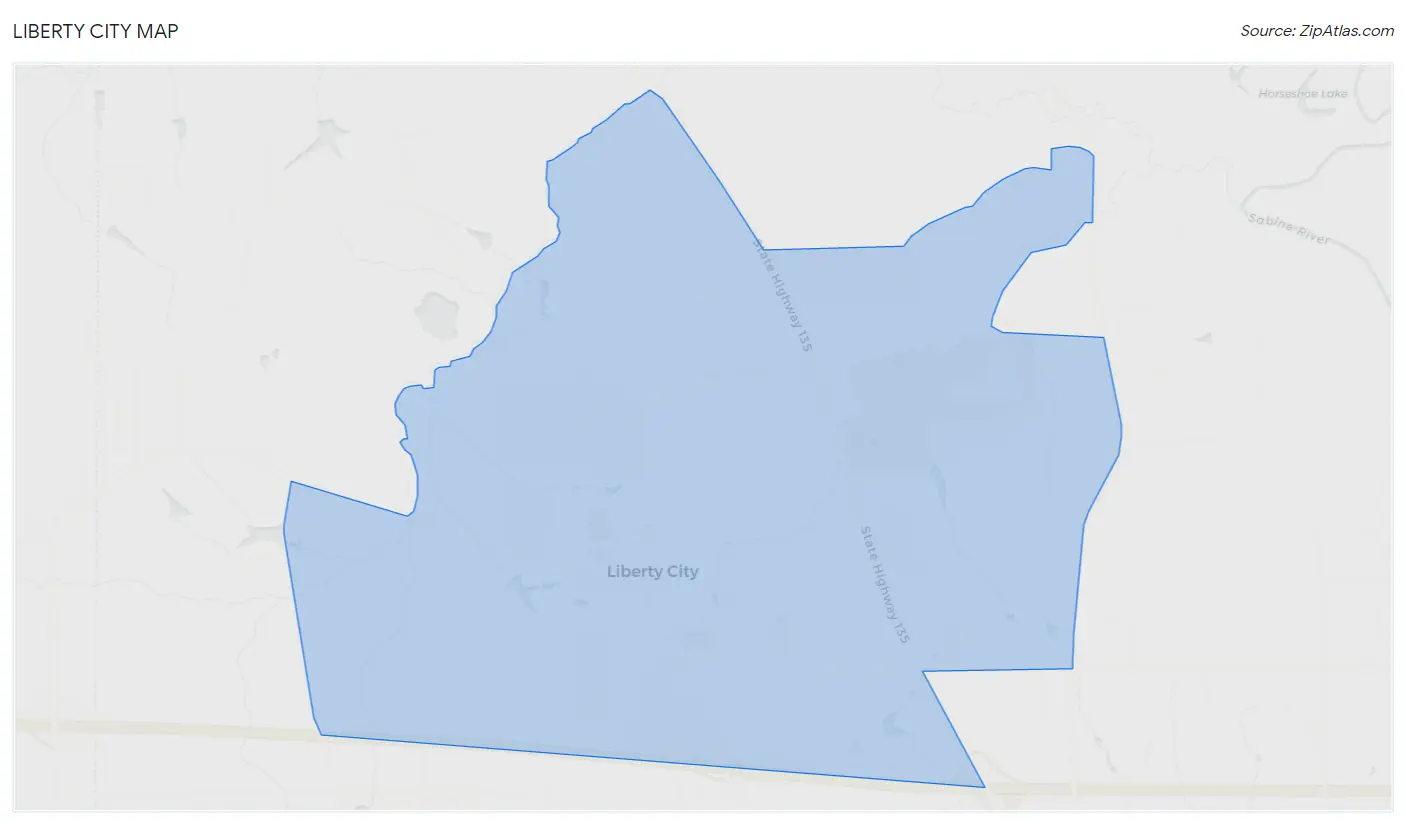
Liberty City Overview
$30,205
PER CAPITA INCOME
$82,143
AVG FAMILY INCOME
$64,153
AVG HOUSEHOLD INCOME
3.1%
WAGE / INCOME GAP [ % ]
96.9¢/ $1
WAGE / INCOME GAP [ $ ]
0.34
INEQUALITY / GINI INDEX
2,991
TOTAL POPULATION
1,430
MALE POPULATION
1,561
FEMALE POPULATION
91.61
MALES / 100 FEMALES
109.16
FEMALES / 100 MALES
32.5
MEDIAN AGE
3.2
AVG FAMILY SIZE
2.9
AVG HOUSEHOLD SIZE
1,367
LABOR FORCE [ PEOPLE ]
61.6%
PERCENT IN LABOR FORCE
2.6%
UNEMPLOYMENT RATE
Income in Liberty City
Income Overview in Liberty City
Per Capita Income in Liberty City is $30,205, while median incomes of families and households are $82,143 and $64,153 respectively.
| Characteristic | Number | Measure |
| Per Capita Income | 2,991 | $30,205 |
| Median Family Income | 864 | $82,143 |
| Mean Family Income | 864 | $93,715 |
| Median Household Income | 1,048 | $64,153 |
| Mean Household Income | 1,048 | $85,047 |
| Income Deficit | 864 | $0 |
| Wage / Income Gap (%) | 2,991 | 3.14% |
| Wage / Income Gap ($) | 2,991 | 96.86¢ per $1 |
| Gini / Inequality Index | 2,991 | 0.34 |
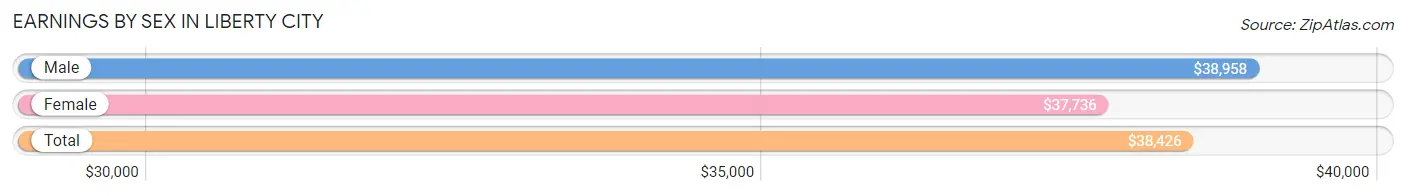
Earnings by Sex in Liberty City
Average Earnings in Liberty City are $38,426, $38,958 for men and $37,736 for women, a difference of 3.1%.
| Sex | Number | Average Earnings |
| Male | 838 (58.8%) | $38,958 |
| Female | 588 (41.2%) | $37,736 |
| Total | 1,426 (100.0%) | $38,426 |
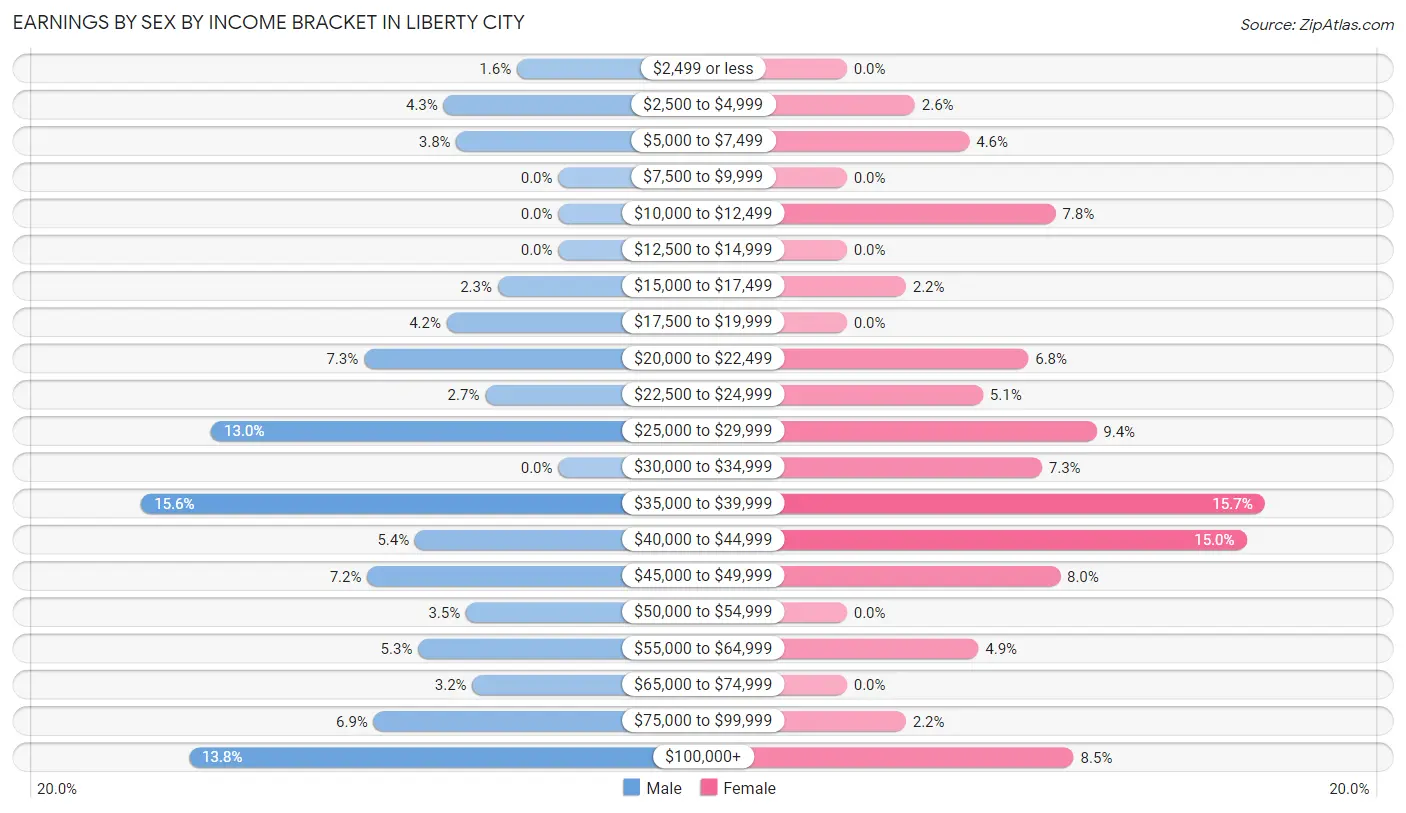
Earnings by Sex by Income Bracket in Liberty City
The most common earnings brackets in Liberty City are $35,000 to $39,999 for men (131 | 15.6%) and $35,000 to $39,999 for women (92 | 15.7%).
| Income | Male | Female |
| $2,499 or less | 13 (1.5%) | 0 (0.0%) |
| $2,500 to $4,999 | 36 (4.3%) | 15 (2.5%) |
| $5,000 to $7,499 | 32 (3.8%) | 27 (4.6%) |
| $7,500 to $9,999 | 0 (0.0%) | 0 (0.0%) |
| $10,000 to $12,499 | 0 (0.0%) | 46 (7.8%) |
| $12,500 to $14,999 | 0 (0.0%) | 0 (0.0%) |
| $15,000 to $17,499 | 19 (2.3%) | 13 (2.2%) |
| $17,500 to $19,999 | 35 (4.2%) | 0 (0.0%) |
| $20,000 to $22,499 | 61 (7.3%) | 40 (6.8%) |
| $22,500 to $24,999 | 23 (2.7%) | 30 (5.1%) |
| $25,000 to $29,999 | 109 (13.0%) | 55 (9.3%) |
| $30,000 to $34,999 | 0 (0.0%) | 43 (7.3%) |
| $35,000 to $39,999 | 131 (15.6%) | 92 (15.7%) |
| $40,000 to $44,999 | 45 (5.4%) | 88 (15.0%) |
| $45,000 to $49,999 | 60 (7.2%) | 47 (8.0%) |
| $50,000 to $54,999 | 29 (3.5%) | 0 (0.0%) |
| $55,000 to $64,999 | 44 (5.2%) | 29 (4.9%) |
| $65,000 to $74,999 | 27 (3.2%) | 0 (0.0%) |
| $75,000 to $99,999 | 58 (6.9%) | 13 (2.2%) |
| $100,000+ | 116 (13.8%) | 50 (8.5%) |
| Total | 838 (100.0%) | 588 (100.0%) |
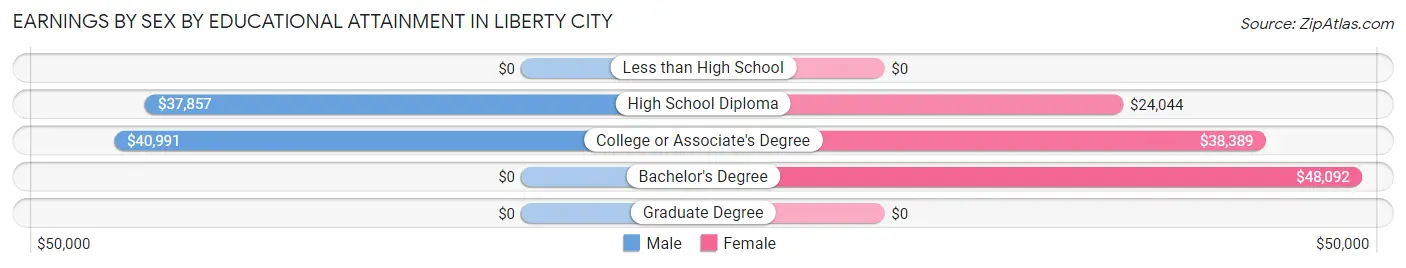
Earnings by Sex by Educational Attainment in Liberty City
Average earnings in Liberty City are $38,659 for men and $34,474 for women, a difference of 10.8%. Men with an educational attainment of college or associate's degree enjoy the highest average annual earnings of $40,991, while those with high school diploma education earn the least with $37,857. Women with an educational attainment of bachelor's degree earn the most with the average annual earnings of $48,092, while those with high school diploma education have the smallest earnings of $24,044.
| Educational Attainment | Male Income | Female Income |
| Less than High School | - | - |
| High School Diploma | $37,857 | $24,044 |
| College or Associate's Degree | $40,991 | $38,389 |
| Bachelor's Degree | - | - |
| Graduate Degree | - | - |
| Total | $38,659 | $34,474 |
Family Income in Liberty City
Family Income Brackets in Liberty City
According to the Liberty City family income data, there are 184 families falling into the $75,000 to $99,999 income range, which is the most common income bracket and makes up 21.3% of all families.
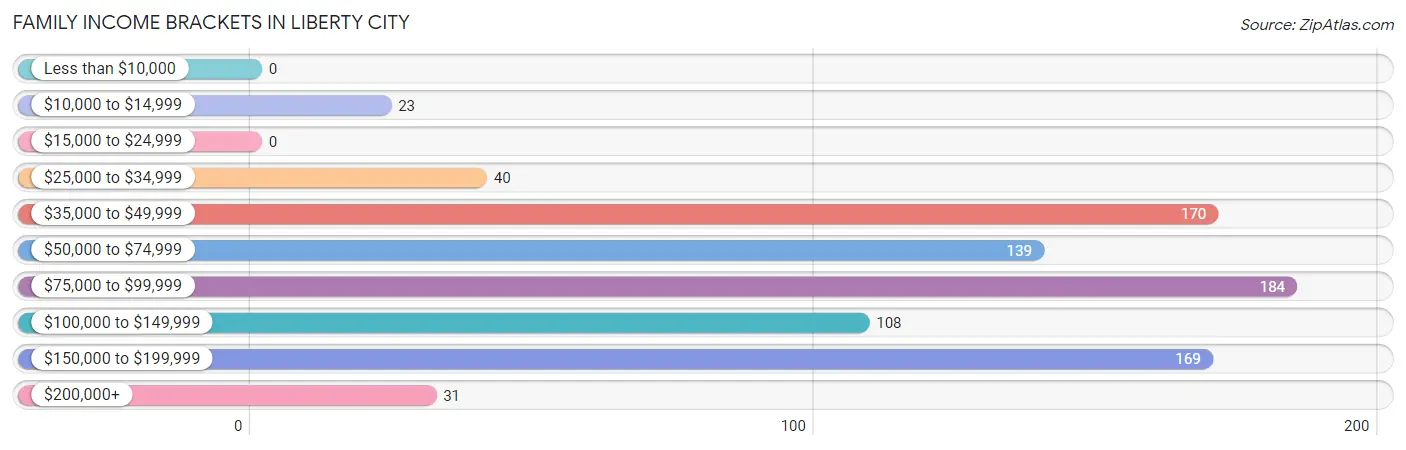
| Income Bracket | # Families | % Families |
| Less than $10,000 | 0 | 0.0% |
| $10,000 to $14,999 | 23 | 2.7% |
| $15,000 to $24,999 | 0 | 0.0% |
| $25,000 to $34,999 | 40 | 4.6% |
| $35,000 to $49,999 | 170 | 19.7% |
| $50,000 to $74,999 | 139 | 16.1% |
| $75,000 to $99,999 | 184 | 21.3% |
| $100,000 to $149,999 | 108 | 12.5% |
| $150,000 to $199,999 | 169 | 19.6% |
| $200,000+ | 31 | 3.6% |
Family Income by Famaliy Size in Liberty City
4-person families (284 | 32.9%) account for the highest median family income in Liberty City with $101,979 per family, while 2-person families (359 | 41.5%) have the highest median income of $31,354 per family member.
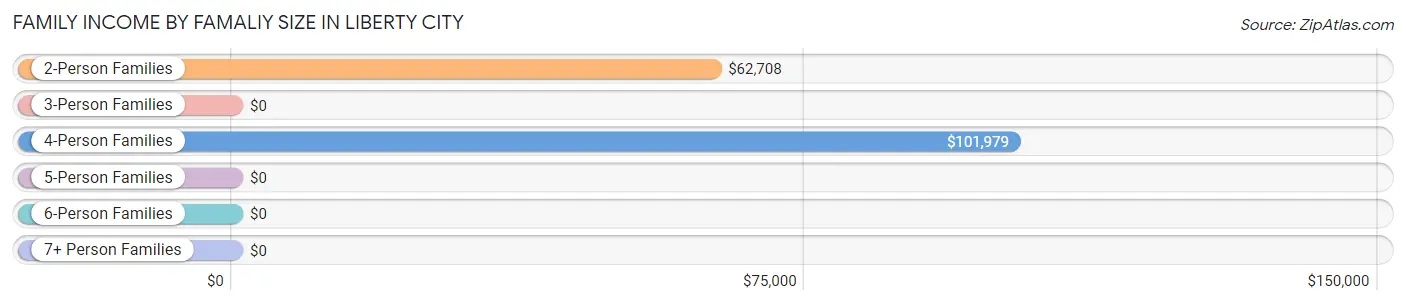
| Income Bracket | # Families | Median Income |
| 2-Person Families | 359 (41.5%) | $62,708 |
| 3-Person Families | 105 (12.1%) | $0 |
| 4-Person Families | 284 (32.9%) | $101,979 |
| 5-Person Families | 89 (10.3%) | $0 |
| 6-Person Families | 27 (3.1%) | $0 |
| 7+ Person Families | 0 (0.0%) | $0 |
| Total | 864 (100.0%) | $82,143 |
Family Income by Number of Earners in Liberty City
The median family income in Liberty City is $82,143, with families comprising 3+ earners (58) having the highest median family income of $108,158, while families with no earners (99) have the lowest median family income of $45,417, accounting for 6.7% and 11.5% of families, respectively.
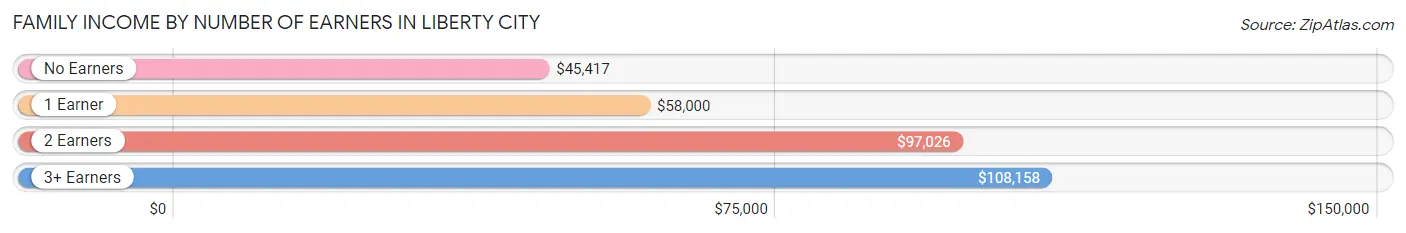
| Number of Earners | # Families | Median Income |
| No Earners | 99 (11.5%) | $45,417 |
| 1 Earner | 302 (34.9%) | $58,000 |
| 2 Earners | 405 (46.9%) | $97,026 |
| 3+ Earners | 58 (6.7%) | $108,158 |
| Total | 864 (100.0%) | $82,143 |
Household Income in Liberty City
Household Income Brackets in Liberty City
With 215 households falling in the category, the $50,000 to $74,999 income range is the most frequent in Liberty City, accounting for 20.5% of all households. In contrast, only 12 households (1.1%) fall into the less than $10,000 income bracket, making it the least populous group.
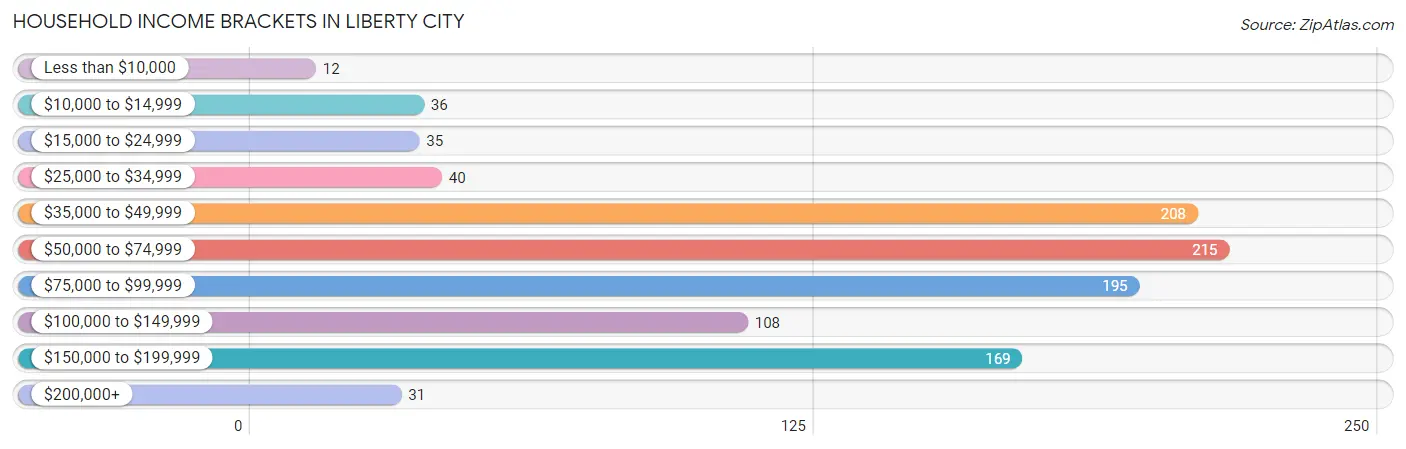
| Income Bracket | # Households | % Households |
| Less than $10,000 | 12 | 1.1% |
| $10,000 to $14,999 | 36 | 3.4% |
| $15,000 to $24,999 | 35 | 3.3% |
| $25,000 to $34,999 | 40 | 3.8% |
| $35,000 to $49,999 | 208 | 19.8% |
| $50,000 to $74,999 | 215 | 20.5% |
| $75,000 to $99,999 | 195 | 18.6% |
| $100,000 to $149,999 | 108 | 10.3% |
| $150,000 to $199,999 | 169 | 16.1% |
| $200,000+ | 31 | 3.0% |
Household Income by Householder Age in Liberty City
The median household income in Liberty City is $64,153, with the highest median household income of $80,625 found in the 25 to 44 years age bracket for the primary householder. A total of 349 households (33.3%) fall into this category. Meanwhile, the 15 to 24 years age bracket for the primary householder has the lowest median household income of $0, with 53 households (5.1%) in this group.
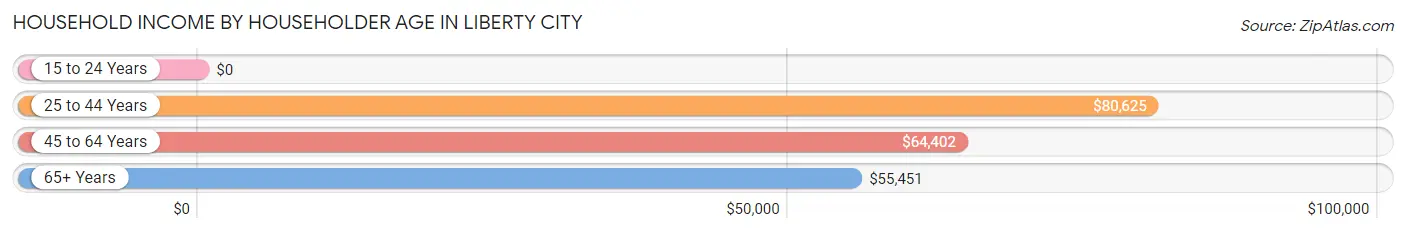
| Income Bracket | # Households | Median Income |
| 15 to 24 Years | 53 (5.1%) | $0 |
| 25 to 44 Years | 349 (33.3%) | $80,625 |
| 45 to 64 Years | 219 (20.9%) | $64,402 |
| 65+ Years | 427 (40.7%) | $55,451 |
| Total | 1,048 (100.0%) | $64,153 |
Poverty in Liberty City
Income Below Poverty by Sex and Age in Liberty City
With 1.1% poverty level for males and 5.8% for females among the residents of Liberty City, 6 to 11 year old males and under 5 year old females are the most vulnerable to poverty, with 16 males (14.7%) and 42 females (45.2%) in their respective age groups living below the poverty level.
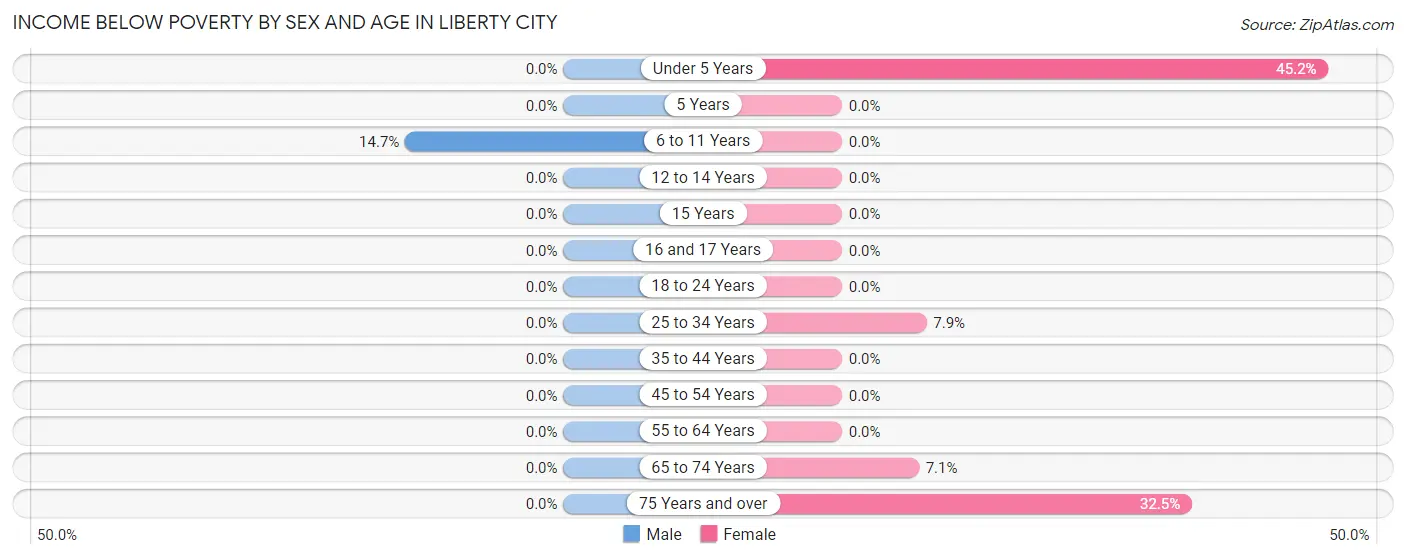
| Age Bracket | Male | Female |
| Under 5 Years | 0 (0.0%) | 42 (45.2%) |
| 5 Years | 0 (0.0%) | 0 (0.0%) |
| 6 to 11 Years | 16 (14.7%) | 0 (0.0%) |
| 12 to 14 Years | 0 (0.0%) | 0 (0.0%) |
| 15 Years | 0 (0.0%) | 0 (0.0%) |
| 16 and 17 Years | 0 (0.0%) | 0 (0.0%) |
| 18 to 24 Years | 0 (0.0%) | 0 (0.0%) |
| 25 to 34 Years | 0 (0.0%) | 23 (7.9%) |
| 35 to 44 Years | 0 (0.0%) | 0 (0.0%) |
| 45 to 54 Years | 0 (0.0%) | 0 (0.0%) |
| 55 to 64 Years | 0 (0.0%) | 0 (0.0%) |
| 65 to 74 Years | 0 (0.0%) | 12 (7.1%) |
| 75 Years and over | 0 (0.0%) | 13 (32.5%) |
| Total | 16 (1.1%) | 90 (5.8%) |
Income Above Poverty by Sex and Age in Liberty City
According to the poverty statistics in Liberty City, males aged under 5 years and females aged 5 years are the age groups that are most secure financially, with 100.0% of males and 100.0% of females in these age groups living above the poverty line.
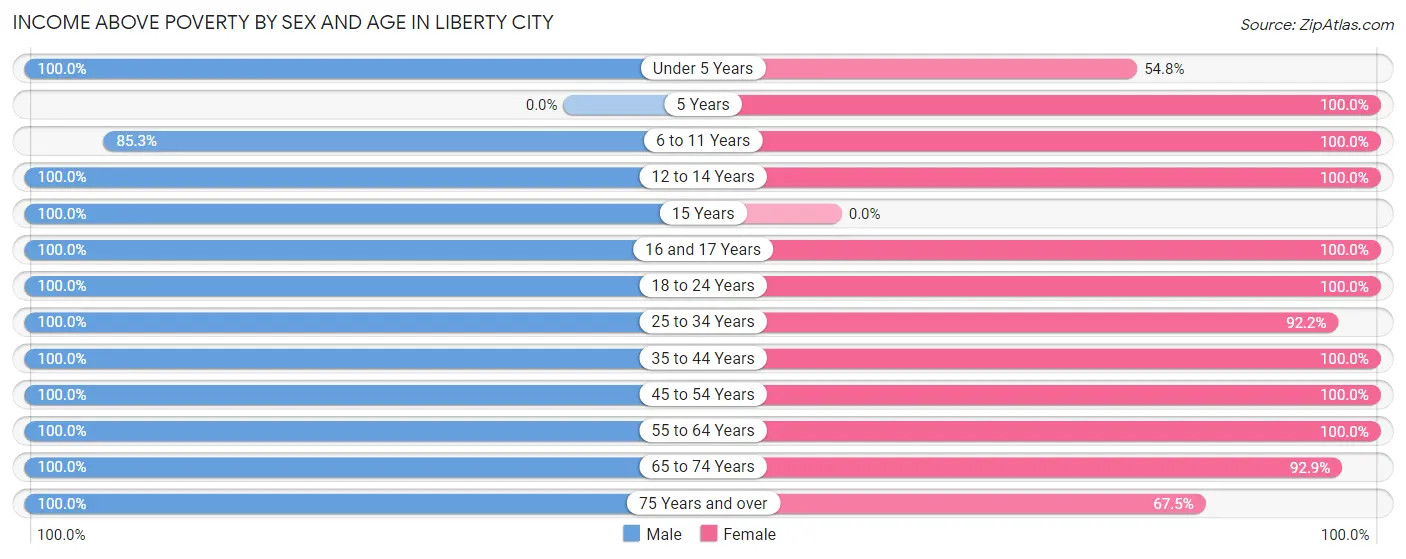
| Age Bracket | Male | Female |
| Under 5 Years | 112 (100.0%) | 51 (54.8%) |
| 5 Years | 0 (0.0%) | 74 (100.0%) |
| 6 to 11 Years | 93 (85.3%) | 225 (100.0%) |
| 12 to 14 Years | 35 (100.0%) | 93 (100.0%) |
| 15 Years | 31 (100.0%) | 0 (0.0%) |
| 16 and 17 Years | 57 (100.0%) | 69 (100.0%) |
| 18 to 24 Years | 70 (100.0%) | 146 (100.0%) |
| 25 to 34 Years | 208 (100.0%) | 270 (92.1%) |
| 35 to 44 Years | 172 (100.0%) | 77 (100.0%) |
| 45 to 54 Years | 100 (100.0%) | 139 (100.0%) |
| 55 to 64 Years | 92 (100.0%) | 144 (100.0%) |
| 65 to 74 Years | 375 (100.0%) | 156 (92.9%) |
| 75 Years and over | 69 (100.0%) | 27 (67.5%) |
| Total | 1,414 (98.9%) | 1,471 (94.2%) |
Income Below Poverty Among Married-Couple Families in Liberty City
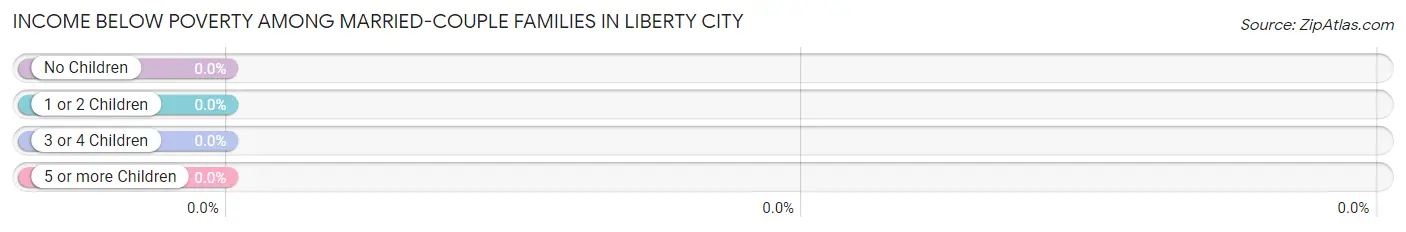
| Children | Above Poverty | Below Poverty |
| No Children | 365 (100.0%) | 0 (0.0%) |
| 1 or 2 Children | 245 (100.0%) | 0 (0.0%) |
| 3 or 4 Children | 97 (100.0%) | 0 (0.0%) |
| 5 or more Children | 0 (0.0%) | 0 (0.0%) |
| Total | 707 (100.0%) | 0 (0.0%) |
Income Below Poverty Among Single-Parent Households in Liberty City
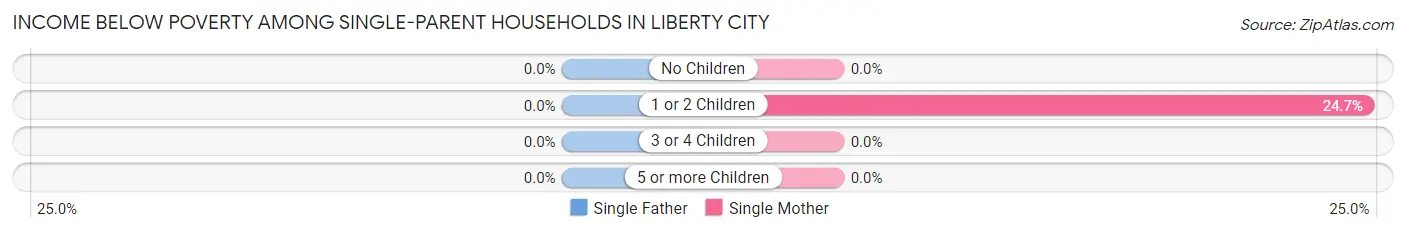
| Children | Single Father | Single Mother |
| No Children | 0 (0.0%) | 0 (0.0%) |
| 1 or 2 Children | 0 (0.0%) | 23 (24.7%) |
| 3 or 4 Children | 0 (0.0%) | 0 (0.0%) |
| 5 or more Children | 0 (0.0%) | 0 (0.0%) |
| Total | 0 (0.0%) | 23 (18.9%) |
Income Below Poverty Among Married-Couple vs Single-Parent Households in Liberty City
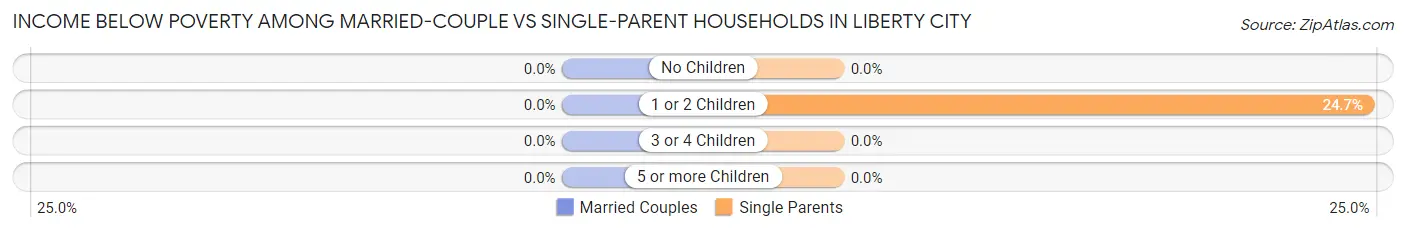
| Children | Married-Couple Families | Single-Parent Households |
| No Children | 0 (0.0%) | 0 (0.0%) |
| 1 or 2 Children | 0 (0.0%) | 23 (24.7%) |
| 3 or 4 Children | 0 (0.0%) | 0 (0.0%) |
| 5 or more Children | 0 (0.0%) | 0 (0.0%) |
| Total | 0 (0.0%) | 23 (14.6%) |
Race in Liberty City
The most populous races in Liberty City are White / Caucasian (2,856 | 95.5%), Hispanic or Latino (195 | 6.5%), and Black / African American (95 | 3.2%).
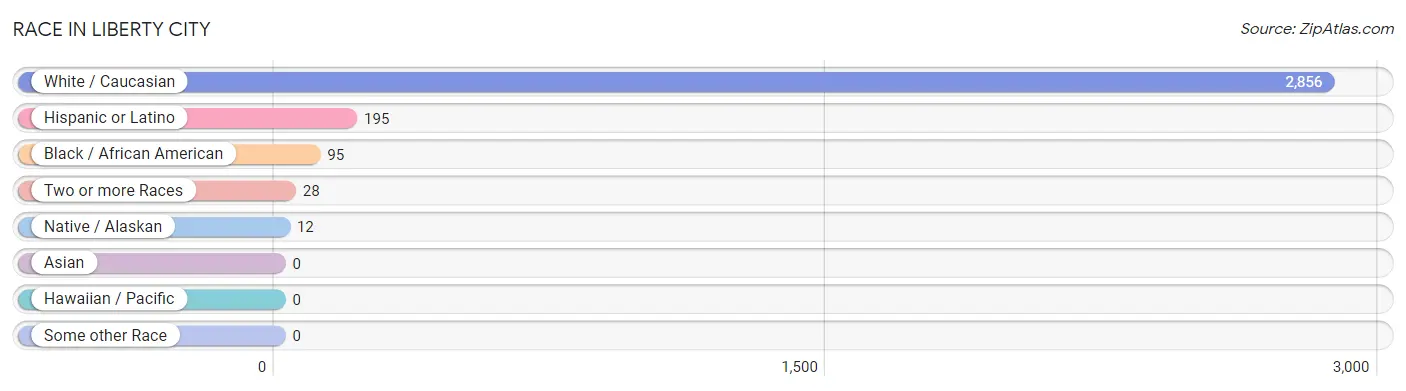
| Race | # Population | % Population |
| Asian | 0 | 0.0% |
| Black / African American | 95 | 3.2% |
| Hawaiian / Pacific | 0 | 0.0% |
| Hispanic or Latino | 195 | 6.5% |
| Native / Alaskan | 12 | 0.4% |
| White / Caucasian | 2,856 | 95.5% |
| Two or more Races | 28 | 0.9% |
| Some other Race | 0 | 0.0% |
| Total | 2,991 | 100.0% |
Ancestry in Liberty City
The most populous ancestries reported in Liberty City are American (947 | 31.7%), English (821 | 27.5%), German (305 | 10.2%), Irish (294 | 9.8%), and Scotch-Irish (171 | 5.7%), together accounting for 84.9% of all Liberty City residents.
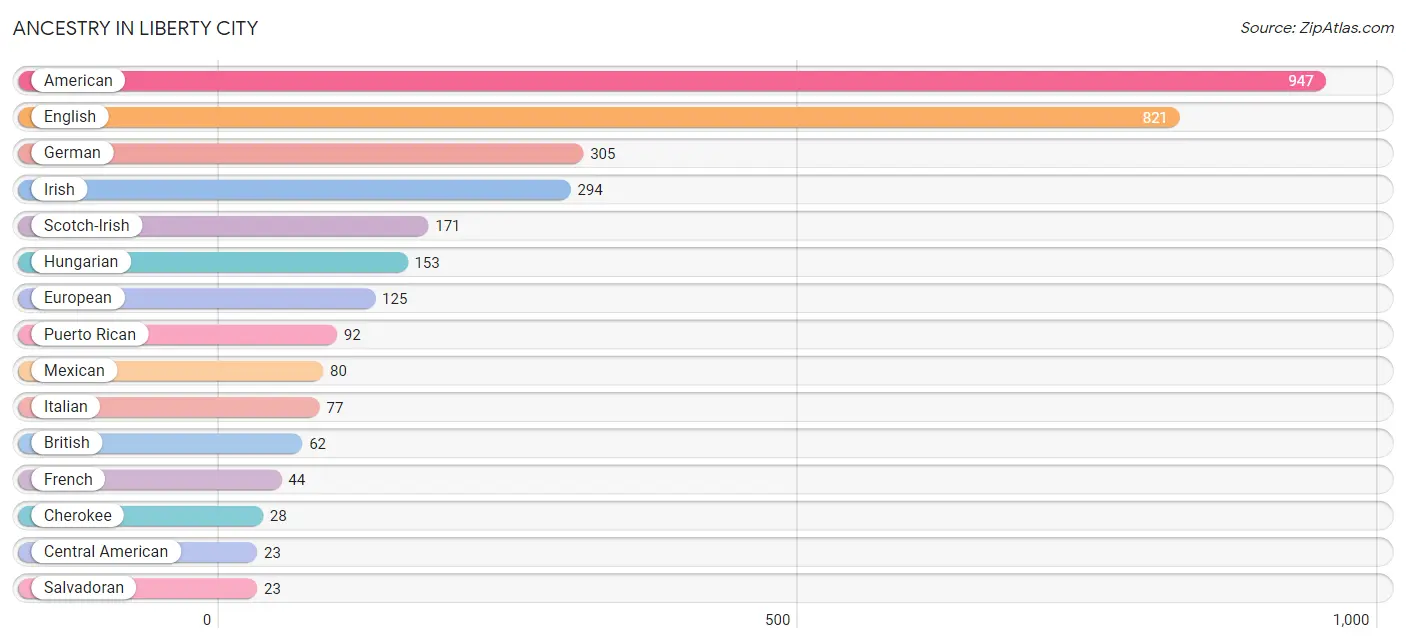
| Ancestry | # Population | % Population |
| American | 947 | 31.7% |
| Blackfeet | 4 | 0.1% |
| British | 62 | 2.1% |
| Central American | 23 | 0.8% |
| Cherokee | 28 | 0.9% |
| Choctaw | 12 | 0.4% |
| Czech | 14 | 0.5% |
| Danish | 13 | 0.4% |
| English | 821 | 27.5% |
| European | 125 | 4.2% |
| French | 44 | 1.5% |
| German | 305 | 10.2% |
| Hungarian | 153 | 5.1% |
| Irish | 294 | 9.8% |
| Italian | 77 | 2.6% |
| Mexican | 80 | 2.7% |
| Norwegian | 13 | 0.4% |
| Puerto Rican | 92 | 3.1% |
| Salvadoran | 23 | 0.8% |
| Scotch-Irish | 171 | 5.7% |
| Scottish | 23 | 0.8% | View All 21 Rows |
Immigrants in Liberty City
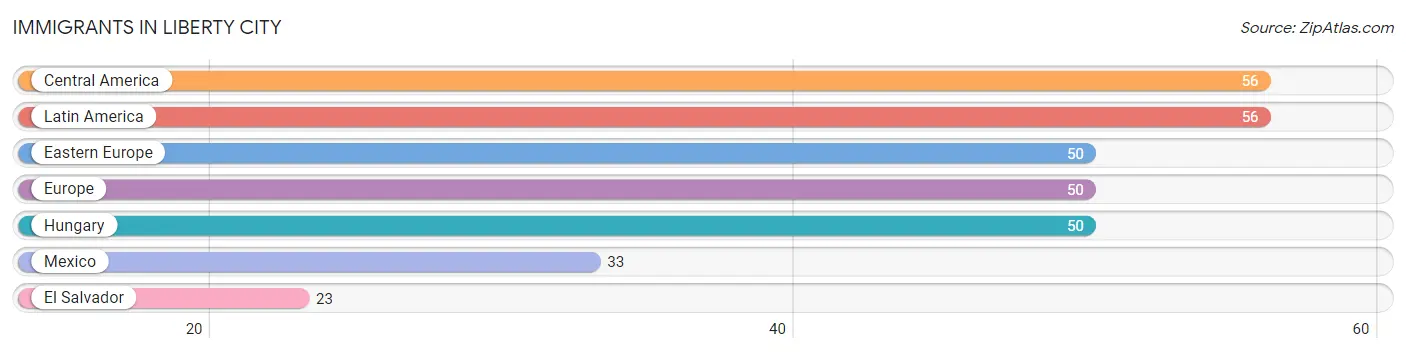
The most numerous immigrant groups reported in Liberty City came from Central America (56 | 1.9%), Latin America (56 | 1.9%), Eastern Europe (50 | 1.7%), Europe (50 | 1.7%), and Hungary (50 | 1.7%), together accounting for 8.7% of all Liberty City residents.
| Immigration Origin | # Population | % Population |
| Central America | 56 | 1.9% |
| Eastern Europe | 50 | 1.7% |
| El Salvador | 23 | 0.8% |
| Europe | 50 | 1.7% |
| Hungary | 50 | 1.7% |
| Latin America | 56 | 1.9% |
| Mexico | 33 | 1.1% | View All 7 Rows |
Sex and Age in Liberty City
Sex and Age in Liberty City
The most populous age groups in Liberty City are 70 to 74 Years (230 | 16.1%) for men and 5 to 9 Years (220 | 14.1%) for women.
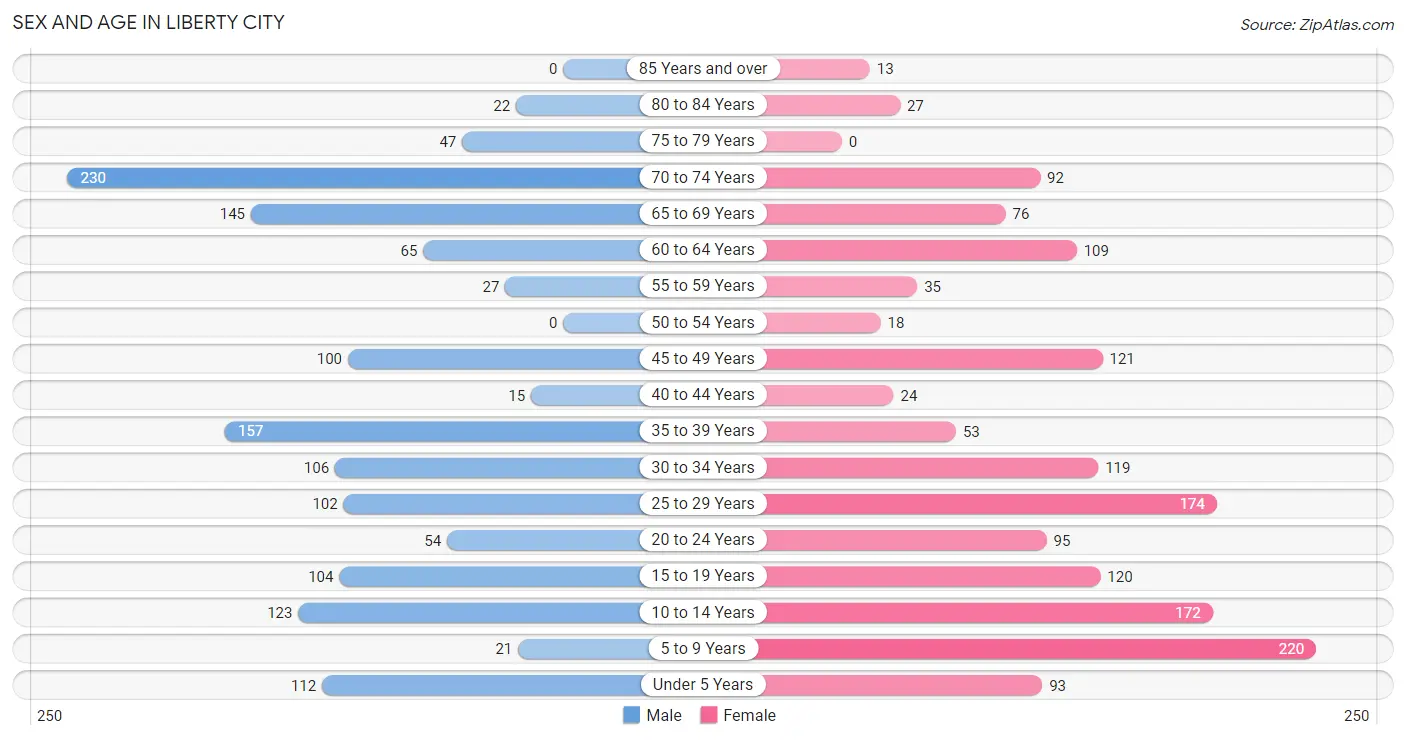
| Age Bracket | Male | Female |
| Under 5 Years | 112 (7.8%) | 93 (6.0%) |
| 5 to 9 Years | 21 (1.5%) | 220 (14.1%) |
| 10 to 14 Years | 123 (8.6%) | 172 (11.0%) |
| 15 to 19 Years | 104 (7.3%) | 120 (7.7%) |
| 20 to 24 Years | 54 (3.8%) | 95 (6.1%) |
| 25 to 29 Years | 102 (7.1%) | 174 (11.2%) |
| 30 to 34 Years | 106 (7.4%) | 119 (7.6%) |
| 35 to 39 Years | 157 (11.0%) | 53 (3.4%) |
| 40 to 44 Years | 15 (1.1%) | 24 (1.5%) |
| 45 to 49 Years | 100 (7.0%) | 121 (7.7%) |
| 50 to 54 Years | 0 (0.0%) | 18 (1.1%) |
| 55 to 59 Years | 27 (1.9%) | 35 (2.2%) |
| 60 to 64 Years | 65 (4.5%) | 109 (7.0%) |
| 65 to 69 Years | 145 (10.1%) | 76 (4.9%) |
| 70 to 74 Years | 230 (16.1%) | 92 (5.9%) |
| 75 to 79 Years | 47 (3.3%) | 0 (0.0%) |
| 80 to 84 Years | 22 (1.5%) | 27 (1.7%) |
| 85 Years and over | 0 (0.0%) | 13 (0.8%) |
| Total | 1,430 (100.0%) | 1,561 (100.0%) |
Families and Households in Liberty City
Median Family Size in Liberty City
The median family size in Liberty City is 3.20 persons per family, with married-couple families (707 | 81.8%) accounting for the largest median family size of 3.36 persons per family. On the other hand, single male/father families (35 | 4.1%) represent the smallest median family size with 1.77 persons per family.
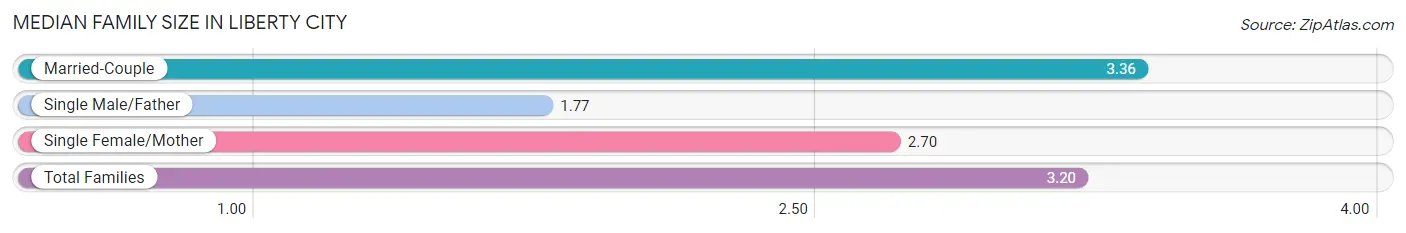
| Family Type | # Families | Family Size |
| Married-Couple | 707 (81.8%) | 3.36 |
| Single Male/Father | 35 (4.1%) | 1.77 |
| Single Female/Mother | 122 (14.1%) | 2.70 |
| Total Families | 864 (100.0%) | 3.20 |
Median Household Size in Liberty City
The median household size in Liberty City is 2.85 persons per household, with married-couple households (707 | 67.5%) accounting for the largest median household size of 3.36 persons per household. non-family households (184 | 17.6%) represent the smallest median household size with 1.23 persons per household.
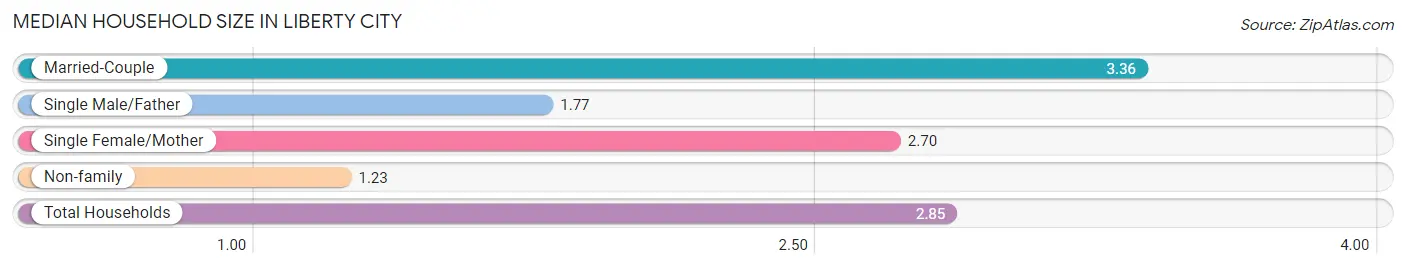
| Household Type | # Households | Household Size |
| Married-Couple | 707 (67.5%) | 3.36 |
| Single Male/Father | 35 (3.3%) | 1.77 |
| Single Female/Mother | 122 (11.6%) | 2.70 |
| Non-family | 184 (17.6%) | 1.23 |
| Total Households | 1,048 (100.0%) | 2.85 |
Household Size by Marriage Status in Liberty City
Out of a total of 1,048 households in Liberty City, 864 (82.4%) are family households, while 184 (17.6%) are nonfamily households. The most numerous type of family households are 2-person households, comprising 359, and the most common type of nonfamily households are 1-person households, comprising 144.
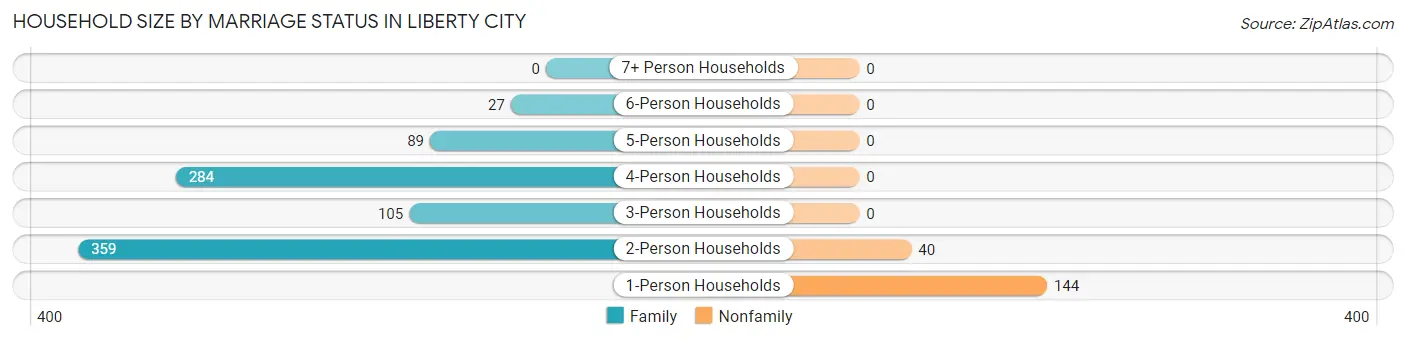
| Household Size | Family Households | Nonfamily Households |
| 1-Person Households | - | 144 (13.7%) |
| 2-Person Households | 359 (34.3%) | 40 (3.8%) |
| 3-Person Households | 105 (10.0%) | 0 (0.0%) |
| 4-Person Households | 284 (27.1%) | 0 (0.0%) |
| 5-Person Households | 89 (8.5%) | 0 (0.0%) |
| 6-Person Households | 27 (2.6%) | 0 (0.0%) |
| 7+ Person Households | 0 (0.0%) | 0 (0.0%) |
| Total | 864 (82.4%) | 184 (17.6%) |
Female Fertility in Liberty City
Fertility by Age in Liberty City
| Age Bracket | Women with Births | Births / 1,000 Women |
| 15 to 19 years | 0 (0.0%) | 0.0 |
| 20 to 34 years | 0 (0.0%) | 0.0 |
| 35 to 50 years | 0 (0.0%) | 0.0 |
| Total | 0 (0.0%) | 0.0 |
Fertility by Age by Marriage Status in Liberty City
| Age Bracket | Married | Unmarried |
| 15 to 19 years | 0 (0.0%) | 0 (0.0%) |
| 20 to 34 years | 0 (0.0%) | 0 (0.0%) |
| 35 to 50 years | 0 (0.0%) | 0 (0.0%) |
| Total | 0 (0.0%) | 0 (0.0%) |
Fertility by Education in Liberty City
| Educational Attainment | Women with Births | Births / 1,000 Women |
| Less than High School | 0 (0.0%) | 0.0 |
| High School Diploma | 0 (0.0%) | 0.0 |
| College or Associate's Degree | 0 (0.0%) | 0.0 |
| Bachelor's Degree | 0 (0.0%) | 0.0 |
| Graduate Degree | 0 (0.0%) | 0.0 |
| Total | 0 (0.0%) | 0.0 |
Fertility by Education by Marriage Status in Liberty City
| Educational Attainment | Married | Unmarried |
| Less than High School | 0 (0.0%) | 0 (0.0%) |
| High School Diploma | 0 (0.0%) | 0 (0.0%) |
| College or Associate's Degree | 0 (0.0%) | 0 (0.0%) |
| Bachelor's Degree | 0 (0.0%) | 0 (0.0%) |
| Graduate Degree | 0 (0.0%) | 0 (0.0%) |
| Total | 0 (0.0%) | 0 (0.0%) |
Employment Characteristics in Liberty City
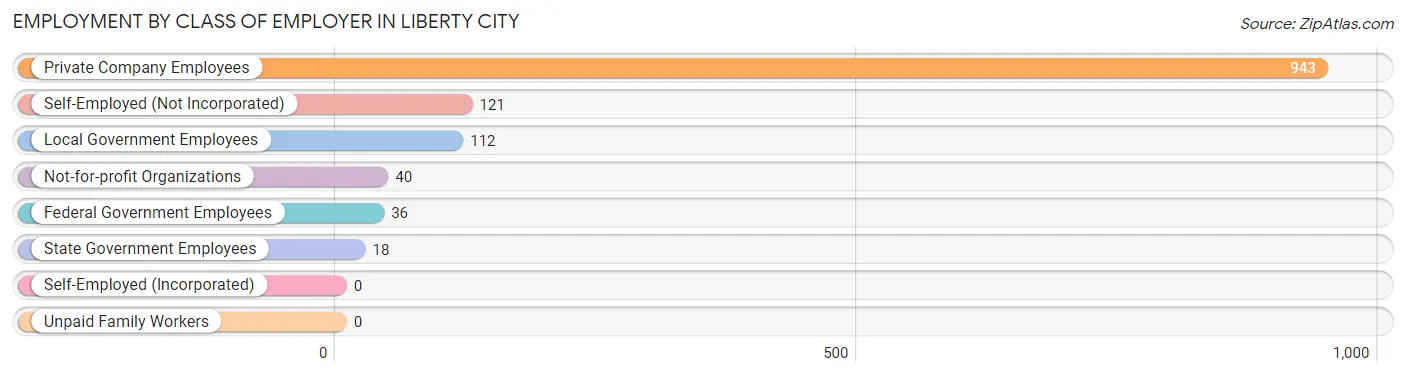
Employment by Class of Employer in Liberty City
Among the 1,270 employed individuals in Liberty City, private company employees (943 | 74.3%), self-employed (not incorporated) (121 | 9.5%), and local government employees (112 | 8.8%) make up the most common classes of employment.
| Employer Class | # Employees | % Employees |
| Private Company Employees | 943 | 74.3% |
| Self-Employed (Incorporated) | 0 | 0.0% |
| Self-Employed (Not Incorporated) | 121 | 9.5% |
| Not-for-profit Organizations | 40 | 3.2% |
| Local Government Employees | 112 | 8.8% |
| State Government Employees | 18 | 1.4% |
| Federal Government Employees | 36 | 2.8% |
| Unpaid Family Workers | 0 | 0.0% |
| Total | 1,270 | 100.0% |
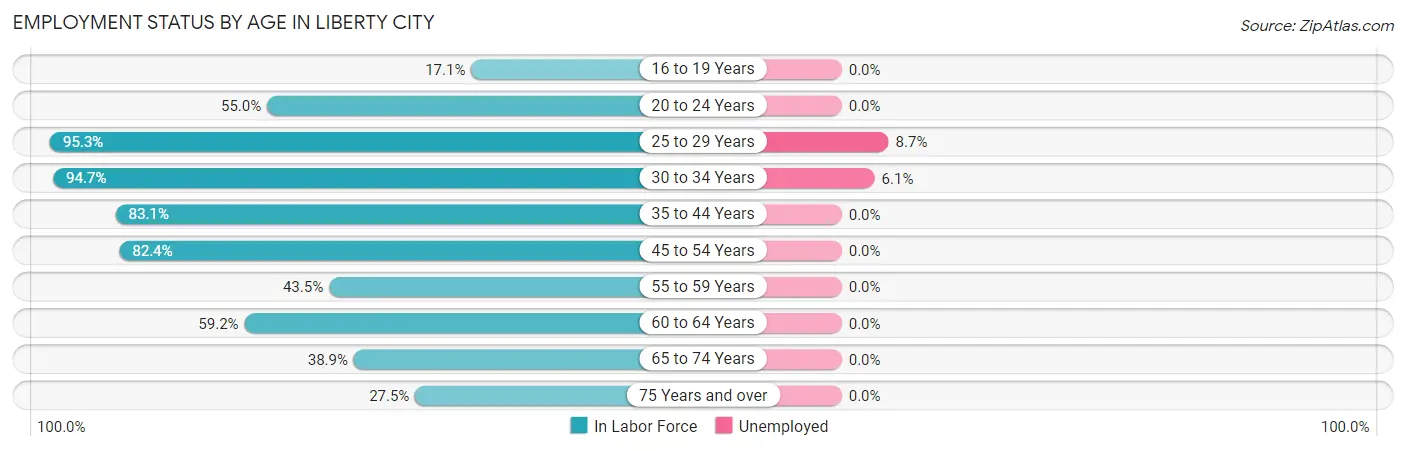
Employment Status by Age in Liberty City
According to the labor force statistics for Liberty City, out of the total population over 16 years of age (2,219), 61.6% or 1,367 individuals are in the labor force, with 2.6% or 36 of them unemployed. The age group with the highest labor force participation rate is 25 to 29 years, with 95.3% or 263 individuals in the labor force. Within the labor force, the 25 to 29 years age range has the highest percentage of unemployed individuals, with 8.7% or 23 of them being unemployed.
| Age Bracket | In Labor Force | Unemployed |
| 16 to 19 Years | 33 (17.1%) | 0 (0.0%) |
| 20 to 24 Years | 82 (55.0%) | 0 (0.0%) |
| 25 to 29 Years | 263 (95.3%) | 23 (8.7%) |
| 30 to 34 Years | 213 (94.7%) | 13 (6.1%) |
| 35 to 44 Years | 207 (83.1%) | 0 (0.0%) |
| 45 to 54 Years | 197 (82.4%) | 0 (0.0%) |
| 55 to 59 Years | 27 (43.5%) | 0 (0.0%) |
| 60 to 64 Years | 103 (59.2%) | 0 (0.0%) |
| 65 to 74 Years | 211 (38.9%) | 0 (0.0%) |
| 75 Years and over | 30 (27.5%) | 0 (0.0%) |
| Total | 1,367 (61.6%) | 36 (2.6%) |
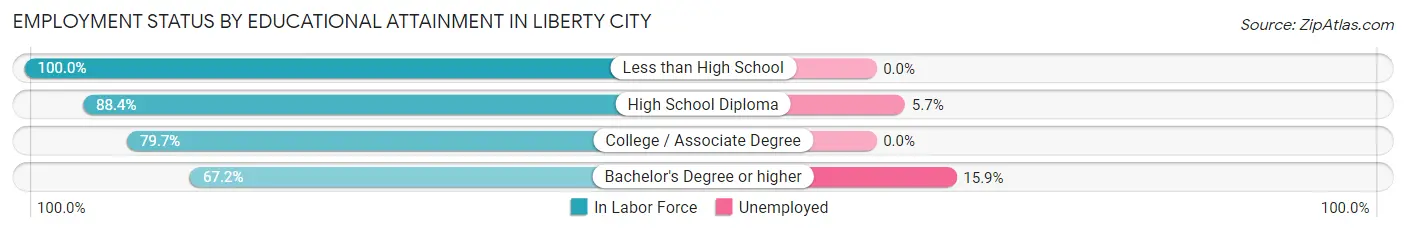
Employment Status by Educational Attainment in Liberty City
According to labor force statistics for Liberty City, 82.4% of individuals (1,009) out of the total population between 25 and 64 years of age (1,225) are in the labor force, with 3.6% or 36 of them being unemployed. The group with the highest labor force participation rate are those with the educational attainment of less than high school, with 100.0% or 47 individuals in the labor force. Within the labor force, individuals with bachelor's degree or higher education have the highest percentage of unemployment, with 15.9% or 13 of them being unemployed.
| Educational Attainment | In Labor Force | Unemployed |
| Less than High School | 47 (100.0%) | 0 (0.0%) |
| High School Diploma | 402 (88.4%) | 26 (5.7%) |
| College / Associate Degree | 479 (79.7%) | 0 (0.0%) |
| Bachelor's Degree or higher | 82 (67.2%) | 19 (15.9%) |
| Total | 1,009 (82.4%) | 44 (3.6%) |
Employment Occupations by Sex in Liberty City
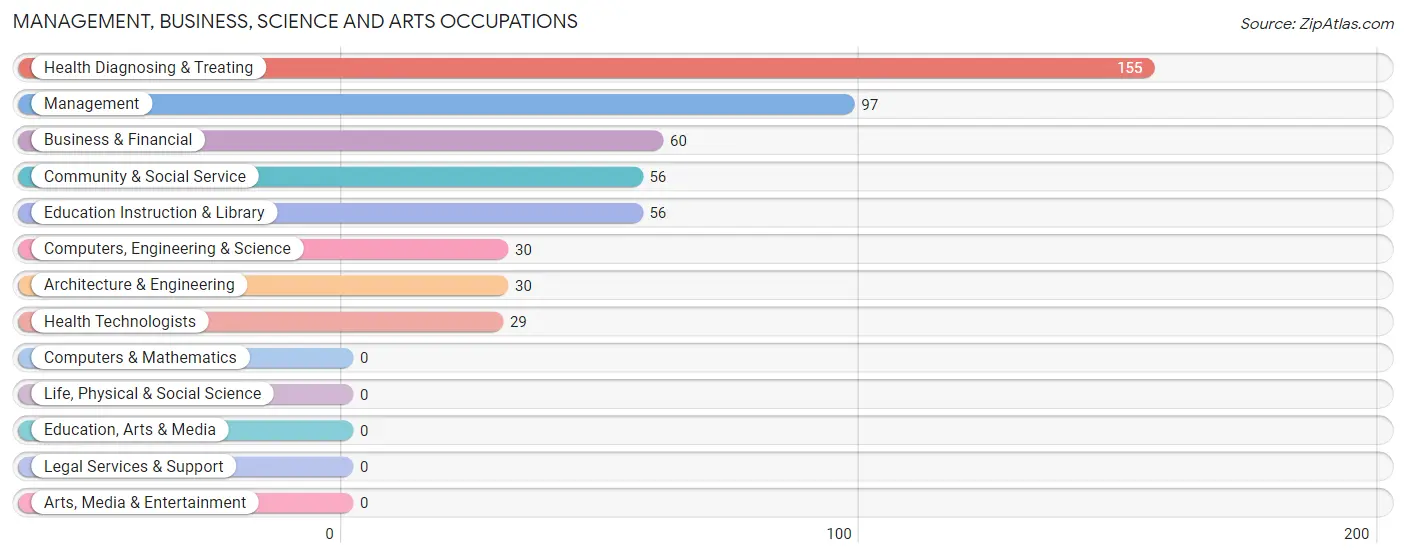
Management, Business, Science and Arts Occupations
The most common Management, Business, Science and Arts occupations in Liberty City are Health Diagnosing & Treating (155 | 11.7%), Management (97 | 7.3%), Business & Financial (60 | 4.5%), Community & Social Service (56 | 4.2%), and Education Instruction & Library (56 | 4.2%).
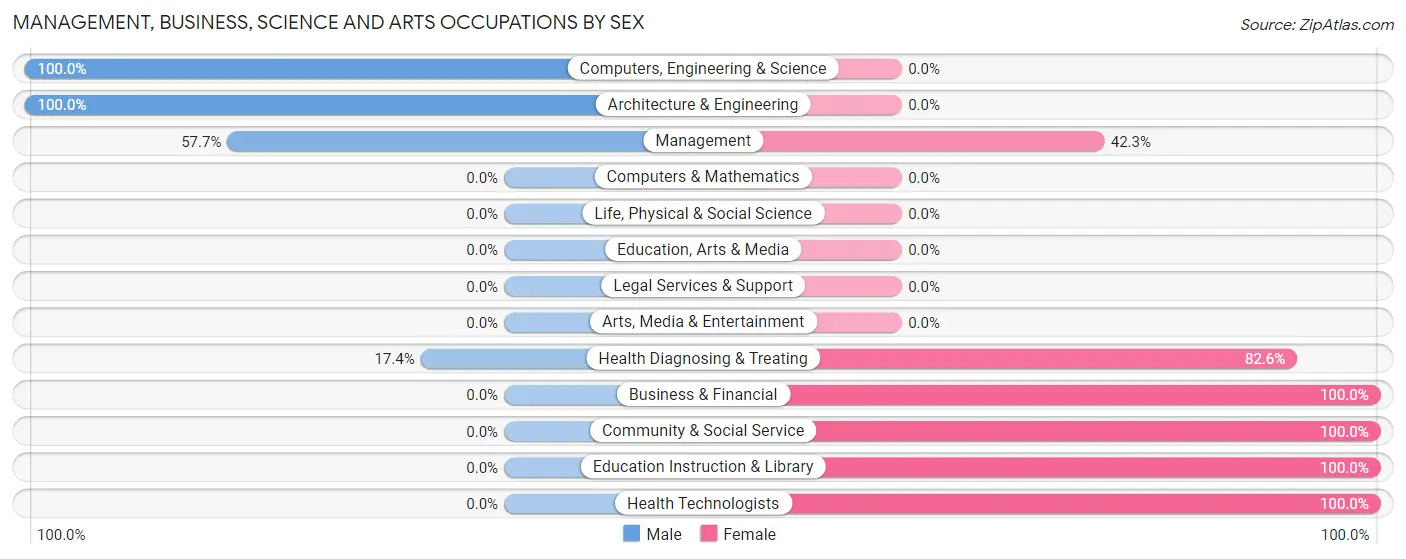
Management, Business, Science and Arts Occupations by Sex
Within the Management, Business, Science and Arts occupations in Liberty City, the most male-oriented occupations are Computers, Engineering & Science (100.0%), Architecture & Engineering (100.0%), and Management (57.7%), while the most female-oriented occupations are Business & Financial (100.0%), Community & Social Service (100.0%), and Education Instruction & Library (100.0%).
| Occupation | Male | Female |
| Management | 56 (57.7%) | 41 (42.3%) |
| Business & Financial | 0 (0.0%) | 60 (100.0%) |
| Computers, Engineering & Science | 30 (100.0%) | 0 (0.0%) |
| Computers & Mathematics | 0 (0.0%) | 0 (0.0%) |
| Architecture & Engineering | 30 (100.0%) | 0 (0.0%) |
| Life, Physical & Social Science | 0 (0.0%) | 0 (0.0%) |
| Community & Social Service | 0 (0.0%) | 56 (100.0%) |
| Education, Arts & Media | 0 (0.0%) | 0 (0.0%) |
| Legal Services & Support | 0 (0.0%) | 0 (0.0%) |
| Education Instruction & Library | 0 (0.0%) | 56 (100.0%) |
| Arts, Media & Entertainment | 0 (0.0%) | 0 (0.0%) |
| Health Diagnosing & Treating | 27 (17.4%) | 128 (82.6%) |
| Health Technologists | 0 (0.0%) | 29 (100.0%) |
| Total (Category) | 113 (28.4%) | 285 (71.6%) |
| Total (Overall) | 793 (59.6%) | 537 (40.4%) |
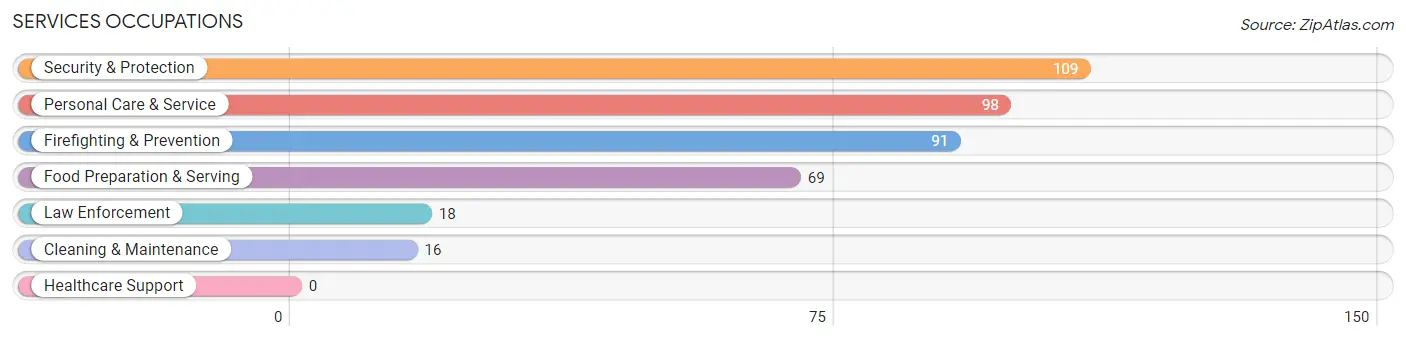
Services Occupations
The most common Services occupations in Liberty City are Security & Protection (109 | 8.2%), Personal Care & Service (98 | 7.4%), Firefighting & Prevention (91 | 6.8%), Food Preparation & Serving (69 | 5.2%), and Law Enforcement (18 | 1.3%).
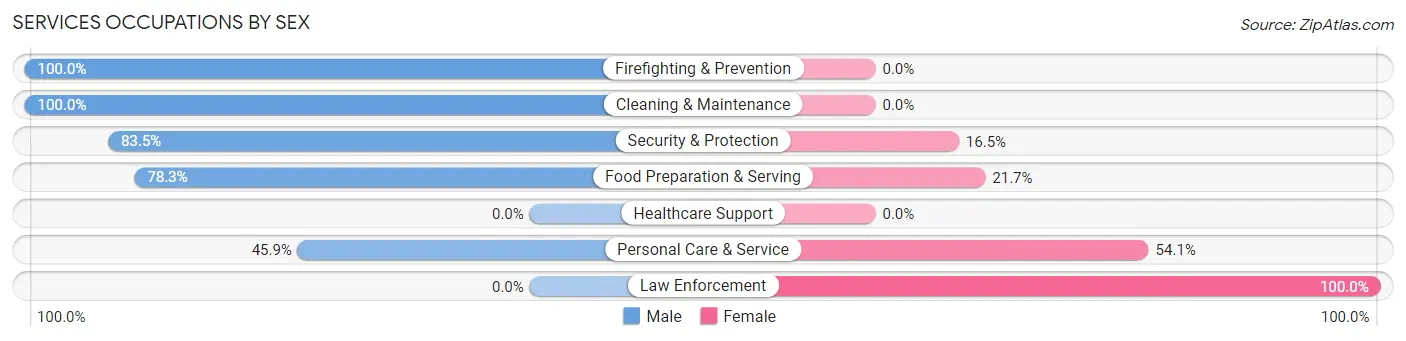
Services Occupations by Sex
Within the Services occupations in Liberty City, the most male-oriented occupations are Firefighting & Prevention (100.0%), Cleaning & Maintenance (100.0%), and Security & Protection (83.5%), while the most female-oriented occupations are Law Enforcement (100.0%), Personal Care & Service (54.1%), and Food Preparation & Serving (21.7%).
| Occupation | Male | Female |
| Healthcare Support | 0 (0.0%) | 0 (0.0%) |
| Security & Protection | 91 (83.5%) | 18 (16.5%) |
| Firefighting & Prevention | 91 (100.0%) | 0 (0.0%) |
| Law Enforcement | 0 (0.0%) | 18 (100.0%) |
| Food Preparation & Serving | 54 (78.3%) | 15 (21.7%) |
| Cleaning & Maintenance | 16 (100.0%) | 0 (0.0%) |
| Personal Care & Service | 45 (45.9%) | 53 (54.1%) |
| Total (Category) | 206 (70.6%) | 86 (29.4%) |
| Total (Overall) | 793 (59.6%) | 537 (40.4%) |
Sales and Office Occupations
The most common Sales and Office occupations in Liberty City are Sales & Related (139 | 10.4%), and Office & Administration (49 | 3.7%).
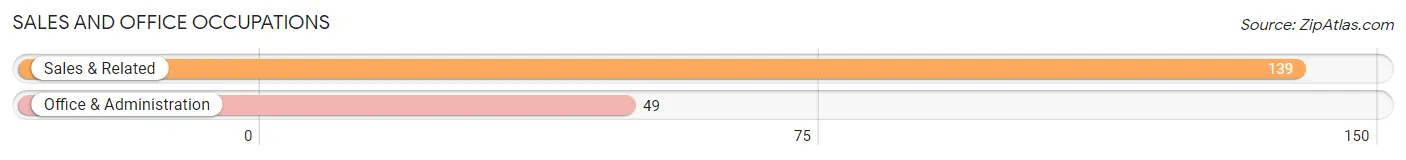
Sales and Office Occupations by Sex
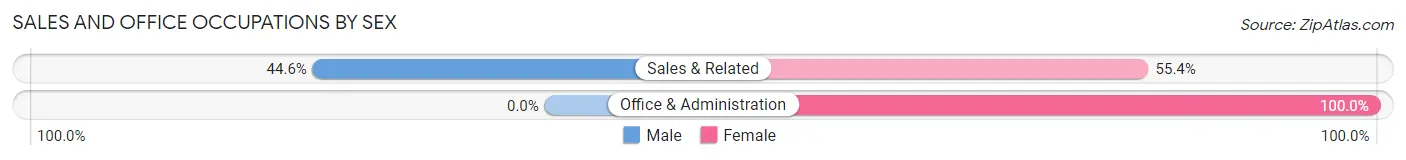
| Occupation | Male | Female |
| Sales & Related | 62 (44.6%) | 77 (55.4%) |
| Office & Administration | 0 (0.0%) | 49 (100.0%) |
| Total (Category) | 62 (33.0%) | 126 (67.0%) |
| Total (Overall) | 793 (59.6%) | 537 (40.4%) |
Natural Resources, Construction and Maintenance Occupations
The most common Natural Resources, Construction and Maintenance occupations in Liberty City are Construction & Extraction (89 | 6.7%), and Installation, Maintenance & Repair (77 | 5.8%).
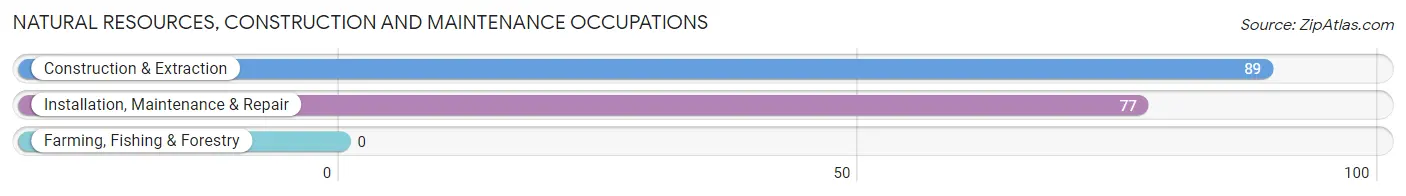
Natural Resources, Construction and Maintenance Occupations by Sex
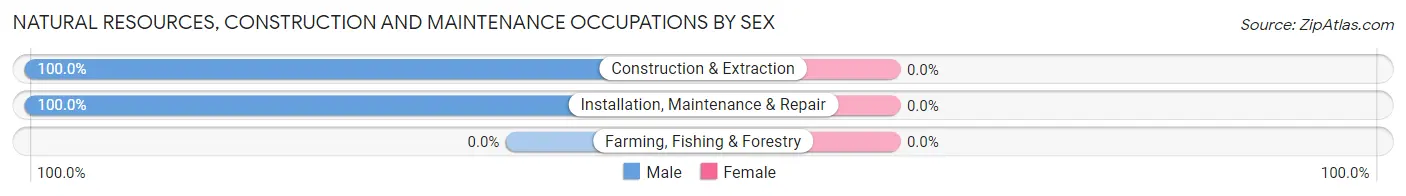
| Occupation | Male | Female |
| Farming, Fishing & Forestry | 0 (0.0%) | 0 (0.0%) |
| Construction & Extraction | 89 (100.0%) | 0 (0.0%) |
| Installation, Maintenance & Repair | 77 (100.0%) | 0 (0.0%) |
| Total (Category) | 166 (100.0%) | 0 (0.0%) |
| Total (Overall) | 793 (59.6%) | 537 (40.4%) |
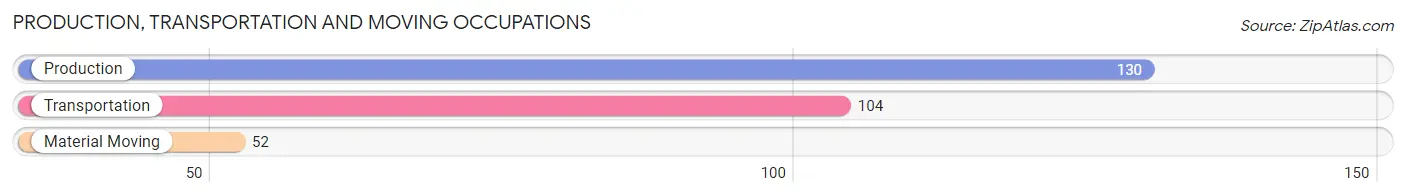
Production, Transportation and Moving Occupations
The most common Production, Transportation and Moving occupations in Liberty City are Production (130 | 9.8%), Transportation (104 | 7.8%), and Material Moving (52 | 3.9%).
Production, Transportation and Moving Occupations by Sex
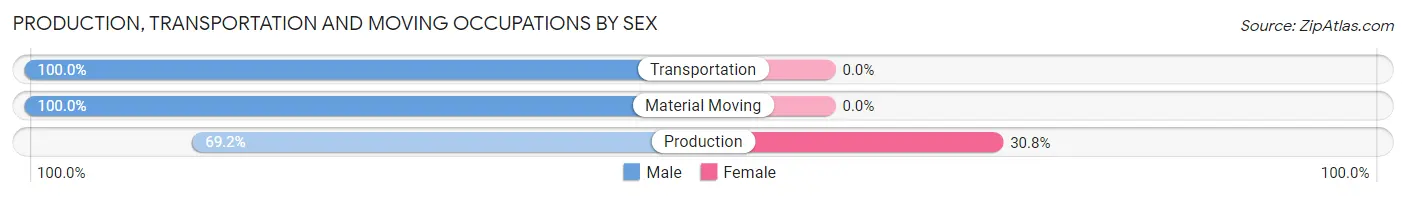
| Occupation | Male | Female |
| Production | 90 (69.2%) | 40 (30.8%) |
| Transportation | 104 (100.0%) | 0 (0.0%) |
| Material Moving | 52 (100.0%) | 0 (0.0%) |
| Total (Category) | 246 (86.0%) | 40 (14.0%) |
| Total (Overall) | 793 (59.6%) | 537 (40.4%) |
Employment Industries by Sex in Liberty City
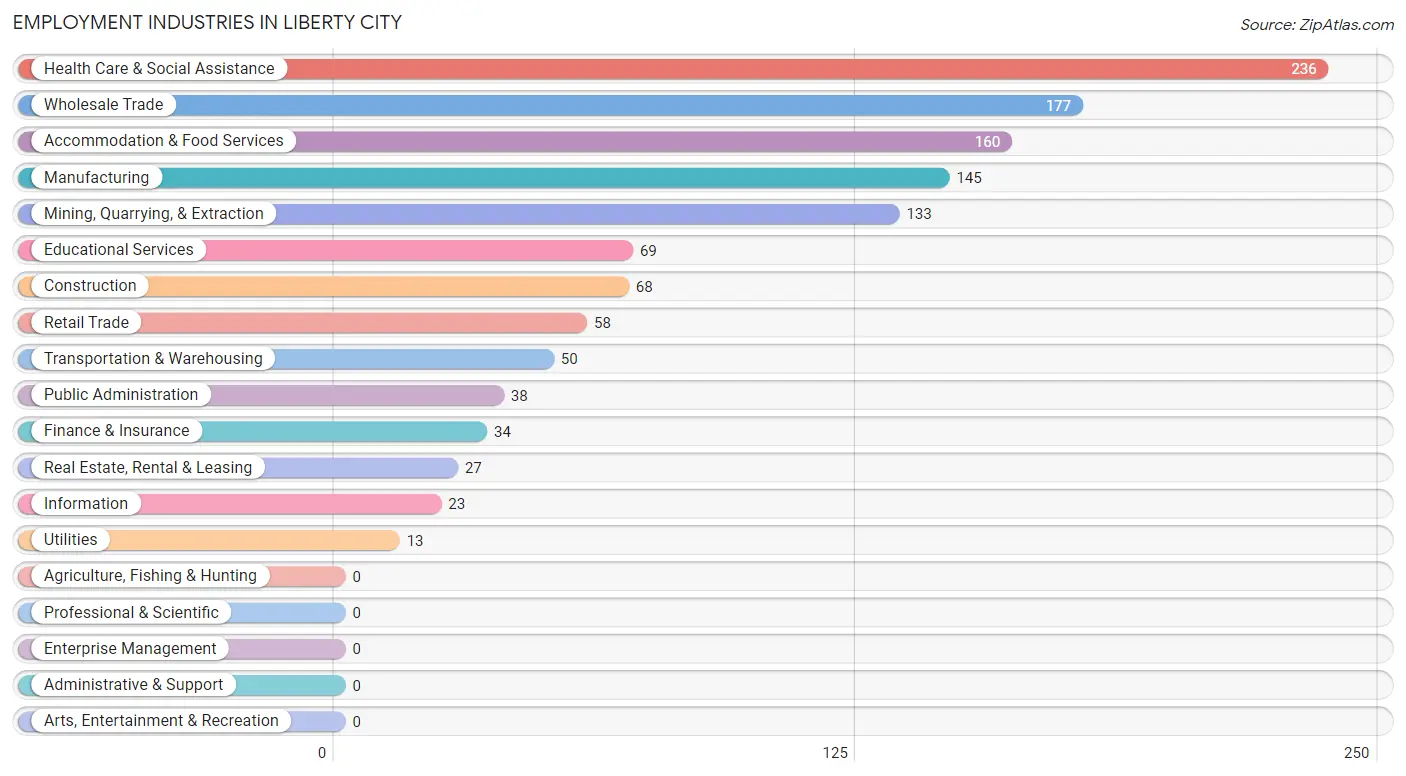
Employment Industries in Liberty City
The major employment industries in Liberty City include Health Care & Social Assistance (236 | 17.7%), Wholesale Trade (177 | 13.3%), Accommodation & Food Services (160 | 12.0%), Manufacturing (145 | 10.9%), and Mining, Quarrying, & Extraction (133 | 10.0%).
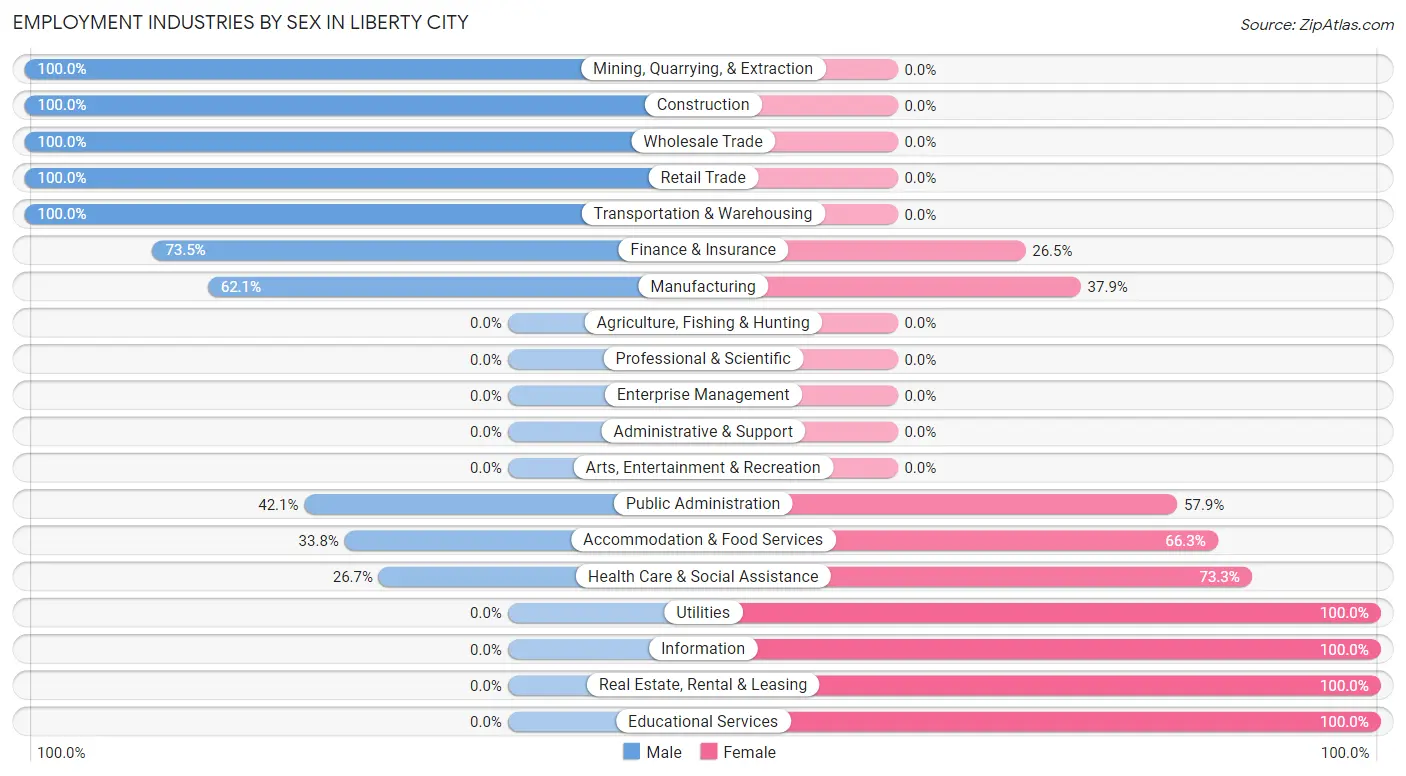
Employment Industries by Sex in Liberty City
The Liberty City industries that see more men than women are Mining, Quarrying, & Extraction (100.0%), Construction (100.0%), and Wholesale Trade (100.0%), whereas the industries that tend to have a higher number of women are Utilities (100.0%), Information (100.0%), and Real Estate, Rental & Leasing (100.0%).
| Industry | Male | Female |
| Agriculture, Fishing & Hunting | 0 (0.0%) | 0 (0.0%) |
| Mining, Quarrying, & Extraction | 133 (100.0%) | 0 (0.0%) |
| Construction | 68 (100.0%) | 0 (0.0%) |
| Manufacturing | 90 (62.1%) | 55 (37.9%) |
| Wholesale Trade | 177 (100.0%) | 0 (0.0%) |
| Retail Trade | 58 (100.0%) | 0 (0.0%) |
| Transportation & Warehousing | 50 (100.0%) | 0 (0.0%) |
| Utilities | 0 (0.0%) | 13 (100.0%) |
| Information | 0 (0.0%) | 23 (100.0%) |
| Finance & Insurance | 25 (73.5%) | 9 (26.5%) |
| Real Estate, Rental & Leasing | 0 (0.0%) | 27 (100.0%) |
| Professional & Scientific | 0 (0.0%) | 0 (0.0%) |
| Enterprise Management | 0 (0.0%) | 0 (0.0%) |
| Administrative & Support | 0 (0.0%) | 0 (0.0%) |
| Educational Services | 0 (0.0%) | 69 (100.0%) |
| Health Care & Social Assistance | 63 (26.7%) | 173 (73.3%) |
| Arts, Entertainment & Recreation | 0 (0.0%) | 0 (0.0%) |
| Accommodation & Food Services | 54 (33.8%) | 106 (66.2%) |
| Public Administration | 16 (42.1%) | 22 (57.9%) |
| Total | 793 (59.6%) | 537 (40.4%) |
Education in Liberty City
School Enrollment in Liberty City
The most common levels of schooling among the 738 students in Liberty City are elementary school (231 | 31.3%), middle school (178 | 24.1%), and college / undergraduate (116 | 15.7%).
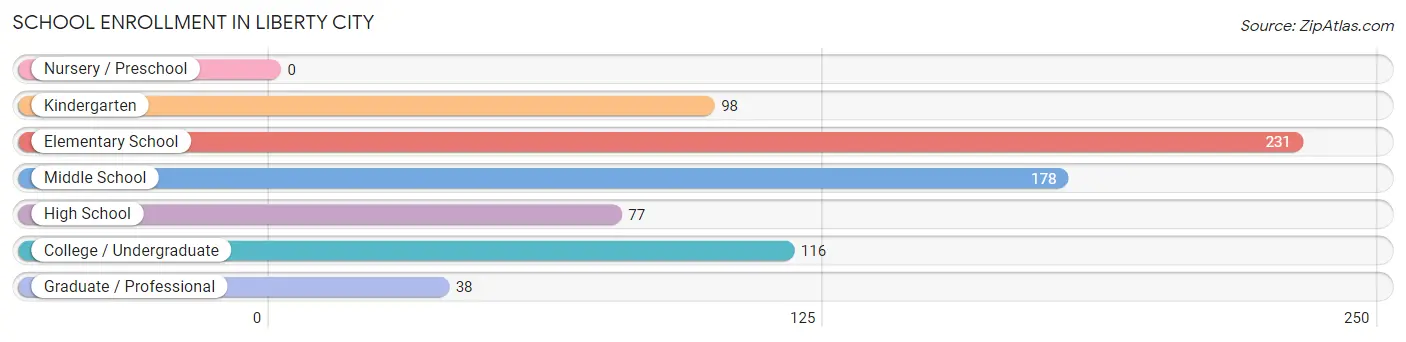
| School Level | # Students | % Students |
| Nursery / Preschool | 0 | 0.0% |
| Kindergarten | 98 | 13.3% |
| Elementary School | 231 | 31.3% |
| Middle School | 178 | 24.1% |
| High School | 77 | 10.4% |
| College / Undergraduate | 116 | 15.7% |
| Graduate / Professional | 38 | 5.1% |
| Total | 738 | 100.0% |
School Enrollment by Age by Funding Source in Liberty City
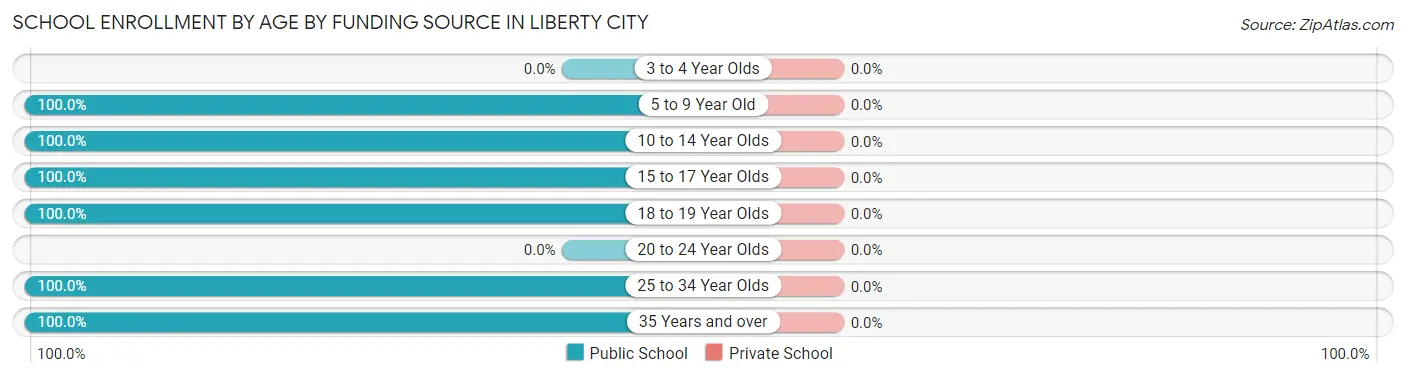
| Age Bracket | Public School | Private School |
| 3 to 4 Year Olds | 0 (0.0%) | 0 (0.0%) |
| 5 to 9 Year Old | 241 (100.0%) | 0 (0.0%) |
| 10 to 14 Year Olds | 295 (100.0%) | 0 (0.0%) |
| 15 to 17 Year Olds | 48 (100.0%) | 0 (0.0%) |
| 18 to 19 Year Olds | 29 (100.0%) | 0 (0.0%) |
| 20 to 24 Year Olds | 0 (0.0%) | 0 (0.0%) |
| 25 to 34 Year Olds | 87 (100.0%) | 0 (0.0%) |
| 35 Years and over | 38 (100.0%) | 0 (0.0%) |
| Total | 738 (100.0%) | 0 (0.0%) |
Educational Attainment by Field of Study in Liberty City
Business (138 | 37.2%), education (133 | 35.8%), communications (31 | 8.4%), arts & humanities (19 | 5.1%), and engineering (18 | 4.9%) are the most common fields of study among 371 individuals in Liberty City who have obtained a bachelor's degree or higher.
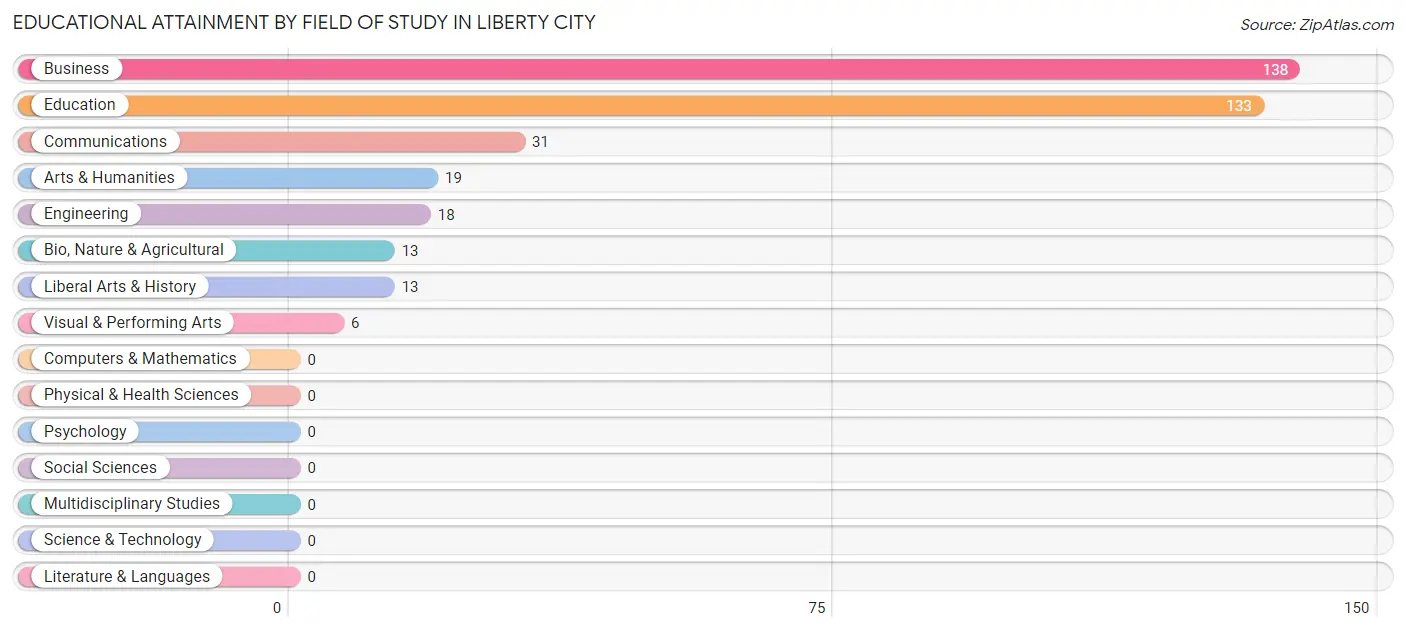
| Field of Study | # Graduates | % Graduates |
| Computers & Mathematics | 0 | 0.0% |
| Bio, Nature & Agricultural | 13 | 3.5% |
| Physical & Health Sciences | 0 | 0.0% |
| Psychology | 0 | 0.0% |
| Social Sciences | 0 | 0.0% |
| Engineering | 18 | 4.9% |
| Multidisciplinary Studies | 0 | 0.0% |
| Science & Technology | 0 | 0.0% |
| Business | 138 | 37.2% |
| Education | 133 | 35.8% |
| Literature & Languages | 0 | 0.0% |
| Liberal Arts & History | 13 | 3.5% |
| Visual & Performing Arts | 6 | 1.6% |
| Communications | 31 | 8.4% |
| Arts & Humanities | 19 | 5.1% |
| Total | 371 | 100.0% |
Transportation & Commute in Liberty City
Vehicle Availability by Sex in Liberty City
The most prevalent vehicle ownership categories in Liberty City are males with 2 vehicles (523, accounting for 71.4%) and females with 2 vehicles (326, making up 97.4%).
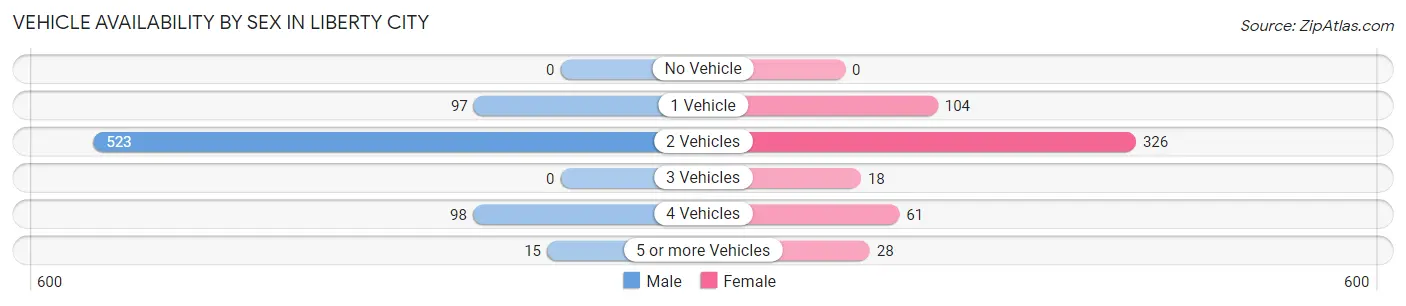
| Vehicles Available | Male | Female |
| No Vehicle | 0 (0.0%) | 0 (0.0%) |
| 1 Vehicle | 97 (13.2%) | 104 (19.4%) |
| 2 Vehicles | 523 (71.4%) | 326 (60.7%) |
| 3 Vehicles | 0 (0.0%) | 18 (3.4%) |
| 4 Vehicles | 98 (13.4%) | 61 (11.4%) |
| 5 or more Vehicles | 15 (2.1%) | 28 (5.2%) |
| Total | 733 (100.0%) | 537 (100.0%) |
Commute Time in Liberty City
The most frequently occuring commute durations in Liberty City are 20 to 24 minutes (288 commuters, 23.3%), 15 to 19 minutes (209 commuters, 16.9%), and 10 to 14 minutes (171 commuters, 13.8%).
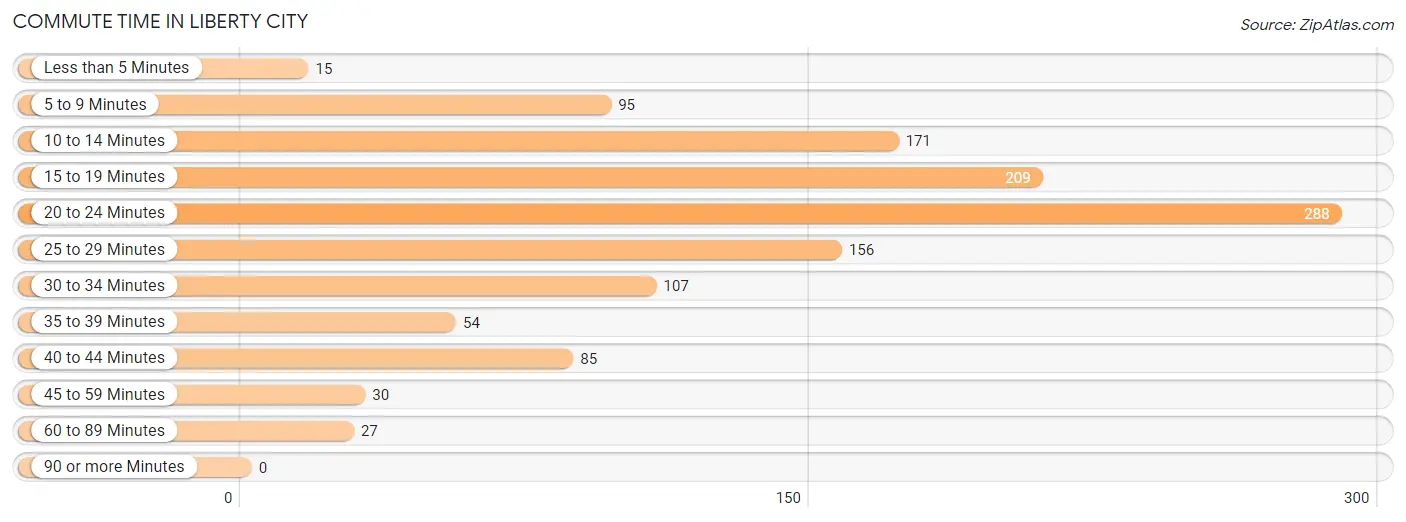
| Commute Time | # Commuters | % Commuters |
| Less than 5 Minutes | 15 | 1.2% |
| 5 to 9 Minutes | 95 | 7.7% |
| 10 to 14 Minutes | 171 | 13.8% |
| 15 to 19 Minutes | 209 | 16.9% |
| 20 to 24 Minutes | 288 | 23.3% |
| 25 to 29 Minutes | 156 | 12.6% |
| 30 to 34 Minutes | 107 | 8.6% |
| 35 to 39 Minutes | 54 | 4.4% |
| 40 to 44 Minutes | 85 | 6.9% |
| 45 to 59 Minutes | 30 | 2.4% |
| 60 to 89 Minutes | 27 | 2.2% |
| 90 or more Minutes | 0 | 0.0% |
Commute Time by Sex in Liberty City
The most common commute times in Liberty City are 20 to 24 minutes (193 commuters, 27.6%) for males and 20 to 24 minutes (95 commuters, 17.7%) for females.
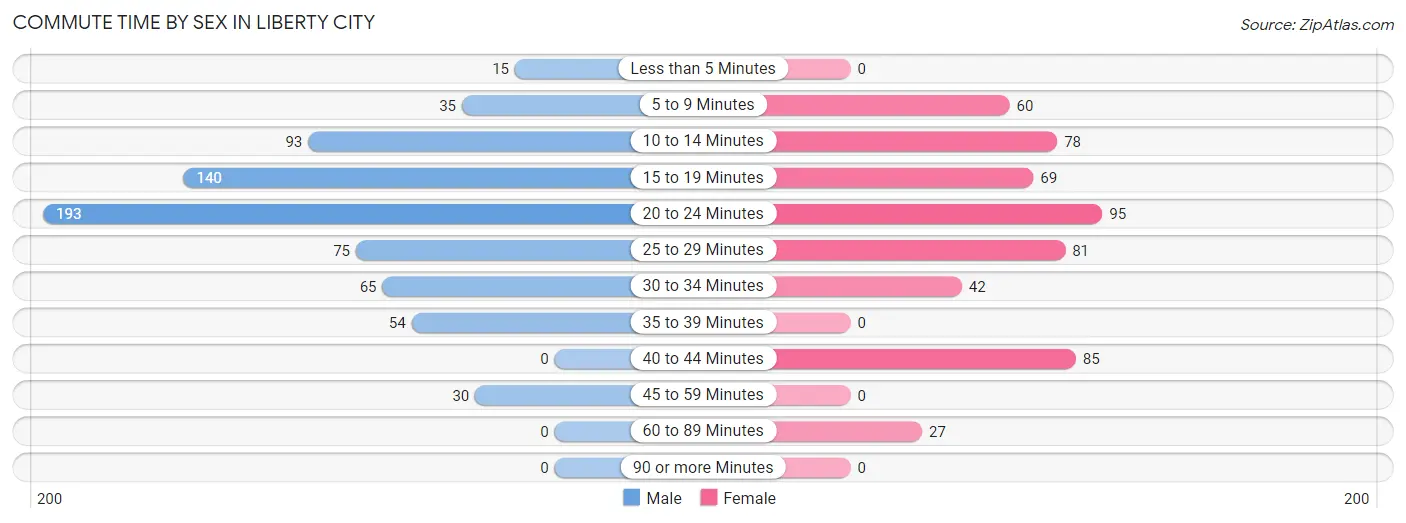
| Commute Time | Male | Female |
| Less than 5 Minutes | 15 (2.1%) | 0 (0.0%) |
| 5 to 9 Minutes | 35 (5.0%) | 60 (11.2%) |
| 10 to 14 Minutes | 93 (13.3%) | 78 (14.5%) |
| 15 to 19 Minutes | 140 (20.0%) | 69 (12.9%) |
| 20 to 24 Minutes | 193 (27.6%) | 95 (17.7%) |
| 25 to 29 Minutes | 75 (10.7%) | 81 (15.1%) |
| 30 to 34 Minutes | 65 (9.3%) | 42 (7.8%) |
| 35 to 39 Minutes | 54 (7.7%) | 0 (0.0%) |
| 40 to 44 Minutes | 0 (0.0%) | 85 (15.8%) |
| 45 to 59 Minutes | 30 (4.3%) | 0 (0.0%) |
| 60 to 89 Minutes | 0 (0.0%) | 27 (5.0%) |
| 90 or more Minutes | 0 (0.0%) | 0 (0.0%) |
Time of Departure to Work by Sex in Liberty City
The most frequent times of departure to work in Liberty City are 4:00 PM to 11:59 PM (148, 21.1%) for males and 7:00 AM to 7:29 AM (145, 27.0%) for females.
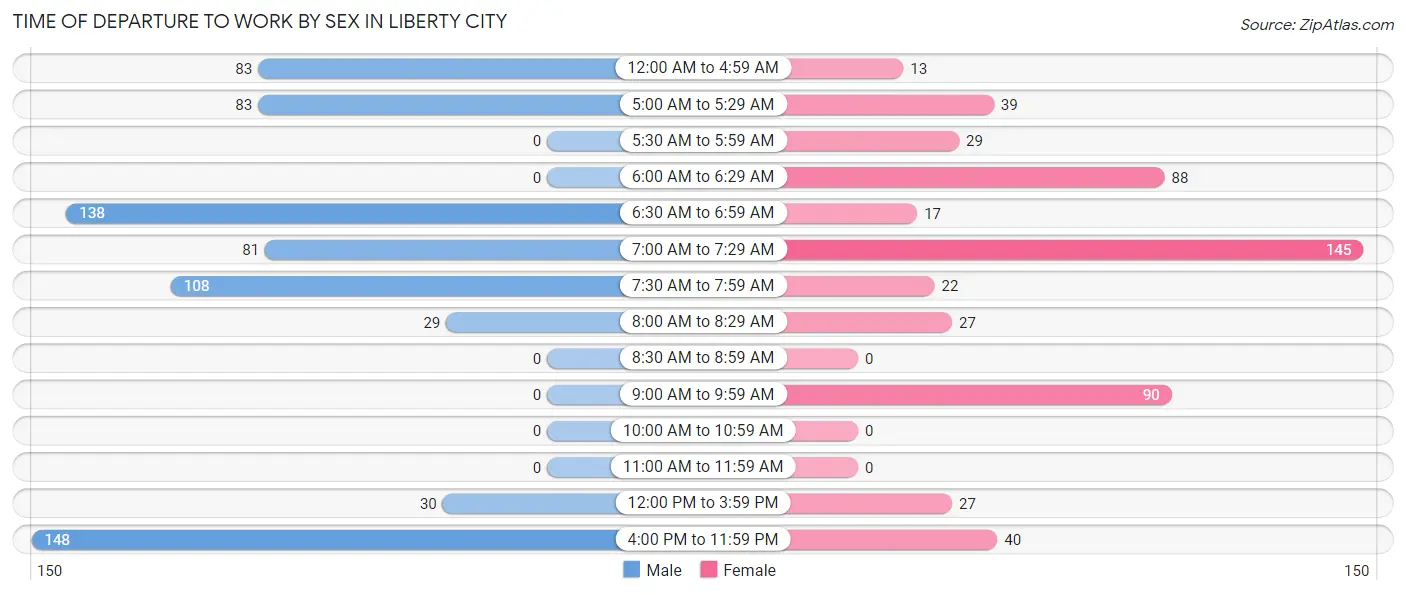
| Time of Departure | Male | Female |
| 12:00 AM to 4:59 AM | 83 (11.9%) | 13 (2.4%) |
| 5:00 AM to 5:29 AM | 83 (11.9%) | 39 (7.3%) |
| 5:30 AM to 5:59 AM | 0 (0.0%) | 29 (5.4%) |
| 6:00 AM to 6:29 AM | 0 (0.0%) | 88 (16.4%) |
| 6:30 AM to 6:59 AM | 138 (19.7%) | 17 (3.2%) |
| 7:00 AM to 7:29 AM | 81 (11.6%) | 145 (27.0%) |
| 7:30 AM to 7:59 AM | 108 (15.4%) | 22 (4.1%) |
| 8:00 AM to 8:29 AM | 29 (4.1%) | 27 (5.0%) |
| 8:30 AM to 8:59 AM | 0 (0.0%) | 0 (0.0%) |
| 9:00 AM to 9:59 AM | 0 (0.0%) | 90 (16.8%) |
| 10:00 AM to 10:59 AM | 0 (0.0%) | 0 (0.0%) |
| 11:00 AM to 11:59 AM | 0 (0.0%) | 0 (0.0%) |
| 12:00 PM to 3:59 PM | 30 (4.3%) | 27 (5.0%) |
| 4:00 PM to 11:59 PM | 148 (21.1%) | 40 (7.4%) |
| Total | 700 (100.0%) | 537 (100.0%) |
Housing Occupancy in Liberty City
Occupancy by Ownership in Liberty City
Of the total 1,048 dwellings in Liberty City, owner-occupied units account for 773 (73.8%), while renter-occupied units make up 275 (26.2%).
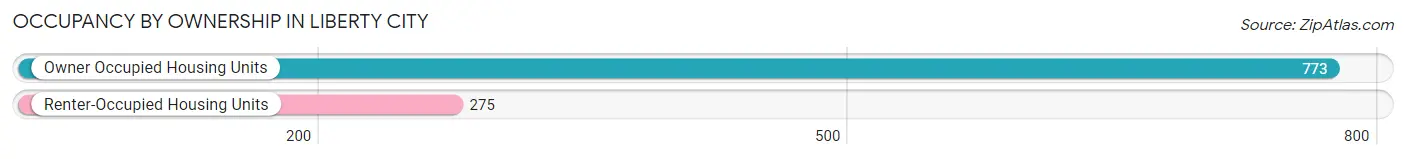
| Occupancy | # Housing Units | % Housing Units |
| Owner Occupied Housing Units | 773 | 73.8% |
| Renter-Occupied Housing Units | 275 | 26.2% |
| Total Occupied Housing Units | 1,048 | 100.0% |
Occupancy by Household Size in Liberty City
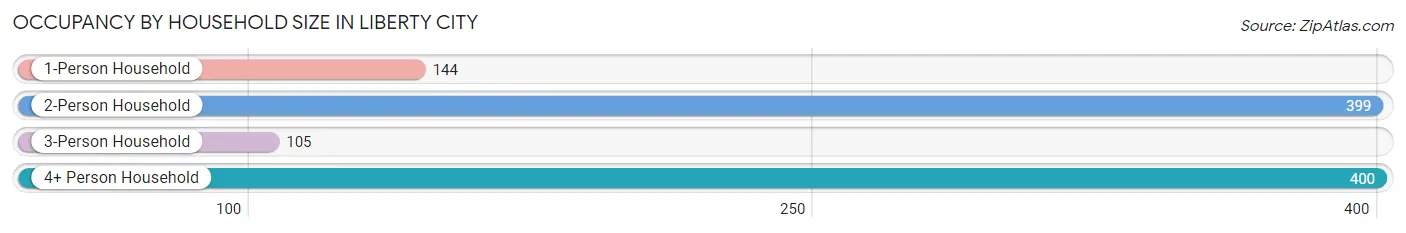
| Household Size | # Housing Units | % Housing Units |
| 1-Person Household | 144 | 13.7% |
| 2-Person Household | 399 | 38.1% |
| 3-Person Household | 105 | 10.0% |
| 4+ Person Household | 400 | 38.2% |
| Total Housing Units | 1,048 | 100.0% |
Occupancy by Ownership by Household Size in Liberty City
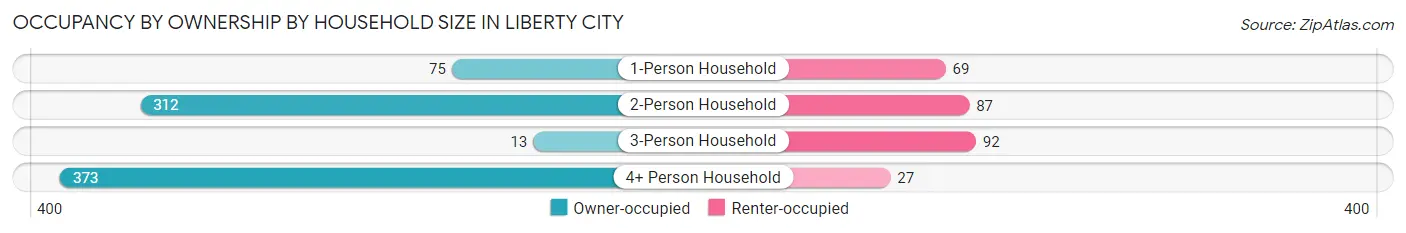
| Household Size | Owner-occupied | Renter-occupied |
| 1-Person Household | 75 (52.1%) | 69 (47.9%) |
| 2-Person Household | 312 (78.2%) | 87 (21.8%) |
| 3-Person Household | 13 (12.4%) | 92 (87.6%) |
| 4+ Person Household | 373 (93.2%) | 27 (6.8%) |
| Total Housing Units | 773 (73.8%) | 275 (26.2%) |
Occupancy by Educational Attainment in Liberty City
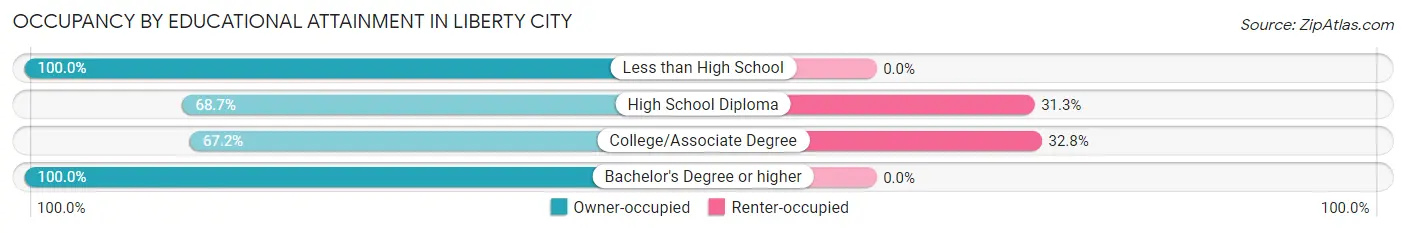
| Household Size | Owner-occupied | Renter-occupied |
| Less than High School | 41 (100.0%) | 0 (0.0%) |
| High School Diploma | 206 (68.7%) | 94 (31.3%) |
| College/Associate Degree | 371 (67.2%) | 181 (32.8%) |
| Bachelor's Degree or higher | 155 (100.0%) | 0 (0.0%) |
Occupancy by Age of Householder in Liberty City
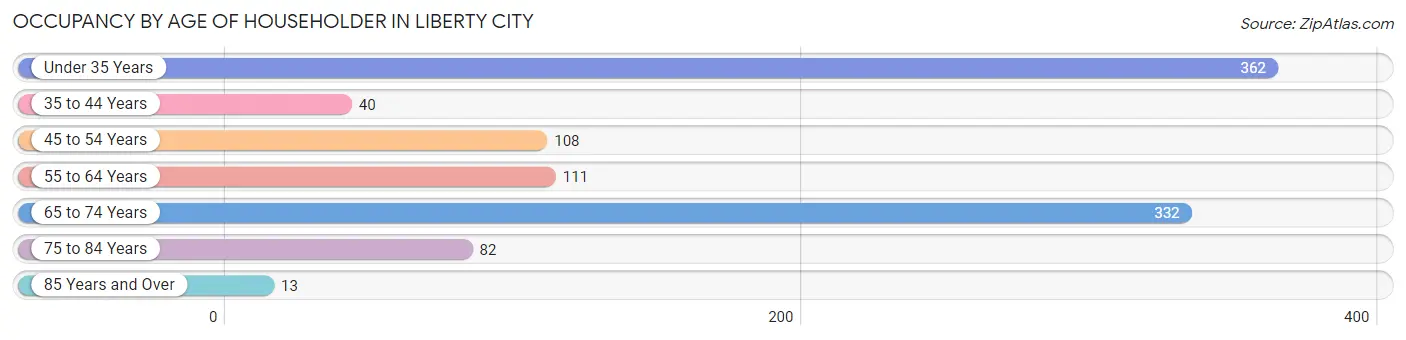
| Age Bracket | # Households | % Households |
| Under 35 Years | 362 | 34.5% |
| 35 to 44 Years | 40 | 3.8% |
| 45 to 54 Years | 108 | 10.3% |
| 55 to 64 Years | 111 | 10.6% |
| 65 to 74 Years | 332 | 31.7% |
| 75 to 84 Years | 82 | 7.8% |
| 85 Years and Over | 13 | 1.2% |
| Total | 1,048 | 100.0% |
Housing Finances in Liberty City
Median Income by Occupancy in Liberty City
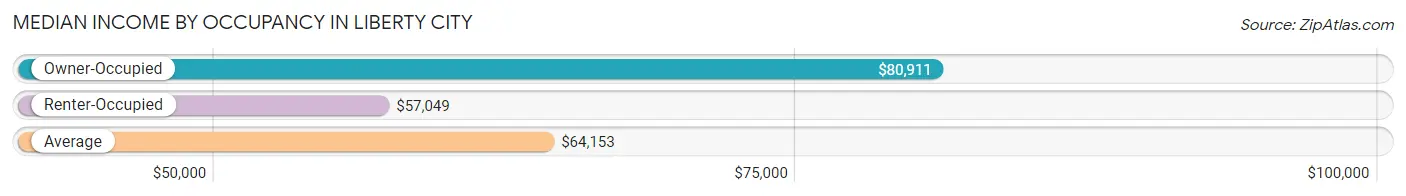
| Occupancy Type | # Households | Median Income |
| Owner-Occupied | 773 (73.8%) | $80,911 |
| Renter-Occupied | 275 (26.2%) | $57,049 |
| Average | 1,048 (100.0%) | $64,153 |
Occupancy by Householder Income Bracket in Liberty City
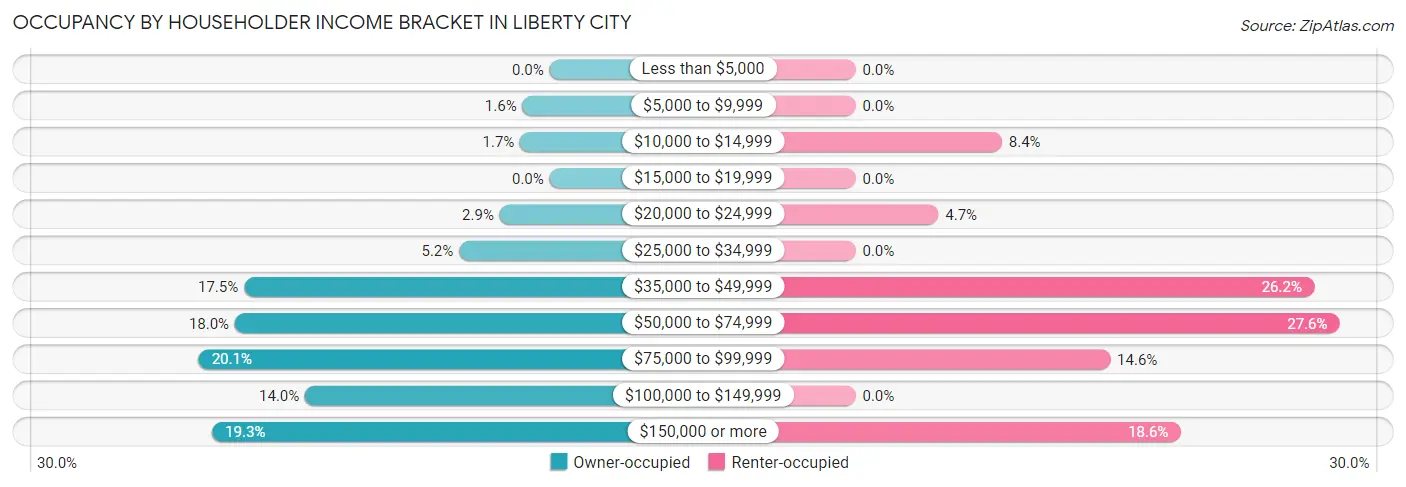
| Income Bracket | Owner-occupied | Renter-occupied |
| Less than $5,000 | 0 (0.0%) | 0 (0.0%) |
| $5,000 to $9,999 | 12 (1.5%) | 0 (0.0%) |
| $10,000 to $14,999 | 13 (1.7%) | 23 (8.4%) |
| $15,000 to $19,999 | 0 (0.0%) | 0 (0.0%) |
| $20,000 to $24,999 | 22 (2.9%) | 13 (4.7%) |
| $25,000 to $34,999 | 40 (5.2%) | 0 (0.0%) |
| $35,000 to $49,999 | 135 (17.5%) | 72 (26.2%) |
| $50,000 to $74,999 | 139 (18.0%) | 76 (27.6%) |
| $75,000 to $99,999 | 155 (20.1%) | 40 (14.5%) |
| $100,000 to $149,999 | 108 (14.0%) | 0 (0.0%) |
| $150,000 or more | 149 (19.3%) | 51 (18.5%) |
| Total | 773 (100.0%) | 275 (100.0%) |
Monthly Housing Cost Tiers in Liberty City
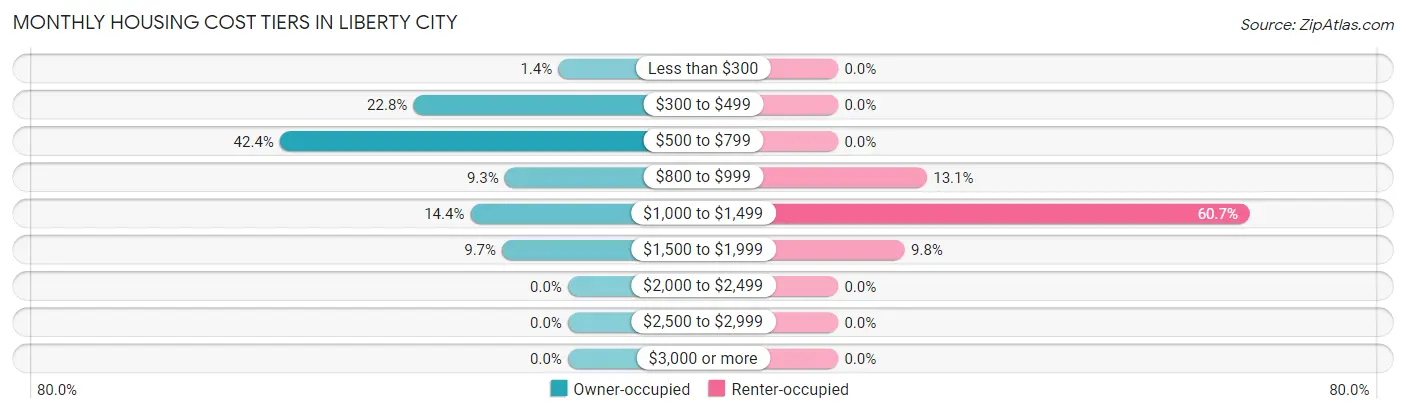
| Monthly Cost | Owner-occupied | Renter-occupied |
| Less than $300 | 11 (1.4%) | 0 (0.0%) |
| $300 to $499 | 176 (22.8%) | 0 (0.0%) |
| $500 to $799 | 328 (42.4%) | 0 (0.0%) |
| $800 to $999 | 72 (9.3%) | 36 (13.1%) |
| $1,000 to $1,499 | 111 (14.4%) | 167 (60.7%) |
| $1,500 to $1,999 | 75 (9.7%) | 27 (9.8%) |
| $2,000 to $2,499 | 0 (0.0%) | 0 (0.0%) |
| $2,500 to $2,999 | 0 (0.0%) | 0 (0.0%) |
| $3,000 or more | 0 (0.0%) | 0 (0.0%) |
| Total | 773 (100.0%) | 275 (100.0%) |
Physical Housing Characteristics in Liberty City
Housing Structures in Liberty City
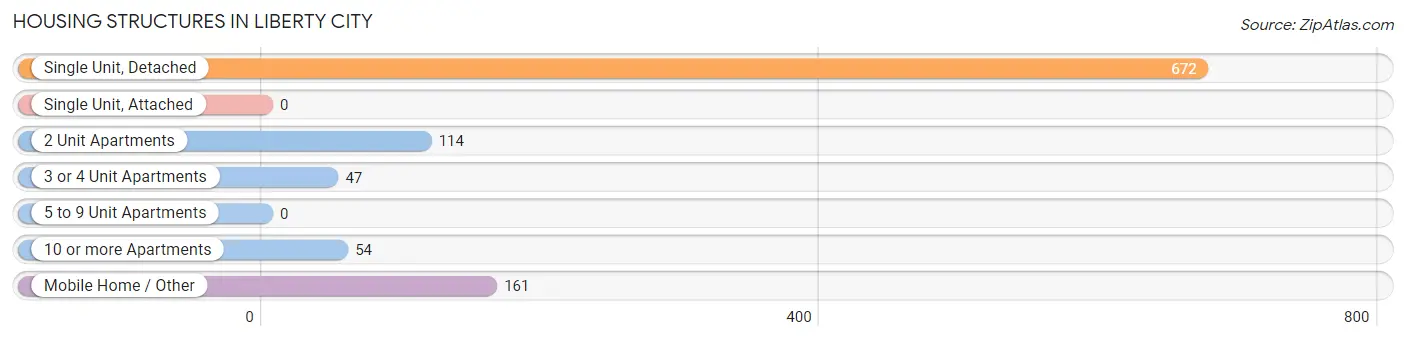
| Structure Type | # Housing Units | % Housing Units |
| Single Unit, Detached | 672 | 64.1% |
| Single Unit, Attached | 0 | 0.0% |
| 2 Unit Apartments | 114 | 10.9% |
| 3 or 4 Unit Apartments | 47 | 4.5% |
| 5 to 9 Unit Apartments | 0 | 0.0% |
| 10 or more Apartments | 54 | 5.1% |
| Mobile Home / Other | 161 | 15.4% |
| Total | 1,048 | 100.0% |
Housing Structures by Occupancy in Liberty City
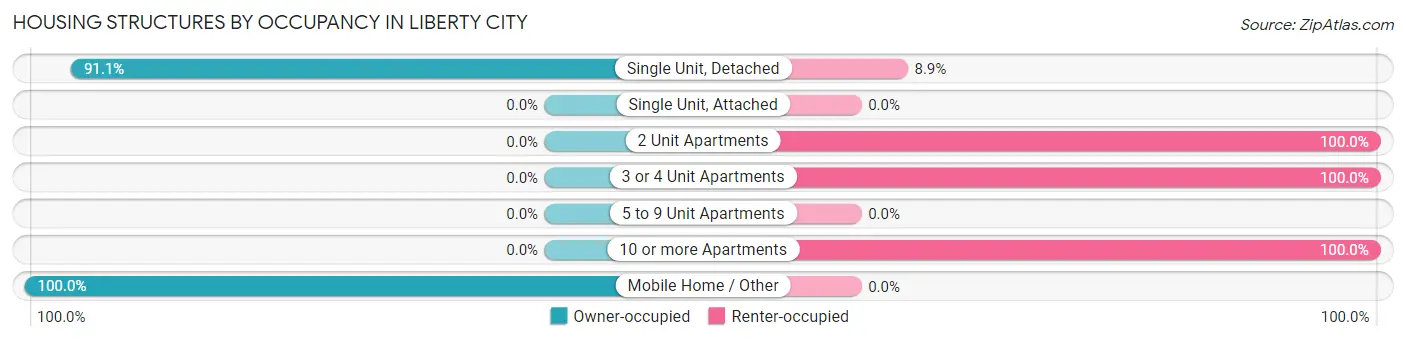
| Structure Type | Owner-occupied | Renter-occupied |
| Single Unit, Detached | 612 (91.1%) | 60 (8.9%) |
| Single Unit, Attached | 0 (0.0%) | 0 (0.0%) |
| 2 Unit Apartments | 0 (0.0%) | 114 (100.0%) |
| 3 or 4 Unit Apartments | 0 (0.0%) | 47 (100.0%) |
| 5 to 9 Unit Apartments | 0 (0.0%) | 0 (0.0%) |
| 10 or more Apartments | 0 (0.0%) | 54 (100.0%) |
| Mobile Home / Other | 161 (100.0%) | 0 (0.0%) |
| Total | 773 (73.8%) | 275 (26.2%) |
Housing Structures by Number of Rooms in Liberty City
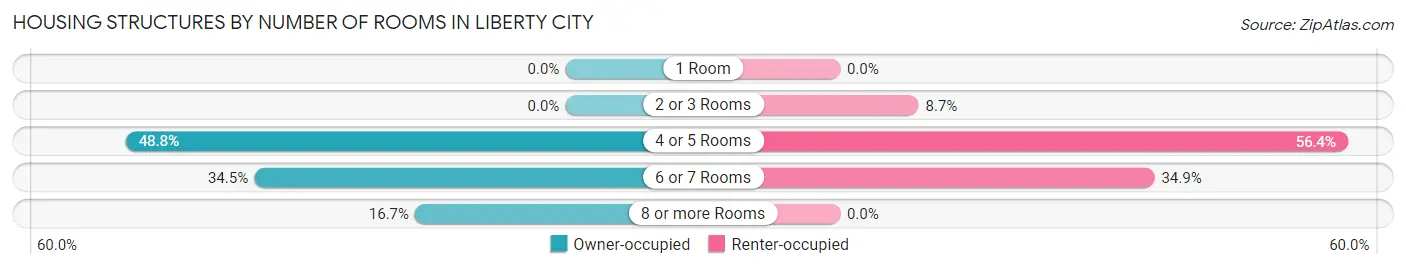
| Number of Rooms | Owner-occupied | Renter-occupied |
| 1 Room | 0 (0.0%) | 0 (0.0%) |
| 2 or 3 Rooms | 0 (0.0%) | 24 (8.7%) |
| 4 or 5 Rooms | 377 (48.8%) | 155 (56.4%) |
| 6 or 7 Rooms | 267 (34.5%) | 96 (34.9%) |
| 8 or more Rooms | 129 (16.7%) | 0 (0.0%) |
| Total | 773 (100.0%) | 275 (100.0%) |
Housing Structure by Heating Type in Liberty City
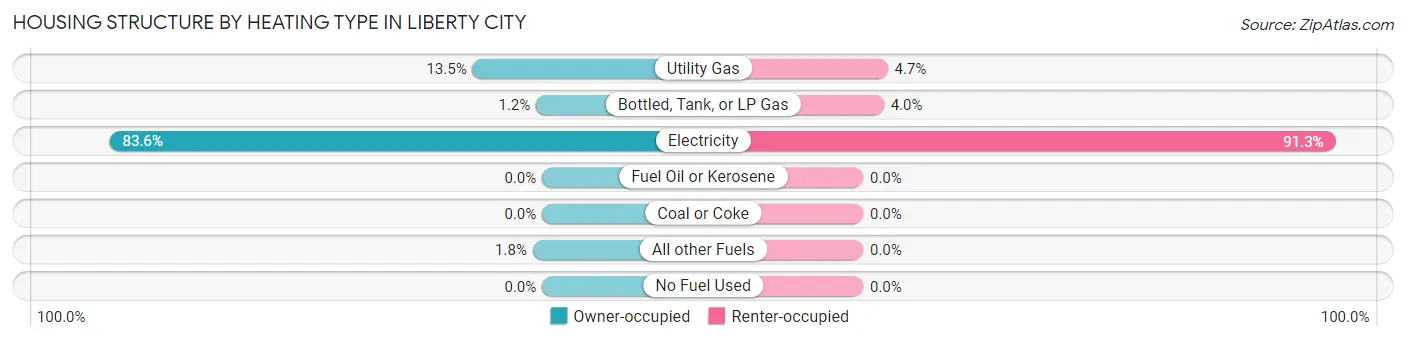
| Heating Type | Owner-occupied | Renter-occupied |
| Utility Gas | 104 (13.5%) | 13 (4.7%) |
| Bottled, Tank, or LP Gas | 9 (1.2%) | 11 (4.0%) |
| Electricity | 646 (83.6%) | 251 (91.3%) |
| Fuel Oil or Kerosene | 0 (0.0%) | 0 (0.0%) |
| Coal or Coke | 0 (0.0%) | 0 (0.0%) |
| All other Fuels | 14 (1.8%) | 0 (0.0%) |
| No Fuel Used | 0 (0.0%) | 0 (0.0%) |
| Total | 773 (100.0%) | 275 (100.0%) |
Household Vehicle Usage in Liberty City
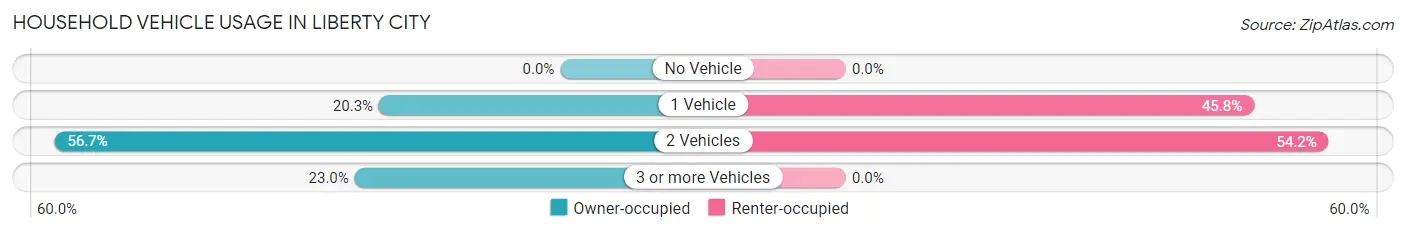
| Vehicles per Household | Owner-occupied | Renter-occupied |
| No Vehicle | 0 (0.0%) | 0 (0.0%) |
| 1 Vehicle | 157 (20.3%) | 126 (45.8%) |
| 2 Vehicles | 438 (56.7%) | 149 (54.2%) |
| 3 or more Vehicles | 178 (23.0%) | 0 (0.0%) |
| Total | 773 (100.0%) | 275 (100.0%) |
Real Estate & Mortgages in Liberty City
Real Estate and Mortgage Overview in Liberty City
| Characteristic | Without Mortgage | With Mortgage |
| Housing Units | 574 | 199 |
| Median Property Value | $162,600 | $166,000 |
| Median Household Income | $64,153 | $31 |
| Monthly Housing Costs | $572 | $0 |
| Real Estate Taxes | $1,617 | $33 |
Property Value by Mortgage Status in Liberty City
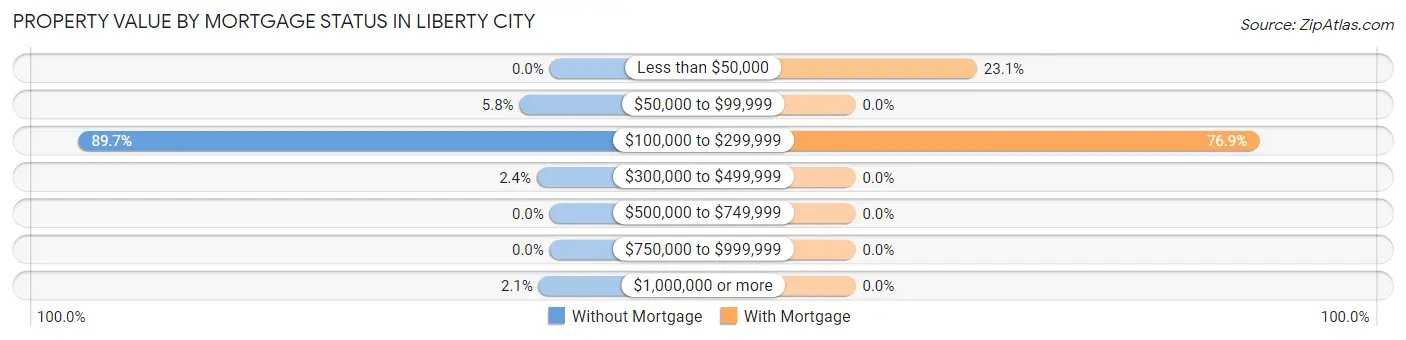
| Property Value | Without Mortgage | With Mortgage |
| Less than $50,000 | 0 (0.0%) | 46 (23.1%) |
| $50,000 to $99,999 | 33 (5.8%) | 0 (0.0%) |
| $100,000 to $299,999 | 515 (89.7%) | 153 (76.9%) |
| $300,000 to $499,999 | 14 (2.4%) | 0 (0.0%) |
| $500,000 to $749,999 | 0 (0.0%) | 0 (0.0%) |
| $750,000 to $999,999 | 0 (0.0%) | 0 (0.0%) |
| $1,000,000 or more | 12 (2.1%) | 0 (0.0%) |
| Total | 574 (100.0%) | 199 (100.0%) |
Household Income by Mortgage Status in Liberty City
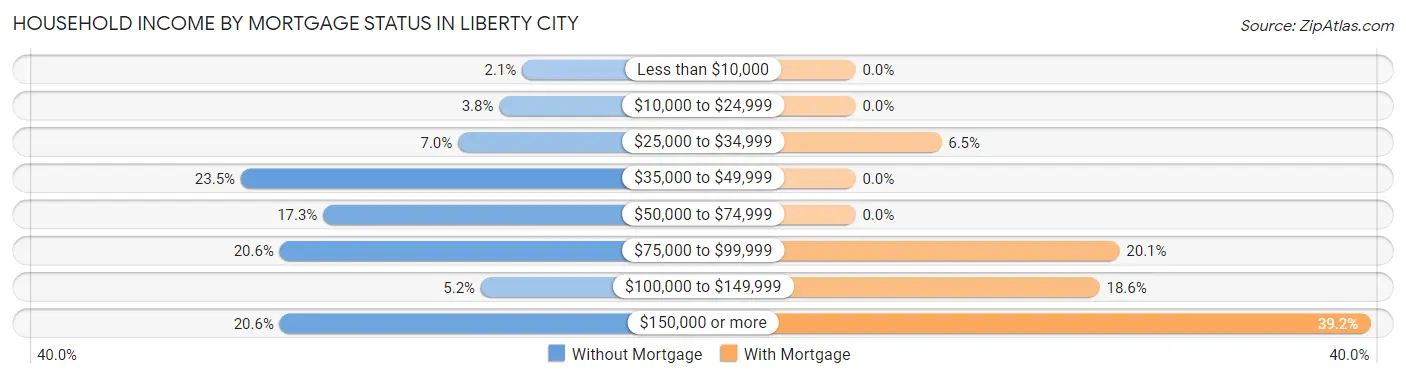
| Household Income | Without Mortgage | With Mortgage |
| Less than $10,000 | 12 (2.1%) | 0 (0.0%) |
| $10,000 to $24,999 | 22 (3.8%) | 0 (0.0%) |
| $25,000 to $34,999 | 40 (7.0%) | 13 (6.5%) |
| $35,000 to $49,999 | 135 (23.5%) | 0 (0.0%) |
| $50,000 to $74,999 | 99 (17.2%) | 0 (0.0%) |
| $75,000 to $99,999 | 118 (20.6%) | 40 (20.1%) |
| $100,000 to $149,999 | 30 (5.2%) | 37 (18.6%) |
| $150,000 or more | 118 (20.6%) | 78 (39.2%) |
| Total | 574 (100.0%) | 199 (100.0%) |
Property Value to Household Income Ratio in Liberty City
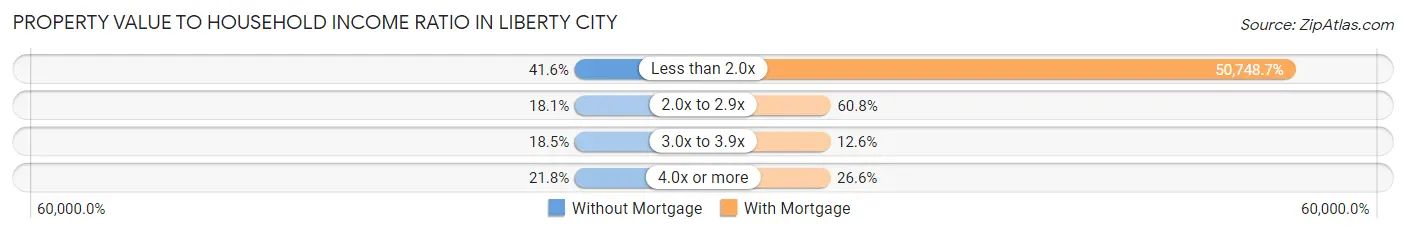
| Value-to-Income Ratio | Without Mortgage | With Mortgage |
| Less than 2.0x | 239 (41.6%) | 100,990 (50,748.7%) |
| 2.0x to 2.9x | 104 (18.1%) | 121 (60.8%) |
| 3.0x to 3.9x | 106 (18.5%) | 25 (12.6%) |
| 4.0x or more | 125 (21.8%) | 53 (26.6%) |
| Total | 574 (100.0%) | 199 (100.0%) |
Real Estate Taxes by Mortgage Status in Liberty City
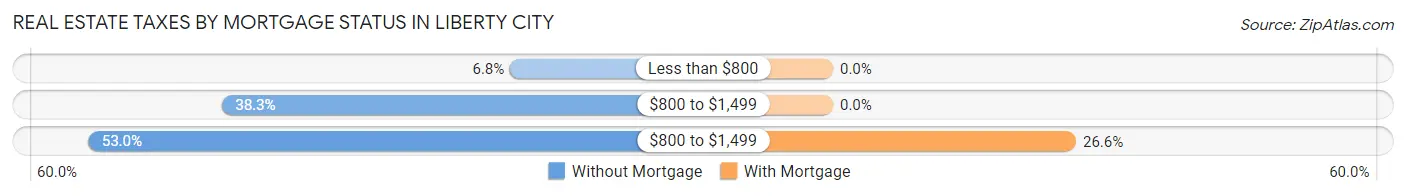
| Property Taxes | Without Mortgage | With Mortgage |
| Less than $800 | 39 (6.8%) | 0 (0.0%) |
| $800 to $1,499 | 220 (38.3%) | 0 (0.0%) |
| $800 to $1,499 | 304 (53.0%) | 53 (26.6%) |
| Total | 574 (100.0%) | 199 (100.0%) |
Health & Disability in Liberty City
Health Insurance Coverage by Age in Liberty City
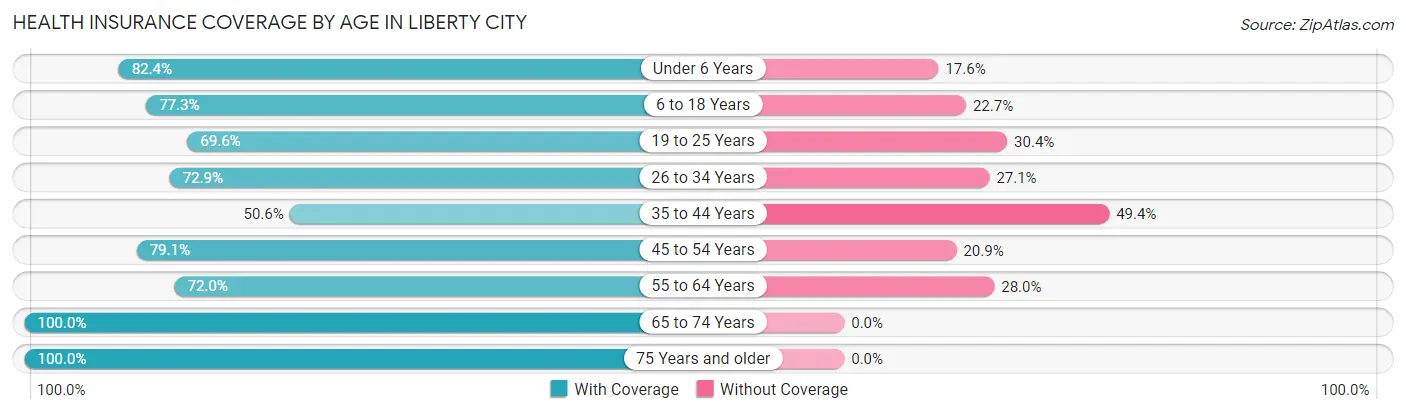
| Age Bracket | With Coverage | Without Coverage |
| Under 6 Years | 230 (82.4%) | 49 (17.6%) |
| 6 to 18 Years | 501 (77.3%) | 147 (22.7%) |
| 19 to 25 Years | 227 (69.6%) | 99 (30.4%) |
| 26 to 34 Years | 264 (72.9%) | 98 (27.1%) |
| 35 to 44 Years | 126 (50.6%) | 123 (49.4%) |
| 45 to 54 Years | 189 (79.1%) | 50 (20.9%) |
| 55 to 64 Years | 170 (72.0%) | 66 (28.0%) |
| 65 to 74 Years | 543 (100.0%) | 0 (0.0%) |
| 75 Years and older | 109 (100.0%) | 0 (0.0%) |
| Total | 2,359 (78.9%) | 632 (21.1%) |
Health Insurance Coverage by Citizenship Status in Liberty City
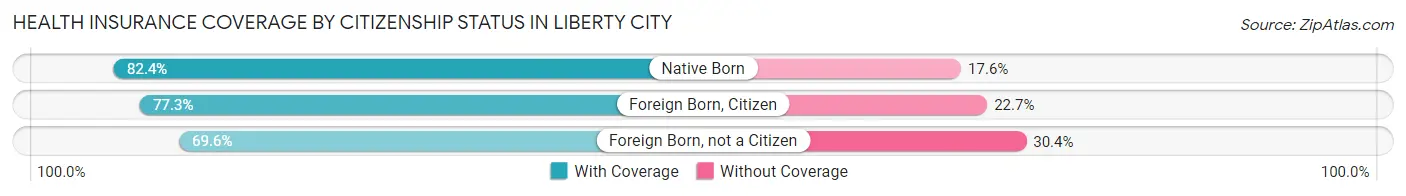
| Citizenship Status | With Coverage | Without Coverage |
| Native Born | 230 (82.4%) | 49 (17.6%) |
| Foreign Born, Citizen | 501 (77.3%) | 147 (22.7%) |
| Foreign Born, not a Citizen | 227 (69.6%) | 99 (30.4%) |
Health Insurance Coverage by Household Income in Liberty City
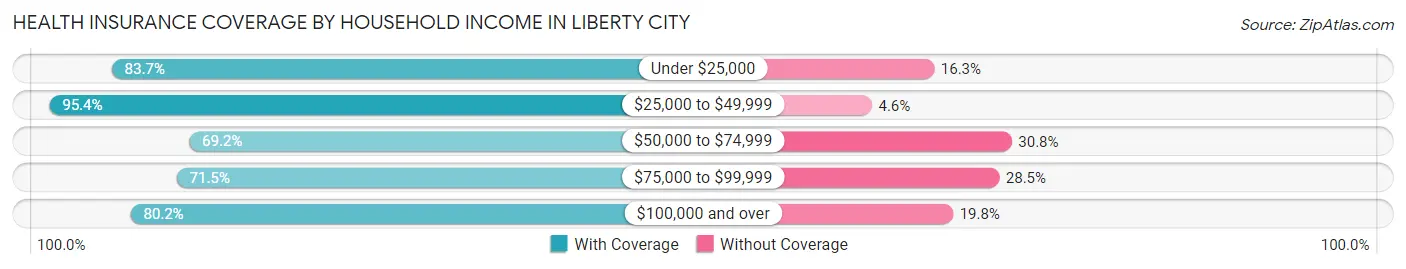
| Household Income | With Coverage | Without Coverage |
| Under $25,000 | 118 (83.7%) | 23 (16.3%) |
| $25,000 to $49,999 | 474 (95.4%) | 23 (4.6%) |
| $50,000 to $74,999 | 368 (69.2%) | 164 (30.8%) |
| $75,000 to $99,999 | 502 (71.5%) | 200 (28.5%) |
| $100,000 and over | 897 (80.2%) | 222 (19.8%) |
Public vs Private Health Insurance Coverage by Age in Liberty City
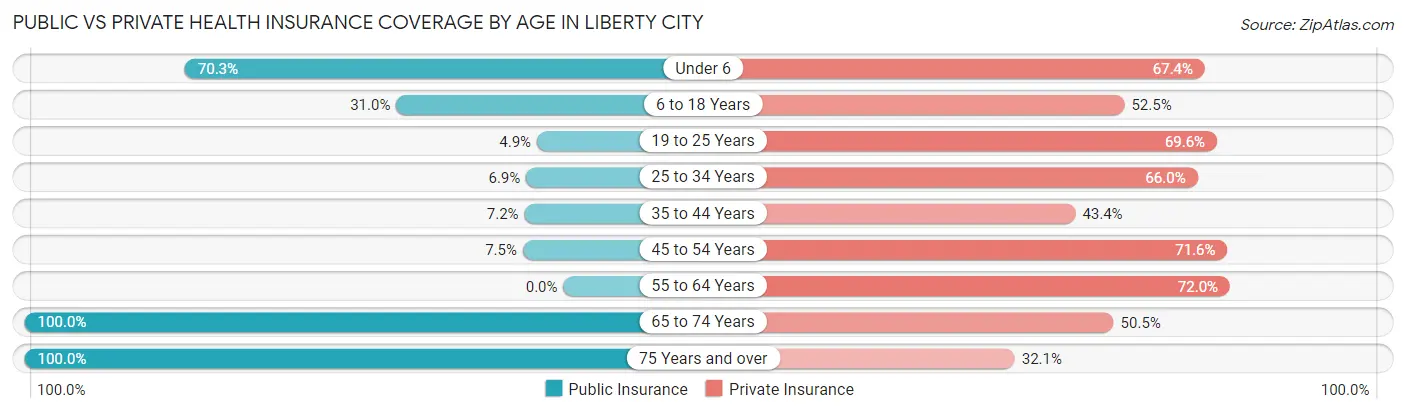
| Age Bracket | Public Insurance | Private Insurance |
| Under 6 | 196 (70.3%) | 188 (67.4%) |
| 6 to 18 Years | 201 (31.0%) | 340 (52.5%) |
| 19 to 25 Years | 16 (4.9%) | 227 (69.6%) |
| 25 to 34 Years | 25 (6.9%) | 239 (66.0%) |
| 35 to 44 Years | 18 (7.2%) | 108 (43.4%) |
| 45 to 54 Years | 18 (7.5%) | 171 (71.6%) |
| 55 to 64 Years | 0 (0.0%) | 170 (72.0%) |
| 65 to 74 Years | 543 (100.0%) | 274 (50.5%) |
| 75 Years and over | 109 (100.0%) | 35 (32.1%) |
| Total | 1,126 (37.7%) | 1,752 (58.6%) |
Disability Status by Sex by Age in Liberty City
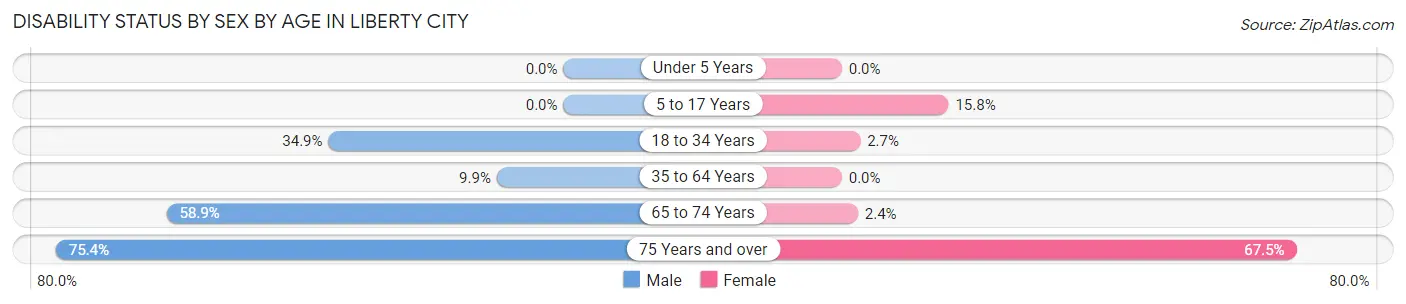
| Age Bracket | Male | Female |
| Under 5 Years | 0 (0.0%) | 0 (0.0%) |
| 5 to 17 Years | 0 (0.0%) | 73 (15.8%) |
| 18 to 34 Years | 97 (34.9%) | 12 (2.7%) |
| 35 to 64 Years | 36 (9.9%) | 0 (0.0%) |
| 65 to 74 Years | 221 (58.9%) | 4 (2.4%) |
| 75 Years and over | 52 (75.4%) | 27 (67.5%) |
Disability Class by Sex by Age in Liberty City
Disability Class: Hearing Difficulty

| Age Bracket | Male | Female |
| Under 5 Years | 0 (0.0%) | 0 (0.0%) |
| 5 to 17 Years | 0 (0.0%) | 0 (0.0%) |
| 18 to 34 Years | 0 (0.0%) | 0 (0.0%) |
| 35 to 64 Years | 0 (0.0%) | 0 (0.0%) |
| 65 to 74 Years | 180 (48.0%) | 0 (0.0%) |
| 75 Years and over | 30 (43.5%) | 14 (35.0%) |
Disability Class: Vision Difficulty
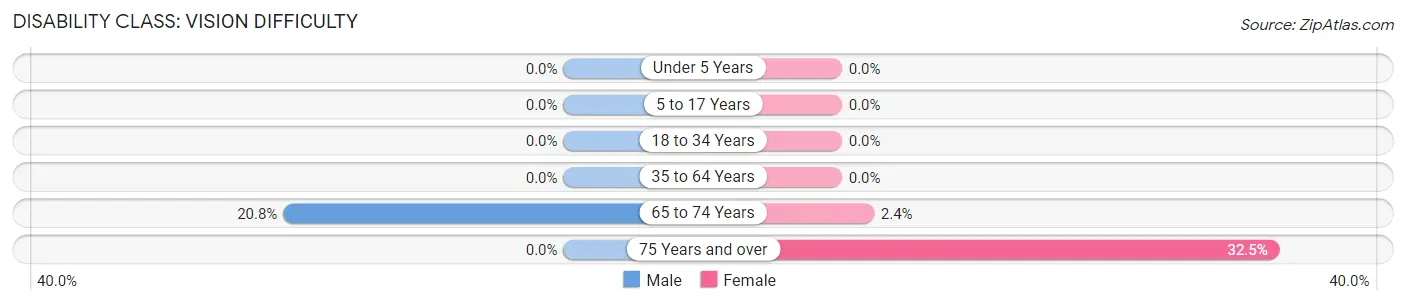
| Age Bracket | Male | Female |
| Under 5 Years | 0 (0.0%) | 0 (0.0%) |
| 5 to 17 Years | 0 (0.0%) | 0 (0.0%) |
| 18 to 34 Years | 0 (0.0%) | 0 (0.0%) |
| 35 to 64 Years | 0 (0.0%) | 0 (0.0%) |
| 65 to 74 Years | 78 (20.8%) | 4 (2.4%) |
| 75 Years and over | 0 (0.0%) | 13 (32.5%) |
Disability Class: Cognitive Difficulty
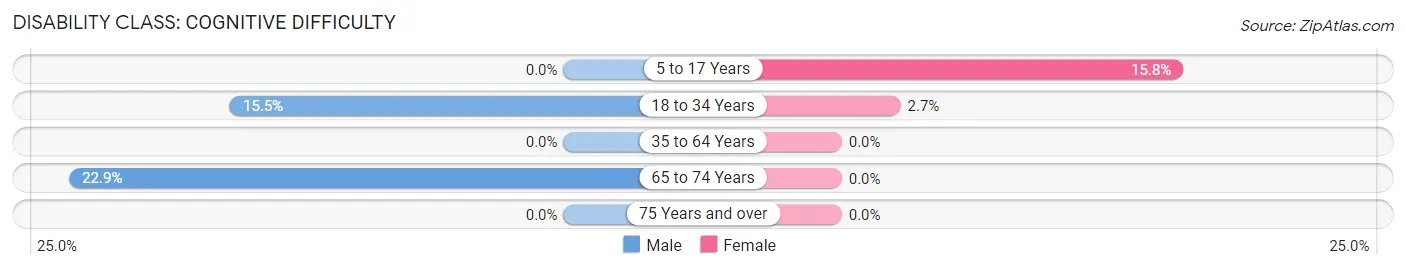
| Age Bracket | Male | Female |
| 5 to 17 Years | 0 (0.0%) | 73 (15.8%) |
| 18 to 34 Years | 43 (15.5%) | 12 (2.7%) |
| 35 to 64 Years | 0 (0.0%) | 0 (0.0%) |
| 65 to 74 Years | 86 (22.9%) | 0 (0.0%) |
| 75 Years and over | 0 (0.0%) | 0 (0.0%) |
Disability Class: Ambulatory Difficulty
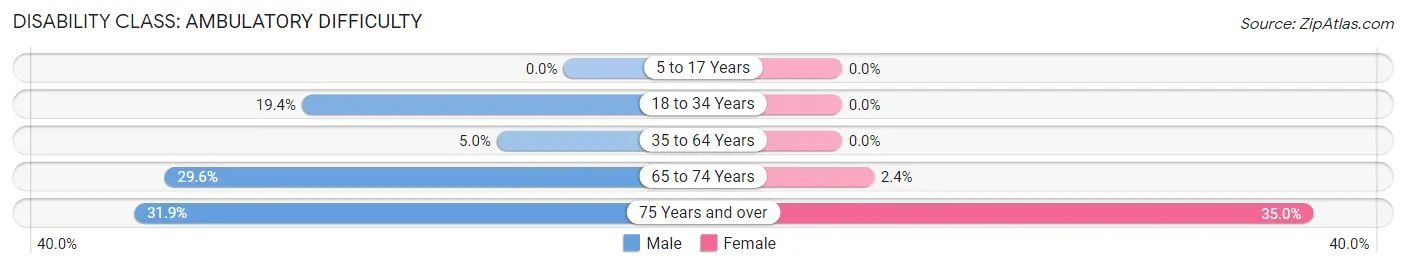
| Age Bracket | Male | Female |
| 5 to 17 Years | 0 (0.0%) | 0 (0.0%) |
| 18 to 34 Years | 54 (19.4%) | 0 (0.0%) |
| 35 to 64 Years | 18 (5.0%) | 0 (0.0%) |
| 65 to 74 Years | 111 (29.6%) | 4 (2.4%) |
| 75 Years and over | 22 (31.9%) | 14 (35.0%) |
Disability Class: Self-Care Difficulty
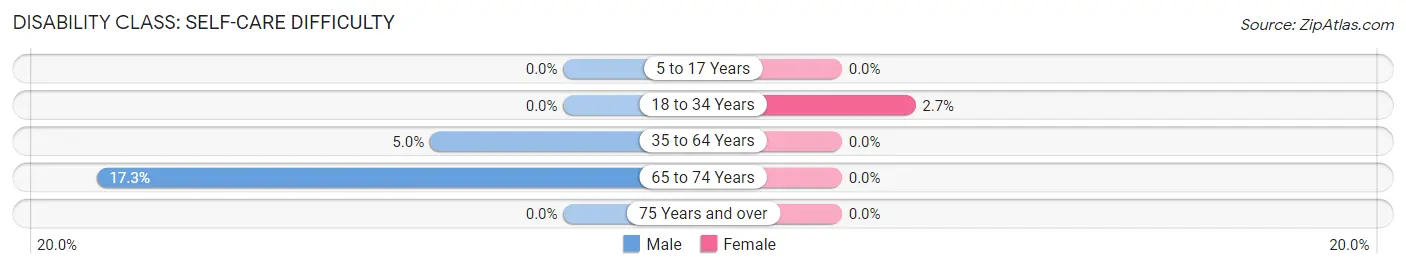
| Age Bracket | Male | Female |
| 5 to 17 Years | 0 (0.0%) | 0 (0.0%) |
| 18 to 34 Years | 0 (0.0%) | 12 (2.7%) |
| 35 to 64 Years | 18 (5.0%) | 0 (0.0%) |
| 65 to 74 Years | 65 (17.3%) | 0 (0.0%) |
| 75 Years and over | 0 (0.0%) | 0 (0.0%) |
Technology Access in Liberty City
Computing Device Access in Liberty City
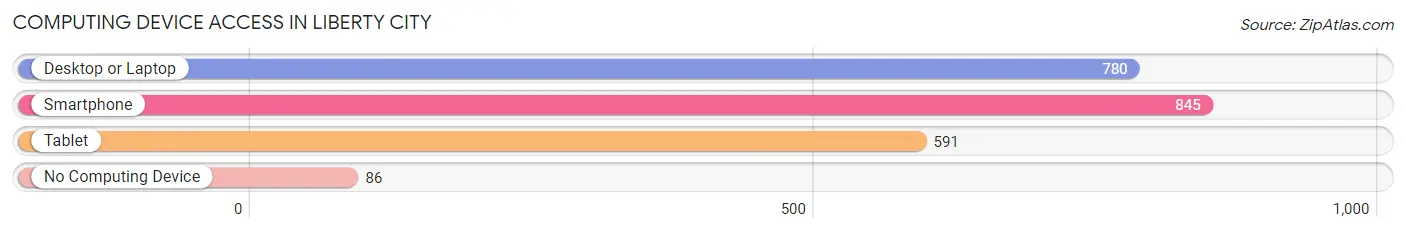
| Device Type | # Households | % Households |
| Desktop or Laptop | 780 | 74.4% |
| Smartphone | 845 | 80.6% |
| Tablet | 591 | 56.4% |
| No Computing Device | 86 | 8.2% |
| Total | 1,048 | 100.0% |
Internet Access in Liberty City
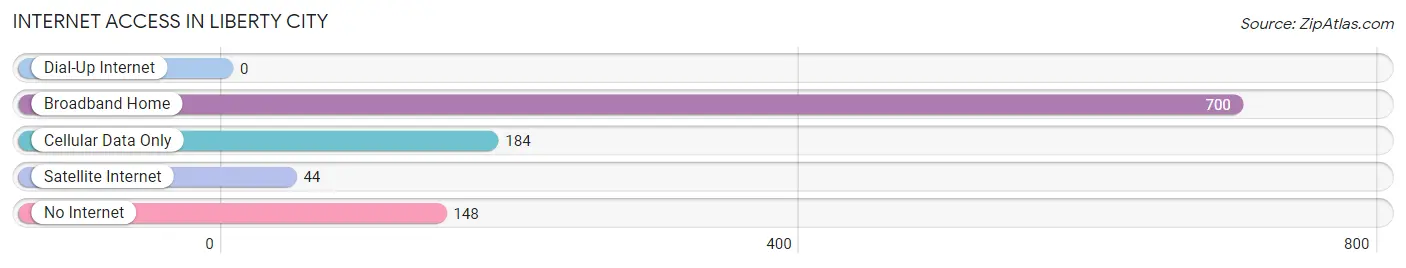
| Internet Type | # Households | % Households |
| Dial-Up Internet | 0 | 0.0% |
| Broadband Home | 700 | 66.8% |
| Cellular Data Only | 184 | 17.6% |
| Satellite Internet | 44 | 4.2% |
| No Internet | 148 | 14.1% |
| Total | 1,048 | 100.0% |
Liberty City Summary
Liberty City is a small city located in the state of Texas, United States. It is situated in the eastern part of the state, in the county of Liberty. The city has a population of approximately 4,000 people, according to the 2010 census.
Geography
Liberty City is located in the eastern part of Texas, in the county of Liberty. It is situated on the banks of the Trinity River, which is the longest river in the state. The city is surrounded by the cities of Dayton, Hardin, and Hull. The city is located at an elevation of about 30 feet above sea level.
The climate in Liberty City is classified as humid subtropical, with hot summers and mild winters. The average temperature in the summer months is around 90 degrees Fahrenheit, while the average temperature in the winter months is around 50 degrees Fahrenheit. The city receives an average of about 40 inches of rain per year.
History
The area that is now Liberty City was first settled in the early 1800s by settlers from the United States. The city was originally known as Libertyville, and was incorporated in 1837. The city was named after the Liberty Bell, which was a symbol of freedom during the American Revolution.
In the late 1800s, the city became a major center for the lumber industry. The city was also home to several cotton plantations, which were a major source of income for the city.
In the early 1900s, the city experienced a period of growth and development. The city was home to several businesses, including a cotton gin, a sawmill, and a brick factory. The city also had a railroad station, which was used to transport goods and passengers.
In the mid-1900s, the city experienced a period of decline. The lumber industry declined, and the cotton plantations were abandoned. The city also experienced a population decline, as many people moved away in search of better opportunities.
Economy
The economy of Liberty City is largely based on agriculture and tourism. The city is home to several farms, which produce a variety of crops, including cotton, corn, and soybeans. The city is also home to several tourist attractions, including the Liberty Bell Museum and the Liberty Bell Park.
The city is also home to several businesses, including restaurants, retail stores, and auto repair shops. The city is also home to several manufacturing companies, which produce a variety of products, including furniture, clothing, and electronics.
Demographics
According to the 2010 census, the population of Liberty City was 4,000 people. The population is predominantly white, with about 75% of the population being white. The remaining 25% of the population is made up of African Americans, Hispanics, and other races.
The median household income in Liberty City is $35,000, which is slightly lower than the national average. The median age of the population is 37 years old, and the unemployment rate is about 8%.
Conclusion
Liberty City is a small city located in the eastern part of Texas. The city has a population of about 4,000 people, and the economy is largely based on agriculture and tourism. The population is predominantly white, and the median household income is slightly lower than the national average. The city is home to several tourist attractions, businesses, and manufacturing companies.
Common Questions
What is Per Capita Income in Liberty City?
Per Capita income in Liberty City is $30,205.
What is the Median Family Income in Liberty City?
Median Family Income in Liberty City is $82,143.
What is the Median Household income in Liberty City?
Median Household Income in Liberty City is $64,153.
What is Income or Wage Gap in Liberty City?
Income or Wage Gap in Liberty City is 3.1%.
Women in Liberty City earn 96.9 cents for every dollar earned by a man.
What is Inequality or Gini Index in Liberty City?
Inequality or Gini Index in Liberty City is 0.34.
What is the Total Population of Liberty City?
Total Population of Liberty City is 2,991.
What is the Total Male Population of Liberty City?
Total Male Population of Liberty City is 1,430.
What is the Total Female Population of Liberty City?
Total Female Population of Liberty City is 1,561.
What is the Ratio of Males per 100 Females in Liberty City?
There are 91.61 Males per 100 Females in Liberty City.
What is the Ratio of Females per 100 Males in Liberty City?
There are 109.16 Females per 100 Males in Liberty City.
What is the Median Population Age in Liberty City?
Median Population Age in Liberty City is 32.5 Years.
What is the Average Family Size in Liberty City
Average Family Size in Liberty City is 3.2 People.
What is the Average Household Size in Liberty City
Average Household Size in Liberty City is 2.9 People.
How Large is the Labor Force in Liberty City?
There are 1,367 People in the Labor Forcein in Liberty City.
What is the Percentage of People in the Labor Force in Liberty City?
61.6% of People are in the Labor Force in Liberty City.
What is the Unemployment Rate in Liberty City?
Unemployment Rate in Liberty City is 2.6%.