Benavides, TX Map & Demographics
Benavides Map
Benavides Overview
$18,806
PER CAPITA INCOME
$66,318
AVG FAMILY INCOME
$56,198
AVG HOUSEHOLD INCOME
$8,809
FAMILY INCOME DEFICIT
0.41
INEQUALITY / GINI INDEX
1,409
TOTAL POPULATION
615
MALE POPULATION
794
FEMALE POPULATION
77.46
MALES / 100 FEMALES
129.11
FEMALES / 100 MALES
27.2
MEDIAN AGE
4.1
AVG FAMILY SIZE
3.5
AVG HOUSEHOLD SIZE
456
LABOR FORCE [ PEOPLE ]
45.5%
PERCENT IN LABOR FORCE
Benavides Zip Codes
Benavides Area Codes
Income in Benavides
Income Overview in Benavides
Per Capita Income in Benavides is $18,806, while median incomes of families and households are $66,318 and $56,198 respectively.
| Characteristic | Number | Measure |
| Per Capita Income | 1,409 | $18,806 |
| Median Family Income | 317 | $66,318 |
| Mean Family Income | 317 | $73,324 |
| Median Household Income | 399 | $56,198 |
| Mean Household Income | 399 | $61,958 |
| Income Deficit | 317 | $8,809 |
| Wage / Income Gap (%) | 1,409 | 0.00% |
| Wage / Income Gap ($) | 1,409 | 100.00¢ per $1 |
| Gini / Inequality Index | 1,409 | 0.41 |
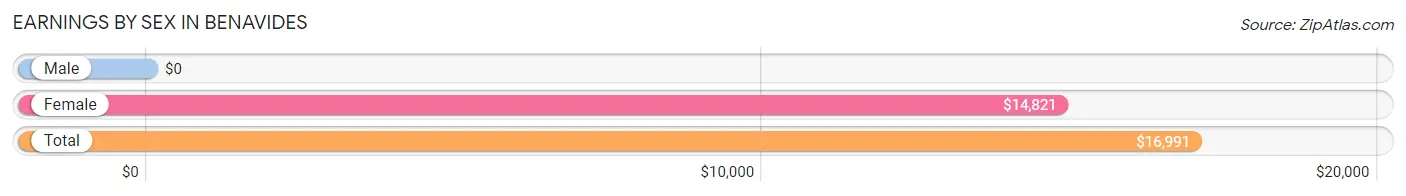
Earnings by Sex in Benavides
| Sex | Number | Average Earnings |
| Male | 316 (62.2%) | $0 |
| Female | 192 (37.8%) | $14,821 |
| Total | 508 (100.0%) | $16,991 |
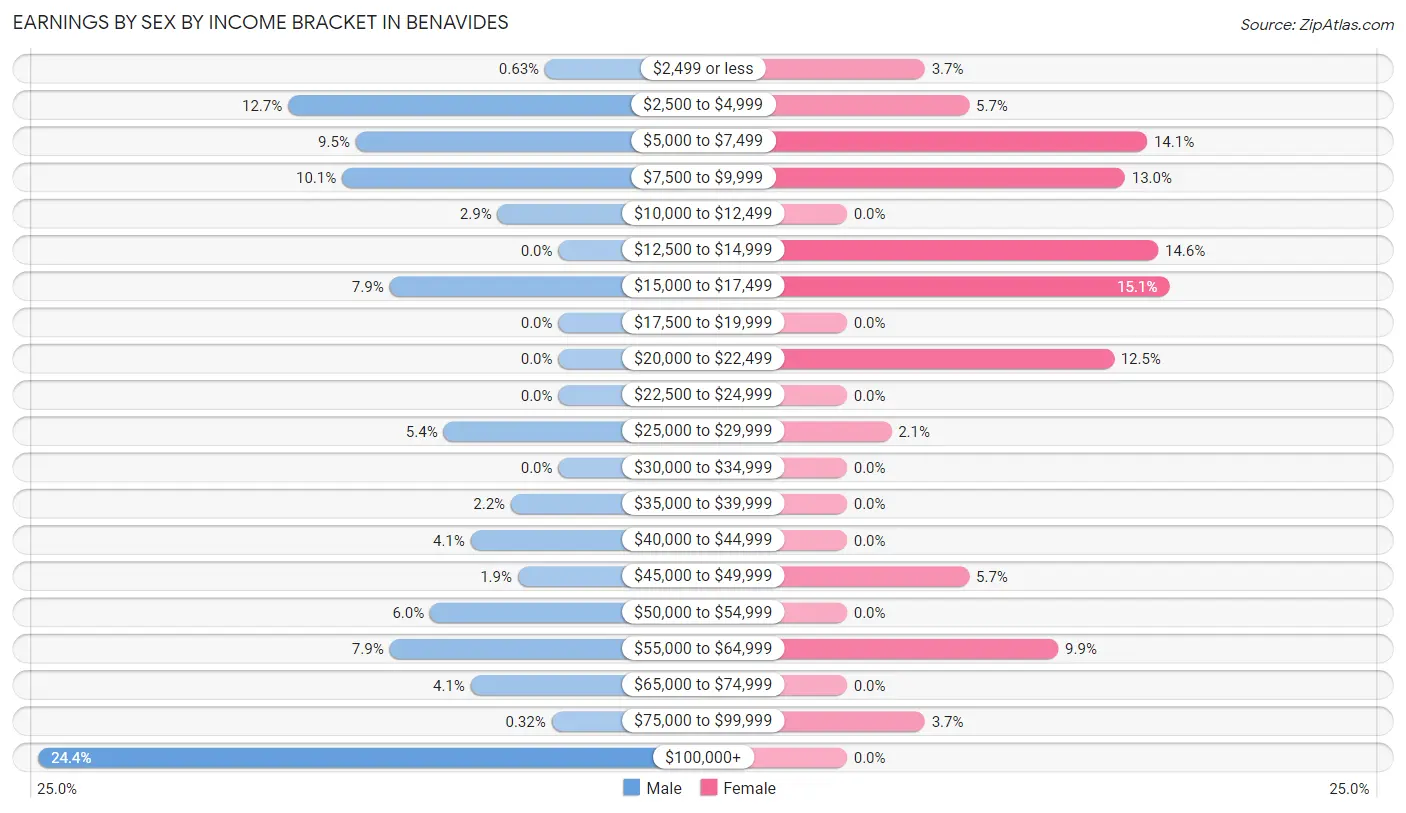
Earnings by Sex by Income Bracket in Benavides
The most common earnings brackets in Benavides are $100,000+ for men (77 | 24.4%) and $15,000 to $17,499 for women (29 | 15.1%).
| Income | Male | Female |
| $2,499 or less | 2 (0.6%) | 7 (3.6%) |
| $2,500 to $4,999 | 40 (12.7%) | 11 (5.7%) |
| $5,000 to $7,499 | 30 (9.5%) | 27 (14.1%) |
| $7,500 to $9,999 | 32 (10.1%) | 25 (13.0%) |
| $10,000 to $12,499 | 9 (2.9%) | 0 (0.0%) |
| $12,500 to $14,999 | 0 (0.0%) | 28 (14.6%) |
| $15,000 to $17,499 | 25 (7.9%) | 29 (15.1%) |
| $17,500 to $19,999 | 0 (0.0%) | 0 (0.0%) |
| $20,000 to $22,499 | 0 (0.0%) | 24 (12.5%) |
| $22,500 to $24,999 | 0 (0.0%) | 0 (0.0%) |
| $25,000 to $29,999 | 17 (5.4%) | 4 (2.1%) |
| $30,000 to $34,999 | 0 (0.0%) | 0 (0.0%) |
| $35,000 to $39,999 | 7 (2.2%) | 0 (0.0%) |
| $40,000 to $44,999 | 13 (4.1%) | 0 (0.0%) |
| $45,000 to $49,999 | 6 (1.9%) | 11 (5.7%) |
| $50,000 to $54,999 | 19 (6.0%) | 0 (0.0%) |
| $55,000 to $64,999 | 25 (7.9%) | 19 (9.9%) |
| $65,000 to $74,999 | 13 (4.1%) | 0 (0.0%) |
| $75,000 to $99,999 | 1 (0.3%) | 7 (3.6%) |
| $100,000+ | 77 (24.4%) | 0 (0.0%) |
| Total | 316 (100.0%) | 192 (100.0%) |
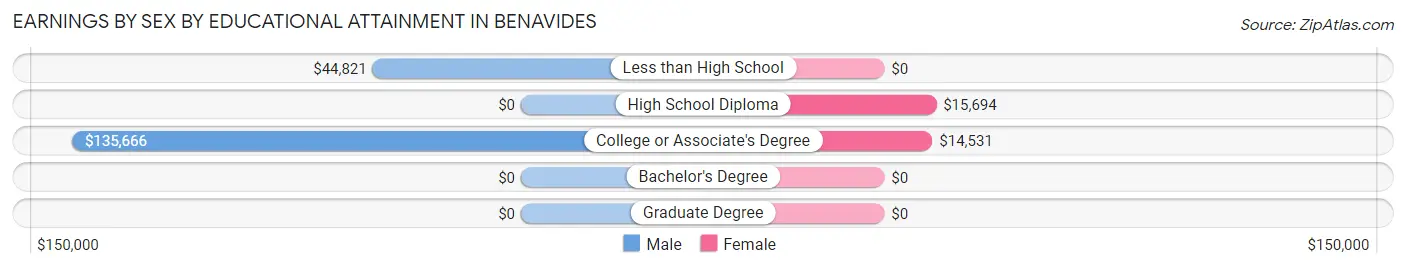
Earnings by Sex by Educational Attainment in Benavides
Average earnings in Benavides are $52,434 for men and $15,819 for women, a difference of 69.8%. Men with an educational attainment of college or associate's degree enjoy the highest average annual earnings of $135,666, while those with less than high school education earn the least with $44,821. Women with an educational attainment of high school diploma earn the most with the average annual earnings of $15,694, while those with college or associate's degree education have the smallest earnings of $14,531.
| Educational Attainment | Male Income | Female Income |
| Less than High School | $44,821 | $0 |
| High School Diploma | - | - |
| College or Associate's Degree | $135,666 | $14,531 |
| Bachelor's Degree | - | - |
| Graduate Degree | - | - |
| Total | $52,434 | $15,819 |
Family Income in Benavides
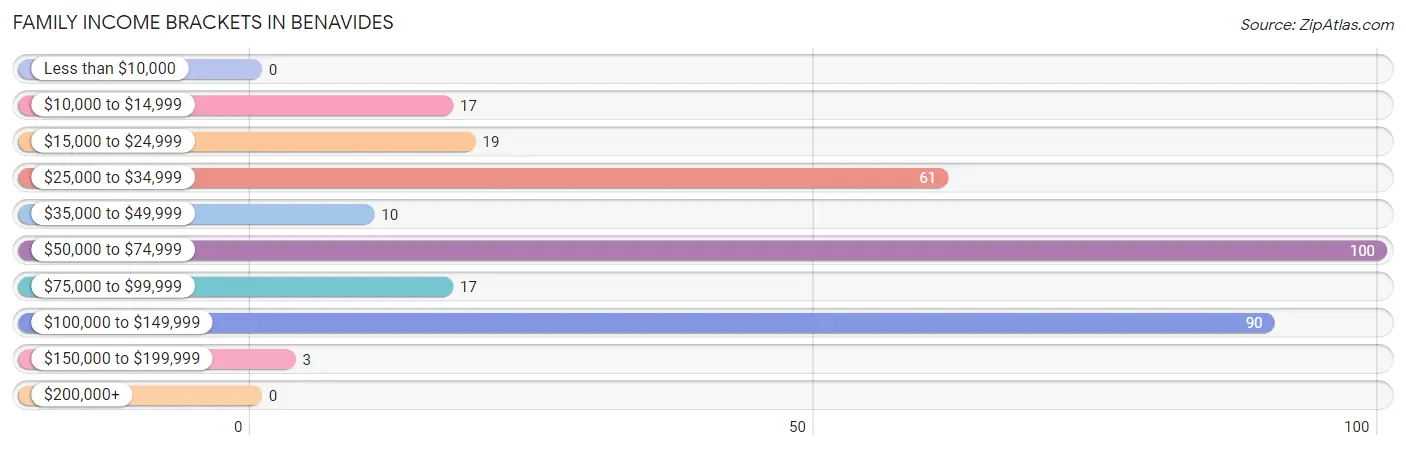
Family Income Brackets in Benavides
According to the Benavides family income data, there are 100 families falling into the $50,000 to $74,999 income range, which is the most common income bracket and makes up 31.6% of all families.
| Income Bracket | # Families | % Families |
| Less than $10,000 | 0 | 0.0% |
| $10,000 to $14,999 | 17 | 5.4% |
| $15,000 to $24,999 | 19 | 6.0% |
| $25,000 to $34,999 | 61 | 19.2% |
| $35,000 to $49,999 | 10 | 3.2% |
| $50,000 to $74,999 | 100 | 31.5% |
| $75,000 to $99,999 | 17 | 5.4% |
| $100,000 to $149,999 | 90 | 28.4% |
| $150,000 to $199,999 | 3 | 0.9% |
| $200,000+ | 0 | 0.0% |
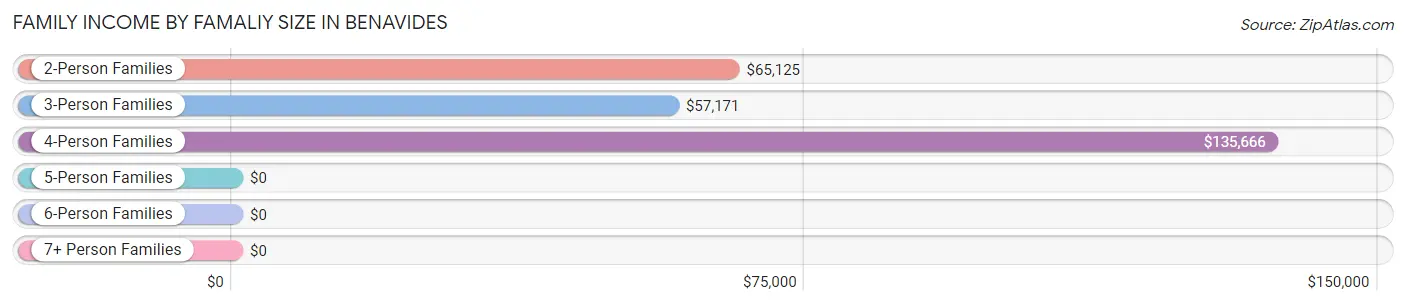
Family Income by Famaliy Size in Benavides
4-person families (113 | 35.6%) account for the highest median family income in Benavides with $135,666 per family, while 4-person families (113 | 35.6%) have the highest median income of $33,916 per family member.
| Income Bracket | # Families | Median Income |
| 2-Person Families | 110 (34.7%) | $65,125 |
| 3-Person Families | 63 (19.9%) | $57,171 |
| 4-Person Families | 113 (35.6%) | $135,666 |
| 5-Person Families | 14 (4.4%) | $0 |
| 6-Person Families | 17 (5.4%) | $0 |
| 7+ Person Families | 0 (0.0%) | $0 |
| Total | 317 (100.0%) | $66,318 |
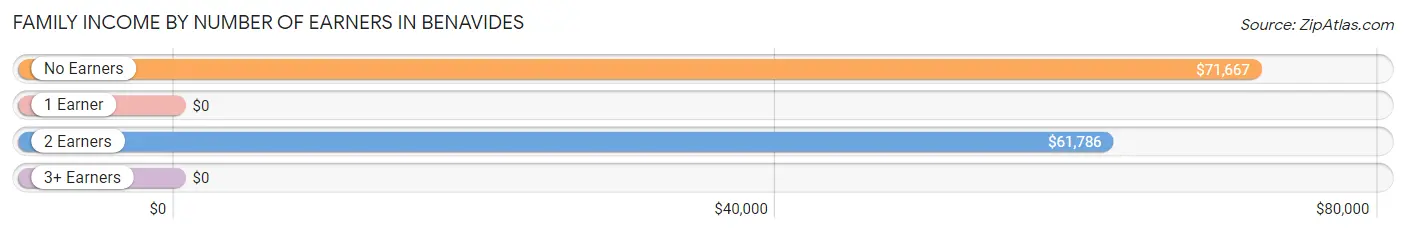
Family Income by Number of Earners in Benavides
| Number of Earners | # Families | Median Income |
| No Earners | 28 (8.8%) | $71,667 |
| 1 Earner | 201 (63.4%) | $0 |
| 2 Earners | 70 (22.1%) | $61,786 |
| 3+ Earners | 18 (5.7%) | $0 |
| Total | 317 (100.0%) | $66,318 |
Household Income in Benavides
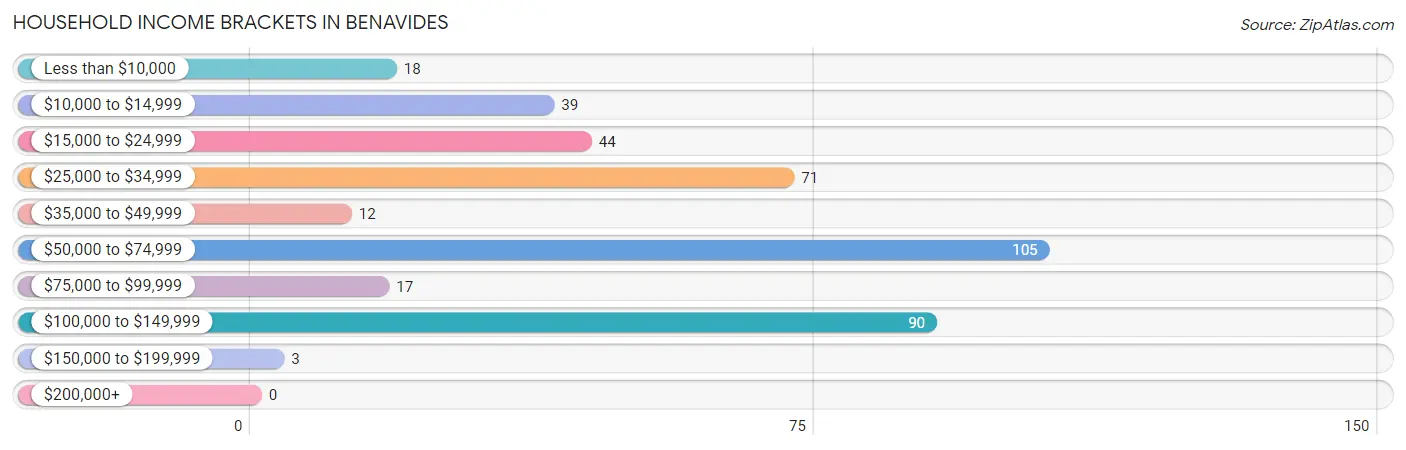
Household Income Brackets in Benavides
With 105 households falling in the category, the $50,000 to $74,999 income range is the most frequent in Benavides, accounting for 26.3% of all households.
| Income Bracket | # Households | % Households |
| Less than $10,000 | 18 | 4.5% |
| $10,000 to $14,999 | 39 | 9.8% |
| $15,000 to $24,999 | 44 | 11.0% |
| $25,000 to $34,999 | 71 | 17.8% |
| $35,000 to $49,999 | 12 | 3.0% |
| $50,000 to $74,999 | 105 | 26.3% |
| $75,000 to $99,999 | 17 | 4.3% |
| $100,000 to $149,999 | 90 | 22.6% |
| $150,000 to $199,999 | 3 | 0.8% |
| $200,000+ | 0 | 0.0% |
Household Income by Householder Age in Benavides
The median household income in Benavides is $56,198, with the highest median household income of $135,130 found in the 25 to 44 years age bracket for the primary householder. A total of 146 households (36.6%) fall into this category.
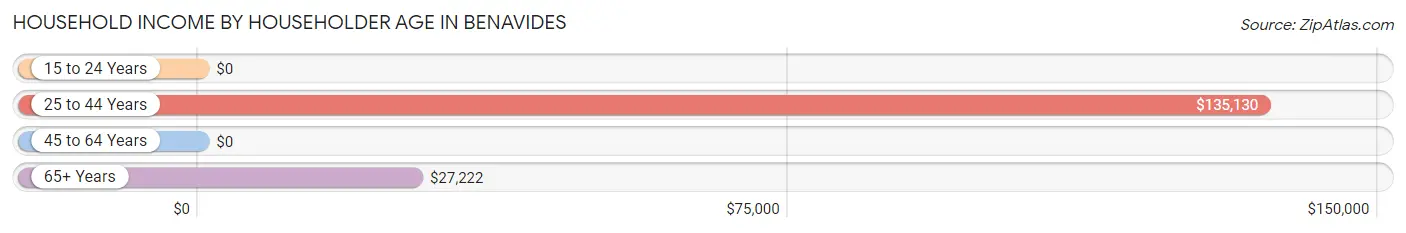
| Income Bracket | # Households | Median Income |
| 15 to 24 Years | 0 (0.0%) | $0 |
| 25 to 44 Years | 146 (36.6%) | $135,130 |
| 45 to 64 Years | 147 (36.8%) | $0 |
| 65+ Years | 106 (26.6%) | $27,222 |
| Total | 399 (100.0%) | $56,198 |
Poverty in Benavides
Income Below Poverty by Sex and Age in Benavides
With 18.5% poverty level for males and 28.1% for females among the residents of Benavides, 6 to 11 year old males and 12 to 14 year old females are the most vulnerable to poverty, with 24 males (50.0%) and 35 females (100.0%) in their respective age groups living below the poverty level.
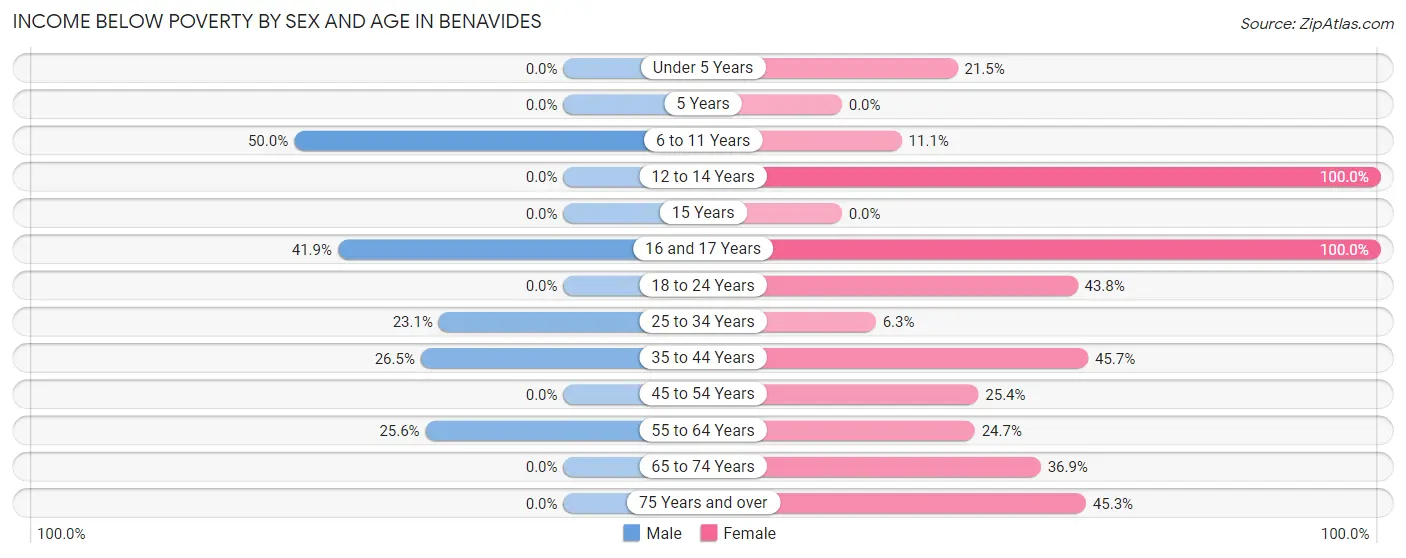
| Age Bracket | Male | Female |
| Under 5 Years | 0 (0.0%) | 26 (21.5%) |
| 5 Years | 0 (0.0%) | 0 (0.0%) |
| 6 to 11 Years | 24 (50.0%) | 13 (11.1%) |
| 12 to 14 Years | 0 (0.0%) | 35 (100.0%) |
| 15 Years | 0 (0.0%) | 0 (0.0%) |
| 16 and 17 Years | 18 (41.9%) | 7 (100.0%) |
| 18 to 24 Years | 0 (0.0%) | 28 (43.8%) |
| 25 to 34 Years | 31 (23.1%) | 8 (6.3%) |
| 35 to 44 Years | 9 (26.5%) | 16 (45.7%) |
| 45 to 54 Years | 0 (0.0%) | 18 (25.4%) |
| 55 to 64 Years | 32 (25.6%) | 19 (24.7%) |
| 65 to 74 Years | 0 (0.0%) | 24 (36.9%) |
| 75 Years and over | 0 (0.0%) | 29 (45.3%) |
| Total | 114 (18.5%) | 223 (28.1%) |
Income Above Poverty by Sex and Age in Benavides
According to the poverty statistics in Benavides, males aged under 5 years and females aged 15 years are the age groups that are most secure financially, with 100.0% of males and 100.0% of females in these age groups living above the poverty line.
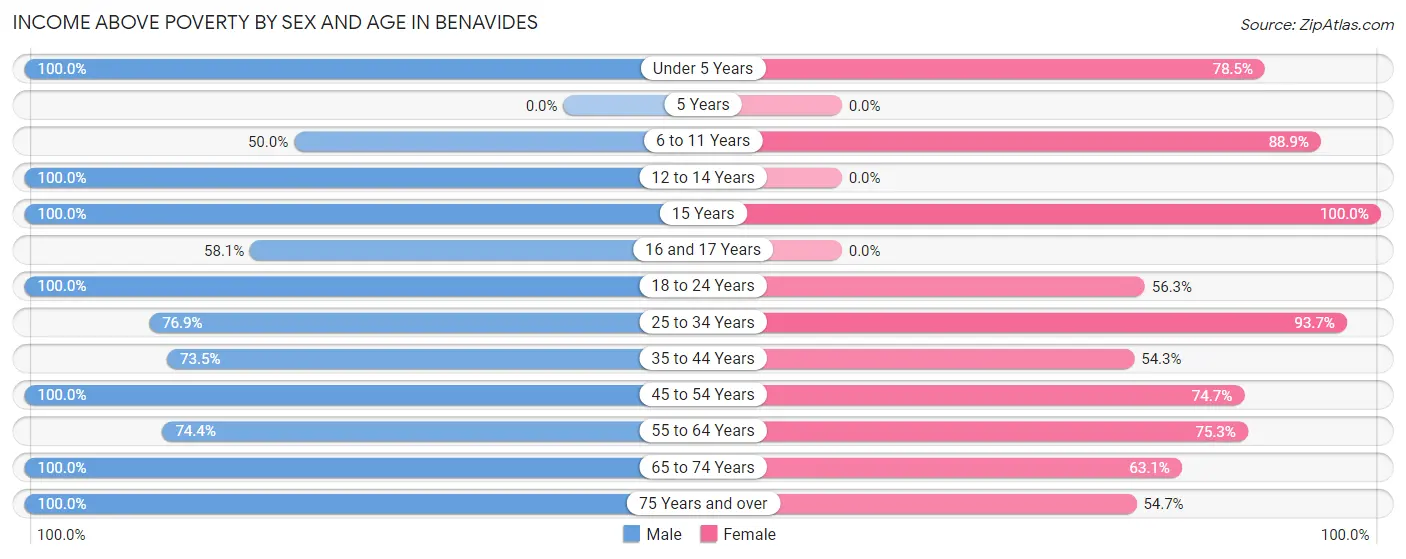
| Age Bracket | Male | Female |
| Under 5 Years | 57 (100.0%) | 95 (78.5%) |
| 5 Years | 0 (0.0%) | 0 (0.0%) |
| 6 to 11 Years | 24 (50.0%) | 104 (88.9%) |
| 12 to 14 Years | 12 (100.0%) | 0 (0.0%) |
| 15 Years | 6 (100.0%) | 11 (100.0%) |
| 16 and 17 Years | 25 (58.1%) | 0 (0.0%) |
| 18 to 24 Years | 83 (100.0%) | 36 (56.2%) |
| 25 to 34 Years | 103 (76.9%) | 119 (93.7%) |
| 35 to 44 Years | 25 (73.5%) | 19 (54.3%) |
| 45 to 54 Years | 10 (100.0%) | 53 (74.7%) |
| 55 to 64 Years | 93 (74.4%) | 58 (75.3%) |
| 65 to 74 Years | 31 (100.0%) | 41 (63.1%) |
| 75 Years and over | 32 (100.0%) | 35 (54.7%) |
| Total | 501 (81.5%) | 571 (71.9%) |
Income Below Poverty Among Married-Couple Families in Benavides
The poverty statistics for married-couple families in Benavides show that 12.2% or 28 of the total 229 families live below the poverty line. Families with 3 or 4 children have the highest poverty rate of 64.7%, comprising of 11 families. On the other hand, families with 1 or 2 children have the lowest poverty rate of 6.5%, which includes 8 families.
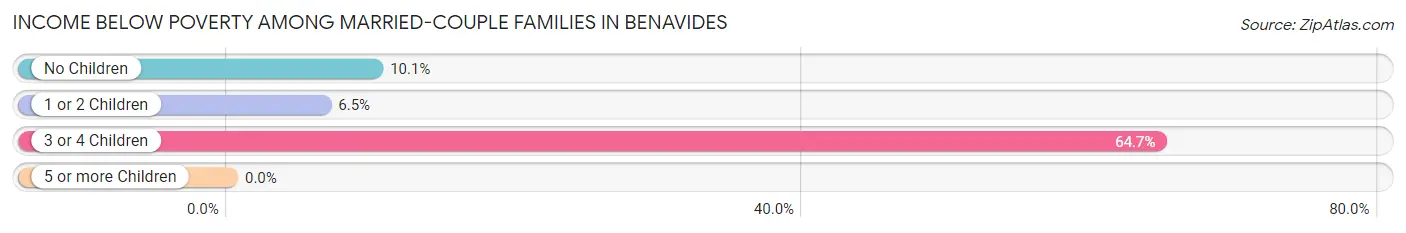
| Children | Above Poverty | Below Poverty |
| No Children | 80 (89.9%) | 9 (10.1%) |
| 1 or 2 Children | 115 (93.5%) | 8 (6.5%) |
| 3 or 4 Children | 6 (35.3%) | 11 (64.7%) |
| 5 or more Children | 0 (0.0%) | 0 (0.0%) |
| Total | 201 (87.8%) | 28 (12.2%) |
Income Below Poverty Among Single-Parent Households in Benavides
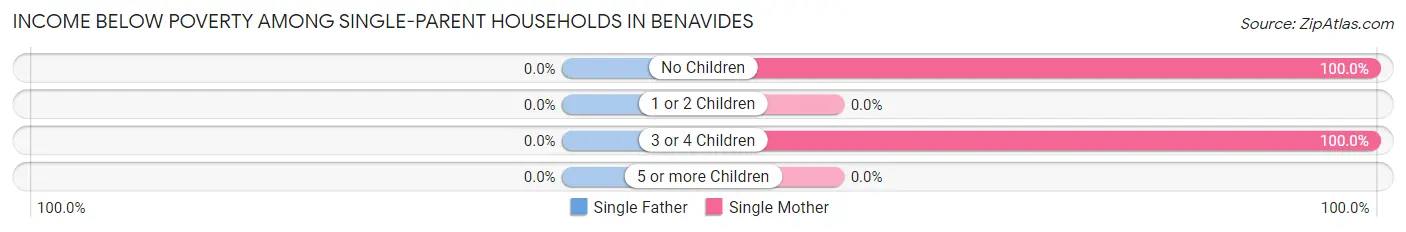
| Children | Single Father | Single Mother |
| No Children | 0 (0.0%) | 3 (100.0%) |
| 1 or 2 Children | 0 (0.0%) | 0 (0.0%) |
| 3 or 4 Children | 0 (0.0%) | 23 (100.0%) |
| 5 or more Children | 0 (0.0%) | 0 (0.0%) |
| Total | 0 (0.0%) | 26 (57.8%) |
Income Below Poverty Among Married-Couple vs Single-Parent Households in Benavides
The poverty data for Benavides shows that 28 of the married-couple family households (12.2%) and 26 of the single-parent households (29.5%) are living below the poverty level. Within the married-couple family households, those with 3 or 4 children have the highest poverty rate, with 11 households (64.7%) falling below the poverty line. Among the single-parent households, those with 3 or 4 children have the highest poverty rate, with 23 household (100.0%) living below poverty.
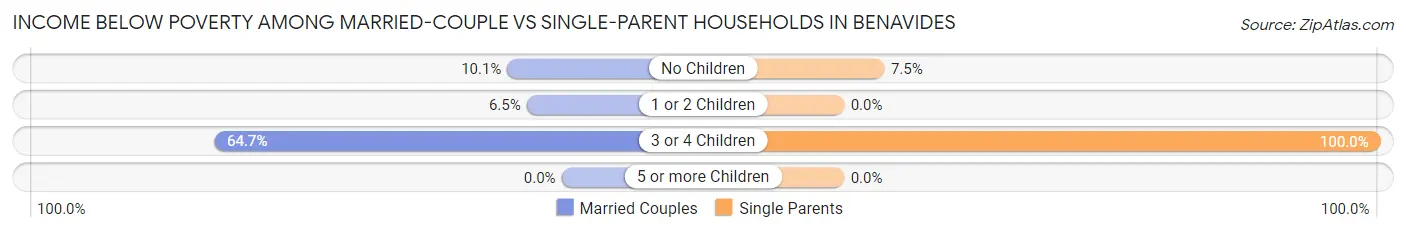
| Children | Married-Couple Families | Single-Parent Households |
| No Children | 9 (10.1%) | 3 (7.5%) |
| 1 or 2 Children | 8 (6.5%) | 0 (0.0%) |
| 3 or 4 Children | 11 (64.7%) | 23 (100.0%) |
| 5 or more Children | 0 (0.0%) | 0 (0.0%) |
| Total | 28 (12.2%) | 26 (29.5%) |
Race in Benavides
The most populous races in Benavides are Hispanic or Latino (1,340 | 95.1%), White / Caucasian (1,285 | 91.2%), and Two or more Races (124 | 8.8%).
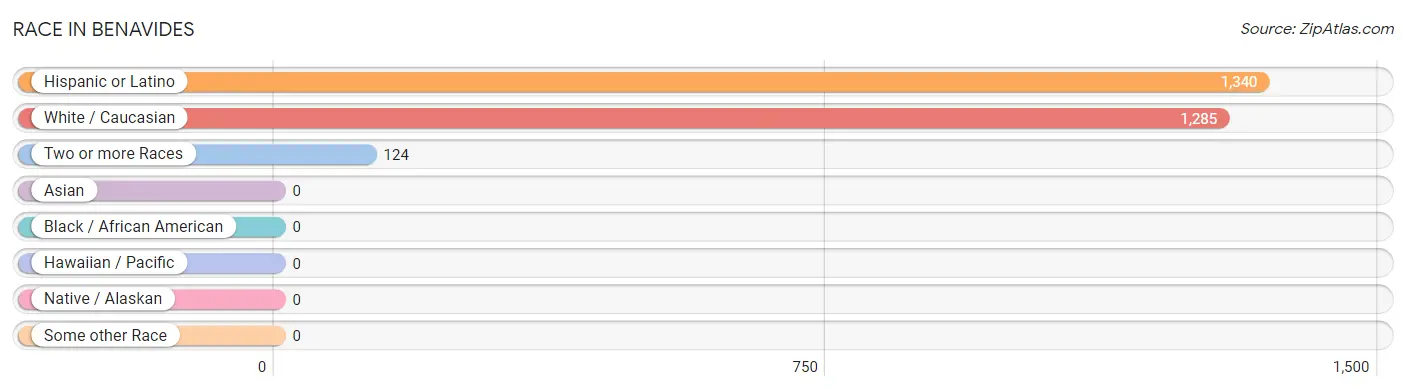
| Race | # Population | % Population |
| Asian | 0 | 0.0% |
| Black / African American | 0 | 0.0% |
| Hawaiian / Pacific | 0 | 0.0% |
| Hispanic or Latino | 1,340 | 95.1% |
| Native / Alaskan | 0 | 0.0% |
| White / Caucasian | 1,285 | 91.2% |
| Two or more Races | 124 | 8.8% |
| Some other Race | 0 | 0.0% |
| Total | 1,409 | 100.0% |
Ancestry in Benavides
The most populous ancestries reported in Benavides are Mexican (1,257 | 89.2%), English (19 | 1.3%), German (19 | 1.3%), and American (13 | 0.9%), together accounting for 92.8% of all Benavides residents.
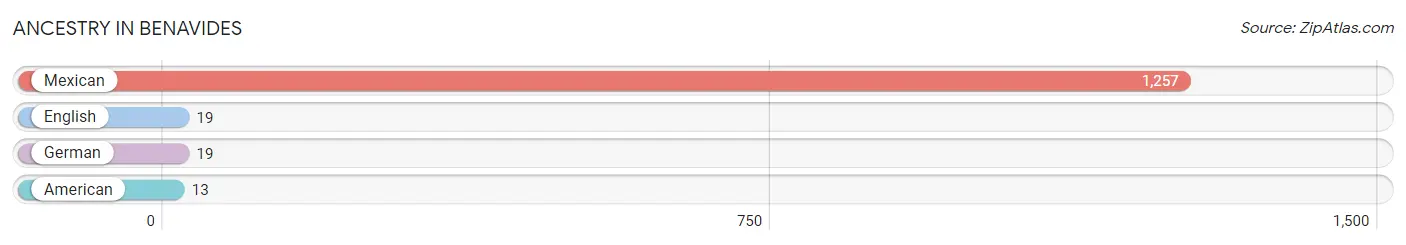
| Ancestry | # Population | % Population |
| American | 13 | 0.9% |
| English | 19 | 1.3% |
| German | 19 | 1.3% |
| Mexican | 1,257 | 89.2% | View All 4 Rows |
Immigrants in Benavides
The most numerous immigrant groups reported in Benavides came from Central America (63 | 4.5%), Latin America (63 | 4.5%), and Mexico (63 | 4.5%), together accounting for 13.4% of all Benavides residents.
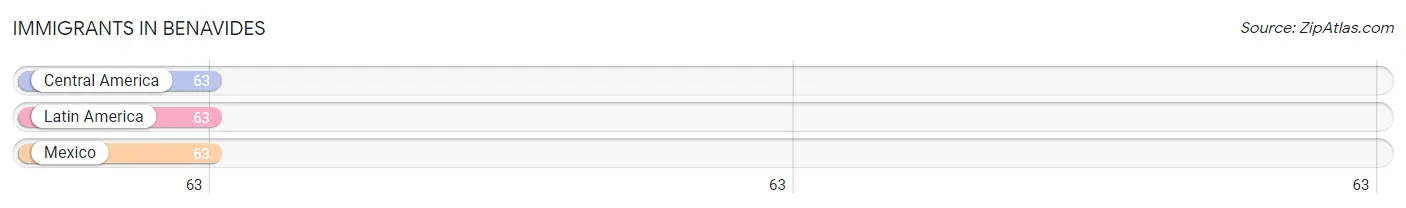
| Immigration Origin | # Population | % Population |
| Central America | 63 | 4.5% |
| Latin America | 63 | 4.5% |
| Mexico | 63 | 4.5% | View All 3 Rows |
Sex and Age in Benavides
Sex and Age in Benavides
The most populous age groups in Benavides are 25 to 29 Years (128 | 20.8%) for men and Under 5 Years (121 | 15.2%) for women.
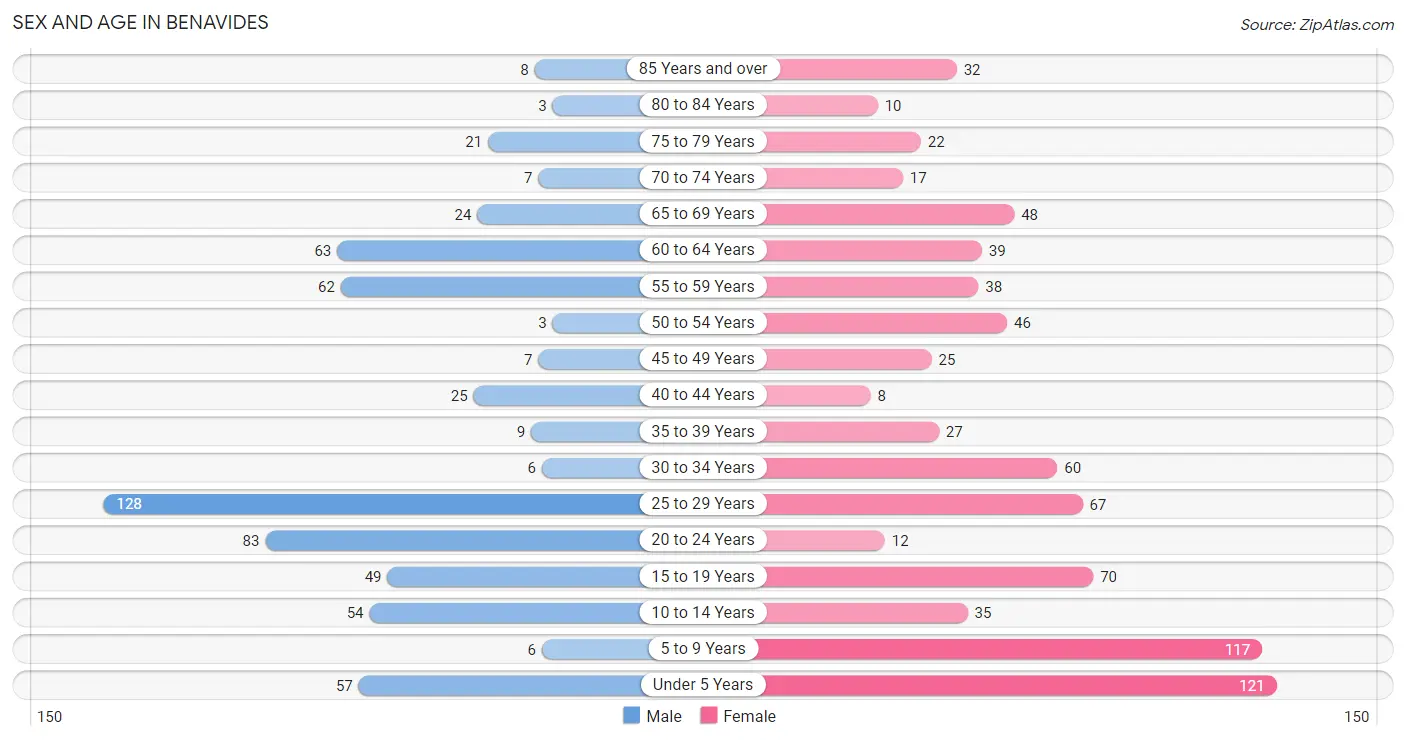
| Age Bracket | Male | Female |
| Under 5 Years | 57 (9.3%) | 121 (15.2%) |
| 5 to 9 Years | 6 (1.0%) | 117 (14.7%) |
| 10 to 14 Years | 54 (8.8%) | 35 (4.4%) |
| 15 to 19 Years | 49 (8.0%) | 70 (8.8%) |
| 20 to 24 Years | 83 (13.5%) | 12 (1.5%) |
| 25 to 29 Years | 128 (20.8%) | 67 (8.4%) |
| 30 to 34 Years | 6 (1.0%) | 60 (7.6%) |
| 35 to 39 Years | 9 (1.5%) | 27 (3.4%) |
| 40 to 44 Years | 25 (4.1%) | 8 (1.0%) |
| 45 to 49 Years | 7 (1.1%) | 25 (3.2%) |
| 50 to 54 Years | 3 (0.5%) | 46 (5.8%) |
| 55 to 59 Years | 62 (10.1%) | 38 (4.8%) |
| 60 to 64 Years | 63 (10.2%) | 39 (4.9%) |
| 65 to 69 Years | 24 (3.9%) | 48 (6.0%) |
| 70 to 74 Years | 7 (1.1%) | 17 (2.1%) |
| 75 to 79 Years | 21 (3.4%) | 22 (2.8%) |
| 80 to 84 Years | 3 (0.5%) | 10 (1.3%) |
| 85 Years and over | 8 (1.3%) | 32 (4.0%) |
| Total | 615 (100.0%) | 794 (100.0%) |
Families and Households in Benavides
Median Family Size in Benavides
The median family size in Benavides is 4.13 persons per family, with single female/mother families (45 | 14.2%) accounting for the largest median family size of 4.84 persons per family. On the other hand, single male/father families (43 | 13.6%) represent the smallest median family size with 2.51 persons per family.
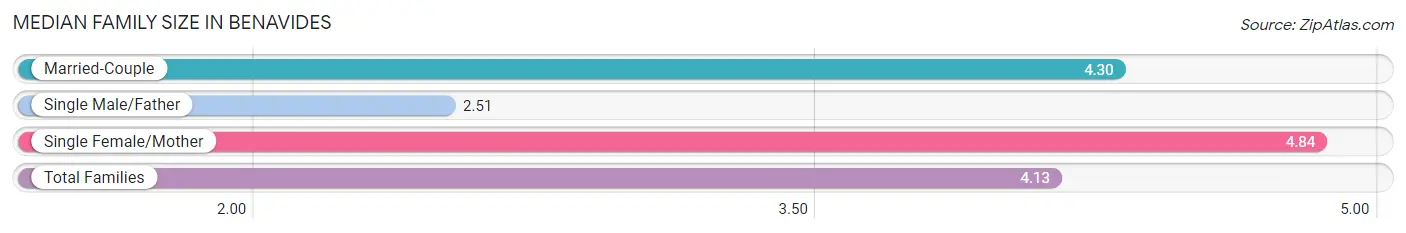
| Family Type | # Families | Family Size |
| Married-Couple | 229 (72.2%) | 4.30 |
| Single Male/Father | 43 (13.6%) | 2.51 |
| Single Female/Mother | 45 (14.2%) | 4.84 |
| Total Families | 317 (100.0%) | 4.13 |
Median Household Size in Benavides
The median household size in Benavides is 3.53 persons per household, with single female/mother households (45 | 11.3%) accounting for the largest median household size of 4.84 persons per household. non-family households (82 | 20.5%) represent the smallest median household size with 1.06 persons per household.
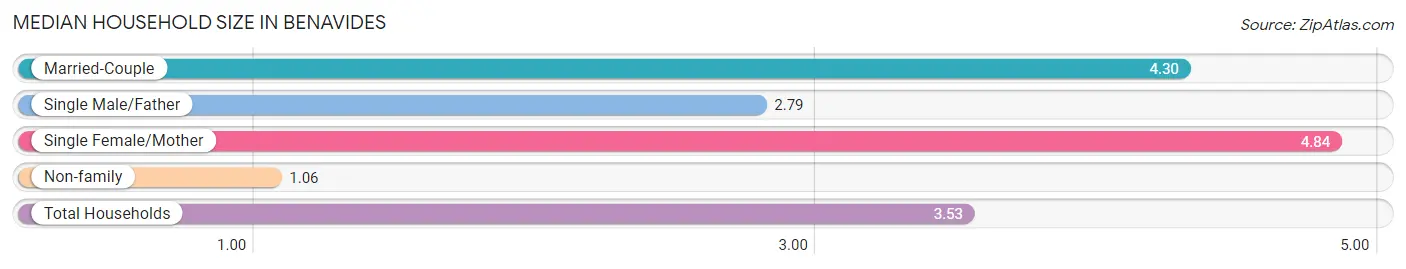
| Household Type | # Households | Household Size |
| Married-Couple | 229 (57.4%) | 4.30 |
| Single Male/Father | 43 (10.8%) | 2.79 |
| Single Female/Mother | 45 (11.3%) | 4.84 |
| Non-family | 82 (20.5%) | 1.06 |
| Total Households | 399 (100.0%) | 3.53 |
Household Size by Marriage Status in Benavides
Out of a total of 399 households in Benavides, 317 (79.4%) are family households, while 82 (20.5%) are nonfamily households. The most numerous type of family households are 4-person households, comprising 113, and the most common type of nonfamily households are 1-person households, comprising 80.
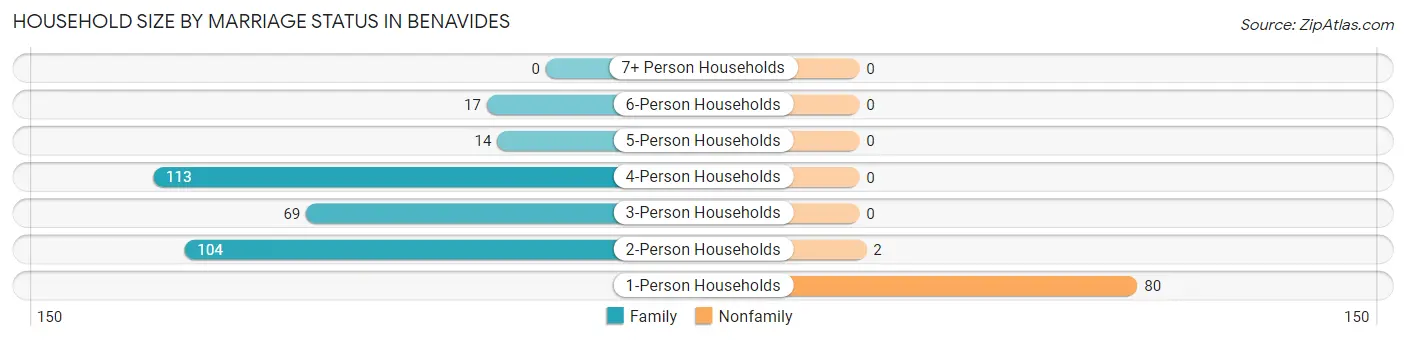
| Household Size | Family Households | Nonfamily Households |
| 1-Person Households | - | 80 (20.1%) |
| 2-Person Households | 104 (26.1%) | 2 (0.5%) |
| 3-Person Households | 69 (17.3%) | 0 (0.0%) |
| 4-Person Households | 113 (28.3%) | 0 (0.0%) |
| 5-Person Households | 14 (3.5%) | 0 (0.0%) |
| 6-Person Households | 17 (4.3%) | 0 (0.0%) |
| 7+ Person Households | 0 (0.0%) | 0 (0.0%) |
| Total | 317 (79.4%) | 82 (20.5%) |
Female Fertility in Benavides
Fertility by Age in Benavides
Average fertility rate in Benavides is 45.0 births per 1,000 women. Women in the age bracket of 20 to 34 years have the highest fertility rate with 86.0 births per 1,000 women. Women in the age bracket of 20 to 34 years acount for 100.0% of all women with births.
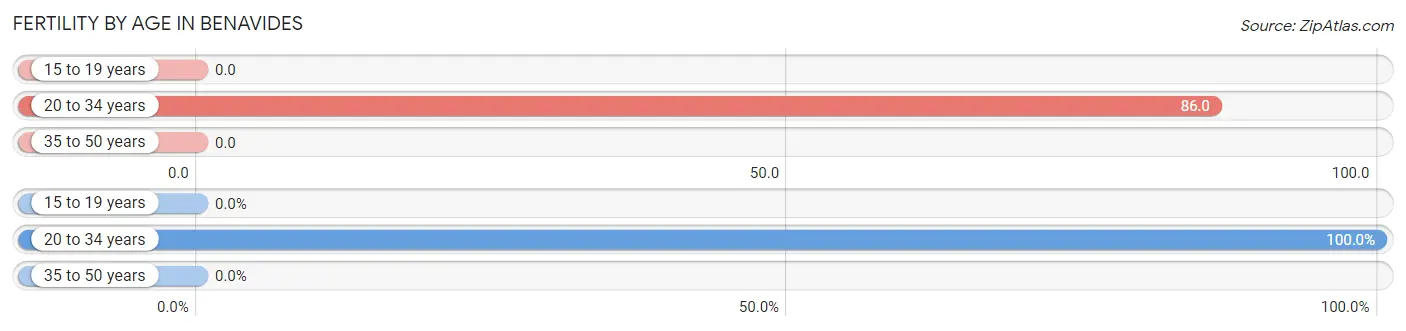
| Age Bracket | Women with Births | Births / 1,000 Women |
| 15 to 19 years | 0 (0.0%) | 0.0 |
| 20 to 34 years | 12 (100.0%) | 86.0 |
| 35 to 50 years | 0 (0.0%) | 0.0 |
| Total | 12 (100.0%) | 45.0 |
Fertility by Age by Marriage Status in Benavides
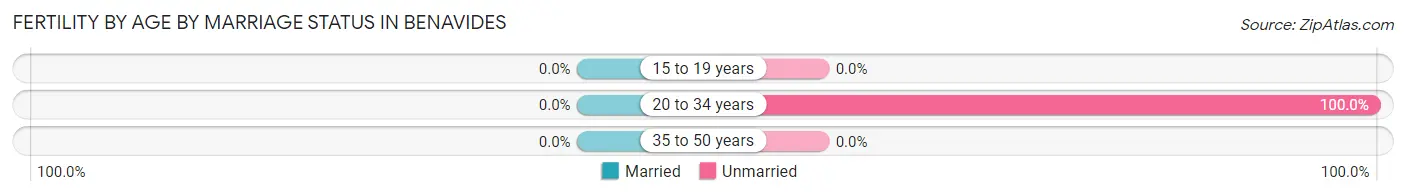
| Age Bracket | Married | Unmarried |
| 15 to 19 years | 0 (0.0%) | 0 (0.0%) |
| 20 to 34 years | 0 (0.0%) | 12 (100.0%) |
| 35 to 50 years | 0 (0.0%) | 0 (0.0%) |
| Total | 0 (0.0%) | 12 (100.0%) |
Fertility by Education in Benavides
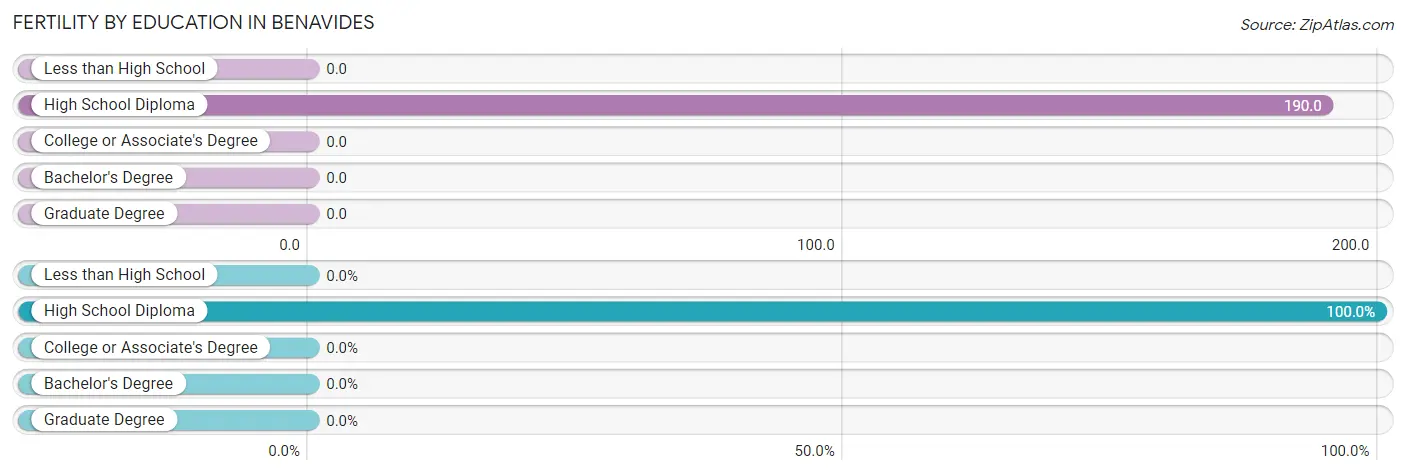
| Educational Attainment | Women with Births | Births / 1,000 Women |
| Less than High School | 0 (0.0%) | 0.0 |
| High School Diploma | 12 (100.0%) | 190.0 |
| College or Associate's Degree | 0 (0.0%) | 0.0 |
| Bachelor's Degree | 0 (0.0%) | 0.0 |
| Graduate Degree | 0 (0.0%) | 0.0 |
| Total | 12 (100.0%) | 45.0 |
Fertility by Education by Marriage Status in Benavides
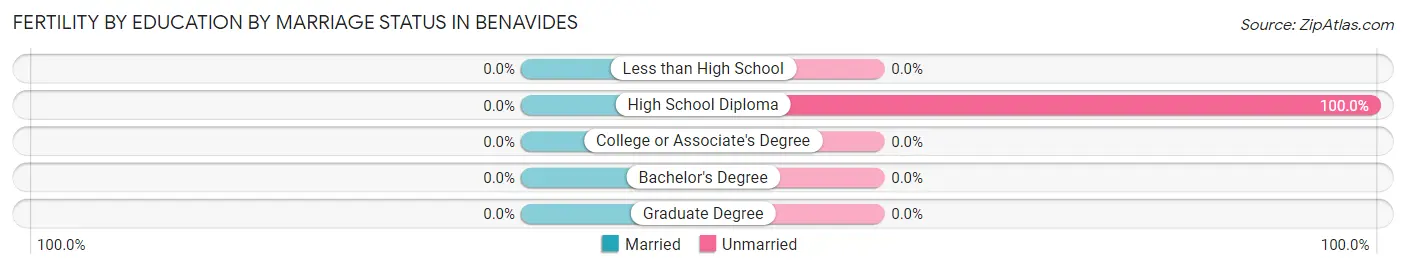
| Educational Attainment | Married | Unmarried |
| Less than High School | 0 (0.0%) | 0 (0.0%) |
| High School Diploma | 0 (0.0%) | 12 (100.0%) |
| College or Associate's Degree | 0 (0.0%) | 0 (0.0%) |
| Bachelor's Degree | 0 (0.0%) | 0 (0.0%) |
| Graduate Degree | 0 (0.0%) | 0 (0.0%) |
| Total | 0 (0.0%) | 12 (100.0%) |
Employment Characteristics in Benavides
Employment by Class of Employer in Benavides
Among the 456 employed individuals in Benavides, private company employees (352 | 77.2%), self-employed (not incorporated) (48 | 10.5%), and not-for-profit organizations (23 | 5.0%) make up the most common classes of employment.
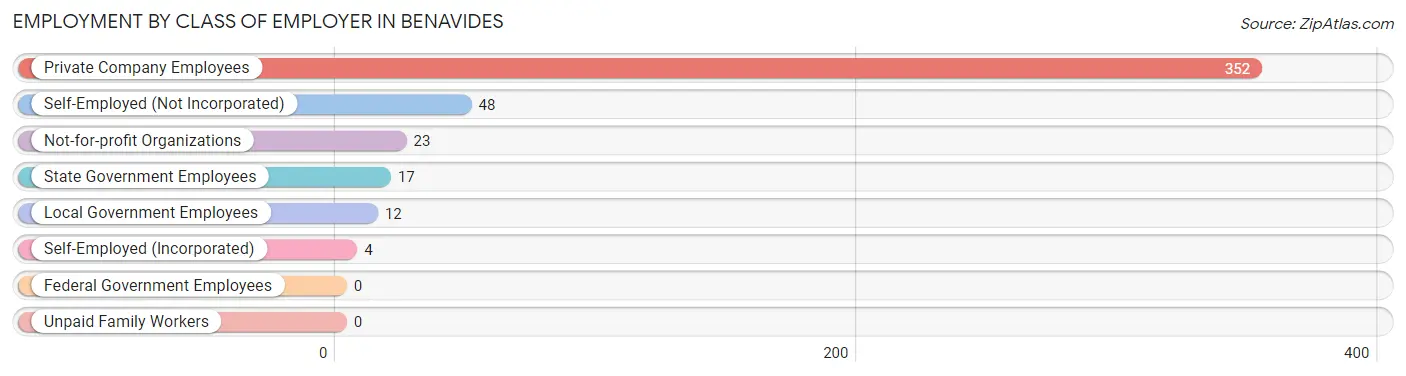
| Employer Class | # Employees | % Employees |
| Private Company Employees | 352 | 77.2% |
| Self-Employed (Incorporated) | 4 | 0.9% |
| Self-Employed (Not Incorporated) | 48 | 10.5% |
| Not-for-profit Organizations | 23 | 5.0% |
| Local Government Employees | 12 | 2.6% |
| State Government Employees | 17 | 3.7% |
| Federal Government Employees | 0 | 0.0% |
| Unpaid Family Workers | 0 | 0.0% |
| Total | 456 | 100.0% |
Employment Status by Age in Benavides
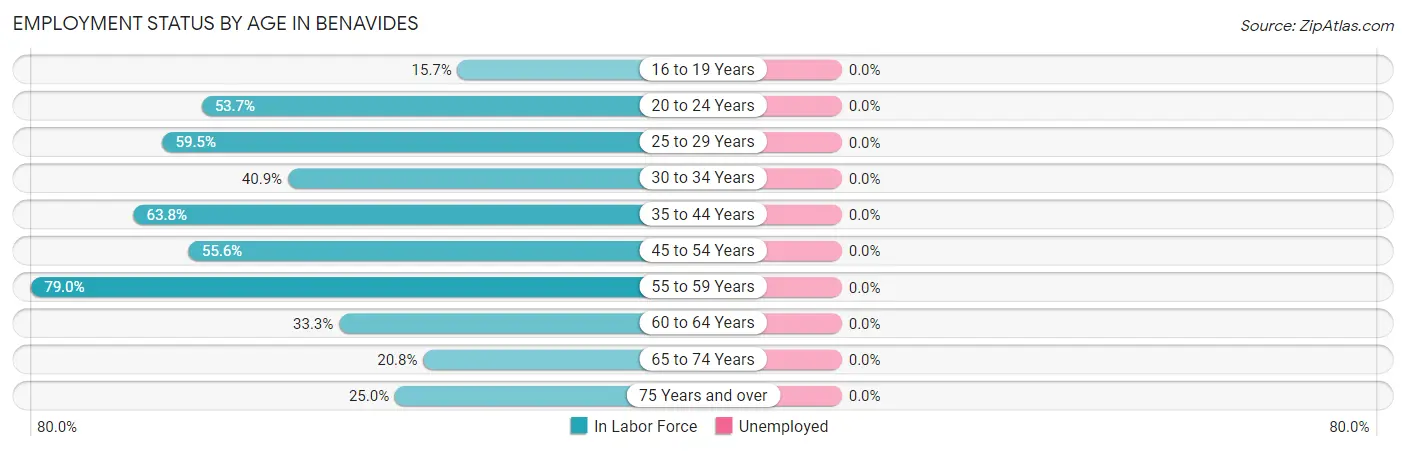
| Age Bracket | In Labor Force | Unemployed |
| 16 to 19 Years | 16 (15.7%) | 0 (0.0%) |
| 20 to 24 Years | 51 (53.7%) | 0 (0.0%) |
| 25 to 29 Years | 116 (59.5%) | 0 (0.0%) |
| 30 to 34 Years | 27 (40.9%) | 0 (0.0%) |
| 35 to 44 Years | 44 (63.8%) | 0 (0.0%) |
| 45 to 54 Years | 45 (55.6%) | 0 (0.0%) |
| 55 to 59 Years | 79 (79.0%) | 0 (0.0%) |
| 60 to 64 Years | 34 (33.3%) | 0 (0.0%) |
| 65 to 74 Years | 20 (20.8%) | 0 (0.0%) |
| 75 Years and over | 24 (25.0%) | 0 (0.0%) |
| Total | 456 (45.5%) | 0 (0.0%) |
Employment Status by Educational Attainment in Benavides
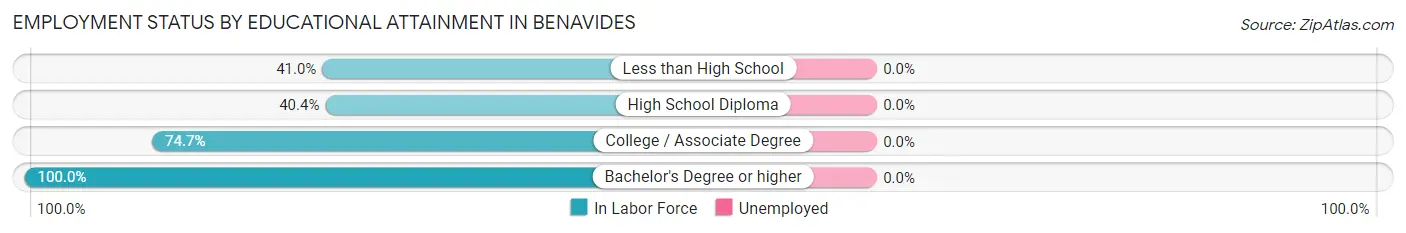
| Educational Attainment | In Labor Force | Unemployed |
| Less than High School | 32 (41.0%) | 0 (0.0%) |
| High School Diploma | 109 (40.4%) | 0 (0.0%) |
| College / Associate Degree | 180 (74.7%) | 0 (0.0%) |
| Bachelor's Degree or higher | 24 (100.0%) | 0 (0.0%) |
| Total | 345 (56.3%) | 0 (0.0%) |
Employment Occupations by Sex in Benavides
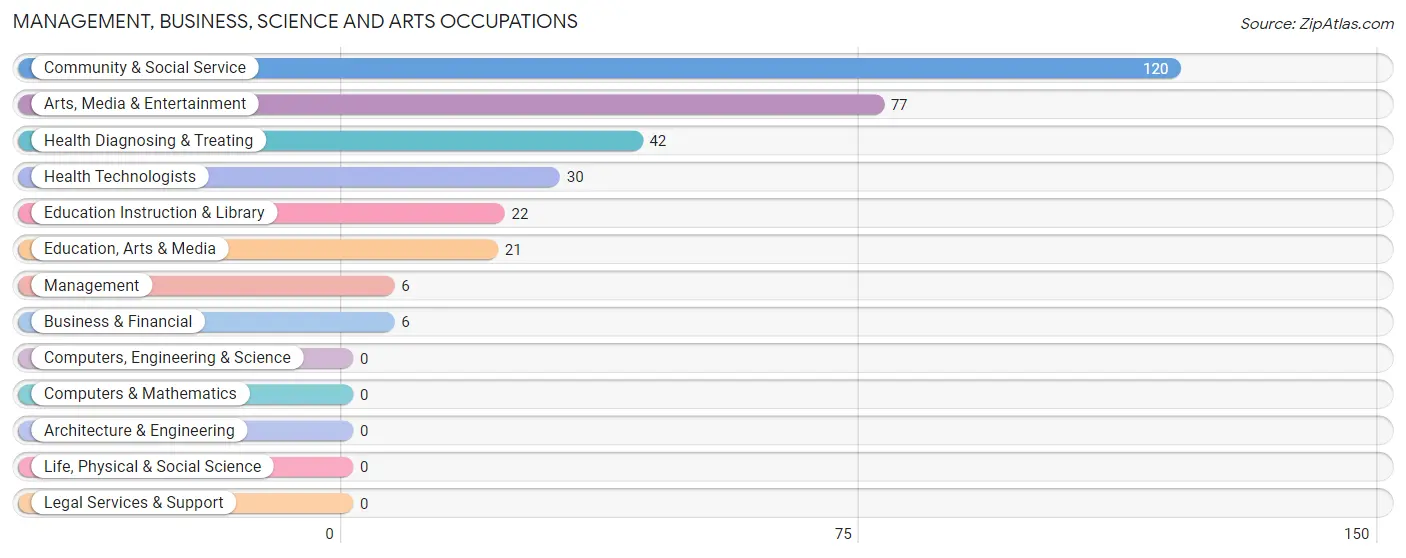
Management, Business, Science and Arts Occupations
The most common Management, Business, Science and Arts occupations in Benavides are Community & Social Service (120 | 26.3%), Arts, Media & Entertainment (77 | 16.9%), Health Diagnosing & Treating (42 | 9.2%), Health Technologists (30 | 6.6%), and Education Instruction & Library (22 | 4.8%).
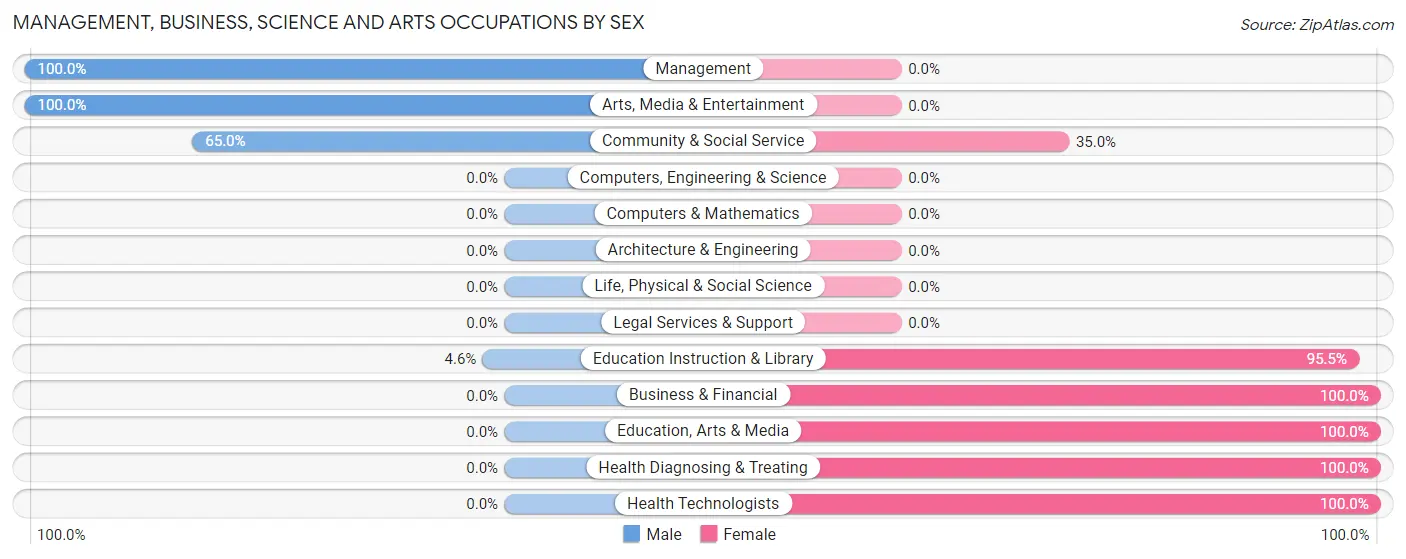
Management, Business, Science and Arts Occupations by Sex
Within the Management, Business, Science and Arts occupations in Benavides, the most male-oriented occupations are Management (100.0%), Arts, Media & Entertainment (100.0%), and Community & Social Service (65.0%), while the most female-oriented occupations are Business & Financial (100.0%), Education, Arts & Media (100.0%), and Health Diagnosing & Treating (100.0%).
| Occupation | Male | Female |
| Management | 6 (100.0%) | 0 (0.0%) |
| Business & Financial | 0 (0.0%) | 6 (100.0%) |
| Computers, Engineering & Science | 0 (0.0%) | 0 (0.0%) |
| Computers & Mathematics | 0 (0.0%) | 0 (0.0%) |
| Architecture & Engineering | 0 (0.0%) | 0 (0.0%) |
| Life, Physical & Social Science | 0 (0.0%) | 0 (0.0%) |
| Community & Social Service | 78 (65.0%) | 42 (35.0%) |
| Education, Arts & Media | 0 (0.0%) | 21 (100.0%) |
| Legal Services & Support | 0 (0.0%) | 0 (0.0%) |
| Education Instruction & Library | 1 (4.5%) | 21 (95.5%) |
| Arts, Media & Entertainment | 77 (100.0%) | 0 (0.0%) |
| Health Diagnosing & Treating | 0 (0.0%) | 42 (100.0%) |
| Health Technologists | 0 (0.0%) | 30 (100.0%) |
| Total (Category) | 84 (48.3%) | 90 (51.7%) |
| Total (Overall) | 271 (59.4%) | 185 (40.6%) |
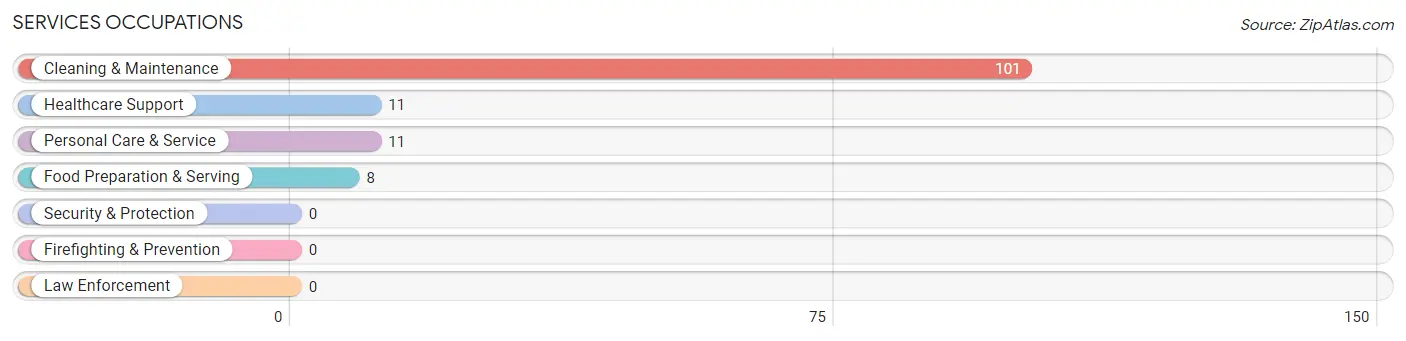
Services Occupations
The most common Services occupations in Benavides are Cleaning & Maintenance (101 | 22.2%), Healthcare Support (11 | 2.4%), Personal Care & Service (11 | 2.4%), and Food Preparation & Serving (8 | 1.8%).
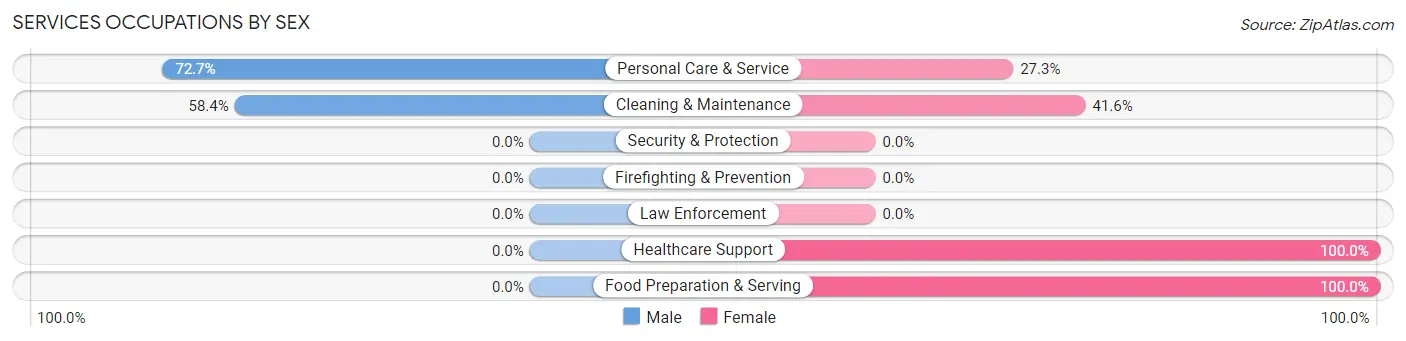
Services Occupations by Sex
Within the Services occupations in Benavides, the most male-oriented occupations are Personal Care & Service (72.7%), and Cleaning & Maintenance (58.4%), while the most female-oriented occupations are Healthcare Support (100.0%), Food Preparation & Serving (100.0%), and Cleaning & Maintenance (41.6%).
| Occupation | Male | Female |
| Healthcare Support | 0 (0.0%) | 11 (100.0%) |
| Security & Protection | 0 (0.0%) | 0 (0.0%) |
| Firefighting & Prevention | 0 (0.0%) | 0 (0.0%) |
| Law Enforcement | 0 (0.0%) | 0 (0.0%) |
| Food Preparation & Serving | 0 (0.0%) | 8 (100.0%) |
| Cleaning & Maintenance | 59 (58.4%) | 42 (41.6%) |
| Personal Care & Service | 8 (72.7%) | 3 (27.3%) |
| Total (Category) | 67 (51.1%) | 64 (48.8%) |
| Total (Overall) | 271 (59.4%) | 185 (40.6%) |
Sales and Office Occupations
The most common Sales and Office occupations in Benavides are Sales & Related (22 | 4.8%), and Office & Administration (9 | 2.0%).
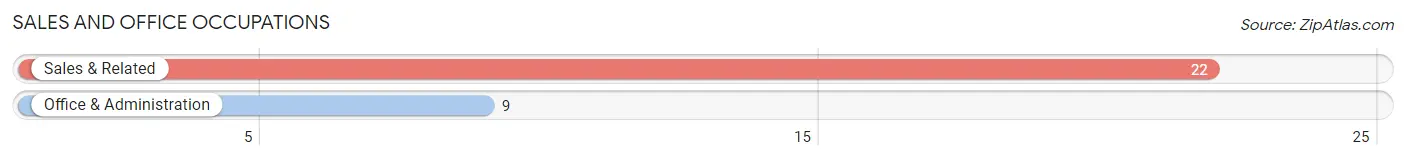
Sales and Office Occupations by Sex
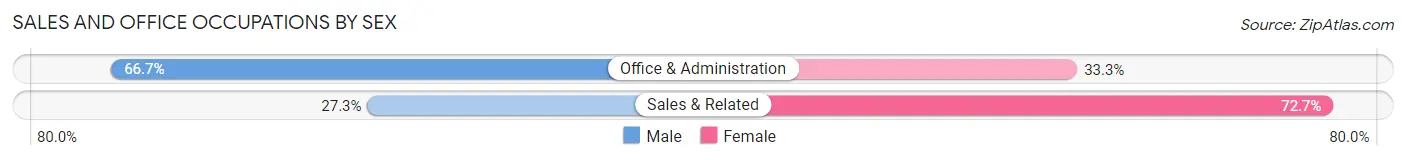
| Occupation | Male | Female |
| Sales & Related | 6 (27.3%) | 16 (72.7%) |
| Office & Administration | 6 (66.7%) | 3 (33.3%) |
| Total (Category) | 12 (38.7%) | 19 (61.3%) |
| Total (Overall) | 271 (59.4%) | 185 (40.6%) |
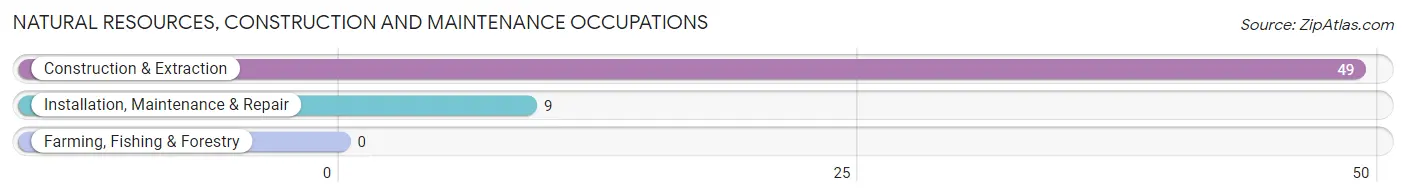
Natural Resources, Construction and Maintenance Occupations
The most common Natural Resources, Construction and Maintenance occupations in Benavides are Construction & Extraction (49 | 10.7%), and Installation, Maintenance & Repair (9 | 2.0%).
Natural Resources, Construction and Maintenance Occupations by Sex
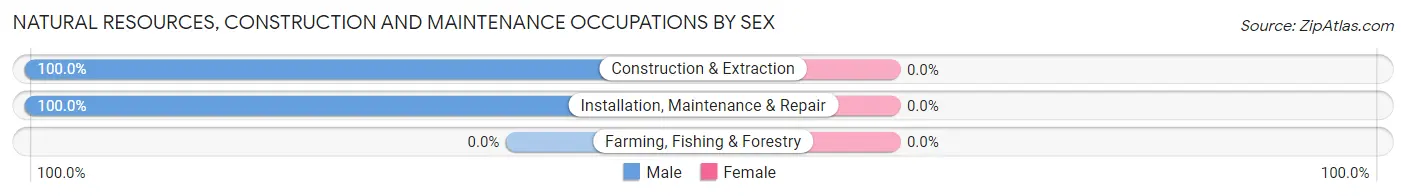
| Occupation | Male | Female |
| Farming, Fishing & Forestry | 0 (0.0%) | 0 (0.0%) |
| Construction & Extraction | 49 (100.0%) | 0 (0.0%) |
| Installation, Maintenance & Repair | 9 (100.0%) | 0 (0.0%) |
| Total (Category) | 58 (100.0%) | 0 (0.0%) |
| Total (Overall) | 271 (59.4%) | 185 (40.6%) |
Production, Transportation and Moving Occupations
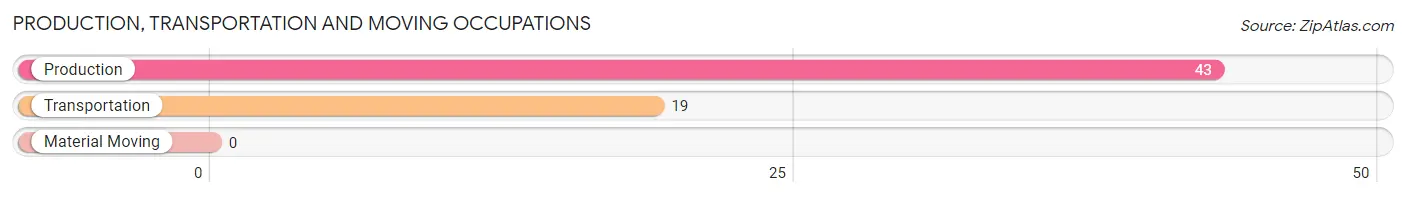
The most common Production, Transportation and Moving occupations in Benavides are Production (43 | 9.4%), and Transportation (19 | 4.2%).
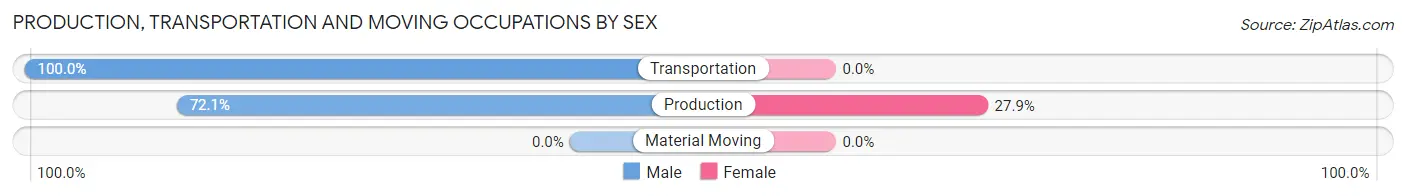
Production, Transportation and Moving Occupations by Sex
| Occupation | Male | Female |
| Production | 31 (72.1%) | 12 (27.9%) |
| Transportation | 19 (100.0%) | 0 (0.0%) |
| Material Moving | 0 (0.0%) | 0 (0.0%) |
| Total (Category) | 50 (80.6%) | 12 (19.4%) |
| Total (Overall) | 271 (59.4%) | 185 (40.6%) |
Employment Industries by Sex in Benavides
Employment Industries in Benavides
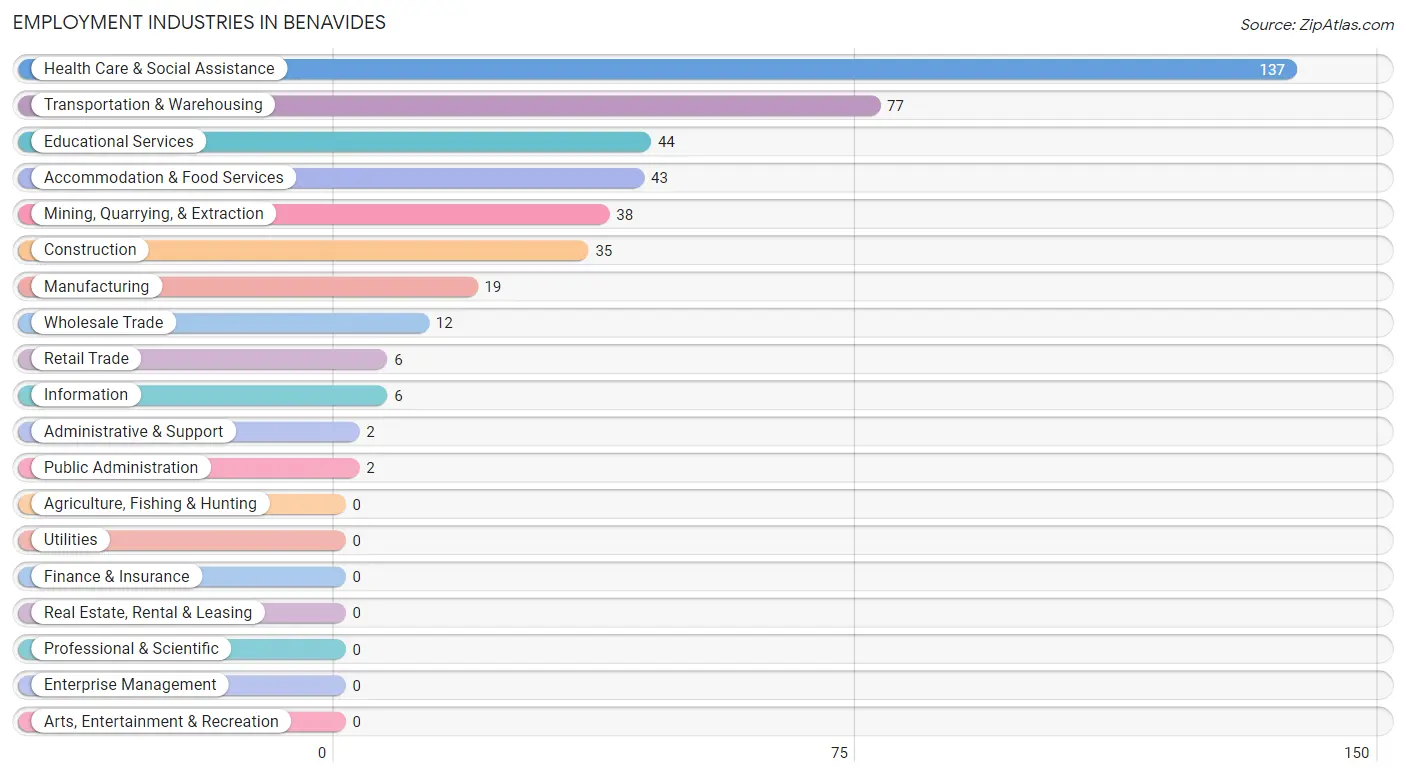
The major employment industries in Benavides include Health Care & Social Assistance (137 | 30.0%), Transportation & Warehousing (77 | 16.9%), Educational Services (44 | 9.7%), Accommodation & Food Services (43 | 9.4%), and Mining, Quarrying, & Extraction (38 | 8.3%).
Employment Industries by Sex in Benavides
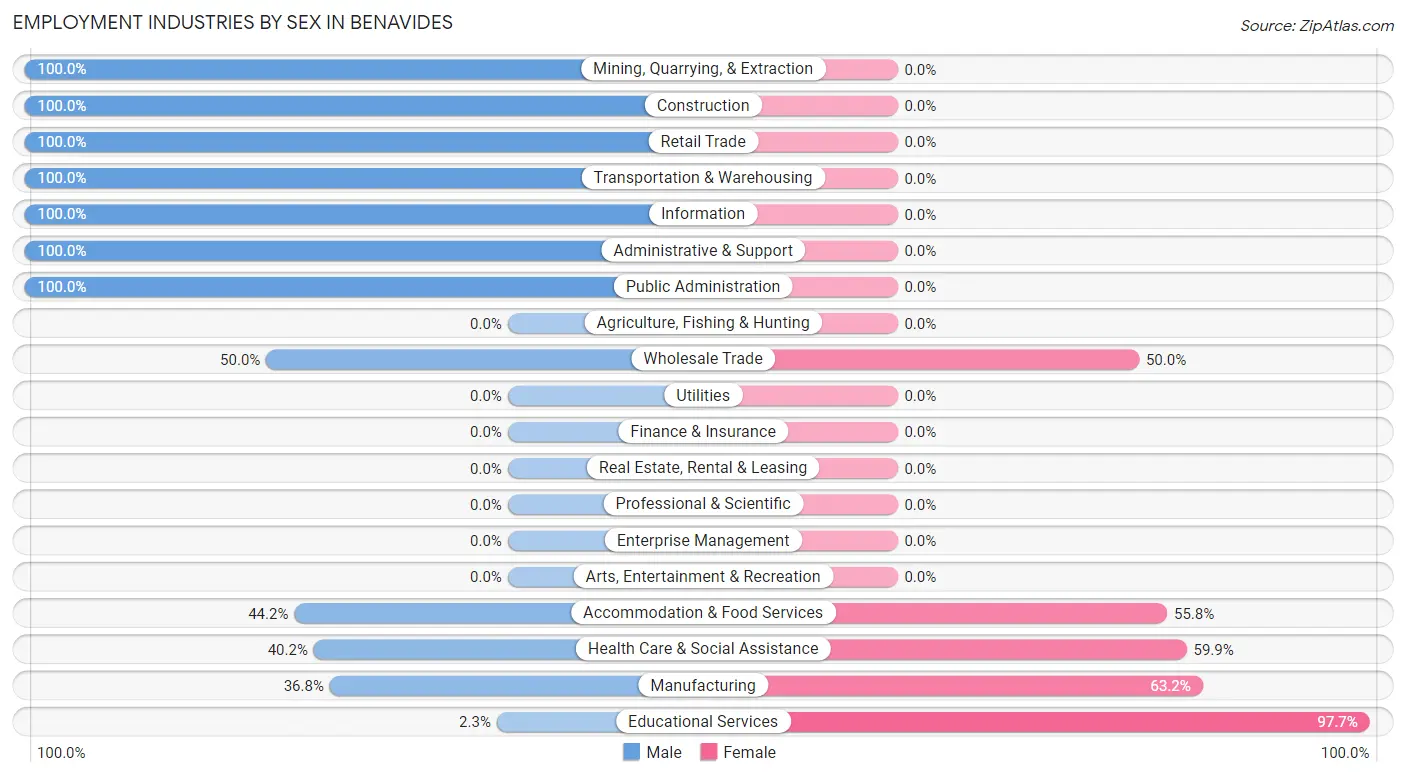
The Benavides industries that see more men than women are Mining, Quarrying, & Extraction (100.0%), Construction (100.0%), and Retail Trade (100.0%), whereas the industries that tend to have a higher number of women are Educational Services (97.7%), Manufacturing (63.2%), and Health Care & Social Assistance (59.9%).
| Industry | Male | Female |
| Agriculture, Fishing & Hunting | 0 (0.0%) | 0 (0.0%) |
| Mining, Quarrying, & Extraction | 38 (100.0%) | 0 (0.0%) |
| Construction | 35 (100.0%) | 0 (0.0%) |
| Manufacturing | 7 (36.8%) | 12 (63.2%) |
| Wholesale Trade | 6 (50.0%) | 6 (50.0%) |
| Retail Trade | 6 (100.0%) | 0 (0.0%) |
| Transportation & Warehousing | 77 (100.0%) | 0 (0.0%) |
| Utilities | 0 (0.0%) | 0 (0.0%) |
| Information | 6 (100.0%) | 0 (0.0%) |
| Finance & Insurance | 0 (0.0%) | 0 (0.0%) |
| Real Estate, Rental & Leasing | 0 (0.0%) | 0 (0.0%) |
| Professional & Scientific | 0 (0.0%) | 0 (0.0%) |
| Enterprise Management | 0 (0.0%) | 0 (0.0%) |
| Administrative & Support | 2 (100.0%) | 0 (0.0%) |
| Educational Services | 1 (2.3%) | 43 (97.7%) |
| Health Care & Social Assistance | 55 (40.2%) | 82 (59.9%) |
| Arts, Entertainment & Recreation | 0 (0.0%) | 0 (0.0%) |
| Accommodation & Food Services | 19 (44.2%) | 24 (55.8%) |
| Public Administration | 2 (100.0%) | 0 (0.0%) |
| Total | 271 (59.4%) | 185 (40.6%) |
Education in Benavides
School Enrollment in Benavides
The most common levels of schooling among the 388 students in Benavides are high school (115 | 29.6%), kindergarten (104 | 26.8%), and middle school (70 | 18.0%).
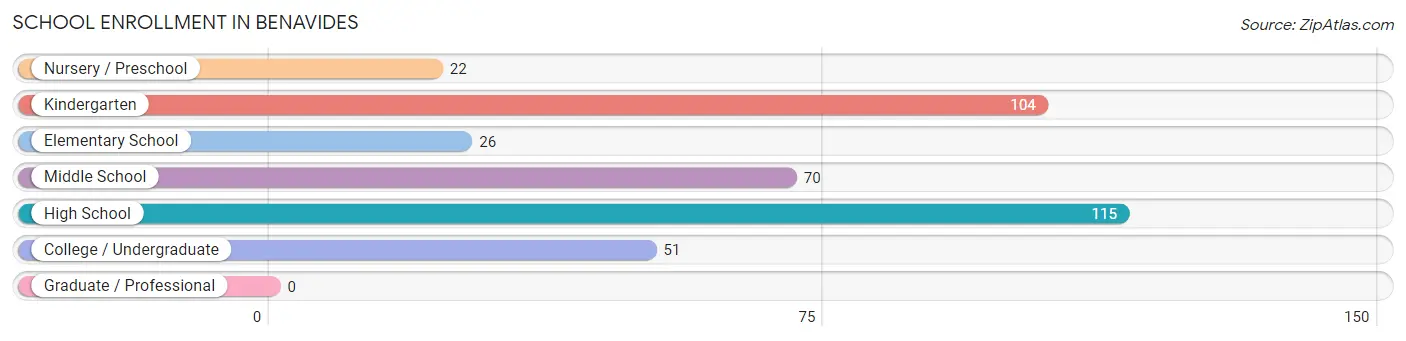
| School Level | # Students | % Students |
| Nursery / Preschool | 22 | 5.7% |
| Kindergarten | 104 | 26.8% |
| Elementary School | 26 | 6.7% |
| Middle School | 70 | 18.0% |
| High School | 115 | 29.6% |
| College / Undergraduate | 51 | 13.1% |
| Graduate / Professional | 0 | 0.0% |
| Total | 388 | 100.0% |
School Enrollment by Age by Funding Source in Benavides
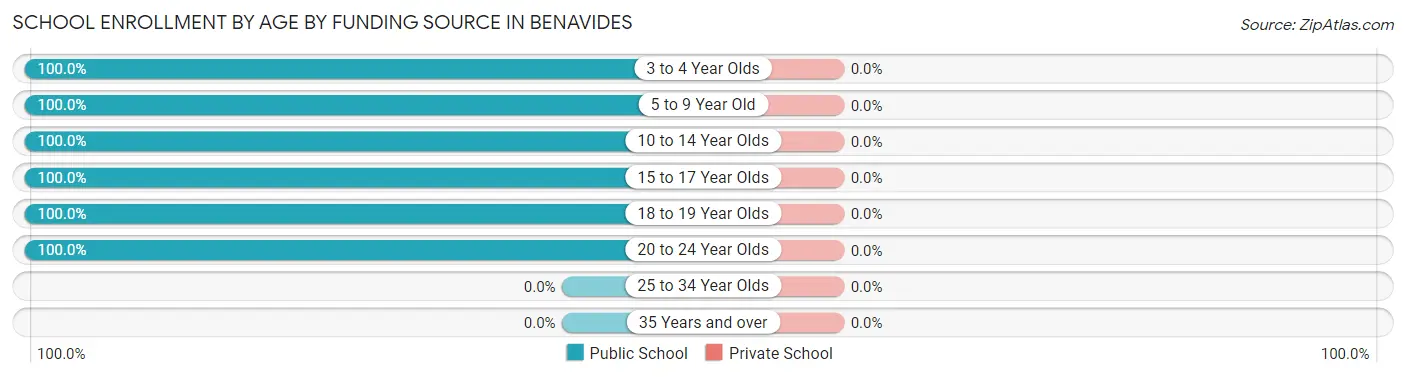
| Age Bracket | Public School | Private School |
| 3 to 4 Year Olds | 22 (100.0%) | 0 (0.0%) |
| 5 to 9 Year Old | 123 (100.0%) | 0 (0.0%) |
| 10 to 14 Year Olds | 89 (100.0%) | 0 (0.0%) |
| 15 to 17 Year Olds | 67 (100.0%) | 0 (0.0%) |
| 18 to 19 Year Olds | 36 (100.0%) | 0 (0.0%) |
| 20 to 24 Year Olds | 51 (100.0%) | 0 (0.0%) |
| 25 to 34 Year Olds | 0 (0.0%) | 0 (0.0%) |
| 35 Years and over | 0 (0.0%) | 0 (0.0%) |
| Total | 388 (100.0%) | 0 (0.0%) |
Educational Attainment by Field of Study in Benavides
Education (26 | 39.4%), arts & humanities (19 | 28.8%), business (10 | 15.1%), physical & health sciences (6 | 9.1%), and bio, nature & agricultural (5 | 7.6%) are the most common fields of study among 66 individuals in Benavides who have obtained a bachelor's degree or higher.
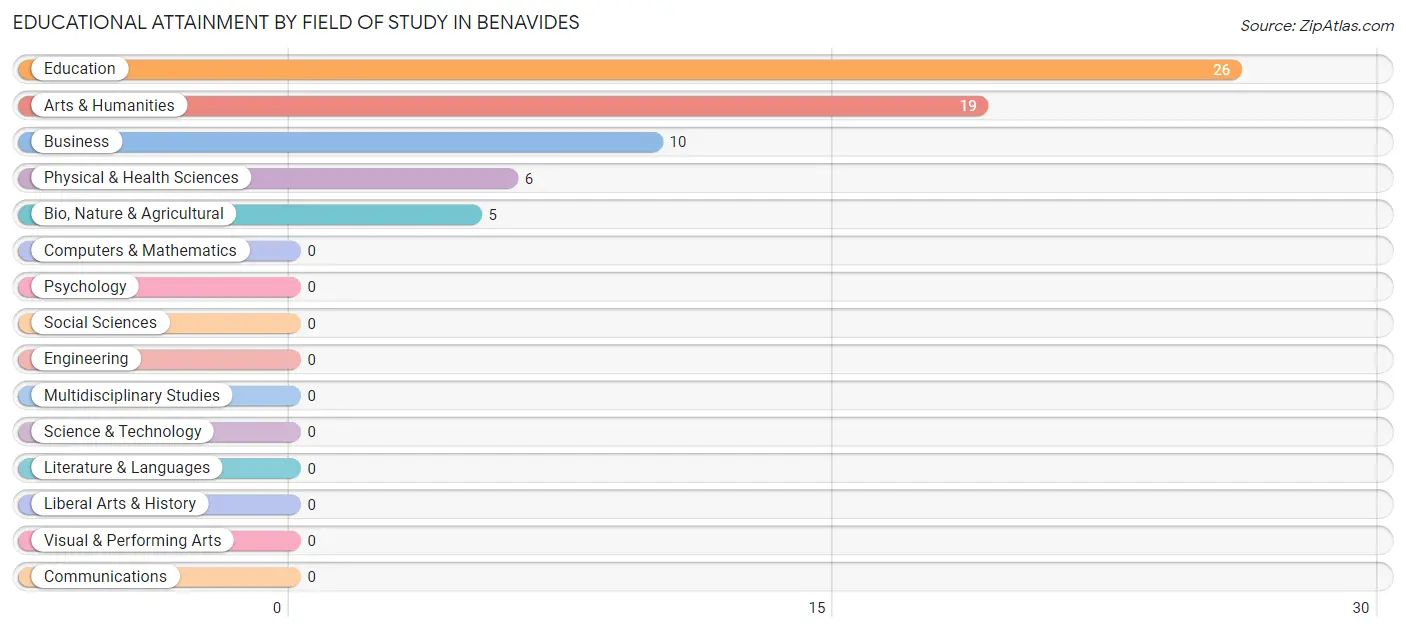
| Field of Study | # Graduates | % Graduates |
| Computers & Mathematics | 0 | 0.0% |
| Bio, Nature & Agricultural | 5 | 7.6% |
| Physical & Health Sciences | 6 | 9.1% |
| Psychology | 0 | 0.0% |
| Social Sciences | 0 | 0.0% |
| Engineering | 0 | 0.0% |
| Multidisciplinary Studies | 0 | 0.0% |
| Science & Technology | 0 | 0.0% |
| Business | 10 | 15.1% |
| Education | 26 | 39.4% |
| Literature & Languages | 0 | 0.0% |
| Liberal Arts & History | 0 | 0.0% |
| Visual & Performing Arts | 0 | 0.0% |
| Communications | 0 | 0.0% |
| Arts & Humanities | 19 | 28.8% |
| Total | 66 | 100.0% |
Transportation & Commute in Benavides
Vehicle Availability by Sex in Benavides
The most prevalent vehicle ownership categories in Benavides are males with 3 vehicles (117, accounting for 43.2%) and females with 3 vehicles (36, making up 63.2%).
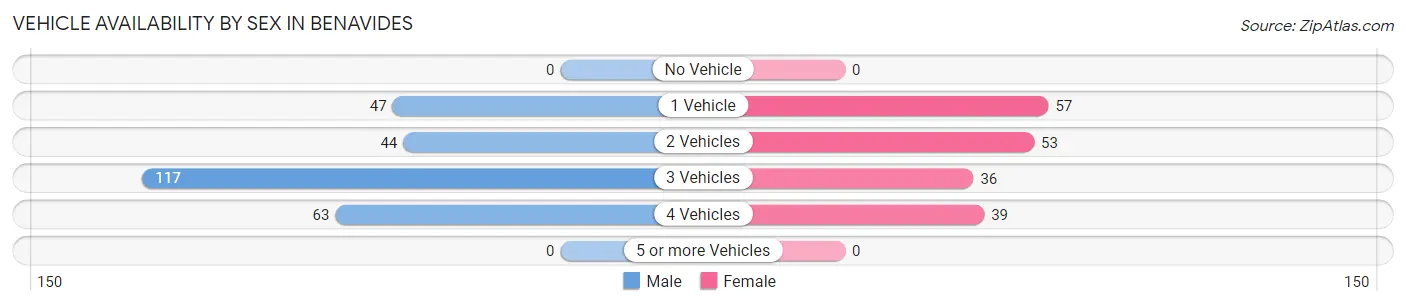
| Vehicles Available | Male | Female |
| No Vehicle | 0 (0.0%) | 0 (0.0%) |
| 1 Vehicle | 47 (17.3%) | 57 (30.8%) |
| 2 Vehicles | 44 (16.2%) | 53 (28.6%) |
| 3 Vehicles | 117 (43.2%) | 36 (19.5%) |
| 4 Vehicles | 63 (23.3%) | 39 (21.1%) |
| 5 or more Vehicles | 0 (0.0%) | 0 (0.0%) |
| Total | 271 (100.0%) | 185 (100.0%) |
Commute Time in Benavides
The most frequently occuring commute durations in Benavides are 5 to 9 minutes (113 commuters, 28.4%), 45 to 59 minutes (96 commuters, 24.1%), and 10 to 14 minutes (65 commuters, 16.3%).
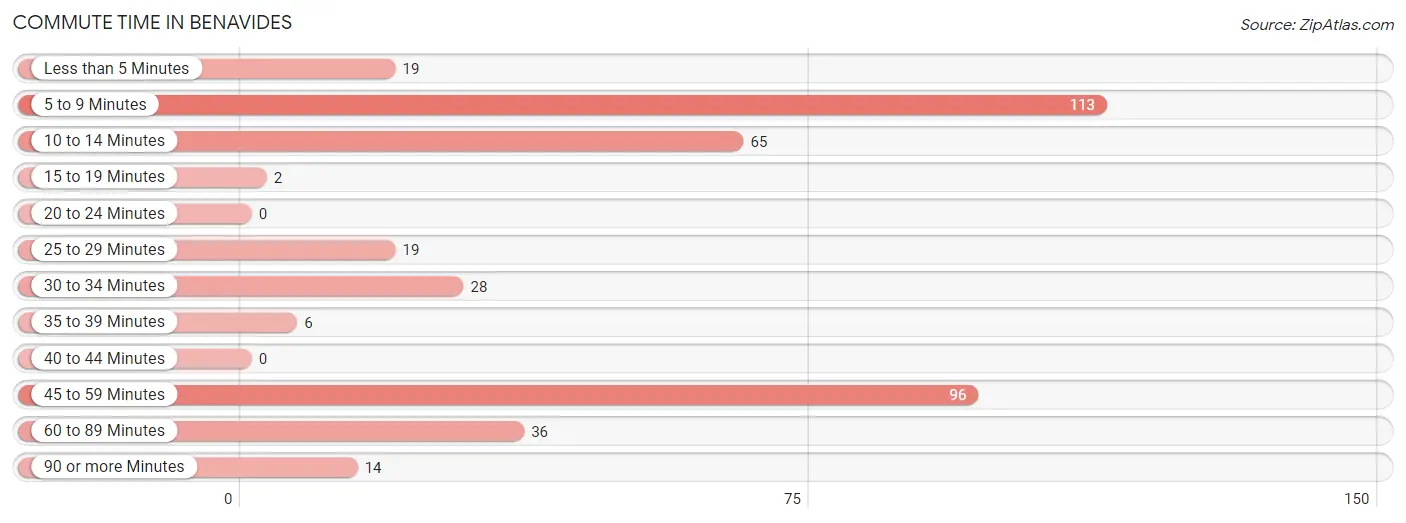
| Commute Time | # Commuters | % Commuters |
| Less than 5 Minutes | 19 | 4.8% |
| 5 to 9 Minutes | 113 | 28.4% |
| 10 to 14 Minutes | 65 | 16.3% |
| 15 to 19 Minutes | 2 | 0.5% |
| 20 to 24 Minutes | 0 | 0.0% |
| 25 to 29 Minutes | 19 | 4.8% |
| 30 to 34 Minutes | 28 | 7.0% |
| 35 to 39 Minutes | 6 | 1.5% |
| 40 to 44 Minutes | 0 | 0.0% |
| 45 to 59 Minutes | 96 | 24.1% |
| 60 to 89 Minutes | 36 | 9.0% |
| 90 or more Minutes | 14 | 3.5% |
Commute Time by Sex in Benavides
The most common commute times in Benavides are 45 to 59 minutes (90 commuters, 38.0%) for males and 5 to 9 minutes (73 commuters, 45.3%) for females.
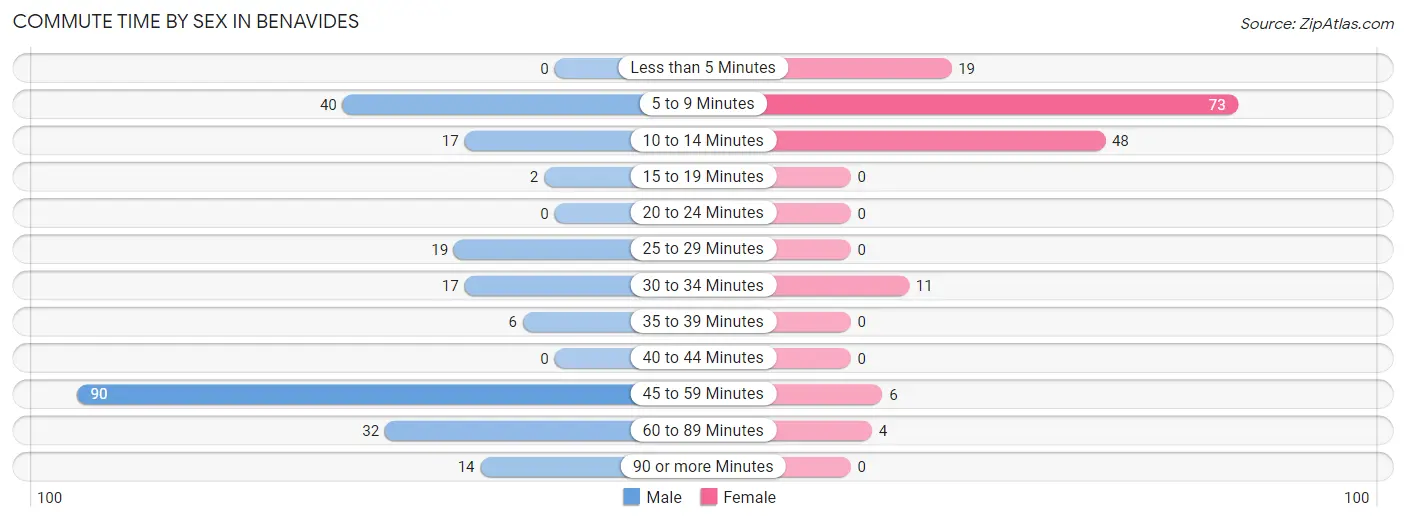
| Commute Time | Male | Female |
| Less than 5 Minutes | 0 (0.0%) | 19 (11.8%) |
| 5 to 9 Minutes | 40 (16.9%) | 73 (45.3%) |
| 10 to 14 Minutes | 17 (7.2%) | 48 (29.8%) |
| 15 to 19 Minutes | 2 (0.8%) | 0 (0.0%) |
| 20 to 24 Minutes | 0 (0.0%) | 0 (0.0%) |
| 25 to 29 Minutes | 19 (8.0%) | 0 (0.0%) |
| 30 to 34 Minutes | 17 (7.2%) | 11 (6.8%) |
| 35 to 39 Minutes | 6 (2.5%) | 0 (0.0%) |
| 40 to 44 Minutes | 0 (0.0%) | 0 (0.0%) |
| 45 to 59 Minutes | 90 (38.0%) | 6 (3.7%) |
| 60 to 89 Minutes | 32 (13.5%) | 4 (2.5%) |
| 90 or more Minutes | 14 (5.9%) | 0 (0.0%) |
Time of Departure to Work by Sex in Benavides
The most frequent times of departure to work in Benavides are 7:00 AM to 7:29 AM (83, 35.0%) for males and 7:30 AM to 7:59 AM (91, 56.5%) for females.
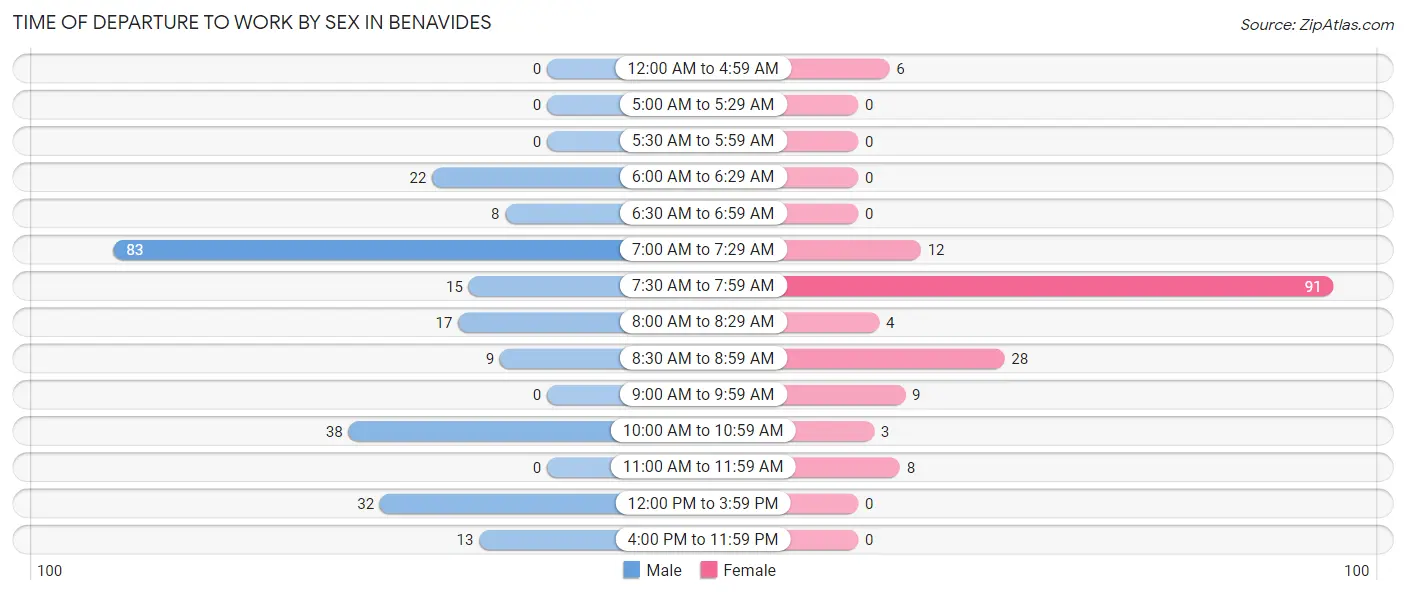
| Time of Departure | Male | Female |
| 12:00 AM to 4:59 AM | 0 (0.0%) | 6 (3.7%) |
| 5:00 AM to 5:29 AM | 0 (0.0%) | 0 (0.0%) |
| 5:30 AM to 5:59 AM | 0 (0.0%) | 0 (0.0%) |
| 6:00 AM to 6:29 AM | 22 (9.3%) | 0 (0.0%) |
| 6:30 AM to 6:59 AM | 8 (3.4%) | 0 (0.0%) |
| 7:00 AM to 7:29 AM | 83 (35.0%) | 12 (7.4%) |
| 7:30 AM to 7:59 AM | 15 (6.3%) | 91 (56.5%) |
| 8:00 AM to 8:29 AM | 17 (7.2%) | 4 (2.5%) |
| 8:30 AM to 8:59 AM | 9 (3.8%) | 28 (17.4%) |
| 9:00 AM to 9:59 AM | 0 (0.0%) | 9 (5.6%) |
| 10:00 AM to 10:59 AM | 38 (16.0%) | 3 (1.9%) |
| 11:00 AM to 11:59 AM | 0 (0.0%) | 8 (5.0%) |
| 12:00 PM to 3:59 PM | 32 (13.5%) | 0 (0.0%) |
| 4:00 PM to 11:59 PM | 13 (5.5%) | 0 (0.0%) |
| Total | 237 (100.0%) | 161 (100.0%) |
Housing Occupancy in Benavides
Occupancy by Ownership in Benavides
Of the total 399 dwellings in Benavides, owner-occupied units account for 236 (59.2%), while renter-occupied units make up 163 (40.8%).
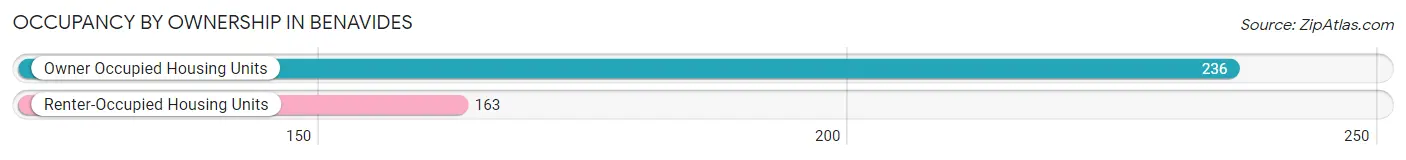
| Occupancy | # Housing Units | % Housing Units |
| Owner Occupied Housing Units | 236 | 59.2% |
| Renter-Occupied Housing Units | 163 | 40.8% |
| Total Occupied Housing Units | 399 | 100.0% |
Occupancy by Household Size in Benavides
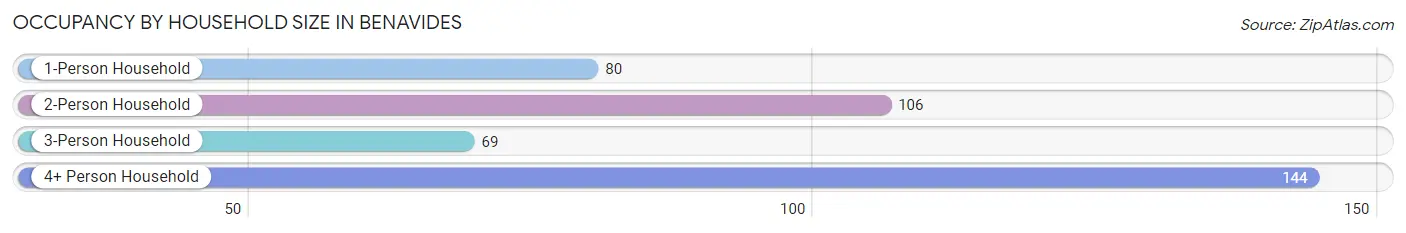
| Household Size | # Housing Units | % Housing Units |
| 1-Person Household | 80 | 20.1% |
| 2-Person Household | 106 | 26.6% |
| 3-Person Household | 69 | 17.3% |
| 4+ Person Household | 144 | 36.1% |
| Total Housing Units | 399 | 100.0% |
Occupancy by Ownership by Household Size in Benavides
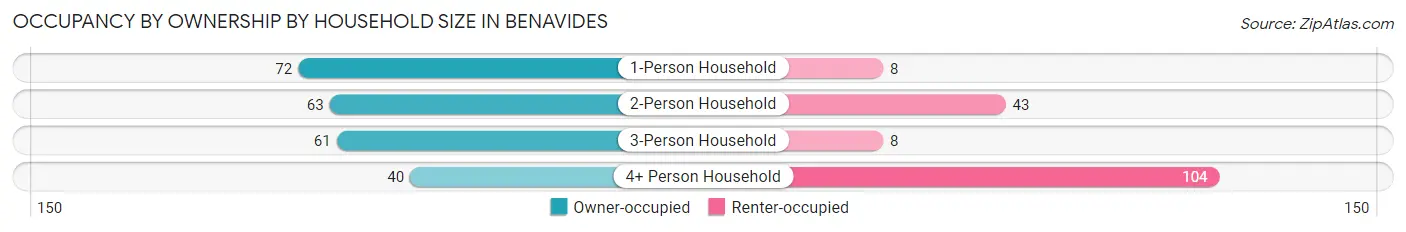
| Household Size | Owner-occupied | Renter-occupied |
| 1-Person Household | 72 (90.0%) | 8 (10.0%) |
| 2-Person Household | 63 (59.4%) | 43 (40.6%) |
| 3-Person Household | 61 (88.4%) | 8 (11.6%) |
| 4+ Person Household | 40 (27.8%) | 104 (72.2%) |
| Total Housing Units | 236 (59.2%) | 163 (40.8%) |
Occupancy by Educational Attainment in Benavides
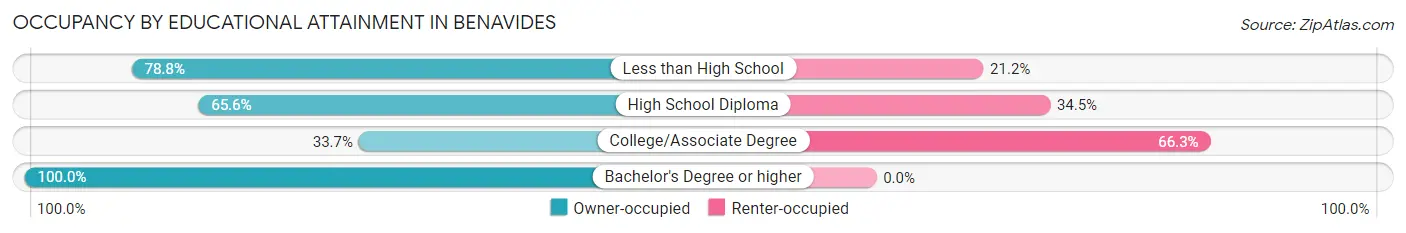
| Household Size | Owner-occupied | Renter-occupied |
| Less than High School | 52 (78.8%) | 14 (21.2%) |
| High School Diploma | 78 (65.5%) | 41 (34.4%) |
| College/Associate Degree | 55 (33.7%) | 108 (66.3%) |
| Bachelor's Degree or higher | 51 (100.0%) | 0 (0.0%) |
Occupancy by Age of Householder in Benavides
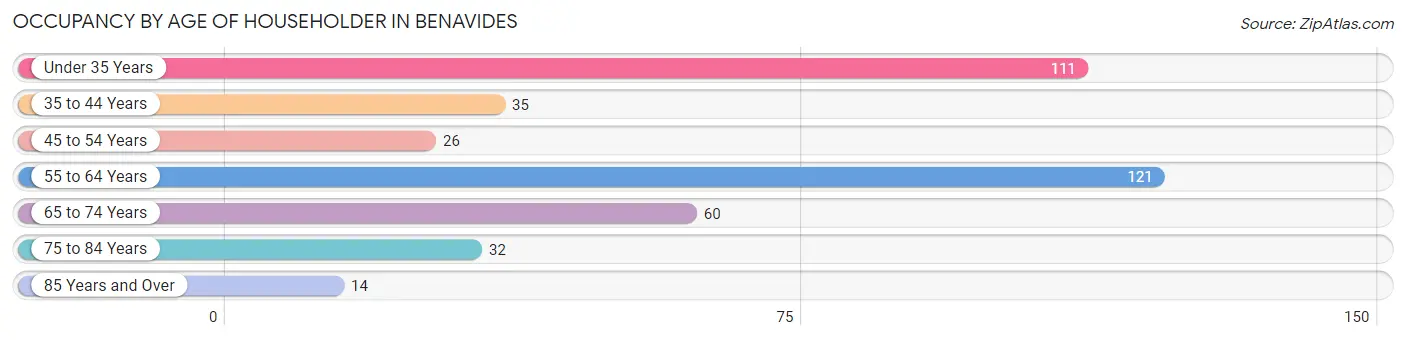
| Age Bracket | # Households | % Households |
| Under 35 Years | 111 | 27.8% |
| 35 to 44 Years | 35 | 8.8% |
| 45 to 54 Years | 26 | 6.5% |
| 55 to 64 Years | 121 | 30.3% |
| 65 to 74 Years | 60 | 15.0% |
| 75 to 84 Years | 32 | 8.0% |
| 85 Years and Over | 14 | 3.5% |
| Total | 399 | 100.0% |
Housing Finances in Benavides
Median Income by Occupancy in Benavides
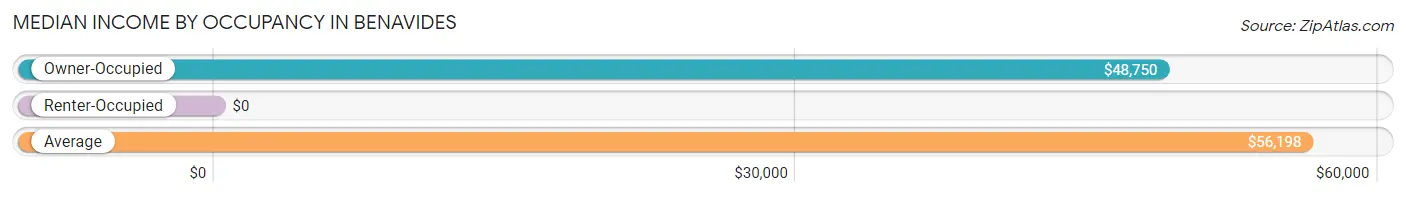
| Occupancy Type | # Households | Median Income |
| Owner-Occupied | 236 (59.2%) | $48,750 |
| Renter-Occupied | 163 (40.8%) | $0 |
| Average | 399 (100.0%) | $56,198 |
Occupancy by Householder Income Bracket in Benavides
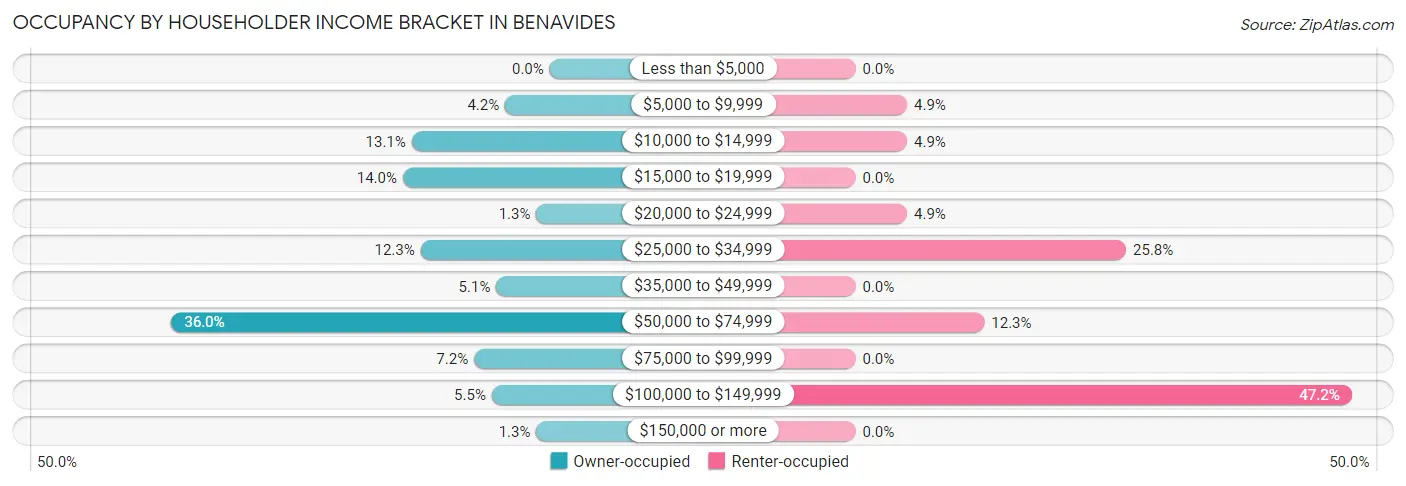
| Income Bracket | Owner-occupied | Renter-occupied |
| Less than $5,000 | 0 (0.0%) | 0 (0.0%) |
| $5,000 to $9,999 | 10 (4.2%) | 8 (4.9%) |
| $10,000 to $14,999 | 31 (13.1%) | 8 (4.9%) |
| $15,000 to $19,999 | 33 (14.0%) | 0 (0.0%) |
| $20,000 to $24,999 | 3 (1.3%) | 8 (4.9%) |
| $25,000 to $34,999 | 29 (12.3%) | 42 (25.8%) |
| $35,000 to $49,999 | 12 (5.1%) | 0 (0.0%) |
| $50,000 to $74,999 | 85 (36.0%) | 20 (12.3%) |
| $75,000 to $99,999 | 17 (7.2%) | 0 (0.0%) |
| $100,000 to $149,999 | 13 (5.5%) | 77 (47.2%) |
| $150,000 or more | 3 (1.3%) | 0 (0.0%) |
| Total | 236 (100.0%) | 163 (100.0%) |
Monthly Housing Cost Tiers in Benavides
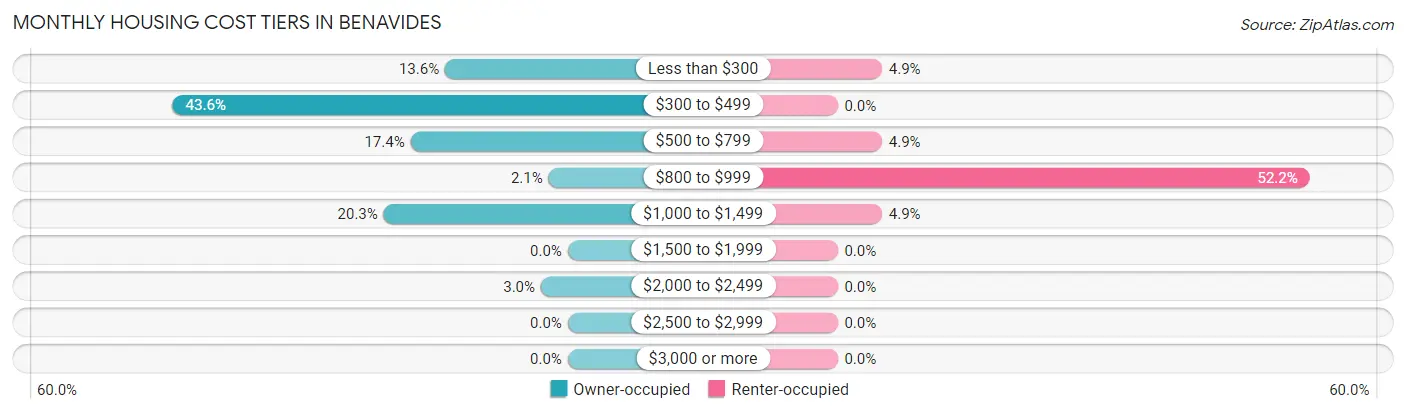
| Monthly Cost | Owner-occupied | Renter-occupied |
| Less than $300 | 32 (13.6%) | 8 (4.9%) |
| $300 to $499 | 103 (43.6%) | 0 (0.0%) |
| $500 to $799 | 41 (17.4%) | 8 (4.9%) |
| $800 to $999 | 5 (2.1%) | 85 (52.1%) |
| $1,000 to $1,499 | 48 (20.3%) | 8 (4.9%) |
| $1,500 to $1,999 | 0 (0.0%) | 0 (0.0%) |
| $2,000 to $2,499 | 7 (3.0%) | 0 (0.0%) |
| $2,500 to $2,999 | 0 (0.0%) | 0 (0.0%) |
| $3,000 or more | 0 (0.0%) | 0 (0.0%) |
| Total | 236 (100.0%) | 163 (100.0%) |
Physical Housing Characteristics in Benavides
Housing Structures in Benavides
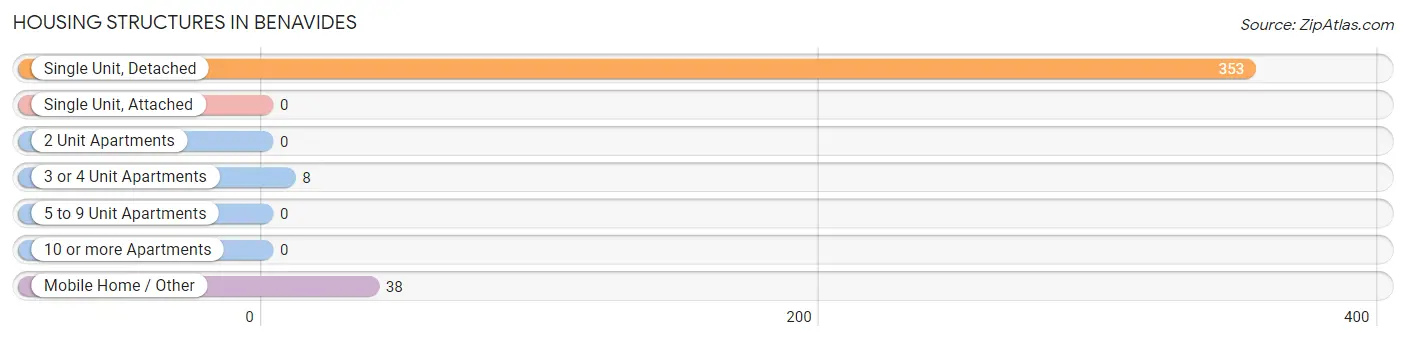
| Structure Type | # Housing Units | % Housing Units |
| Single Unit, Detached | 353 | 88.5% |
| Single Unit, Attached | 0 | 0.0% |
| 2 Unit Apartments | 0 | 0.0% |
| 3 or 4 Unit Apartments | 8 | 2.0% |
| 5 to 9 Unit Apartments | 0 | 0.0% |
| 10 or more Apartments | 0 | 0.0% |
| Mobile Home / Other | 38 | 9.5% |
| Total | 399 | 100.0% |
Housing Structures by Occupancy in Benavides
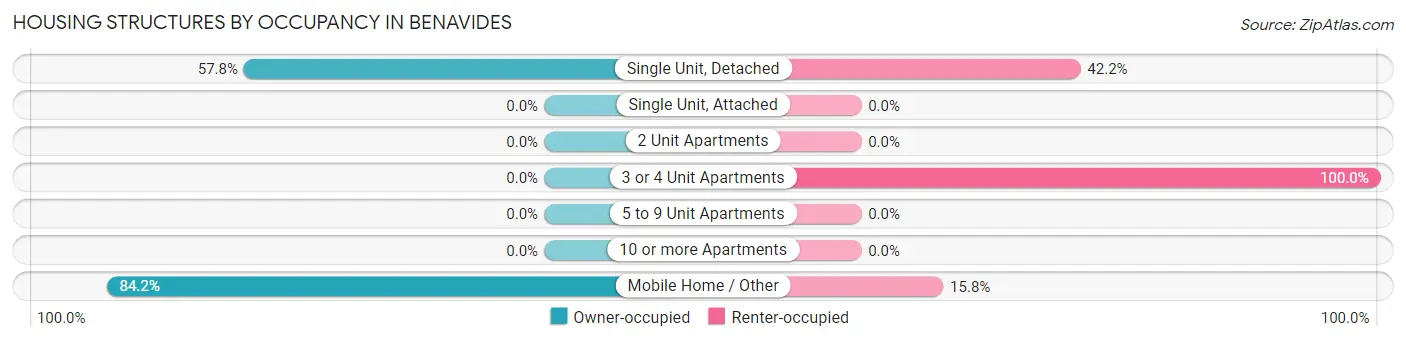
| Structure Type | Owner-occupied | Renter-occupied |
| Single Unit, Detached | 204 (57.8%) | 149 (42.2%) |
| Single Unit, Attached | 0 (0.0%) | 0 (0.0%) |
| 2 Unit Apartments | 0 (0.0%) | 0 (0.0%) |
| 3 or 4 Unit Apartments | 0 (0.0%) | 8 (100.0%) |
| 5 to 9 Unit Apartments | 0 (0.0%) | 0 (0.0%) |
| 10 or more Apartments | 0 (0.0%) | 0 (0.0%) |
| Mobile Home / Other | 32 (84.2%) | 6 (15.8%) |
| Total | 236 (59.2%) | 163 (40.8%) |
Housing Structures by Number of Rooms in Benavides
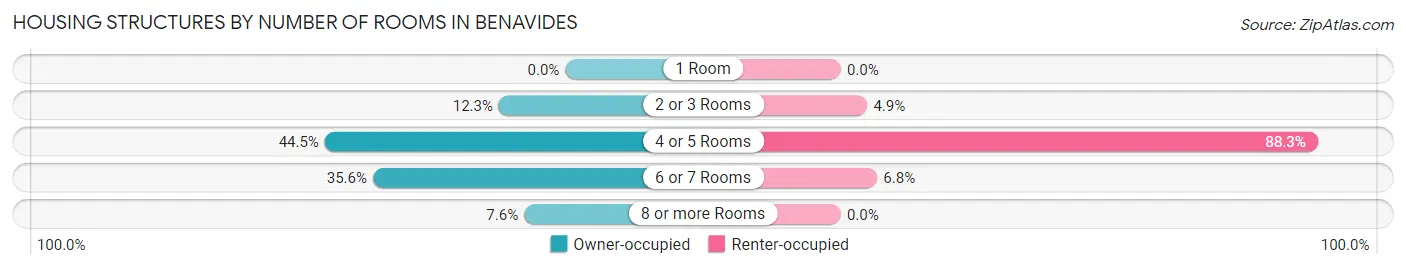
| Number of Rooms | Owner-occupied | Renter-occupied |
| 1 Room | 0 (0.0%) | 0 (0.0%) |
| 2 or 3 Rooms | 29 (12.3%) | 8 (4.9%) |
| 4 or 5 Rooms | 105 (44.5%) | 144 (88.3%) |
| 6 or 7 Rooms | 84 (35.6%) | 11 (6.8%) |
| 8 or more Rooms | 18 (7.6%) | 0 (0.0%) |
| Total | 236 (100.0%) | 163 (100.0%) |
Housing Structure by Heating Type in Benavides
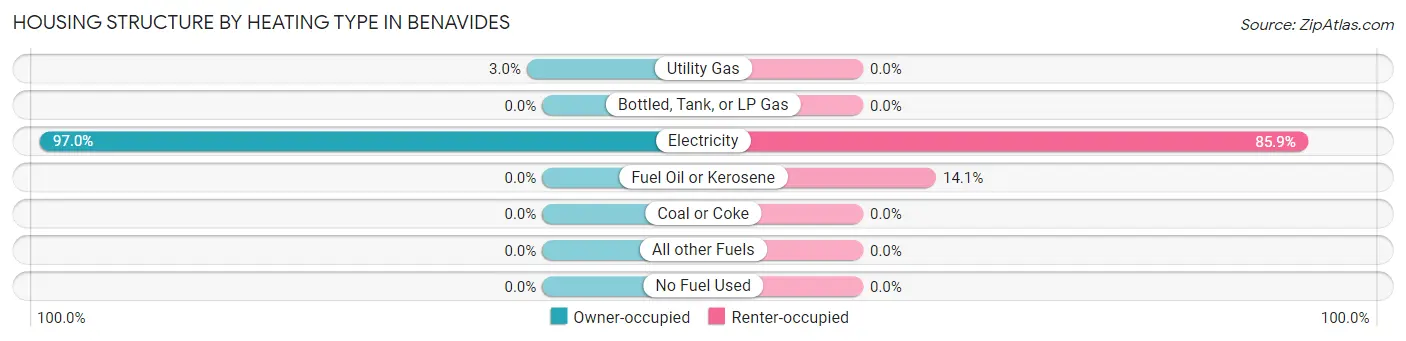
| Heating Type | Owner-occupied | Renter-occupied |
| Utility Gas | 7 (3.0%) | 0 (0.0%) |
| Bottled, Tank, or LP Gas | 0 (0.0%) | 0 (0.0%) |
| Electricity | 229 (97.0%) | 140 (85.9%) |
| Fuel Oil or Kerosene | 0 (0.0%) | 23 (14.1%) |
| Coal or Coke | 0 (0.0%) | 0 (0.0%) |
| All other Fuels | 0 (0.0%) | 0 (0.0%) |
| No Fuel Used | 0 (0.0%) | 0 (0.0%) |
| Total | 236 (100.0%) | 163 (100.0%) |
Household Vehicle Usage in Benavides
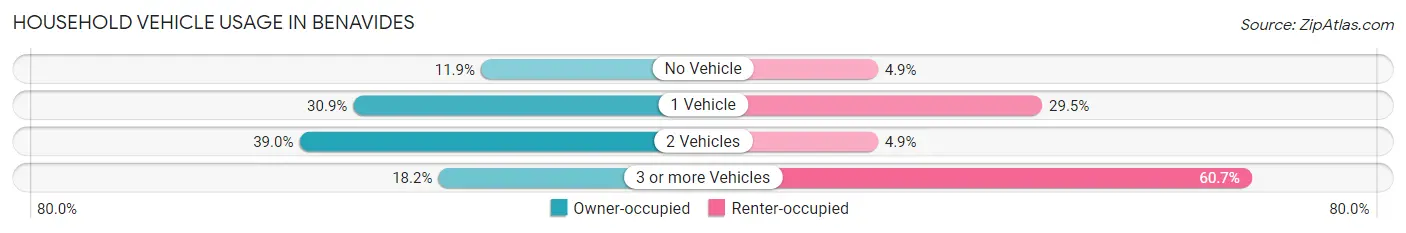
| Vehicles per Household | Owner-occupied | Renter-occupied |
| No Vehicle | 28 (11.9%) | 8 (4.9%) |
| 1 Vehicle | 73 (30.9%) | 48 (29.4%) |
| 2 Vehicles | 92 (39.0%) | 8 (4.9%) |
| 3 or more Vehicles | 43 (18.2%) | 99 (60.7%) |
| Total | 236 (100.0%) | 163 (100.0%) |
Real Estate & Mortgages in Benavides
Real Estate and Mortgage Overview in Benavides
| Characteristic | Without Mortgage | With Mortgage |
| Housing Units | 168 | 68 |
| Median Property Value | - | - |
| Median Household Income | $57,000 | $0 |
| Monthly Housing Costs | $414 | $0 |
| Real Estate Taxes | - | - |
Property Value by Mortgage Status in Benavides
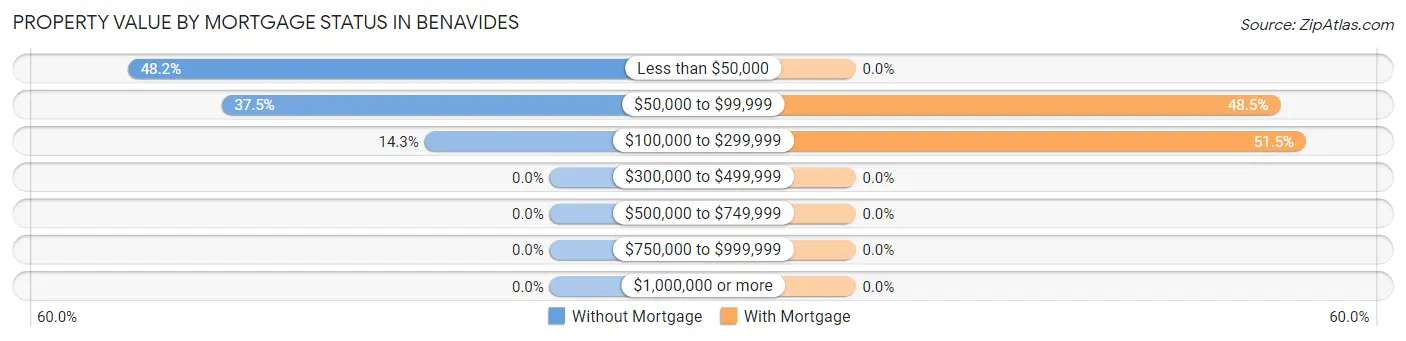
| Property Value | Without Mortgage | With Mortgage |
| Less than $50,000 | 81 (48.2%) | 0 (0.0%) |
| $50,000 to $99,999 | 63 (37.5%) | 33 (48.5%) |
| $100,000 to $299,999 | 24 (14.3%) | 35 (51.5%) |
| $300,000 to $499,999 | 0 (0.0%) | 0 (0.0%) |
| $500,000 to $749,999 | 0 (0.0%) | 0 (0.0%) |
| $750,000 to $999,999 | 0 (0.0%) | 0 (0.0%) |
| $1,000,000 or more | 0 (0.0%) | 0 (0.0%) |
| Total | 168 (100.0%) | 68 (100.0%) |
Household Income by Mortgage Status in Benavides
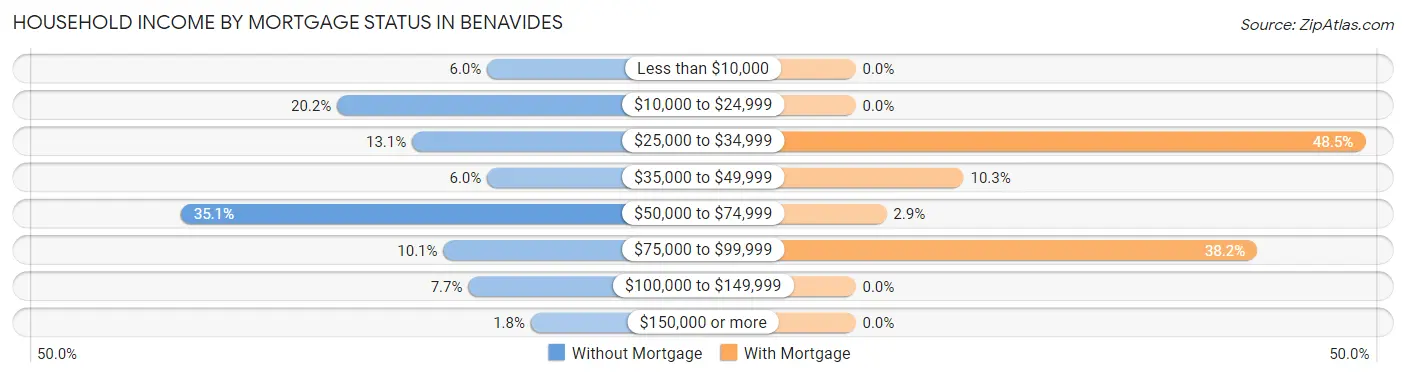
| Household Income | Without Mortgage | With Mortgage |
| Less than $10,000 | 10 (5.9%) | 0 (0.0%) |
| $10,000 to $24,999 | 34 (20.2%) | 0 (0.0%) |
| $25,000 to $34,999 | 22 (13.1%) | 33 (48.5%) |
| $35,000 to $49,999 | 10 (5.9%) | 7 (10.3%) |
| $50,000 to $74,999 | 59 (35.1%) | 2 (2.9%) |
| $75,000 to $99,999 | 17 (10.1%) | 26 (38.2%) |
| $100,000 to $149,999 | 13 (7.7%) | 0 (0.0%) |
| $150,000 or more | 3 (1.8%) | 0 (0.0%) |
| Total | 168 (100.0%) | 68 (100.0%) |
Property Value to Household Income Ratio in Benavides
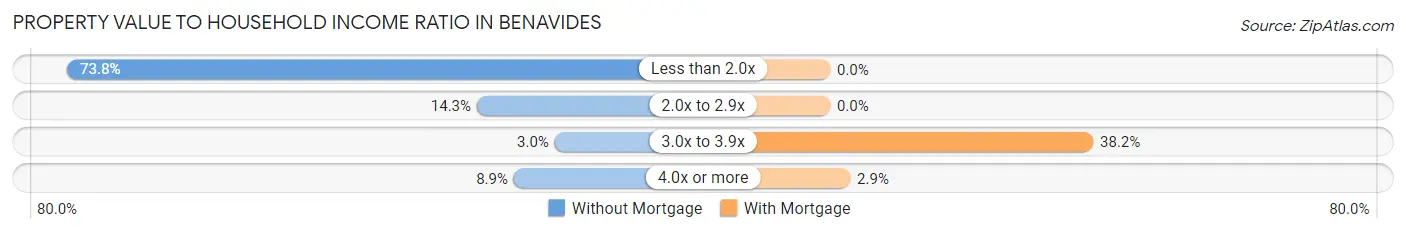
| Value-to-Income Ratio | Without Mortgage | With Mortgage |
| Less than 2.0x | 124 (73.8%) | 0 (0.0%) |
| 2.0x to 2.9x | 24 (14.3%) | 0 (0.0%) |
| 3.0x to 3.9x | 5 (3.0%) | 26 (38.2%) |
| 4.0x or more | 15 (8.9%) | 2 (2.9%) |
| Total | 168 (100.0%) | 68 (100.0%) |
Real Estate Taxes by Mortgage Status in Benavides
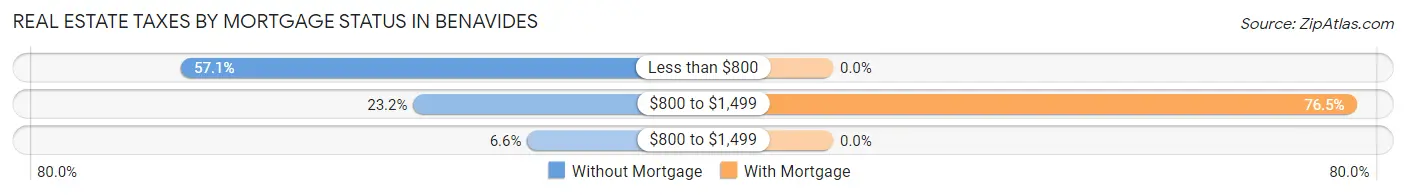
| Property Taxes | Without Mortgage | With Mortgage |
| Less than $800 | 96 (57.1%) | 0 (0.0%) |
| $800 to $1,499 | 39 (23.2%) | 52 (76.5%) |
| $800 to $1,499 | 11 (6.6%) | 0 (0.0%) |
| Total | 168 (100.0%) | 68 (100.0%) |
Health & Disability in Benavides
Health Insurance Coverage by Age in Benavides
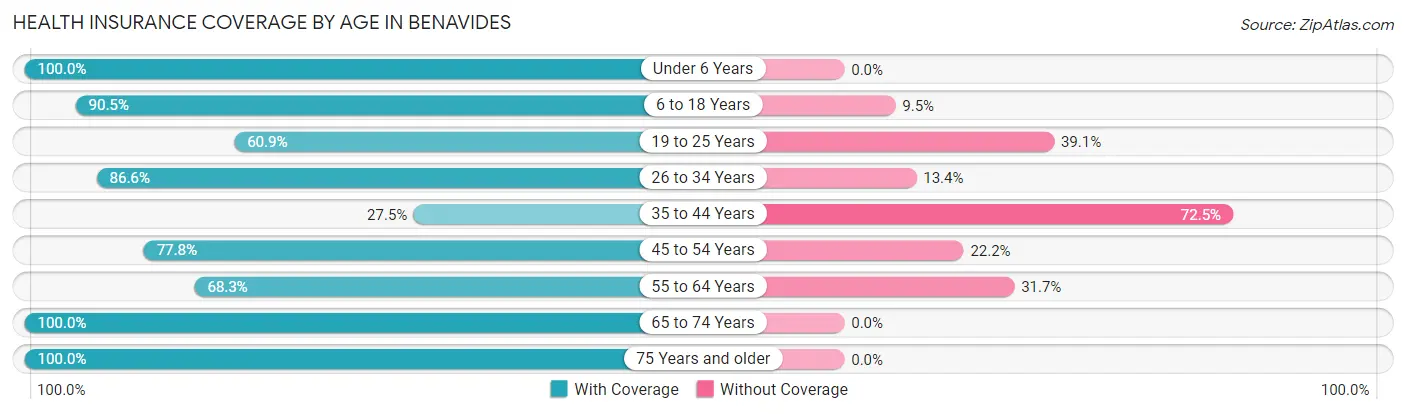
| Age Bracket | With Coverage | Without Coverage |
| Under 6 Years | 178 (100.0%) | 0 (0.0%) |
| 6 to 18 Years | 285 (90.5%) | 30 (9.5%) |
| 19 to 25 Years | 95 (60.9%) | 61 (39.1%) |
| 26 to 34 Years | 187 (86.6%) | 29 (13.4%) |
| 35 to 44 Years | 19 (27.5%) | 50 (72.5%) |
| 45 to 54 Years | 63 (77.8%) | 18 (22.2%) |
| 55 to 64 Years | 138 (68.3%) | 64 (31.7%) |
| 65 to 74 Years | 96 (100.0%) | 0 (0.0%) |
| 75 Years and older | 96 (100.0%) | 0 (0.0%) |
| Total | 1,157 (82.1%) | 252 (17.9%) |
Health Insurance Coverage by Citizenship Status in Benavides
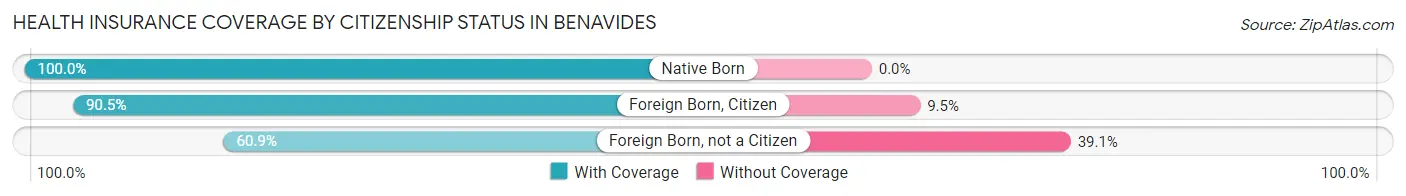
| Citizenship Status | With Coverage | Without Coverage |
| Native Born | 178 (100.0%) | 0 (0.0%) |
| Foreign Born, Citizen | 285 (90.5%) | 30 (9.5%) |
| Foreign Born, not a Citizen | 95 (60.9%) | 61 (39.1%) |
Health Insurance Coverage by Household Income in Benavides
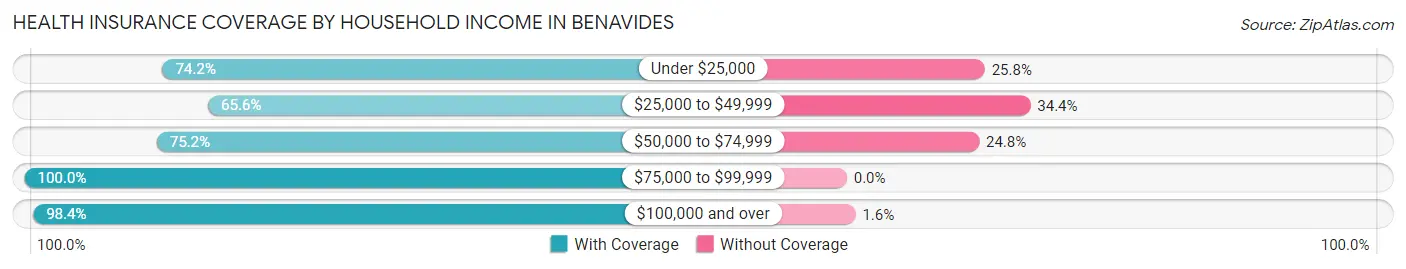
| Household Income | With Coverage | Without Coverage |
| Under $25,000 | 155 (74.2%) | 54 (25.8%) |
| $25,000 to $49,999 | 206 (65.6%) | 108 (34.4%) |
| $50,000 to $74,999 | 252 (75.2%) | 83 (24.8%) |
| $75,000 to $99,999 | 119 (100.0%) | 0 (0.0%) |
| $100,000 and over | 425 (98.4%) | 7 (1.6%) |
Public vs Private Health Insurance Coverage by Age in Benavides
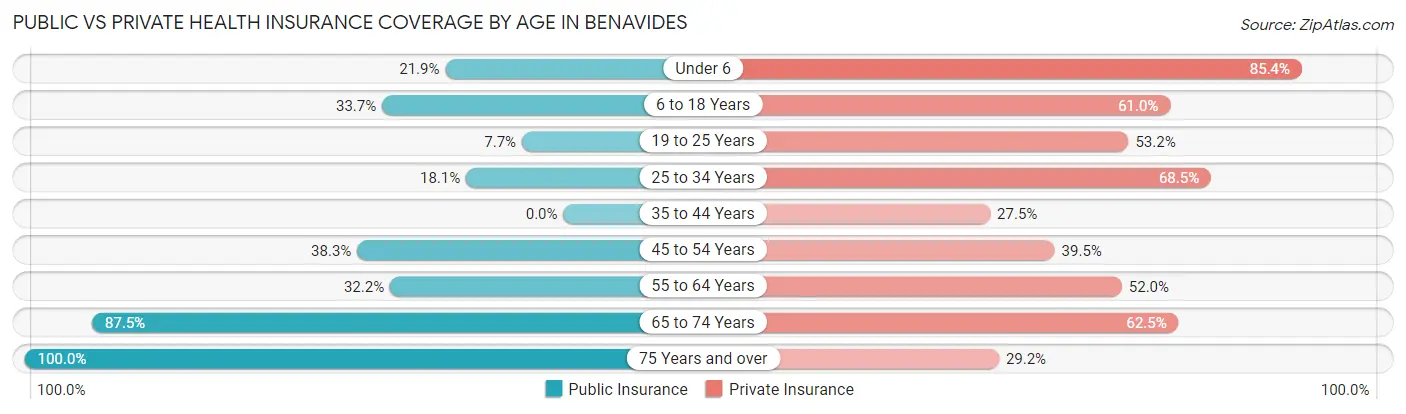
| Age Bracket | Public Insurance | Private Insurance |
| Under 6 | 39 (21.9%) | 152 (85.4%) |
| 6 to 18 Years | 106 (33.7%) | 192 (61.0%) |
| 19 to 25 Years | 12 (7.7%) | 83 (53.2%) |
| 25 to 34 Years | 39 (18.1%) | 148 (68.5%) |
| 35 to 44 Years | 0 (0.0%) | 19 (27.5%) |
| 45 to 54 Years | 31 (38.3%) | 32 (39.5%) |
| 55 to 64 Years | 65 (32.2%) | 105 (52.0%) |
| 65 to 74 Years | 84 (87.5%) | 60 (62.5%) |
| 75 Years and over | 96 (100.0%) | 28 (29.2%) |
| Total | 472 (33.5%) | 819 (58.1%) |
Disability Status by Sex by Age in Benavides
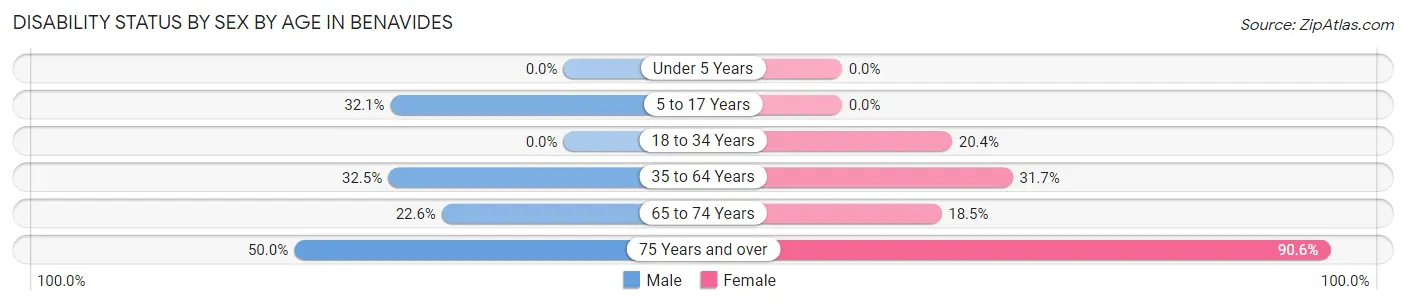
| Age Bracket | Male | Female |
| Under 5 Years | 0 (0.0%) | 0 (0.0%) |
| 5 to 17 Years | 35 (32.1%) | 0 (0.0%) |
| 18 to 34 Years | 0 (0.0%) | 39 (20.4%) |
| 35 to 64 Years | 55 (32.5%) | 58 (31.7%) |
| 65 to 74 Years | 7 (22.6%) | 12 (18.5%) |
| 75 Years and over | 16 (50.0%) | 58 (90.6%) |
Disability Class by Sex by Age in Benavides
Disability Class: Hearing Difficulty
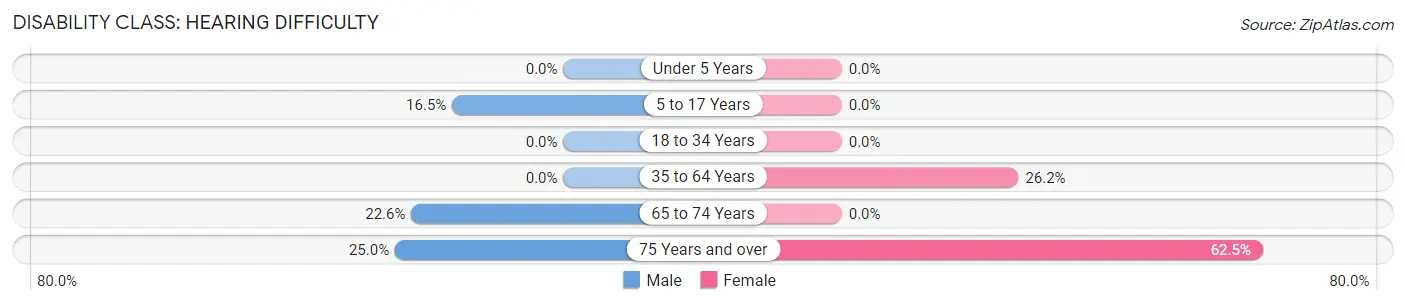
| Age Bracket | Male | Female |
| Under 5 Years | 0 (0.0%) | 0 (0.0%) |
| 5 to 17 Years | 18 (16.5%) | 0 (0.0%) |
| 18 to 34 Years | 0 (0.0%) | 0 (0.0%) |
| 35 to 64 Years | 0 (0.0%) | 48 (26.2%) |
| 65 to 74 Years | 7 (22.6%) | 0 (0.0%) |
| 75 Years and over | 8 (25.0%) | 40 (62.5%) |
Disability Class: Vision Difficulty
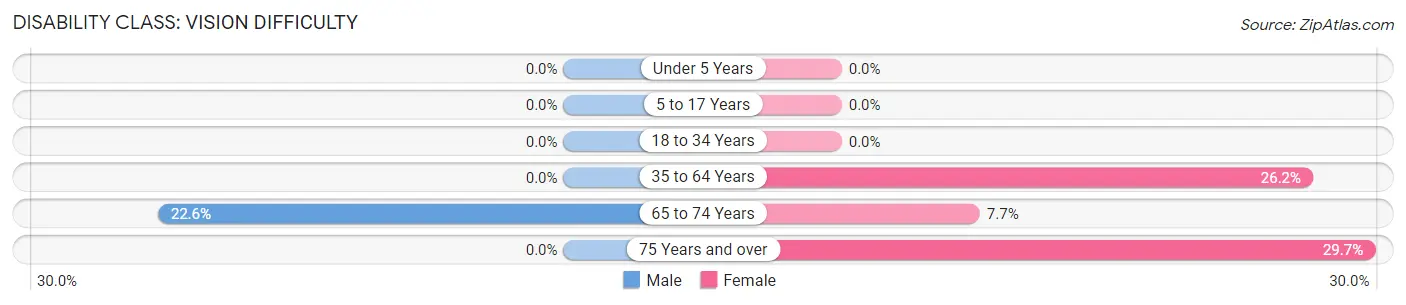
| Age Bracket | Male | Female |
| Under 5 Years | 0 (0.0%) | 0 (0.0%) |
| 5 to 17 Years | 0 (0.0%) | 0 (0.0%) |
| 18 to 34 Years | 0 (0.0%) | 0 (0.0%) |
| 35 to 64 Years | 0 (0.0%) | 48 (26.2%) |
| 65 to 74 Years | 7 (22.6%) | 5 (7.7%) |
| 75 Years and over | 0 (0.0%) | 19 (29.7%) |
Disability Class: Cognitive Difficulty
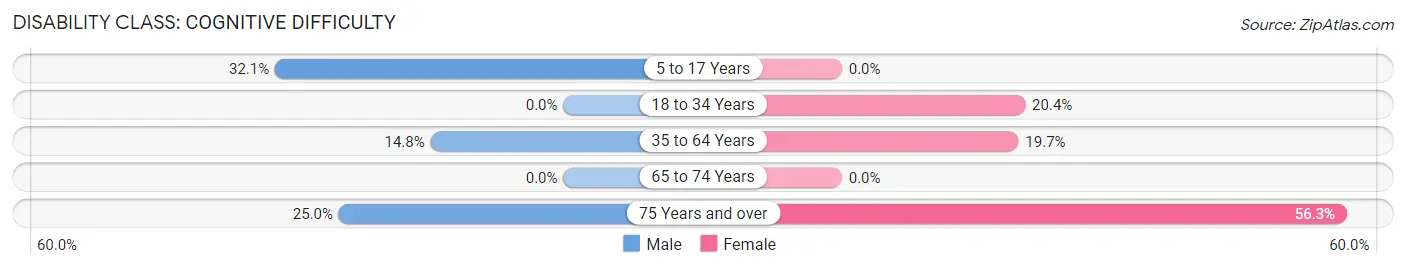
| Age Bracket | Male | Female |
| 5 to 17 Years | 35 (32.1%) | 0 (0.0%) |
| 18 to 34 Years | 0 (0.0%) | 39 (20.4%) |
| 35 to 64 Years | 25 (14.8%) | 36 (19.7%) |
| 65 to 74 Years | 0 (0.0%) | 0 (0.0%) |
| 75 Years and over | 8 (25.0%) | 36 (56.2%) |
Disability Class: Ambulatory Difficulty
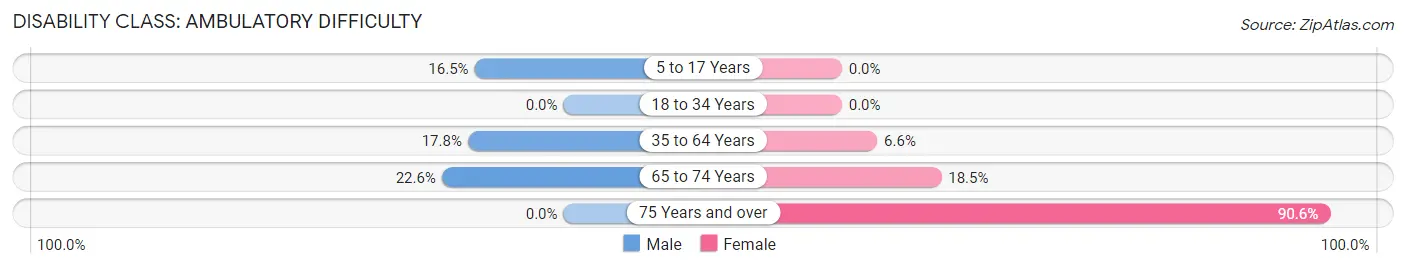
| Age Bracket | Male | Female |
| 5 to 17 Years | 18 (16.5%) | 0 (0.0%) |
| 18 to 34 Years | 0 (0.0%) | 0 (0.0%) |
| 35 to 64 Years | 30 (17.7%) | 12 (6.6%) |
| 65 to 74 Years | 7 (22.6%) | 12 (18.5%) |
| 75 Years and over | 0 (0.0%) | 58 (90.6%) |
Disability Class: Self-Care Difficulty
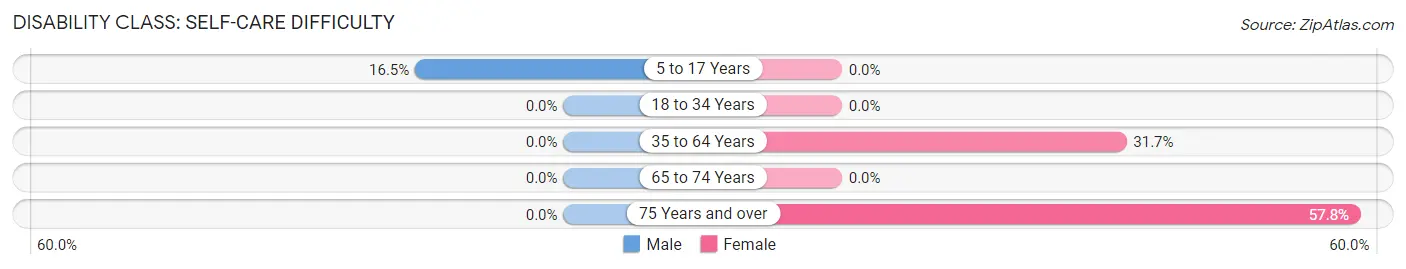
| Age Bracket | Male | Female |
| 5 to 17 Years | 18 (16.5%) | 0 (0.0%) |
| 18 to 34 Years | 0 (0.0%) | 0 (0.0%) |
| 35 to 64 Years | 0 (0.0%) | 58 (31.7%) |
| 65 to 74 Years | 0 (0.0%) | 0 (0.0%) |
| 75 Years and over | 0 (0.0%) | 37 (57.8%) |
Technology Access in Benavides
Computing Device Access in Benavides
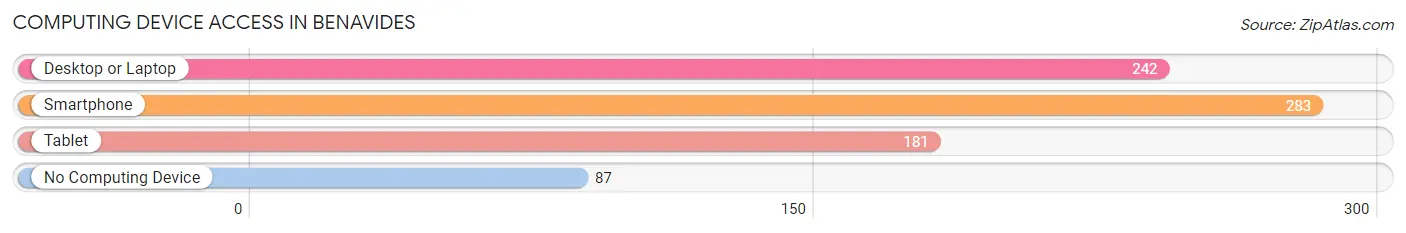
| Device Type | # Households | % Households |
| Desktop or Laptop | 242 | 60.7% |
| Smartphone | 283 | 70.9% |
| Tablet | 181 | 45.4% |
| No Computing Device | 87 | 21.8% |
| Total | 399 | 100.0% |
Internet Access in Benavides
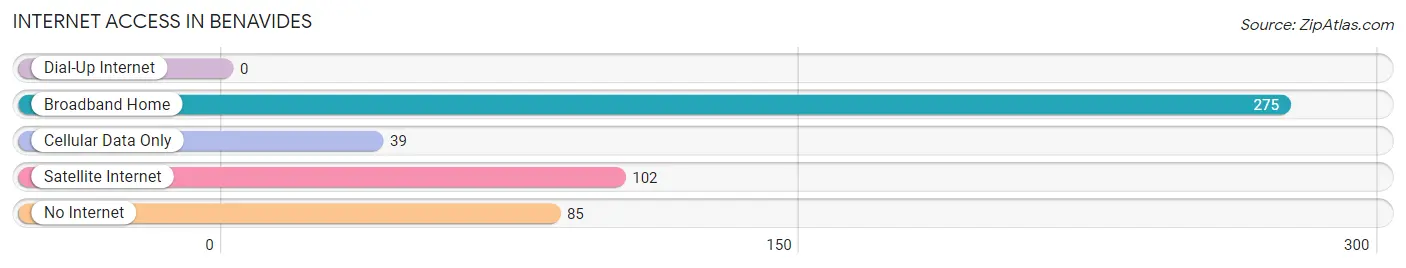
| Internet Type | # Households | % Households |
| Dial-Up Internet | 0 | 0.0% |
| Broadband Home | 275 | 68.9% |
| Cellular Data Only | 39 | 9.8% |
| Satellite Internet | 102 | 25.6% |
| No Internet | 85 | 21.3% |
| Total | 399 | 100.0% |
Benavides Summary
Benavides, Texas is a small town located in Duval County, Texas. It is situated about 30 miles south of Alice, Texas and about 40 miles west of Corpus Christi. The population of Benavides was 1,093 as of the 2010 census.
History
Benavides was founded in 1894 by a group of Mexican settlers who were looking for a place to settle and start a new life. The town was named after a prominent Mexican rancher, Don Benavides. The town was originally a small farming community, but it soon grew to become a major center for ranching and cattle production.
In the early 1900s, Benavides was a thriving community with a population of over 1,000 people. The town had a post office, a bank, a hotel, a school, and several stores. The town was also home to a number of churches, including the First Baptist Church, which was established in 1906.
In the 1920s, Benavides experienced a period of growth and prosperity. The town was home to several businesses, including a cotton gin, a lumber yard, and a movie theater. The town also had a number of churches, including the First Baptist Church, which was established in 1906.
In the 1930s, the Great Depression hit Benavides hard. Many of the businesses in town closed, and the population began to decline. The town was able to survive, however, and by the 1940s, the population had begun to increase again.
Geography
Benavides is located in Duval County, Texas. It is situated about 30 miles south of Alice, Texas and about 40 miles west of Corpus Christi. The town is located in the South Texas Plains region of the state, and it is surrounded by rolling hills and grasslands. The climate in Benavides is hot and humid in the summer and mild in the winter.
Economy
The economy of Benavides is largely based on agriculture and ranching. The town is home to several large ranches, and it is a major center for cattle production. The town also has a number of businesses, including a cotton gin, a lumber yard, and a movie theater.
Demographics
As of the 2010 census, the population of Benavides was 1,093. The racial makeup of the town was 94.3% White, 0.7% African American, 0.2% Native American, 0.2% Asian, 0.1% Pacific Islander, 3.3% from other races, and 1.3% from two or more races. Hispanic or Latino of any race were 94.3% of the population.
The median income for a household in Benavides was $25,625, and the median income for a family was $30,000. The per capita income for the town was $13,845. About 24.3% of the population was below the poverty line.
Conclusion
Benavides, Texas is a small town located in Duval County, Texas. It is situated about 30 miles south of Alice, Texas and about 40 miles west of Corpus Christi. The population of Benavides was 1,093 as of the 2010 census. The town is largely based on agriculture and ranching, and it is a major center for cattle production. The median income for a household in Benavides was $25,625, and the median income for a family was $30,000. About 24.3% of the population was below the poverty line.
Common Questions
What is Per Capita Income in Benavides?
Per Capita income in Benavides is $18,806.
What is the Median Family Income in Benavides?
Median Family Income in Benavides is $66,318.
What is the Median Household income in Benavides?
Median Household Income in Benavides is $56,198.
What is Family Income Deficit in Benavides?
Family Income Deficit in Benavides is $8,809.
Families that are below poverty line in Benavides earn $8,809 less on average than the poverty threshold level.
What is Inequality or Gini Index in Benavides?
Inequality or Gini Index in Benavides is 0.41.
What is the Total Population of Benavides?
Total Population of Benavides is 1,409.
What is the Total Male Population of Benavides?
Total Male Population of Benavides is 615.
What is the Total Female Population of Benavides?
Total Female Population of Benavides is 794.
What is the Ratio of Males per 100 Females in Benavides?
There are 77.46 Males per 100 Females in Benavides.
What is the Ratio of Females per 100 Males in Benavides?
There are 129.11 Females per 100 Males in Benavides.
What is the Median Population Age in Benavides?
Median Population Age in Benavides is 27.2 Years.
What is the Average Family Size in Benavides
Average Family Size in Benavides is 4.1 People.
What is the Average Household Size in Benavides
Average Household Size in Benavides is 3.5 People.
How Large is the Labor Force in Benavides?
There are 456 People in the Labor Forcein in Benavides.
What is the Percentage of People in the Labor Force in Benavides?
45.5% of People are in the Labor Force in Benavides.