Zip Codes with the Highest Percentage of Population Employed in Community & Social Service in El Paso, TX
RELATED REPORTS & OPTIONS
Community & Social Service
El Paso
Compare Zip Codes
Map of Zip Codes with the Highest Percentage of Population Employed in Community & Social Service in El Paso
5.6%
19.6%
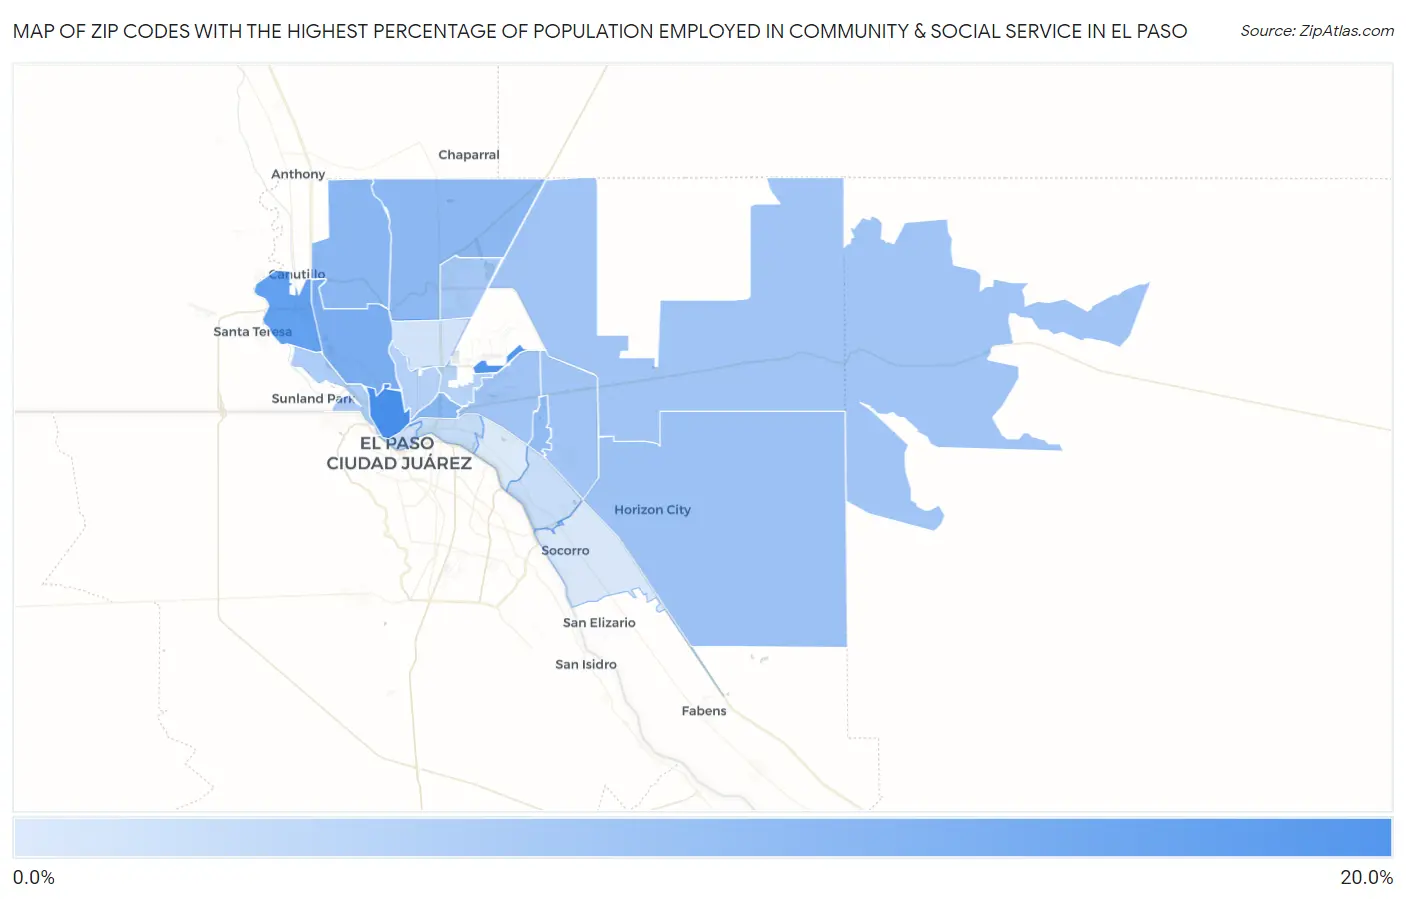
Zip Codes with the Highest Percentage of Population Employed in Community & Social Service in El Paso, TX
| Zip Code | % Employed | vs State | vs National | |
| 1. | 79902 | 19.6% | 10.5% (+9.12)#99 | 11.2% (+8.41)#2,154 |
| 2. | 79908 | 18.5% | 10.5% (+7.97)#122 | 11.2% (+7.26)#2,605 |
| 3. | 79932 | 16.8% | 10.5% (+6.32)#156 | 11.2% (+5.61)#3,496 |
| 4. | 79912 | 14.7% | 10.5% (+4.20)#258 | 11.2% (+3.49)#5,261 |
| 5. | 79903 | 13.4% | 10.5% (+2.88)#354 | 11.2% (+2.17)#6,921 |
| 6. | 79911 | 13.2% | 10.5% (+2.75)#366 | 11.2% (+2.04)#7,155 |
| 7. | 79934 | 12.9% | 10.5% (+2.36)#408 | 11.2% (+1.65)#7,794 |
| 8. | 79935 | 12.5% | 10.5% (+2.01)#452 | 11.2% (+1.30)#8,382 |
| 9. | 79928 | 11.7% | 10.5% (+1.23)#559 | 11.2% (+0.523)#9,905 |
| 10. | 79938 | 11.1% | 10.5% (+0.580)#644 | 11.2% (-0.131)#11,426 |
| 11. | 79936 | 11.1% | 10.5% (+0.550)#650 | 11.2% (-0.161)#11,502 |
| 12. | 79925 | 11.0% | 10.5% (+0.527)#654 | 11.2% (-0.183)#11,563 |
| 13. | 79924 | 10.6% | 10.5% (+0.056)#734 | 11.2% (-0.655)#12,730 |
| 14. | 79922 | 10.0% | 10.5% (-0.530)#838 | 11.2% (-1.24)#14,196 |
| 15. | 79930 | 9.4% | 10.5% (-1.15)#941 | 11.2% (-1.86)#15,811 |
| 16. | 79906 | 9.1% | 10.5% (-1.39)#977 | 11.2% (-2.10)#16,505 |
| 17. | 79905 | 7.6% | 10.5% (-2.90)#1,242 | 11.2% (-3.61)#20,634 |
| 18. | 79907 | 7.5% | 10.5% (-3.02)#1,260 | 11.2% (-3.73)#20,945 |
| 19. | 79901 | 7.1% | 10.5% (-3.44)#1,325 | 11.2% (-4.15)#21,971 |
| 20. | 79904 | 6.6% | 10.5% (-3.91)#1,383 | 11.2% (-4.62)#23,045 |
| 21. | 79927 | 5.9% | 10.5% (-4.56)#1,461 | 11.2% (-5.27)#24,484 |
| 22. | 79915 | 5.6% | 10.5% (-4.89)#1,488 | 11.2% (-5.60)#25,135 |
1
Common Questions
What are the Top 10 Zip Codes with the Highest Percentage of Population Employed in Community & Social Service in El Paso, TX?
Top 10 Zip Codes with the Highest Percentage of Population Employed in Community & Social Service in El Paso, TX are:
What zip code has the Highest Percentage of Population Employed in Community & Social Service in El Paso, TX?
79902 has the Highest Percentage of Population Employed in Community & Social Service in El Paso, TX with 19.6%.
What is the Percentage of Population Employed in Community & Social Service in El Paso, TX?
Percentage of Population Employed in Community & Social Service in El Paso is 11.3%.
What is the Percentage of Population Employed in Community & Social Service in Texas?
Percentage of Population Employed in Community & Social Service in Texas is 10.5%.
What is the Percentage of Population Employed in Community & Social Service in the United States?
Percentage of Population Employed in Community & Social Service in the United States is 11.2%.