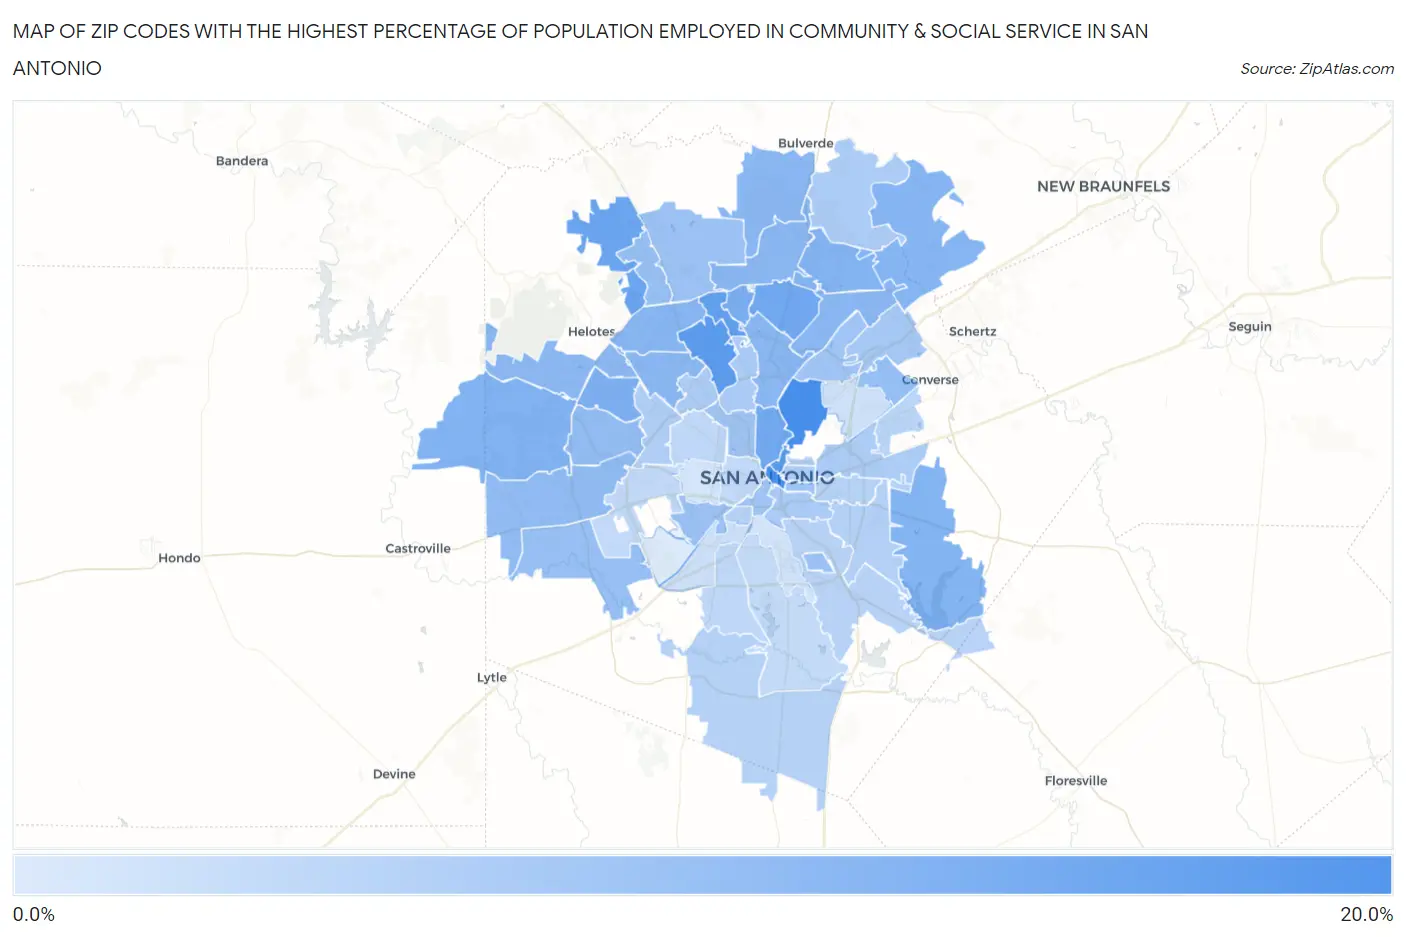
Zip Codes with the Highest Percentage of Population Employed in Community & Social Service in San Antonio, TX
RELATED REPORTS & OPTIONS
Community & Social Service
San Antonio
Compare Zip Codes
Map of Zip Codes with the Highest Percentage of Population Employed in Community & Social Service in San Antonio
3.8%
18.6%
Zip Codes with the Highest Percentage of Population Employed in Community & Social Service in San Antonio, TX
| Zip Code | % Employed | vs State | vs National | |
| 1. | 78209 | 18.6% | 10.5%(+8.12)#119 | 11.2%(+7.41)#2,543 |
| 2. | 78205 | 18.4% | 10.5%(+7.90)#126 | 11.2%(+7.19)#2,632 |
| 3. | 78215 | 16.7% | 10.5%(+6.24)#159 | 11.2%(+5.53)#3,546 |
| 4. | 78230 | 16.7% | 10.5%(+6.16)#165 | 11.2%(+5.45)#3,613 |
| 5. | 78231 | 15.8% | 10.5%(+5.32)#199 | 11.2%(+4.61)#4,214 |
| 6. | 78255 | 14.7% | 10.5%(+4.22)#257 | 11.2%(+3.51)#5,238 |
| 7. | 78232 | 14.2% | 10.5%(+3.69)#295 | 11.2%(+2.98)#5,834 |
| 8. | 78212 | 14.0% | 10.5%(+3.48)#315 | 11.2%(+2.77)#6,105 |
| 9. | 78248 | 13.3% | 10.5%(+2.82)#360 | 11.2%(+2.11)#7,035 |
| 10. | 78250 | 12.9% | 10.5%(+2.41)#401 | 11.2%(+1.70)#7,705 |
| 11. | 78253 | 12.6% | 10.5%(+2.14)#434 | 11.2%(+1.43)#8,170 |
| 12. | 78263 | 12.4% | 10.5%(+1.91)#461 | 11.2%(+1.20)#8,570 |
| 13. | 78259 | 12.3% | 10.5%(+1.84)#473 | 11.2%(+1.13)#8,713 |
| 14. | 78266 | 12.3% | 10.5%(+1.78)#480 | 11.2%(+1.07)#8,802 |
| 15. | 78249 | 12.0% | 10.5%(+1.53)#516 | 11.2%(+0.822)#9,300 |
| 16. | 78258 | 11.8% | 10.5%(+1.34)#540 | 11.2%(+0.629)#9,673 |
| 17. | 78216 | 11.8% | 10.5%(+1.33)#542 | 11.2%(+0.620)#9,690 |
| 18. | 78247 | 11.8% | 10.5%(+1.27)#555 | 11.2%(+0.555)#9,842 |
| 19. | 78260 | 11.8% | 10.5%(+1.26)#557 | 11.2%(+0.548)#9,871 |
| 20. | 78240 | 11.7% | 10.5%(+1.19)#565 | 11.2%(+0.475)#10,028 |
| 21. | 78254 | 11.6% | 10.5%(+1.11)#570 | 11.2%(+0.401)#10,195 |
| 22. | 78245 | 11.1% | 10.5%(+0.561)#649 | 11.2%(-0.150)#11,476 |
| 23. | 78251 | 10.9% | 10.5%(+0.357)#687 | 11.2%(-0.354)#11,991 |
| 24. | 78239 | 10.7% | 10.5%(+0.193)#715 | 11.2%(-0.518)#12,391 |
| 25. | 78252 | 10.3% | 10.5%(-0.156)#767 | 11.2%(-0.867)#13,238 |
| 26. | 78256 | 10.3% | 10.5%(-0.229)#782 | 11.2%(-0.940)#13,426 |
| 27. | 78226 | 10.3% | 10.5%(-0.250)#786 | 11.2%(-0.961)#13,479 |
| 28. | 78257 | 10.1% | 10.5%(-0.447)#818 | 11.2%(-1.16)#13,984 |
| 29. | 78235 | 10.0% | 10.5%(-0.548)#839 | 11.2%(-1.26)#14,237 |
| 30. | 78217 | 9.6% | 10.5%(-0.920)#889 | 11.2%(-1.63)#15,177 |
| 31. | 78203 | 9.5% | 10.5%(-0.959)#903 | 11.2%(-1.67)#15,286 |
| 32. | 78204 | 9.5% | 10.5%(-1.01)#919 | 11.2%(-1.72)#15,440 |
| 33. | 78201 | 9.4% | 10.5%(-1.09)#928 | 11.2%(-1.80)#15,637 |
| 34. | 78233 | 9.1% | 10.5%(-1.44)#988 | 11.2%(-2.15)#16,659 |
| 35. | 78210 | 8.5% | 10.5%(-1.99)#1,080 | 11.2%(-2.70)#18,135 |
| 36. | 78213 | 8.5% | 10.5%(-2.04)#1,086 | 11.2%(-2.75)#18,261 |
| 37. | 78261 | 8.4% | 10.5%(-2.07)#1,097 | 11.2%(-2.78)#18,349 |
| 38. | 78219 | 8.4% | 10.5%(-2.10)#1,106 | 11.2%(-2.81)#18,460 |
| 39. | 78229 | 8.4% | 10.5%(-2.13)#1,114 | 11.2%(-2.85)#18,545 |
| 40. | 78202 | 8.2% | 10.5%(-2.26)#1,134 | 11.2%(-2.97)#18,891 |
| 41. | 78238 | 8.0% | 10.5%(-2.47)#1,171 | 11.2%(-3.18)#19,482 |
| 42. | 78222 | 7.8% | 10.5%(-2.75)#1,219 | 11.2%(-3.46)#20,254 |
| 43. | 78264 | 7.5% | 10.5%(-3.03)#1,261 | 11.2%(-3.75)#20,971 |
| 44. | 78208 | 7.5% | 10.5%(-3.05)#1,266 | 11.2%(-3.76)#21,004 |
| 45. | 78225 | 7.4% | 10.5%(-3.06)#1,268 | 11.2%(-3.77)#21,039 |
| 46. | 78220 | 7.4% | 10.5%(-3.13)#1,279 | 11.2%(-3.84)#21,216 |
| 47. | 78223 | 7.2% | 10.5%(-3.26)#1,300 | 11.2%(-3.98)#21,547 |
| 48. | 78244 | 7.1% | 10.5%(-3.40)#1,319 | 11.2%(-4.12)#21,904 |
| 49. | 78224 | 6.6% | 10.5%(-3.91)#1,384 | 11.2%(-4.62)#23,046 |
| 50. | 78228 | 6.6% | 10.5%(-3.95)#1,389 | 11.2%(-4.66)#23,133 |
| 51. | 78227 | 6.3% | 10.5%(-4.18)#1,415 | 11.2%(-4.90)#23,669 |
| 52. | 78207 | 6.3% | 10.5%(-4.21)#1,419 | 11.2%(-4.93)#23,742 |
| 53. | 78221 | 6.1% | 10.5%(-4.44)#1,446 | 11.2%(-5.15)#24,230 |
| 54. | 78211 | 5.3% | 10.5%(-5.21)#1,513 | 11.2%(-5.92)#25,725 |
| 55. | 78218 | 5.1% | 10.5%(-5.44)#1,540 | 11.2%(-6.15)#26,095 |
| 56. | 78214 | 4.7% | 10.5%(-5.77)#1,573 | 11.2%(-6.48)#26,613 |
| 57. | 78237 | 4.5% | 10.5%(-5.97)#1,593 | 11.2%(-6.68)#26,903 |
| 58. | 78242 | 3.8% | 10.5%(-6.74)#1,654 | 11.2%(-7.45)#27,847 |
1
Common Questions
What are the Top 10 Zip Codes with the Highest Percentage of Population Employed in Community & Social Service in San Antonio, TX?
Top 10 Zip Codes with the Highest Percentage of Population Employed in Community & Social Service in San Antonio, TX are:
What zip code has the Highest Percentage of Population Employed in Community & Social Service in San Antonio, TX?
78209 has the Highest Percentage of Population Employed in Community & Social Service in San Antonio, TX with 18.6%.
What is the Percentage of Population Employed in Community & Social Service in San Antonio, TX?
Percentage of Population Employed in Community & Social Service in San Antonio is 9.9%.
What is the Percentage of Population Employed in Community & Social Service in Texas?
Percentage of Population Employed in Community & Social Service in Texas is 10.5%.
What is the Percentage of Population Employed in Community & Social Service in the United States?
Percentage of Population Employed in Community & Social Service in the United States is 11.2%.