Zip Codes with the Highest Percentage of Population Employed in Community & Social Service in Amarillo, TX
RELATED REPORTS & OPTIONS
Community & Social Service
Amarillo
Compare Zip Codes
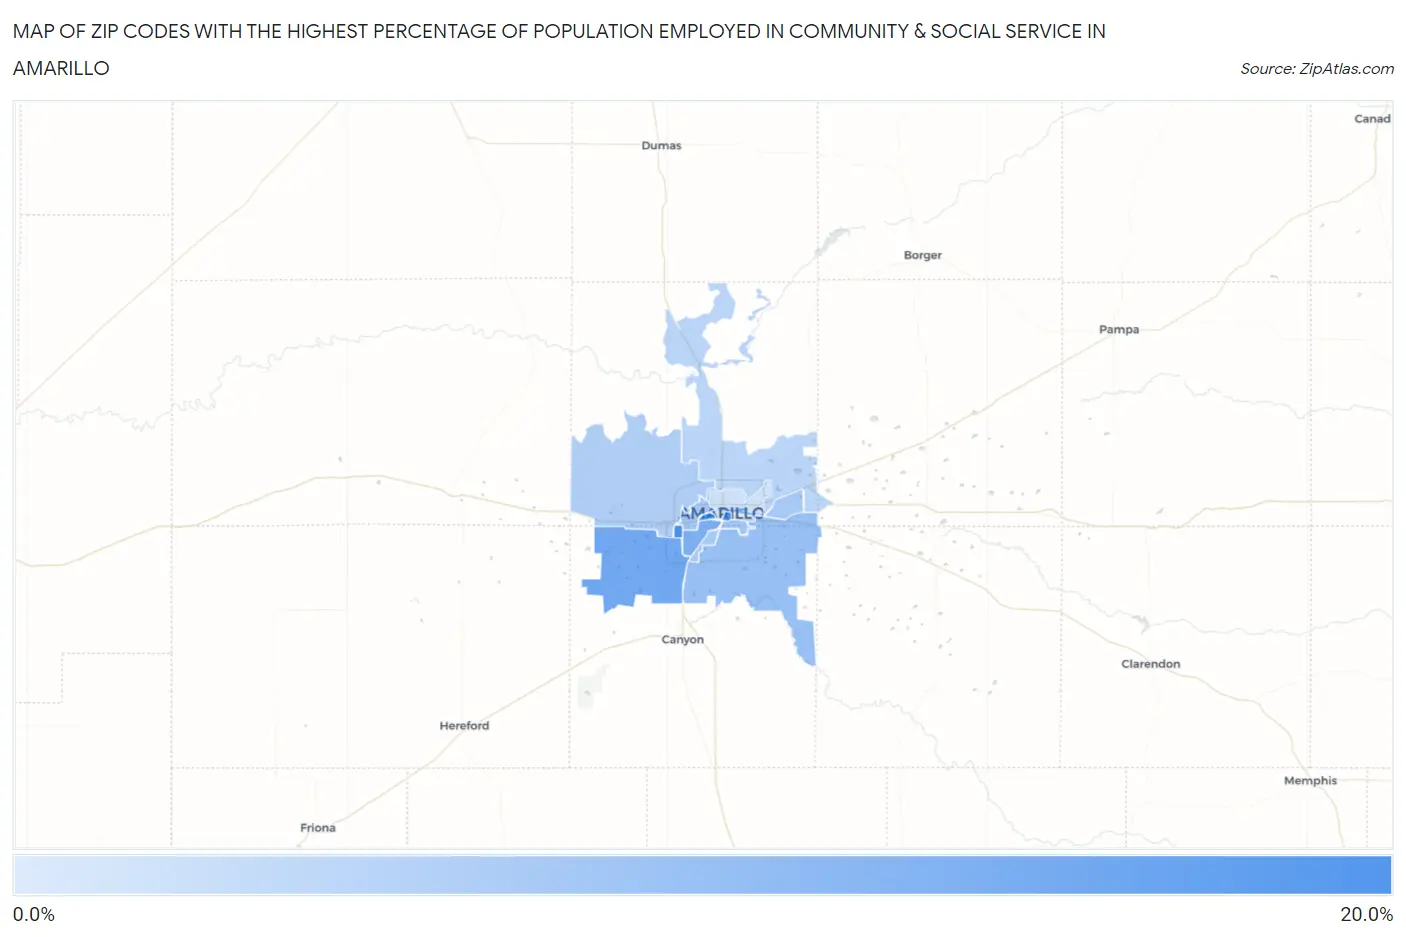
Map of Zip Codes with the Highest Percentage of Population Employed in Community & Social Service in Amarillo
3.4%
19.4%
Zip Codes with the Highest Percentage of Population Employed in Community & Social Service in Amarillo, TX
| Zip Code | % Employed | vs State | vs National | |
| 1. | 79102 | 19.4% | 10.5%(+8.94)#104 | 11.2%(+8.23)#2,220 |
| 2. | 79121 | 18.9% | 10.5%(+8.43)#115 | 11.2%(+7.72)#2,419 |
| 3. | 79119 | 14.8% | 10.5%(+4.31)#254 | 11.2%(+3.60)#5,149 |
| 4. | 79109 | 13.6% | 10.5%(+3.10)#341 | 11.2%(+2.39)#6,616 |
| 5. | 79118 | 10.6% | 10.5%(+0.115)#725 | 11.2%(-0.596)#12,590 |
| 6. | 79103 | 9.2% | 10.5%(-1.26)#961 | 11.2%(-1.97)#16,148 |
| 7. | 79111 | 9.1% | 10.5%(-1.43)#985 | 11.2%(-2.14)#16,617 |
| 8. | 79106 | 9.1% | 10.5%(-1.43)#986 | 11.2%(-2.14)#16,621 |
| 9. | 79110 | 8.8% | 10.5%(-1.70)#1,032 | 11.2%(-2.42)#17,349 |
| 10. | 79124 | 8.1% | 10.5%(-2.45)#1,164 | 11.2%(-3.16)#19,406 |
| 11. | 79108 | 6.9% | 10.5%(-3.65)#1,350 | 11.2%(-4.36)#22,489 |
| 12. | 79107 | 4.7% | 10.5%(-5.78)#1,575 | 11.2%(-6.49)#26,626 |
| 13. | 79101 | 4.5% | 10.5%(-5.96)#1,591 | 11.2%(-6.67)#26,893 |
| 14. | 79104 | 3.4% | 10.5%(-7.08)#1,668 | 11.2%(-7.79)#28,175 |
1
Common Questions
What are the Top 10 Zip Codes with the Highest Percentage of Population Employed in Community & Social Service in Amarillo, TX?
Top 10 Zip Codes with the Highest Percentage of Population Employed in Community & Social Service in Amarillo, TX are:
What zip code has the Highest Percentage of Population Employed in Community & Social Service in Amarillo, TX?
79102 has the Highest Percentage of Population Employed in Community & Social Service in Amarillo, TX with 19.4%.
What is the Percentage of Population Employed in Community & Social Service in Amarillo, TX?
Percentage of Population Employed in Community & Social Service in Amarillo is 10.5%.
What is the Percentage of Population Employed in Community & Social Service in Texas?
Percentage of Population Employed in Community & Social Service in Texas is 10.5%.
What is the Percentage of Population Employed in Community & Social Service in the United States?
Percentage of Population Employed in Community & Social Service in the United States is 11.2%.