Zip Codes with the Highest Percentage of Population Employed in Community & Social Service in Fort Worth, TX
RELATED REPORTS & OPTIONS
Community & Social Service
Fort Worth
Compare Zip Codes
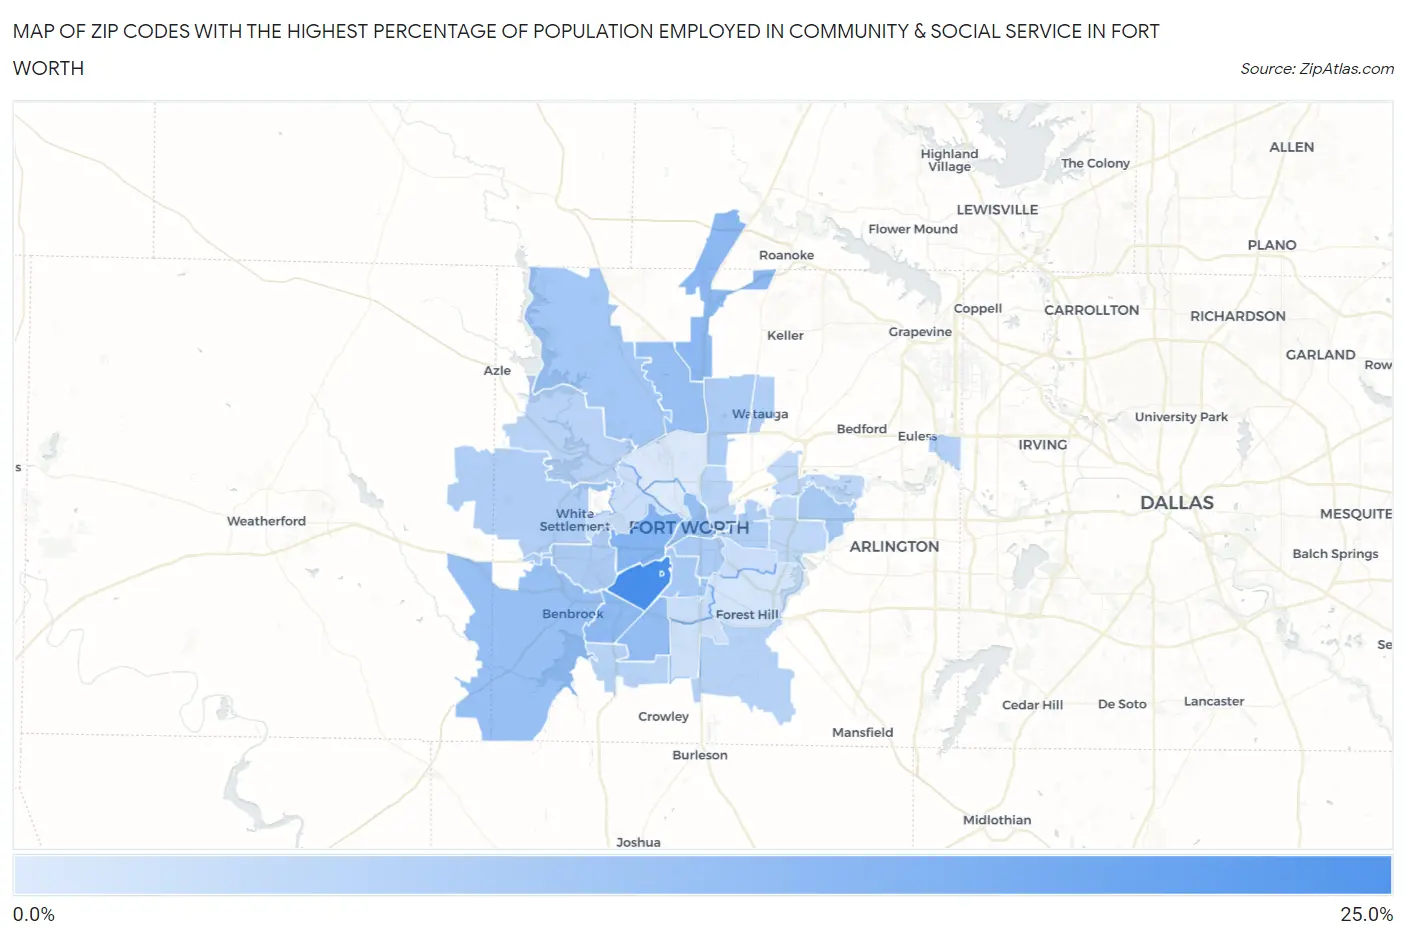
Map of Zip Codes with the Highest Percentage of Population Employed in Community & Social Service in Fort Worth
3.9%
22.1%
Zip Codes with the Highest Percentage of Population Employed in Community & Social Service in Fort Worth, TX
| Zip Code | % Employed | vs State | vs National | |
| 1. | 76129 | 22.1% | 10.5%(+11.6)#63 | 11.2%(+10.9)#1,448 |
| 2. | 76109 | 22.1% | 10.5%(+11.6)#64 | 11.2%(+10.9)#1,450 |
| 3. | 76107 | 14.2% | 10.5%(+3.68)#296 | 11.2%(+2.97)#5,854 |
| 4. | 76177 | 13.4% | 10.5%(+2.91)#351 | 11.2%(+2.19)#6,889 |
| 5. | 76132 | 13.2% | 10.5%(+2.70)#372 | 11.2%(+1.99)#7,243 |
| 6. | 76133 | 12.4% | 10.5%(+1.93)#460 | 11.2%(+1.22)#8,534 |
| 7. | 76102 | 12.1% | 10.5%(+1.58)#513 | 11.2%(+0.870)#9,205 |
| 8. | 76126 | 12.0% | 10.5%(+1.48)#521 | 11.2%(+0.767)#9,410 |
| 9. | 76131 | 12.0% | 10.5%(+1.47)#523 | 11.2%(+0.760)#9,427 |
| 10. | 76179 | 10.7% | 10.5%(+0.167)#716 | 11.2%(-0.544)#12,456 |
| 11. | 76120 | 10.1% | 10.5%(-0.362)#802 | 11.2%(-1.07)#13,759 |
| 12. | 76110 | 10.0% | 10.5%(-0.483)#827 | 11.2%(-1.19)#14,077 |
| 13. | 76104 | 9.7% | 10.5%(-0.826)#872 | 11.2%(-1.54)#14,908 |
| 14. | 76116 | 9.5% | 10.5%(-1.02)#920 | 11.2%(-1.73)#15,453 |
| 15. | 76137 | 9.4% | 10.5%(-1.15)#942 | 11.2%(-1.86)#15,825 |
| 16. | 76108 | 9.2% | 10.5%(-1.31)#965 | 11.2%(-2.02)#16,274 |
| 17. | 76103 | 9.0% | 10.5%(-1.53)#1,006 | 11.2%(-2.24)#16,894 |
| 18. | 76148 | 8.8% | 10.5%(-1.71)#1,033 | 11.2%(-2.42)#17,356 |
| 19. | 76155 | 8.6% | 10.5%(-1.92)#1,068 | 11.2%(-2.63)#17,946 |
| 20. | 76123 | 8.4% | 10.5%(-2.06)#1,095 | 11.2%(-2.77)#18,328 |
| 21. | 76140 | 8.4% | 10.5%(-2.12)#1,109 | 11.2%(-2.83)#18,512 |
| 22. | 76135 | 8.0% | 10.5%(-2.53)#1,177 | 11.2%(-3.24)#19,626 |
| 23. | 76111 | 7.8% | 10.5%(-2.67)#1,211 | 11.2%(-3.39)#20,080 |
| 24. | 76112 | 7.4% | 10.5%(-3.08)#1,271 | 11.2%(-3.79)#21,078 |
| 25. | 76118 | 7.3% | 10.5%(-3.24)#1,297 | 11.2%(-3.95)#21,483 |
| 26. | 76115 | 6.1% | 10.5%(-4.38)#1,433 | 11.2%(-5.09)#24,107 |
| 27. | 76114 | 6.0% | 10.5%(-4.47)#1,450 | 11.2%(-5.18)#24,312 |
| 28. | 76105 | 6.0% | 10.5%(-4.53)#1,456 | 11.2%(-5.24)#24,416 |
| 29. | 76134 | 5.3% | 10.5%(-5.18)#1,511 | 11.2%(-5.89)#25,667 |
| 30. | 76119 | 4.9% | 10.5%(-5.60)#1,553 | 11.2%(-6.31)#26,342 |
| 31. | 76106 | 4.1% | 10.5%(-6.42)#1,627 | 11.2%(-7.13)#27,456 |
| 32. | 76164 | 3.9% | 10.5%(-6.62)#1,643 | 11.2%(-7.33)#27,693 |
1
Common Questions
What are the Top 10 Zip Codes with the Highest Percentage of Population Employed in Community & Social Service in Fort Worth, TX?
Top 10 Zip Codes with the Highest Percentage of Population Employed in Community & Social Service in Fort Worth, TX are:
What zip code has the Highest Percentage of Population Employed in Community & Social Service in Fort Worth, TX?
76129 has the Highest Percentage of Population Employed in Community & Social Service in Fort Worth, TX with 22.1%.
What is the Percentage of Population Employed in Community & Social Service in Fort Worth, TX?
Percentage of Population Employed in Community & Social Service in Fort Worth is 9.9%.
What is the Percentage of Population Employed in Community & Social Service in Texas?
Percentage of Population Employed in Community & Social Service in Texas is 10.5%.
What is the Percentage of Population Employed in Community & Social Service in the United States?
Percentage of Population Employed in Community & Social Service in the United States is 11.2%.