Zip Codes with the Highest Percentage of Population Employed in Community & Social Service in Houston, TX
RELATED REPORTS & OPTIONS
Community & Social Service
Houston
Compare Zip Codes
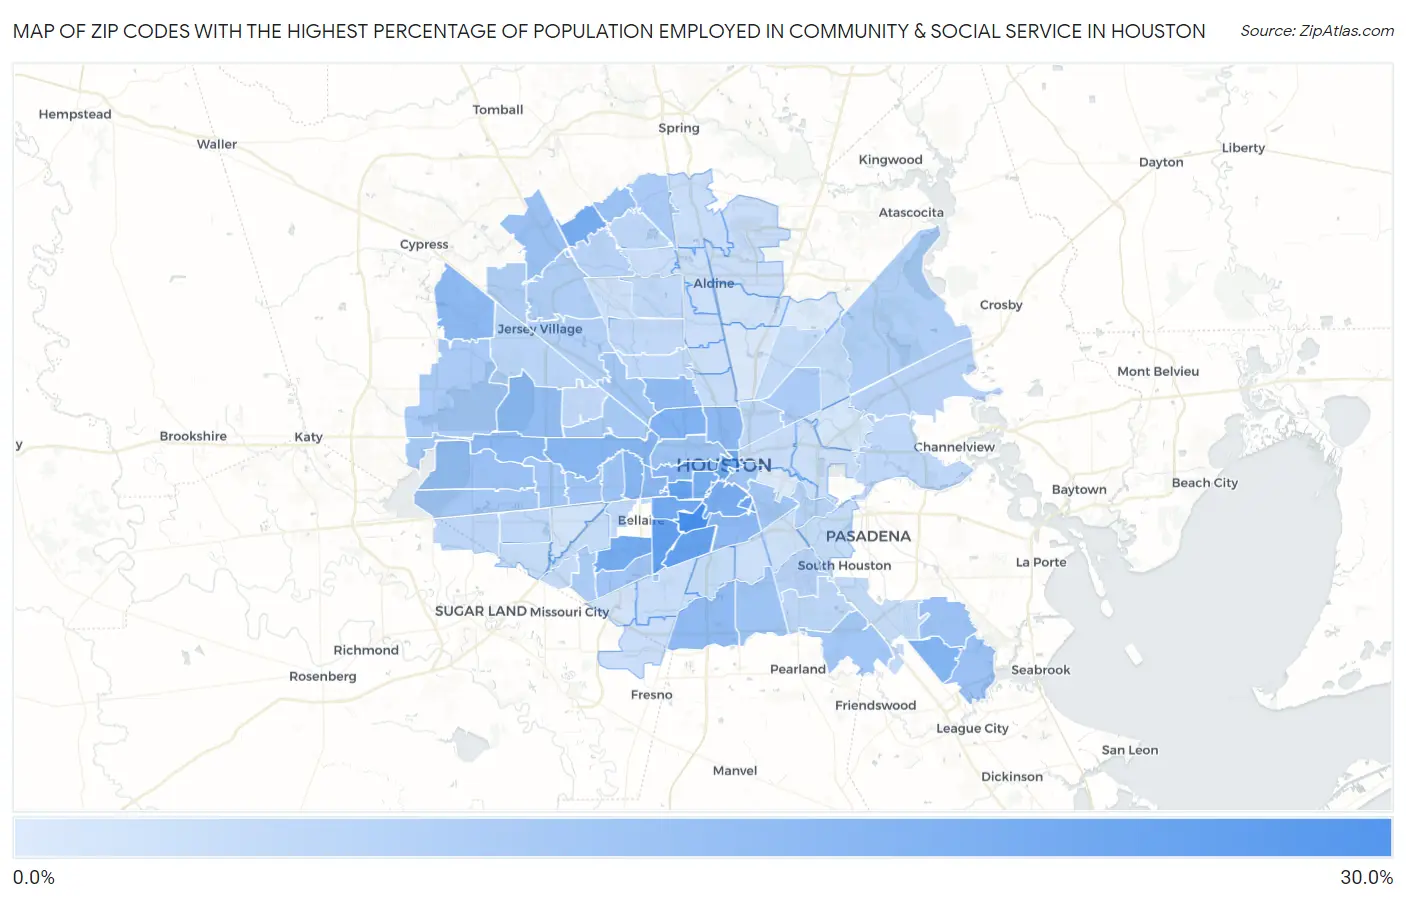
Map of Zip Codes with the Highest Percentage of Population Employed in Community & Social Service in Houston
2.3%
25.9%
Zip Codes with the Highest Percentage of Population Employed in Community & Social Service in Houston, TX
| Zip Code | % Employed | vs State | vs National | |
| 1. | 77030 | 25.9% | 10.5%(+15.4)#35 | 11.2%(+14.7)#882 |
| 2. | 77046 | 22.0% | 10.5%(+11.5)#65 | 11.2%(+10.8)#1,475 |
| 3. | 77025 | 21.0% | 10.5%(+10.5)#73 | 11.2%(+9.82)#1,710 |
| 4. | 77054 | 20.7% | 10.5%(+10.2)#81 | 11.2%(+9.54)#1,792 |
| 5. | 77098 | 20.7% | 10.5%(+10.2)#82 | 11.2%(+9.50)#1,807 |
| 6. | 77204 | 19.4% | 10.5%(+8.87)#105 | 11.2%(+8.16)#2,245 |
| 7. | 77005 | 18.4% | 10.5%(+7.91)#125 | 11.2%(+7.20)#2,630 |
| 8. | 77002 | 18.4% | 10.5%(+7.88)#128 | 11.2%(+7.17)#2,644 |
| 9. | 77096 | 17.9% | 10.5%(+7.44)#136 | 11.2%(+6.73)#2,846 |
| 10. | 77069 | 17.8% | 10.5%(+7.32)#141 | 11.2%(+6.61)#2,908 |
| 11. | 77004 | 17.5% | 10.5%(+6.97)#145 | 11.2%(+6.26)#3,070 |
| 12. | 77006 | 17.2% | 10.5%(+6.71)#150 | 11.2%(+6.00)#3,238 |
| 13. | 77010 | 16.4% | 10.5%(+5.87)#176 | 11.2%(+5.16)#3,787 |
| 14. | 77008 | 16.1% | 10.5%(+5.60)#186 | 11.2%(+4.89)#3,991 |
| 15. | 77062 | 15.9% | 10.5%(+5.40)#194 | 11.2%(+4.69)#4,146 |
| 16. | 77019 | 15.3% | 10.5%(+4.77)#232 | 11.2%(+4.06)#4,731 |
| 17. | 77024 | 15.2% | 10.5%(+4.72)#234 | 11.2%(+4.01)#4,774 |
| 18. | 77056 | 15.2% | 10.5%(+4.70)#236 | 11.2%(+3.99)#4,790 |
| 19. | 77009 | 14.3% | 10.5%(+3.78)#289 | 11.2%(+3.07)#5,743 |
| 20. | 77027 | 14.2% | 10.5%(+3.73)#292 | 11.2%(+3.02)#5,795 |
| 21. | 77021 | 14.1% | 10.5%(+3.57)#308 | 11.2%(+2.86)#5,992 |
| 22. | 77095 | 14.0% | 10.5%(+3.53)#312 | 11.2%(+2.82)#6,053 |
| 23. | 77079 | 13.9% | 10.5%(+3.38)#322 | 11.2%(+2.67)#6,227 |
| 24. | 77018 | 13.8% | 10.5%(+3.26)#330 | 11.2%(+2.55)#6,398 |
| 25. | 77047 | 13.5% | 10.5%(+3.00)#346 | 11.2%(+2.29)#6,744 |
| 26. | 77043 | 13.2% | 10.5%(+2.71)#371 | 11.2%(+2.00)#7,222 |
| 27. | 77059 | 12.2% | 10.5%(+1.74)#487 | 11.2%(+1.03)#8,874 |
| 28. | 77077 | 12.0% | 10.5%(+1.48)#522 | 11.2%(+0.766)#9,414 |
| 29. | 77068 | 11.9% | 10.5%(+1.43)#528 | 11.2%(+0.724)#9,508 |
| 30. | 77070 | 11.9% | 10.5%(+1.35)#539 | 11.2%(+0.637)#9,662 |
| 31. | 77058 | 11.8% | 10.5%(+1.28)#550 | 11.2%(+0.572)#9,796 |
| 32. | 77057 | 11.5% | 10.5%(+1.00)#583 | 11.2%(+0.292)#10,442 |
| 33. | 77003 | 11.4% | 10.5%(+0.917)#595 | 11.2%(+0.207)#10,627 |
| 34. | 77007 | 11.4% | 10.5%(+0.877)#602 | 11.2%(+0.167)#10,718 |
| 35. | 77048 | 11.3% | 10.5%(+0.818)#609 | 11.2%(+0.107)#10,843 |
| 36. | 77063 | 11.3% | 10.5%(+0.761)#618 | 11.2%(+0.050)#10,977 |
| 37. | 77035 | 11.1% | 10.5%(+0.636)#631 | 11.2%(-0.075)#11,277 |
| 38. | 77042 | 11.0% | 10.5%(+0.447)#670 | 11.2%(-0.264)#11,759 |
| 39. | 77023 | 10.8% | 10.5%(+0.298)#696 | 11.2%(-0.413)#12,112 |
| 40. | 77092 | 10.8% | 10.5%(+0.298)#697 | 11.2%(-0.413)#12,113 |
| 41. | 77089 | 10.7% | 10.5%(+0.244)#709 | 11.2%(-0.467)#12,246 |
| 42. | 77082 | 10.6% | 10.5%(+0.049)#737 | 11.2%(-0.662)#12,745 |
| 43. | 77055 | 10.2% | 10.5%(-0.285)#793 | 11.2%(-0.995)#13,565 |
| 44. | 77094 | 10.0% | 10.5%(-0.493)#829 | 11.2%(-1.20)#14,093 |
| 45. | 77084 | 9.7% | 10.5%(-0.758)#861 | 11.2%(-1.47)#14,755 |
| 46. | 77028 | 9.7% | 10.5%(-0.773)#864 | 11.2%(-1.48)#14,787 |
| 47. | 77090 | 9.6% | 10.5%(-0.926)#892 | 11.2%(-1.64)#15,192 |
| 48. | 77071 | 9.3% | 10.5%(-1.21)#949 | 11.2%(-1.92)#16,000 |
| 49. | 77064 | 9.2% | 10.5%(-1.33)#971 | 11.2%(-2.04)#16,333 |
| 50. | 77065 | 9.0% | 10.5%(-1.47)#994 | 11.2%(-2.18)#16,709 |
| 51. | 77044 | 8.6% | 10.5%(-1.91)#1,065 | 11.2%(-2.62)#17,901 |
| 52. | 77040 | 8.4% | 10.5%(-2.14)#1,115 | 11.2%(-2.86)#18,575 |
| 53. | 77012 | 7.9% | 10.5%(-2.63)#1,198 | 11.2%(-3.34)#19,944 |
| 54. | 77049 | 7.7% | 10.5%(-2.79)#1,225 | 11.2%(-3.50)#20,342 |
| 55. | 77061 | 7.5% | 10.5%(-2.96)#1,250 | 11.2%(-3.67)#20,765 |
| 56. | 77066 | 7.5% | 10.5%(-3.02)#1,258 | 11.2%(-3.73)#20,927 |
| 57. | 77041 | 7.1% | 10.5%(-3.37)#1,312 | 11.2%(-4.08)#21,801 |
| 58. | 77075 | 7.1% | 10.5%(-3.41)#1,321 | 11.2%(-4.12)#21,917 |
| 59. | 77083 | 7.0% | 10.5%(-3.45)#1,327 | 11.2%(-4.17)#22,018 |
| 60. | 77014 | 6.8% | 10.5%(-3.67)#1,353 | 11.2%(-4.38)#22,535 |
| 61. | 77026 | 6.8% | 10.5%(-3.67)#1,354 | 11.2%(-4.38)#22,539 |
| 62. | 77091 | 6.7% | 10.5%(-3.80)#1,369 | 11.2%(-4.51)#22,811 |
| 63. | 77072 | 6.7% | 10.5%(-3.81)#1,370 | 11.2%(-4.52)#22,826 |
| 64. | 77081 | 6.6% | 10.5%(-3.88)#1,380 | 11.2%(-4.59)#22,987 |
| 65. | 77015 | 6.5% | 10.5%(-3.99)#1,396 | 11.2%(-4.70)#23,246 |
| 66. | 77088 | 6.4% | 10.5%(-4.10)#1,404 | 11.2%(-4.82)#23,496 |
| 67. | 77038 | 6.3% | 10.5%(-4.17)#1,414 | 11.2%(-4.88)#23,640 |
| 68. | 77080 | 6.2% | 10.5%(-4.29)#1,426 | 11.2%(-5.00)#23,908 |
| 69. | 77031 | 5.9% | 10.5%(-4.56)#1,459 | 11.2%(-5.27)#24,477 |
| 70. | 77016 | 5.9% | 10.5%(-4.56)#1,460 | 11.2%(-5.27)#24,479 |
| 71. | 77034 | 5.9% | 10.5%(-4.57)#1,462 | 11.2%(-5.28)#24,494 |
| 72. | 77078 | 5.8% | 10.5%(-4.75)#1,477 | 11.2%(-5.46)#24,880 |
| 73. | 77017 | 5.7% | 10.5%(-4.79)#1,481 | 11.2%(-5.50)#24,936 |
| 74. | 77074 | 5.6% | 10.5%(-4.91)#1,490 | 11.2%(-5.62)#25,158 |
| 75. | 77099 | 5.6% | 10.5%(-4.93)#1,494 | 11.2%(-5.64)#25,190 |
| 76. | 77051 | 5.5% | 10.5%(-5.00)#1,498 | 11.2%(-5.71)#25,324 |
| 77. | 77045 | 5.4% | 10.5%(-5.12)#1,506 | 11.2%(-5.83)#25,564 |
| 78. | 77022 | 5.3% | 10.5%(-5.17)#1,509 | 11.2%(-5.88)#25,656 |
| 79. | 77073 | 5.2% | 10.5%(-5.32)#1,528 | 11.2%(-6.03)#25,886 |
| 80. | 77020 | 5.2% | 10.5%(-5.35)#1,530 | 11.2%(-6.06)#25,949 |
| 81. | 77067 | 5.1% | 10.5%(-5.42)#1,539 | 11.2%(-6.13)#26,053 |
| 82. | 77037 | 5.0% | 10.5%(-5.47)#1,542 | 11.2%(-6.18)#26,141 |
| 83. | 77053 | 4.9% | 10.5%(-5.61)#1,556 | 11.2%(-6.32)#26,369 |
| 84. | 77032 | 4.8% | 10.5%(-5.66)#1,562 | 11.2%(-6.37)#26,446 |
| 85. | 77060 | 4.7% | 10.5%(-5.77)#1,571 | 11.2%(-6.48)#26,605 |
| 86. | 77029 | 4.7% | 10.5%(-5.78)#1,576 | 11.2%(-6.49)#26,629 |
| 87. | 77086 | 4.7% | 10.5%(-5.80)#1,578 | 11.2%(-6.52)#26,656 |
| 88. | 77076 | 4.7% | 10.5%(-5.80)#1,580 | 11.2%(-6.52)#26,658 |
| 89. | 77033 | 4.6% | 10.5%(-5.93)#1,587 | 11.2%(-6.64)#26,831 |
| 90. | 77087 | 4.1% | 10.5%(-6.40)#1,623 | 11.2%(-7.11)#27,426 |
| 91. | 77085 | 4.0% | 10.5%(-6.45)#1,631 | 11.2%(-7.16)#27,498 |
| 92. | 77039 | 3.8% | 10.5%(-6.66)#1,647 | 11.2%(-7.37)#27,753 |
| 93. | 77036 | 3.8% | 10.5%(-6.73)#1,651 | 11.2%(-7.44)#27,832 |
| 94. | 77013 | 3.4% | 10.5%(-7.08)#1,667 | 11.2%(-7.79)#28,172 |
| 95. | 77093 | 3.0% | 10.5%(-7.52)#1,686 | 11.2%(-8.23)#28,568 |
| 96. | 77050 | 2.4% | 10.5%(-8.10)#1,705 | 11.2%(-8.81)#28,971 |
| 97. | 77011 | 2.3% | 10.5%(-8.22)#1,709 | 11.2%(-8.93)#29,054 |
1
Common Questions
What are the Top 10 Zip Codes with the Highest Percentage of Population Employed in Community & Social Service in Houston, TX?
Top 10 Zip Codes with the Highest Percentage of Population Employed in Community & Social Service in Houston, TX are:
What zip code has the Highest Percentage of Population Employed in Community & Social Service in Houston, TX?
77030 has the Highest Percentage of Population Employed in Community & Social Service in Houston, TX with 25.9%.
What is the Percentage of Population Employed in Community & Social Service in Houston, TX?
Percentage of Population Employed in Community & Social Service in Houston is 10.1%.
What is the Percentage of Population Employed in Community & Social Service in Texas?
Percentage of Population Employed in Community & Social Service in Texas is 10.5%.
What is the Percentage of Population Employed in Community & Social Service in the United States?
Percentage of Population Employed in Community & Social Service in the United States is 11.2%.