Zip Codes with the Highest Percentage of Population Employed in Community & Social Service in College Station, TX

RELATED REPORTS & OPTIONS

Community & Social Service
Population
Families and Households
Female Fertility
Female Fertility (Unmarried)
Race (Community Size)
Race (Percentage)
Ancestry (Community Size)
AfricanAlaska NativeAmericanArabArgentineanAustralianAustrianBasqueBelgianBhutaneseBlackfeetBolivianBrazilianBritishBurmeseCajunCentral AmericanCentral American IndianCherokeeChickasawChileanChoctawColombianCosta RicanCroatianCubanCzechCzechoslovakianDanishDominicanDutchEastern EuropeanEcuadorianEgyptianEnglishEuropeanFilipinoFinnishFrenchFrench CanadianGermanGreekGuamanian / ChamorroGuatemalanGuyaneseHonduranHungarianIndian (Asian)IranianIrishIsraeliItalianJamaicanJordanianKoreanLaotianLatvianLebaneseLithuanianMalaysianMexicanMexican American IndianMongolianNigerianNorthern EuropeanNorwegianPeruvianPolishPortuguesePuerto RicanRomanianRussianSalvadoranScandinavianScotch-IrishScottishSerbianSiouxSouth AmericanSpaniardSpanishSri LankanSubsaharan AfricanSwedishSyrianThaiTurkishUkrainianVenezuelanVietnameseWelshWest IndianYugoslavian
Ancestry (Percentage)
AfricanAlaska NativeAmericanArabArgentineanAustralianAustrianBasqueBelgianBhutaneseBlackfeetBolivianBrazilianBritishBurmeseCajunCentral AmericanCentral American IndianCherokeeChickasawChileanChoctawColombianCosta RicanCroatianCubanCzechCzechoslovakianDanishDominicanDutchEastern EuropeanEcuadorianEgyptianEnglishEuropeanFilipinoFinnishFrenchFrench CanadianGermanGreekGuamanian / ChamorroGuatemalanGuyaneseHonduranHungarianIndian (Asian)IranianIrishIsraeliItalianJamaicanJordanianKoreanLaotianLatvianLebaneseLithuanianMalaysianMexicanMexican American IndianMongolianNigerianNorthern EuropeanNorwegianPeruvianPolishPortuguesePuerto RicanRomanianRussianSalvadoranScandinavianScotch-IrishScottishSerbianSiouxSouth AmericanSpaniardSpanishSri LankanSubsaharan AfricanSwedishSyrianThaiTurkishUkrainianVenezuelanVietnameseWelshWest IndianYugoslavian
Immigrant Origin (Total)
Immigrant Origin (Percentage)
Income
Income (Families)
Income (Households)
Poverty
Poverty (Families)
Unemployment
Employment Occupations
Employment Industries
Employer Class
Commute Time
Commute Means
School Enrollment
Education by Degree Field
Occupancy
Finances
Physical Characteristics
College Station
Compare Zip Codes
Comparison Subject

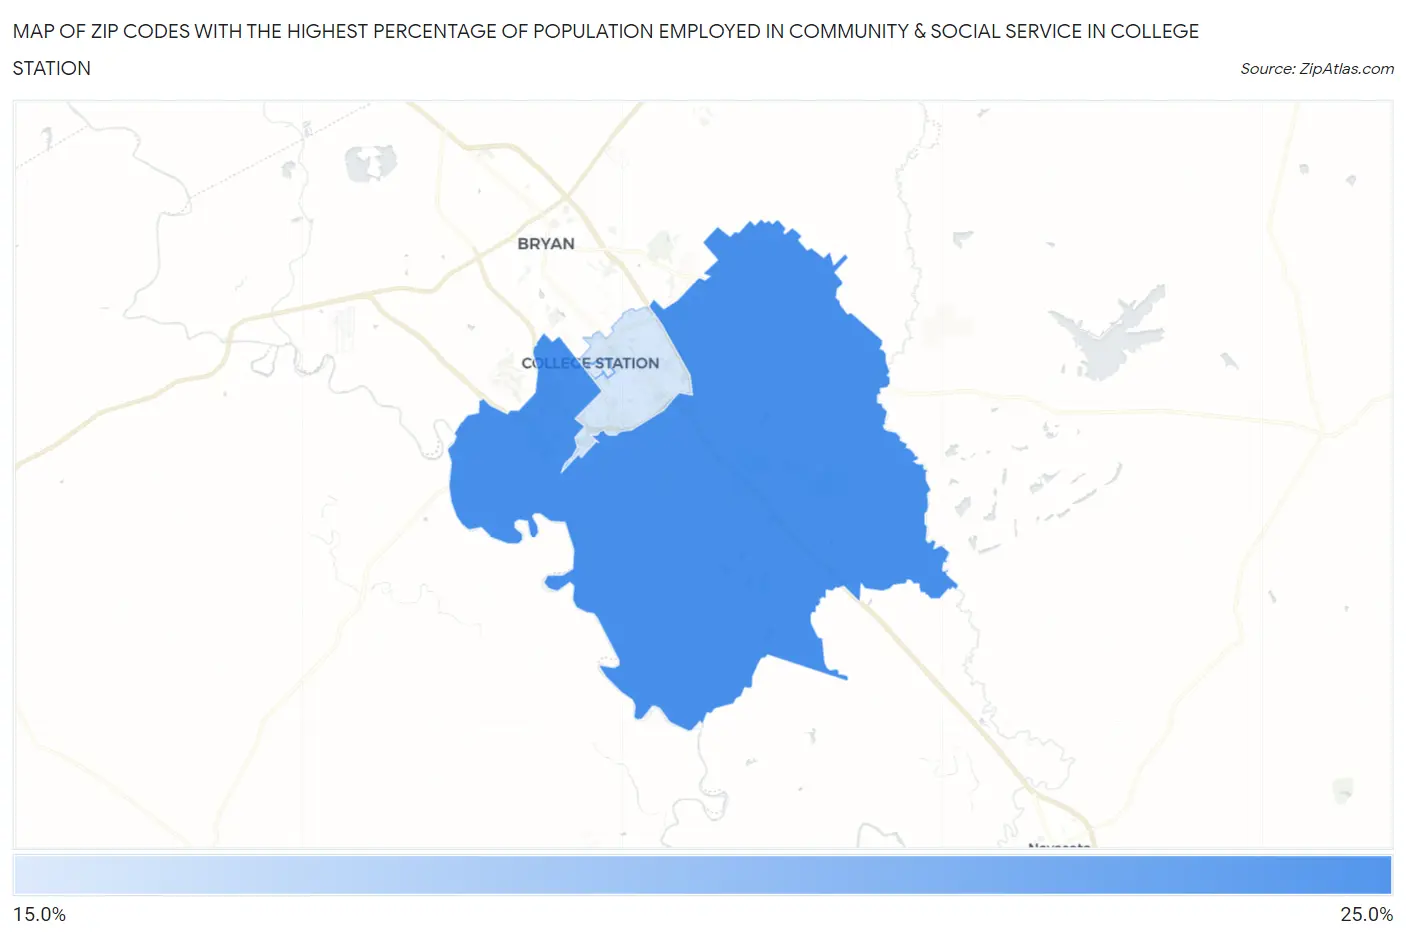
Map of Zip Codes with the Highest Percentage of Population Employed in Community & Social Service in College Station

0.0%
25.0%
Zip Codes with the Highest Percentage of Population Employed in Community & Social Service  in College Station Map

Zip Codes with the Highest Percentage of Population Employed in Community & Social Service in College Station, TX

Zip Code % Employed vs State vs National
1.7784523.4%10.5%(+12.9)#5311.2%(+12.2)#1,203
2.7784018.4%10.5%(+7.93)#12311.2%(+7.22)#2,618
3.7784318.2%10.5%(+7.70)#13011.2%(+6.99)#2,715

Common Questions

What are the Top Zip Codes with the Highest Percentage of Population Employed in Community & Social Service in College Station, TX?
Top Zip Codes with the Highest Percentage of Population Employed in Community & Social Service in College Station, TX are:
#1
23.4%
#2
18.4%
#3
18.2%
What zip code has the Highest Percentage of Population Employed in Community & Social Service in College Station, TX?
77845 has the Highest Percentage of Population Employed in Community & Social Service in College Station, TX with 23.4%.
What is the Percentage of Population Employed in Community & Social Service in College Station, TX?
Percentage of Population Employed in Community & Social Service in College Station is 21.2%.
What is the Percentage of Population Employed in Community & Social Service in Texas?
Percentage of Population Employed in Community & Social Service in Texas is 10.5%.
What is the Percentage of Population Employed in Community & Social Service in the United States?
Percentage of Population Employed in Community & Social Service in the United States is 11.2%.