Zip Codes with the Highest Percentage of Population Employed in Community & Social Service in Magnolia, TX
RELATED REPORTS & OPTIONS
Community & Social Service
Magnolia
Compare Zip Codes
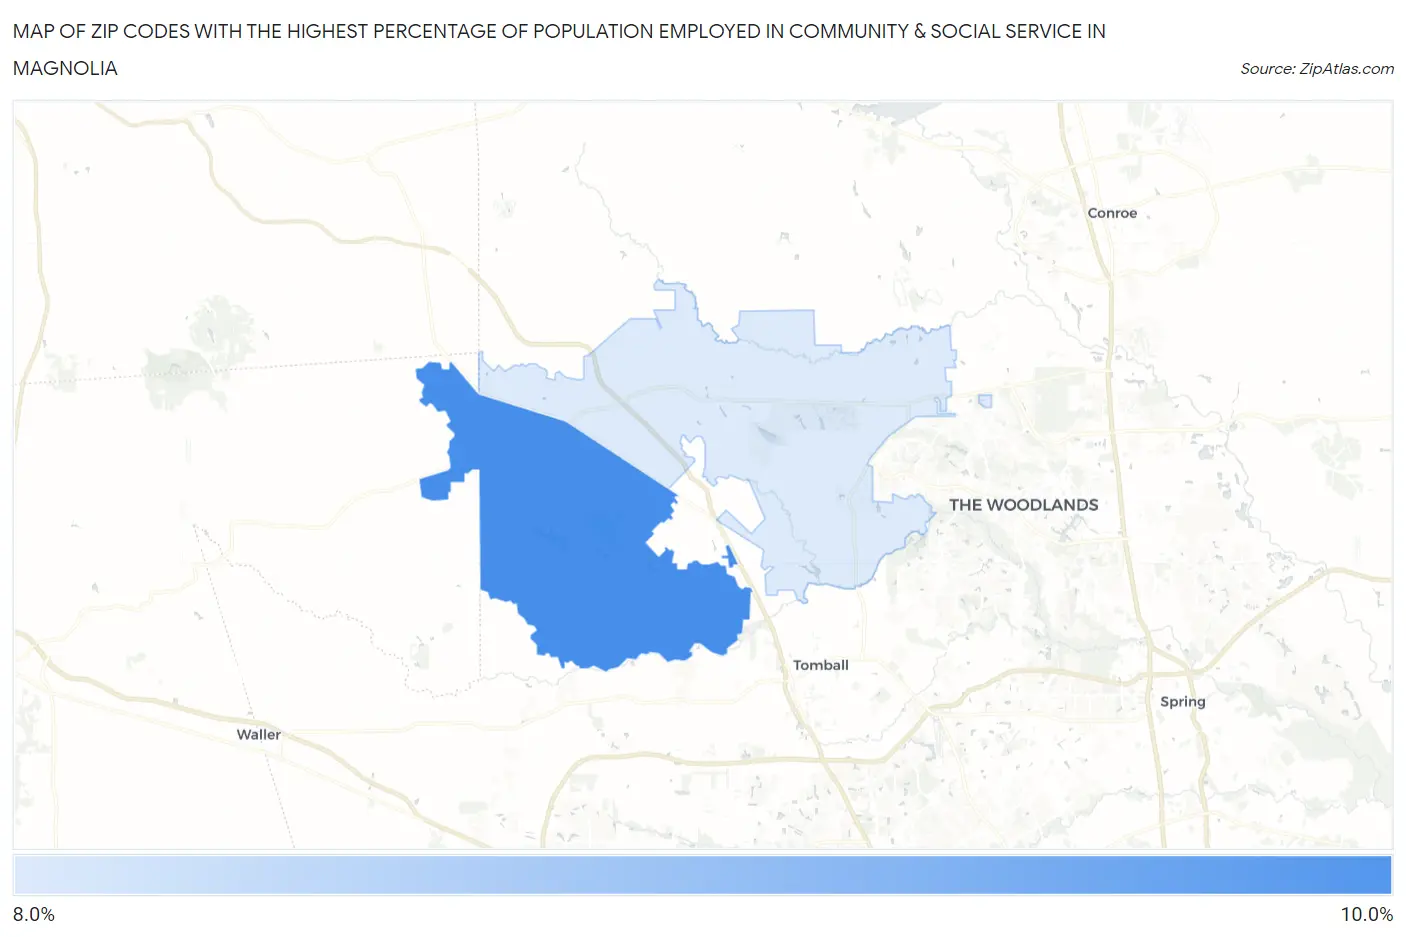
Map of Zip Codes with the Highest Percentage of Population Employed in Community & Social Service in Magnolia
8.6%
9.5%
Zip Codes with the Highest Percentage of Population Employed in Community & Social Service in Magnolia, TX
| Zip Code | % Employed | vs State | vs National | |
| 1. | 77355 | 9.5% | 10.5%(-0.981)#912 | 11.2%(-1.69)#15,367 |
| 2. | 77354 | 8.6% | 10.5%(-1.89)#1,062 | 11.2%(-2.60)#17,863 |
1
Common Questions
What are the Top Zip Codes with the Highest Percentage of Population Employed in Community & Social Service in Magnolia, TX?
Top Zip Codes with the Highest Percentage of Population Employed in Community & Social Service in Magnolia, TX are:
What zip code has the Highest Percentage of Population Employed in Community & Social Service in Magnolia, TX?
77355 has the Highest Percentage of Population Employed in Community & Social Service in Magnolia, TX with 9.5%.
What is the Percentage of Population Employed in Community & Social Service in Magnolia, TX?
Percentage of Population Employed in Community & Social Service in Magnolia is 7.2%.
What is the Percentage of Population Employed in Community & Social Service in Texas?
Percentage of Population Employed in Community & Social Service in Texas is 10.5%.
What is the Percentage of Population Employed in Community & Social Service in the United States?
Percentage of Population Employed in Community & Social Service in the United States is 11.2%.