Robstown, TX Map & Demographics
Robstown Map
Robstown Overview
$21,670
PER CAPITA INCOME
$56,947
AVG FAMILY INCOME
$35,417
AVG HOUSEHOLD INCOME
38.1%
WAGE / INCOME GAP [ % ]
61.9¢/ $1
WAGE / INCOME GAP [ $ ]
$9,167
FAMILY INCOME DEFICIT
0.51
INEQUALITY / GINI INDEX
10,246
TOTAL POPULATION
4,829
MALE POPULATION
5,417
FEMALE POPULATION
89.15
MALES / 100 FEMALES
112.18
FEMALES / 100 MALES
42.1
MEDIAN AGE
3.4
AVG FAMILY SIZE
2.7
AVG HOUSEHOLD SIZE
4,474
LABOR FORCE [ PEOPLE ]
53.5%
PERCENT IN LABOR FORCE
10.3%
UNEMPLOYMENT RATE
Robstown Zip Codes
Robstown Area Codes
Income in Robstown
Income Overview in Robstown
Per Capita Income in Robstown is $21,670, while median incomes of families and households are $56,947 and $35,417 respectively.
| Characteristic | Number | Measure |
| Per Capita Income | 10,246 | $21,670 |
| Median Family Income | 2,502 | $56,947 |
| Mean Family Income | 2,502 | $71,255 |
| Median Household Income | 3,766 | $35,417 |
| Mean Household Income | 3,766 | $56,346 |
| Income Deficit | 2,502 | $9,167 |
| Wage / Income Gap (%) | 10,246 | 38.08% |
| Wage / Income Gap ($) | 10,246 | 61.92¢ per $1 |
| Gini / Inequality Index | 10,246 | 0.51 |
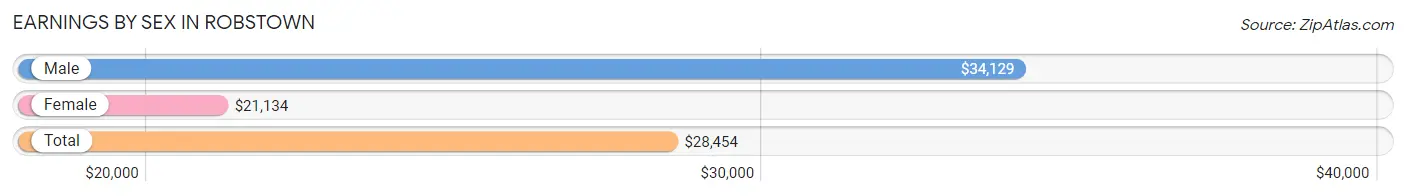
Earnings by Sex in Robstown
Average Earnings in Robstown are $28,454, $34,129 for men and $21,134 for women, a difference of 38.1%.
| Sex | Number | Average Earnings |
| Male | 2,454 (53.8%) | $34,129 |
| Female | 2,104 (46.2%) | $21,134 |
| Total | 4,558 (100.0%) | $28,454 |
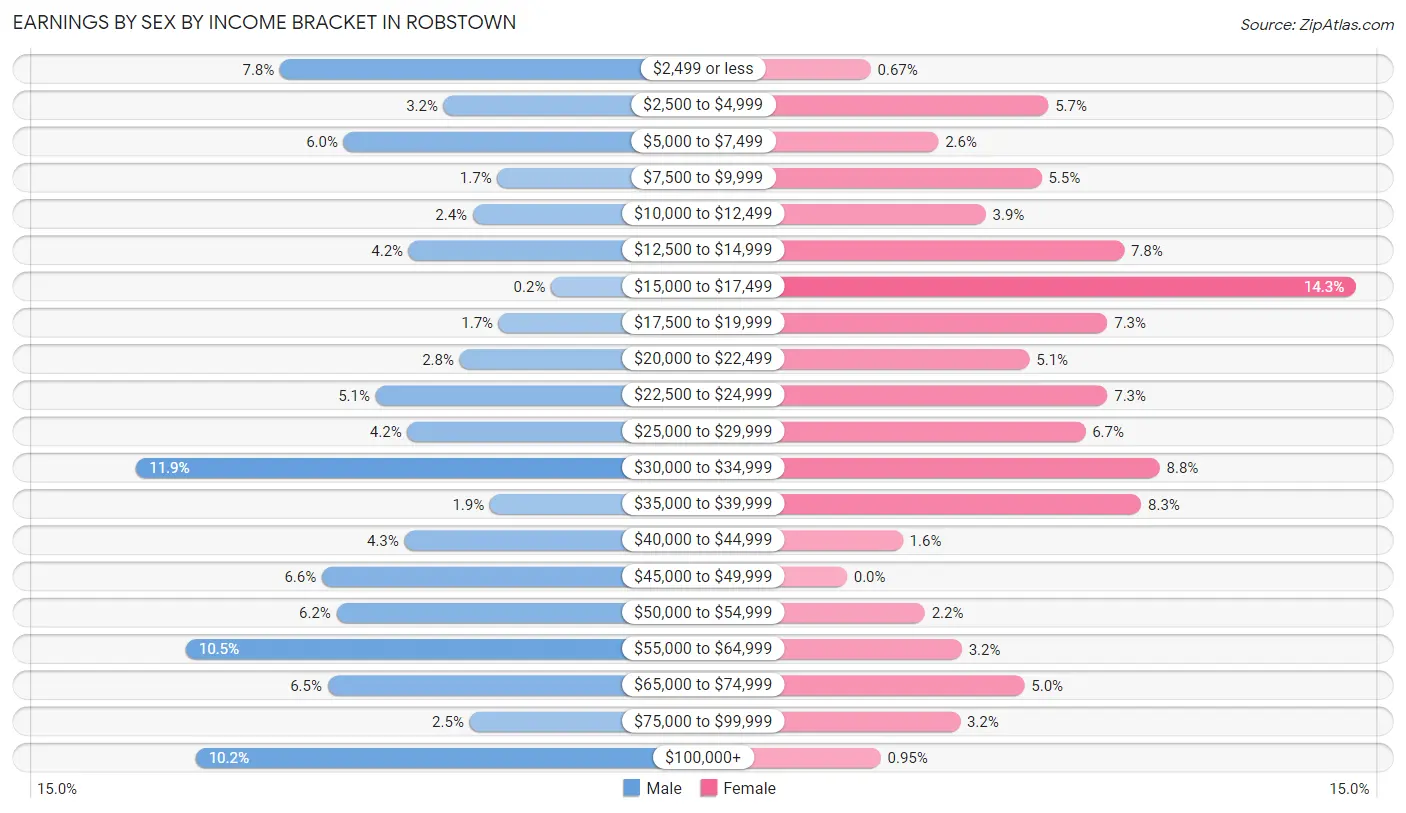
Earnings by Sex by Income Bracket in Robstown
The most common earnings brackets in Robstown are $30,000 to $34,999 for men (291 | 11.9%) and $15,000 to $17,499 for women (301 | 14.3%).
| Income | Male | Female |
| $2,499 or less | 192 (7.8%) | 14 (0.7%) |
| $2,500 to $4,999 | 79 (3.2%) | 119 (5.7%) |
| $5,000 to $7,499 | 148 (6.0%) | 54 (2.6%) |
| $7,500 to $9,999 | 42 (1.7%) | 115 (5.5%) |
| $10,000 to $12,499 | 59 (2.4%) | 82 (3.9%) |
| $12,500 to $14,999 | 103 (4.2%) | 164 (7.8%) |
| $15,000 to $17,499 | 5 (0.2%) | 301 (14.3%) |
| $17,500 to $19,999 | 41 (1.7%) | 154 (7.3%) |
| $20,000 to $22,499 | 68 (2.8%) | 108 (5.1%) |
| $22,500 to $24,999 | 126 (5.1%) | 154 (7.3%) |
| $25,000 to $29,999 | 104 (4.2%) | 141 (6.7%) |
| $30,000 to $34,999 | 291 (11.9%) | 185 (8.8%) |
| $35,000 to $39,999 | 47 (1.9%) | 174 (8.3%) |
| $40,000 to $44,999 | 106 (4.3%) | 33 (1.6%) |
| $45,000 to $49,999 | 163 (6.6%) | 0 (0.0%) |
| $50,000 to $54,999 | 153 (6.2%) | 46 (2.2%) |
| $55,000 to $64,999 | 257 (10.5%) | 68 (3.2%) |
| $65,000 to $74,999 | 159 (6.5%) | 105 (5.0%) |
| $75,000 to $99,999 | 61 (2.5%) | 67 (3.2%) |
| $100,000+ | 250 (10.2%) | 20 (0.9%) |
| Total | 2,454 (100.0%) | 2,104 (100.0%) |
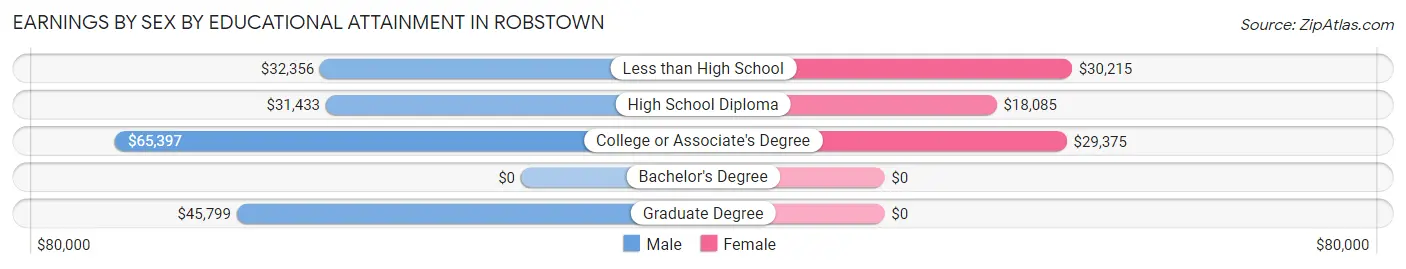
Earnings by Sex by Educational Attainment in Robstown
Average earnings in Robstown are $40,342 for men and $22,597 for women, a difference of 44.0%. Men with an educational attainment of college or associate's degree enjoy the highest average annual earnings of $65,397, while those with high school diploma education earn the least with $31,433. Women with an educational attainment of less than high school earn the most with the average annual earnings of $30,215, while those with high school diploma education have the smallest earnings of $18,085.
| Educational Attainment | Male Income | Female Income |
| Less than High School | $32,356 | $30,215 |
| High School Diploma | $31,433 | $18,085 |
| College or Associate's Degree | $65,397 | $29,375 |
| Bachelor's Degree | - | - |
| Graduate Degree | $45,799 | $0 |
| Total | $40,342 | $22,597 |
Family Income in Robstown
Family Income Brackets in Robstown
According to the Robstown family income data, there are 558 families falling into the $50,000 to $74,999 income range, which is the most common income bracket and makes up 22.3% of all families. Conversely, the $150,000 to $199,999 income bracket is the least frequent group with only 13 families (0.5%) belonging to this category.
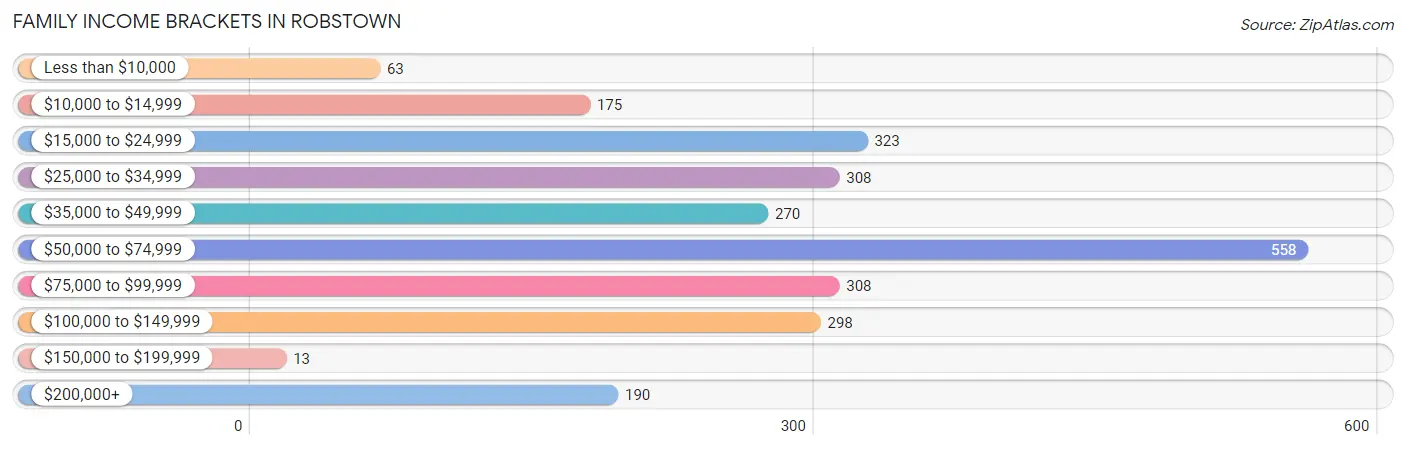
| Income Bracket | # Families | % Families |
| Less than $10,000 | 63 | 2.5% |
| $10,000 to $14,999 | 175 | 7.0% |
| $15,000 to $24,999 | 323 | 12.9% |
| $25,000 to $34,999 | 308 | 12.3% |
| $35,000 to $49,999 | 270 | 10.8% |
| $50,000 to $74,999 | 558 | 22.3% |
| $75,000 to $99,999 | 308 | 12.3% |
| $100,000 to $149,999 | 298 | 11.9% |
| $150,000 to $199,999 | 13 | 0.5% |
| $200,000+ | 190 | 7.6% |
Family Income by Famaliy Size in Robstown
7+ person families (184 | 7.3%) account for the highest median family income in Robstown with $222,527 per family, while 7+ person families (184 | 7.3%) have the highest median income of $31,790 per family member.
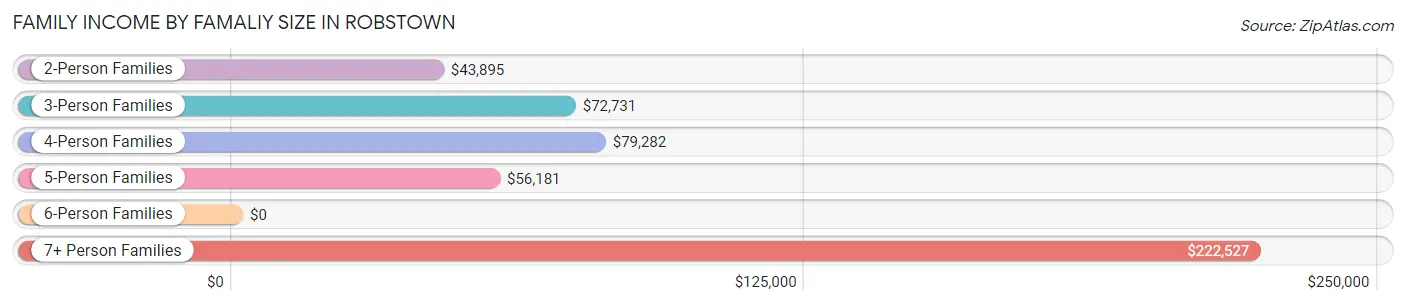
| Income Bracket | # Families | Median Income |
| 2-Person Families | 1,058 (42.3%) | $43,895 |
| 3-Person Families | 631 (25.2%) | $72,731 |
| 4-Person Families | 441 (17.6%) | $79,282 |
| 5-Person Families | 53 (2.1%) | $56,181 |
| 6-Person Families | 135 (5.4%) | $0 |
| 7+ Person Families | 184 (7.3%) | $222,527 |
| Total | 2,502 (100.0%) | $56,947 |
Family Income by Number of Earners in Robstown
The median family income in Robstown is $56,947, with families comprising 3+ earners (374) having the highest median family income of $116,042, while families with no earners (401) have the lowest median family income of $20,727, accounting for 14.9% and 16.0% of families, respectively.
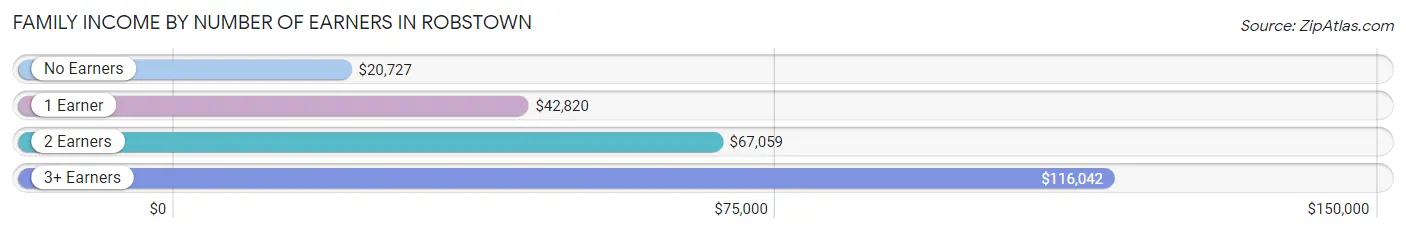
| Number of Earners | # Families | Median Income |
| No Earners | 401 (16.0%) | $20,727 |
| 1 Earner | 1,093 (43.7%) | $42,820 |
| 2 Earners | 634 (25.3%) | $67,059 |
| 3+ Earners | 374 (14.9%) | $116,042 |
| Total | 2,502 (100.0%) | $56,947 |
Household Income in Robstown
Household Income Brackets in Robstown
With 614 households falling in the category, the $50,000 to $74,999 income range is the most frequent in Robstown, accounting for 16.3% of all households. In contrast, only 11 households (0.3%) fall into the $150,000 to $199,999 income bracket, making it the least populous group.
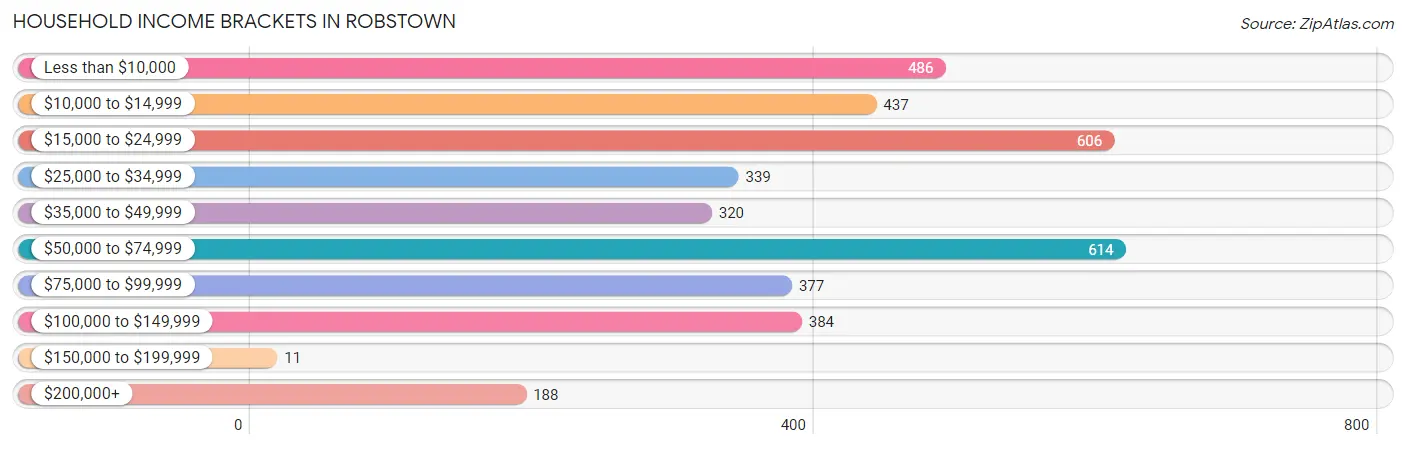
| Income Bracket | # Households | % Households |
| Less than $10,000 | 486 | 12.9% |
| $10,000 to $14,999 | 437 | 11.6% |
| $15,000 to $24,999 | 606 | 16.1% |
| $25,000 to $34,999 | 339 | 9.0% |
| $35,000 to $49,999 | 320 | 8.5% |
| $50,000 to $74,999 | 614 | 16.3% |
| $75,000 to $99,999 | 377 | 10.0% |
| $100,000 to $149,999 | 384 | 10.2% |
| $150,000 to $199,999 | 11 | 0.3% |
| $200,000+ | 188 | 5.0% |
Household Income by Householder Age in Robstown
The median household income in Robstown is $35,417, with the highest median household income of $72,894 found in the 25 to 44 years age bracket for the primary householder. A total of 835 households (22.2%) fall into this category. Meanwhile, the 15 to 24 years age bracket for the primary householder has the lowest median household income of $0, with 74 households (2.0%) in this group.
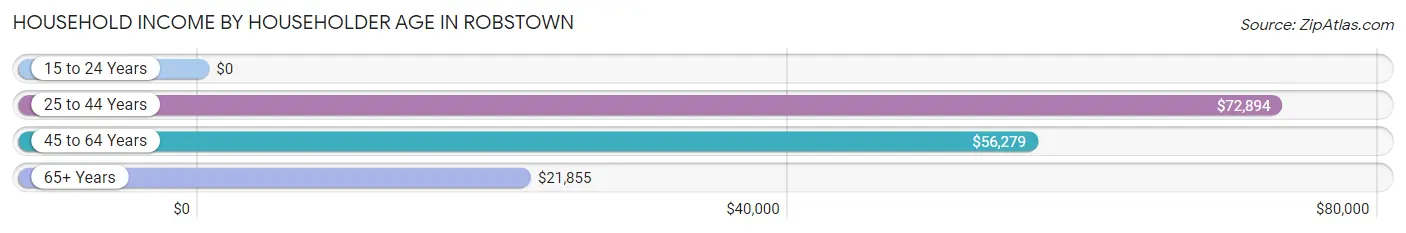
| Income Bracket | # Households | Median Income |
| 15 to 24 Years | 74 (2.0%) | $0 |
| 25 to 44 Years | 835 (22.2%) | $72,894 |
| 45 to 64 Years | 1,022 (27.1%) | $56,279 |
| 65+ Years | 1,835 (48.7%) | $21,855 |
| Total | 3,766 (100.0%) | $35,417 |
Poverty in Robstown
Income Below Poverty by Sex and Age in Robstown
With 26.4% poverty level for males and 34.1% for females among the residents of Robstown, 12 to 14 year old males and 25 to 34 year old females are the most vulnerable to poverty, with 45 males (100.0%) and 134 females (55.1%) in their respective age groups living below the poverty level.
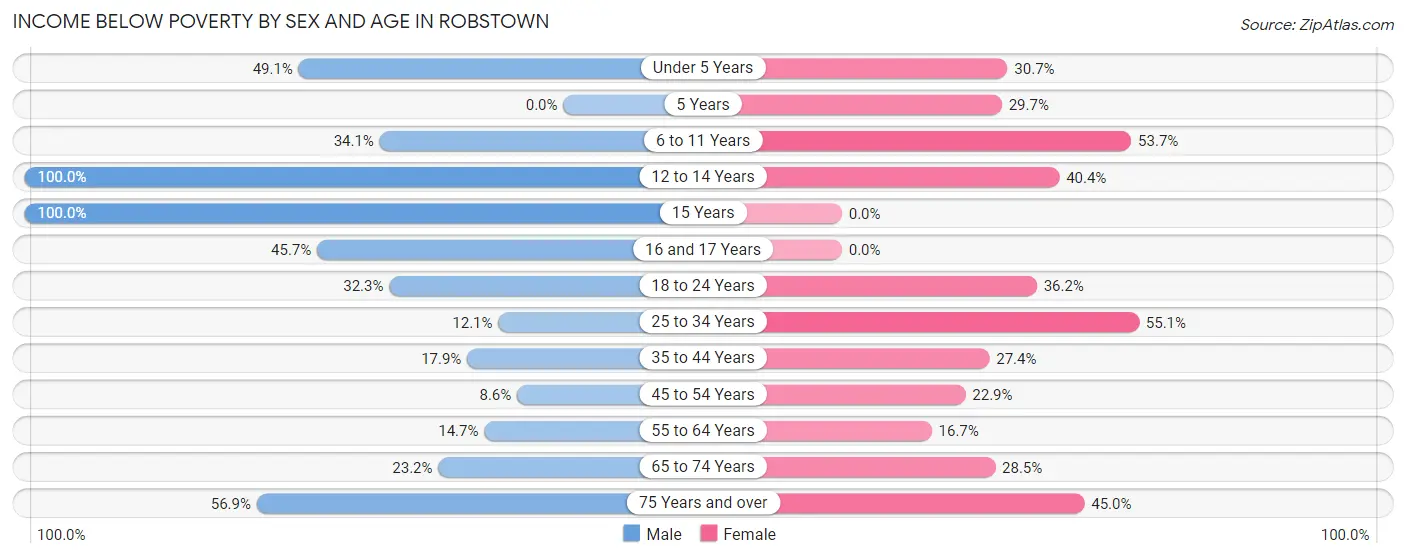
| Age Bracket | Male | Female |
| Under 5 Years | 167 (49.1%) | 87 (30.7%) |
| 5 Years | 0 (0.0%) | 19 (29.7%) |
| 6 to 11 Years | 180 (34.1%) | 188 (53.7%) |
| 12 to 14 Years | 45 (100.0%) | 69 (40.4%) |
| 15 Years | 4 (100.0%) | 0 (0.0%) |
| 16 and 17 Years | 176 (45.7%) | 0 (0.0%) |
| 18 to 24 Years | 179 (32.3%) | 212 (36.2%) |
| 25 to 34 Years | 79 (12.1%) | 134 (55.1%) |
| 35 to 44 Years | 98 (17.8%) | 201 (27.4%) |
| 45 to 54 Years | 49 (8.6%) | 92 (22.9%) |
| 55 to 64 Years | 70 (14.7%) | 110 (16.7%) |
| 65 to 74 Years | 119 (23.2%) | 181 (28.5%) |
| 75 Years and over | 99 (56.9%) | 514 (45.0%) |
| Total | 1,265 (26.4%) | 1,807 (34.1%) |
Income Above Poverty by Sex and Age in Robstown
According to the poverty statistics in Robstown, males aged 45 to 54 years and females aged 15 years are the age groups that are most secure financially, with 91.4% of males and 100.0% of females in these age groups living above the poverty line.
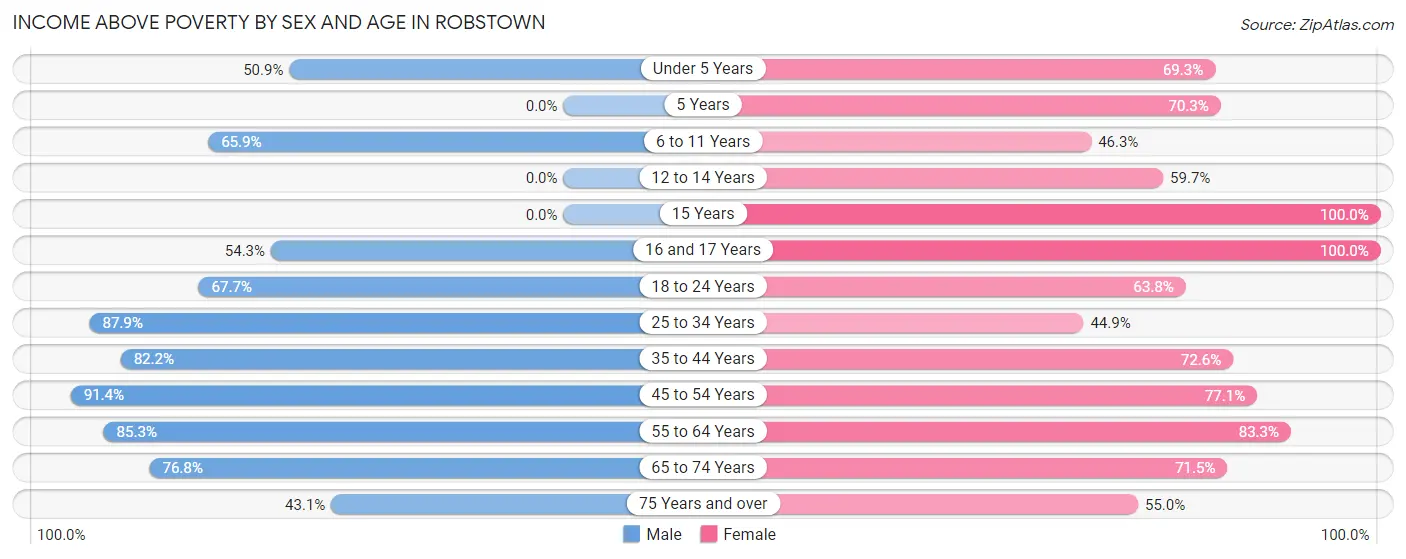
| Age Bracket | Male | Female |
| Under 5 Years | 173 (50.9%) | 196 (69.3%) |
| 5 Years | 0 (0.0%) | 45 (70.3%) |
| 6 to 11 Years | 348 (65.9%) | 162 (46.3%) |
| 12 to 14 Years | 0 (0.0%) | 102 (59.7%) |
| 15 Years | 0 (0.0%) | 18 (100.0%) |
| 16 and 17 Years | 209 (54.3%) | 19 (100.0%) |
| 18 to 24 Years | 375 (67.7%) | 374 (63.8%) |
| 25 to 34 Years | 576 (87.9%) | 109 (44.9%) |
| 35 to 44 Years | 451 (82.2%) | 533 (72.6%) |
| 45 to 54 Years | 522 (91.4%) | 309 (77.1%) |
| 55 to 64 Years | 407 (85.3%) | 550 (83.3%) |
| 65 to 74 Years | 394 (76.8%) | 455 (71.5%) |
| 75 Years and over | 75 (43.1%) | 628 (55.0%) |
| Total | 3,530 (73.6%) | 3,500 (65.9%) |
Income Below Poverty Among Married-Couple Families in Robstown
The poverty statistics for married-couple families in Robstown show that 13.6% or 154 of the total 1,132 families live below the poverty line. Families with 3 or 4 children have the highest poverty rate of 25.9%, comprising of 52 families. On the other hand, families with no children have the lowest poverty rate of 10.5%, which includes 66 families.
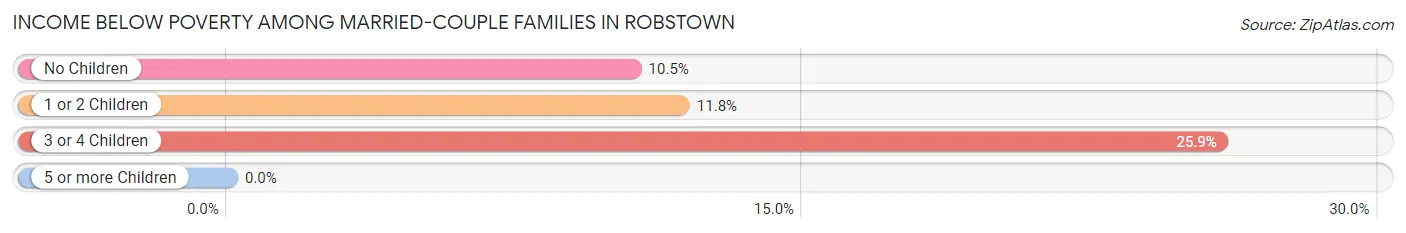
| Children | Above Poverty | Below Poverty |
| No Children | 560 (89.5%) | 66 (10.5%) |
| 1 or 2 Children | 269 (88.2%) | 36 (11.8%) |
| 3 or 4 Children | 149 (74.1%) | 52 (25.9%) |
| 5 or more Children | 0 (0.0%) | 0 (0.0%) |
| Total | 978 (86.4%) | 154 (13.6%) |
Income Below Poverty Among Single-Parent Households in Robstown
According to the poverty data in Robstown, 44.3% or 86 single-father households and 25.9% or 304 single-mother households are living below the poverty line. Among single-father households, those with no children have the highest poverty rate, with 86 households (81.9%) experiencing poverty. Likewise, among single-mother households, those with 3 or 4 children have the highest poverty rate, with 154 households (100.0%) falling below the poverty line.
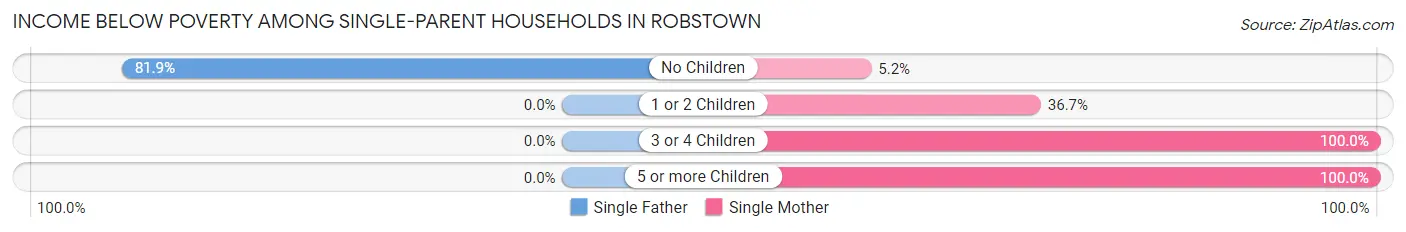
| Children | Single Father | Single Mother |
| No Children | 86 (81.9%) | 39 (5.2%) |
| 1 or 2 Children | 0 (0.0%) | 90 (36.7%) |
| 3 or 4 Children | 0 (0.0%) | 154 (100.0%) |
| 5 or more Children | 0 (0.0%) | 21 (100.0%) |
| Total | 86 (44.3%) | 304 (25.9%) |
Income Below Poverty Among Married-Couple vs Single-Parent Households in Robstown
The poverty data for Robstown shows that 154 of the married-couple family households (13.6%) and 390 of the single-parent households (28.5%) are living below the poverty level. Within the married-couple family households, those with 3 or 4 children have the highest poverty rate, with 52 households (25.9%) falling below the poverty line. Among the single-parent households, those with 3 or 4 children have the highest poverty rate, with 154 household (100.0%) living below poverty.
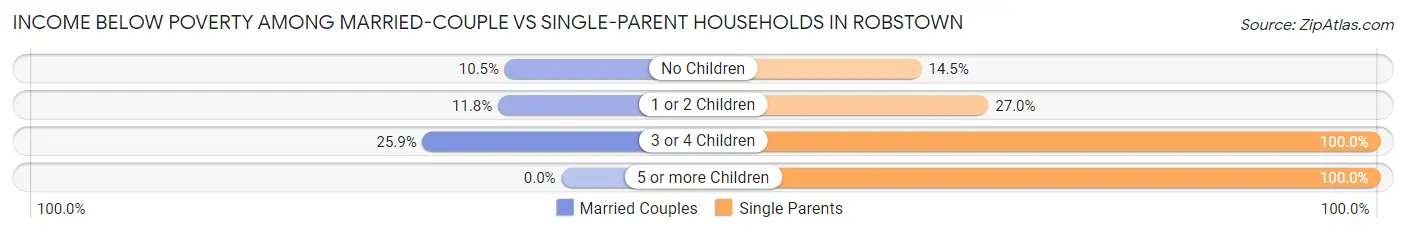
| Children | Married-Couple Families | Single-Parent Households |
| No Children | 66 (10.5%) | 125 (14.5%) |
| 1 or 2 Children | 36 (11.8%) | 90 (27.0%) |
| 3 or 4 Children | 52 (25.9%) | 154 (100.0%) |
| 5 or more Children | 0 (0.0%) | 21 (100.0%) |
| Total | 154 (13.6%) | 390 (28.5%) |
Race in Robstown
The most populous races in Robstown are Hispanic or Latino (9,784 | 95.5%), White / Caucasian (5,836 | 57.0%), and Two or more Races (3,542 | 34.6%).
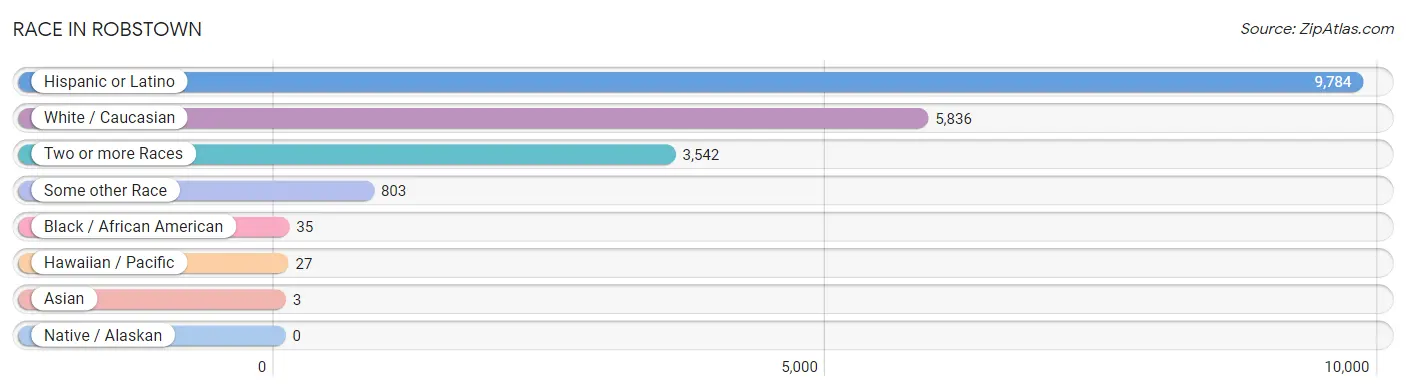
| Race | # Population | % Population |
| Asian | 3 | 0.0% |
| Black / African American | 35 | 0.3% |
| Hawaiian / Pacific | 27 | 0.3% |
| Hispanic or Latino | 9,784 | 95.5% |
| Native / Alaskan | 0 | 0.0% |
| White / Caucasian | 5,836 | 57.0% |
| Two or more Races | 3,542 | 34.6% |
| Some other Race | 803 | 7.8% |
| Total | 10,246 | 100.0% |
Ancestry in Robstown
The most populous ancestries reported in Robstown are Mexican (9,374 | 91.5%), Irish (237 | 2.3%), American (147 | 1.4%), German (118 | 1.1%), and English (103 | 1.0%), together accounting for 97.4% of all Robstown residents.
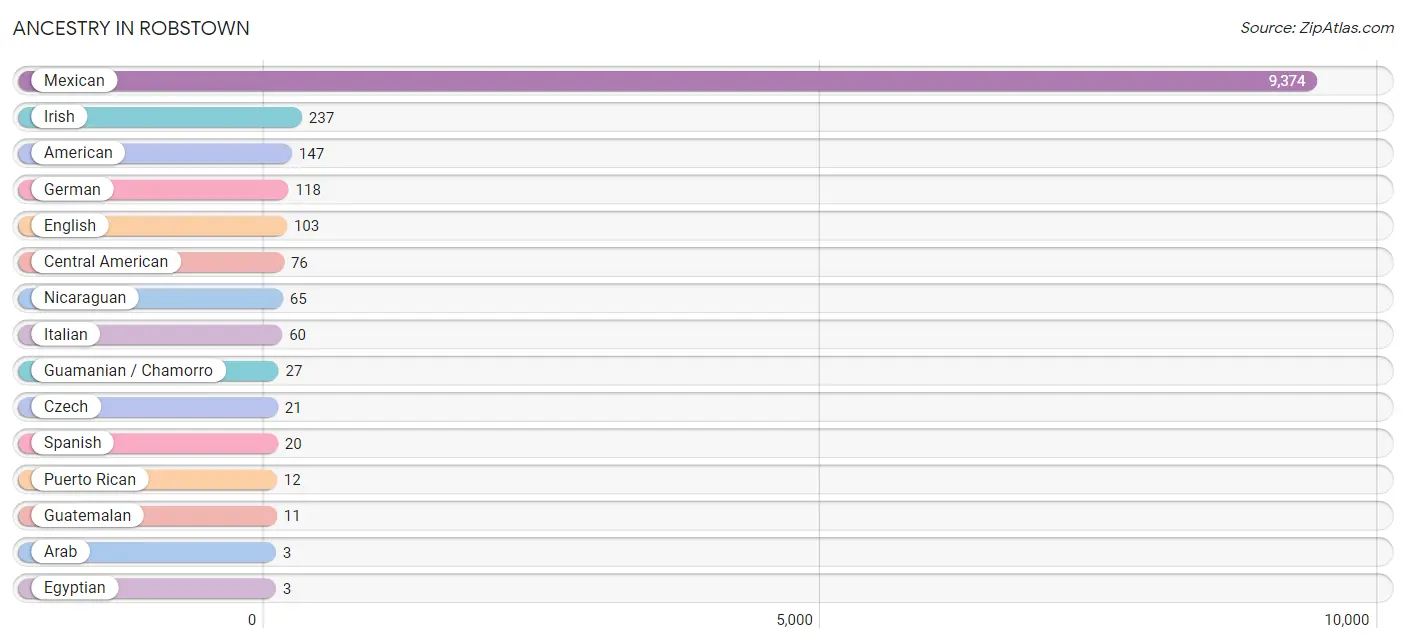
| Ancestry | # Population | % Population |
| American | 147 | 1.4% |
| Arab | 3 | 0.0% |
| Central American | 76 | 0.7% |
| Czech | 21 | 0.2% |
| Egyptian | 3 | 0.0% |
| English | 103 | 1.0% |
| German | 118 | 1.1% |
| Guamanian / Chamorro | 27 | 0.3% |
| Guatemalan | 11 | 0.1% |
| Irish | 237 | 2.3% |
| Italian | 60 | 0.6% |
| Mexican | 9,374 | 91.5% |
| Nicaraguan | 65 | 0.6% |
| Puerto Rican | 12 | 0.1% |
| Spanish | 20 | 0.2% |
| Turkish | 2 | 0.0% | View All 16 Rows |
Immigrants in Robstown
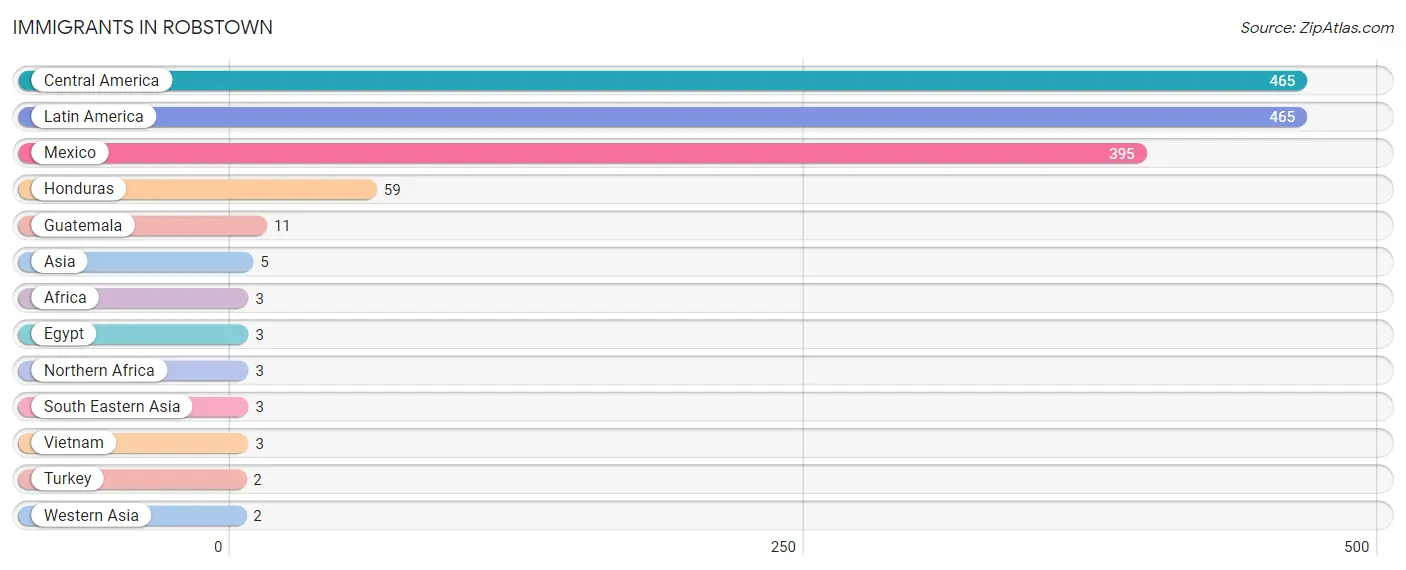
The most numerous immigrant groups reported in Robstown came from Central America (465 | 4.5%), Latin America (465 | 4.5%), Mexico (395 | 3.9%), Honduras (59 | 0.6%), and Guatemala (11 | 0.1%), together accounting for 13.6% of all Robstown residents.
| Immigration Origin | # Population | % Population |
| Africa | 3 | 0.0% |
| Asia | 5 | 0.1% |
| Central America | 465 | 4.5% |
| Egypt | 3 | 0.0% |
| Guatemala | 11 | 0.1% |
| Honduras | 59 | 0.6% |
| Latin America | 465 | 4.5% |
| Mexico | 395 | 3.9% |
| Northern Africa | 3 | 0.0% |
| South Eastern Asia | 3 | 0.0% |
| Turkey | 2 | 0.0% |
| Vietnam | 3 | 0.0% |
| Western Asia | 2 | 0.0% | View All 13 Rows |
Sex and Age in Robstown
Sex and Age in Robstown
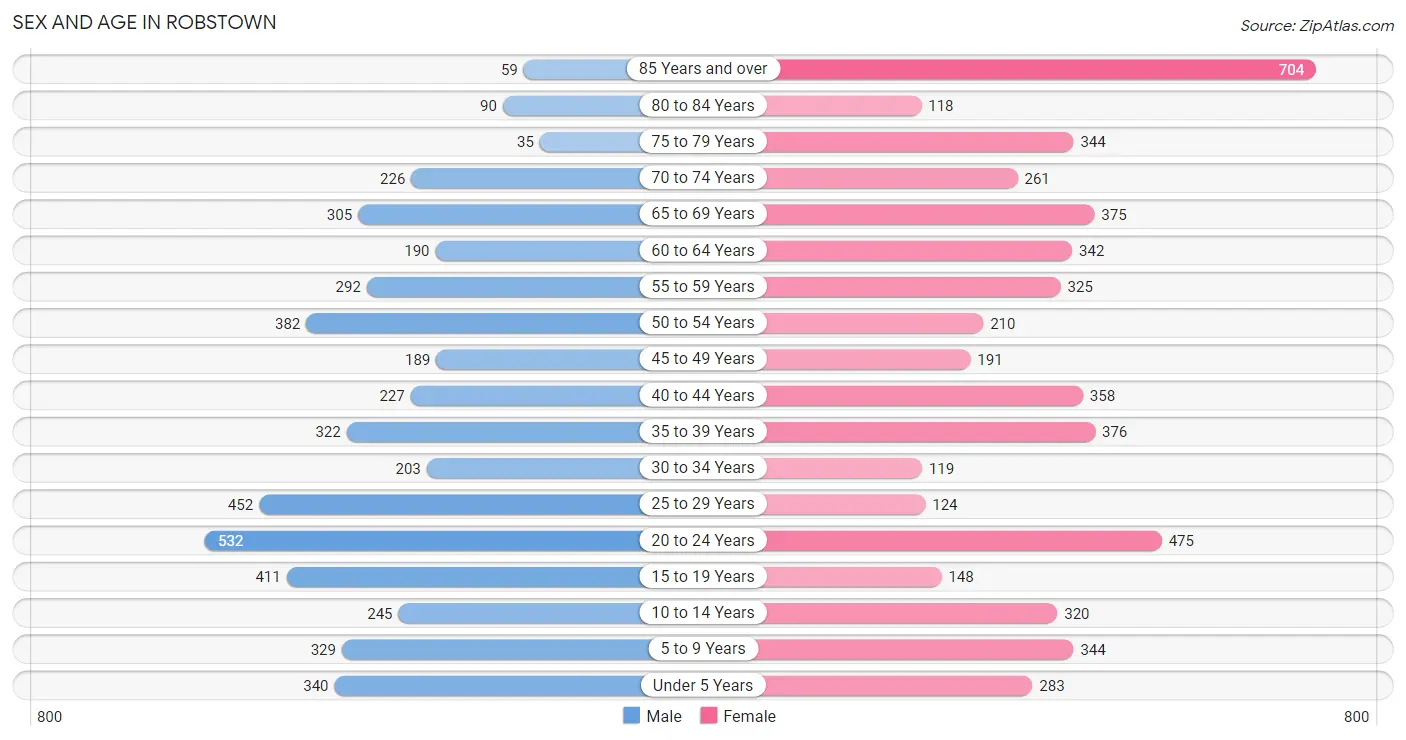
The most populous age groups in Robstown are 20 to 24 Years (532 | 11.0%) for men and 85 Years and over (704 | 13.0%) for women.
| Age Bracket | Male | Female |
| Under 5 Years | 340 (7.0%) | 283 (5.2%) |
| 5 to 9 Years | 329 (6.8%) | 344 (6.4%) |
| 10 to 14 Years | 245 (5.1%) | 320 (5.9%) |
| 15 to 19 Years | 411 (8.5%) | 148 (2.7%) |
| 20 to 24 Years | 532 (11.0%) | 475 (8.8%) |
| 25 to 29 Years | 452 (9.4%) | 124 (2.3%) |
| 30 to 34 Years | 203 (4.2%) | 119 (2.2%) |
| 35 to 39 Years | 322 (6.7%) | 376 (6.9%) |
| 40 to 44 Years | 227 (4.7%) | 358 (6.6%) |
| 45 to 49 Years | 189 (3.9%) | 191 (3.5%) |
| 50 to 54 Years | 382 (7.9%) | 210 (3.9%) |
| 55 to 59 Years | 292 (6.0%) | 325 (6.0%) |
| 60 to 64 Years | 190 (3.9%) | 342 (6.3%) |
| 65 to 69 Years | 305 (6.3%) | 375 (6.9%) |
| 70 to 74 Years | 226 (4.7%) | 261 (4.8%) |
| 75 to 79 Years | 35 (0.7%) | 344 (6.4%) |
| 80 to 84 Years | 90 (1.9%) | 118 (2.2%) |
| 85 Years and over | 59 (1.2%) | 704 (13.0%) |
| Total | 4,829 (100.0%) | 5,417 (100.0%) |
Families and Households in Robstown
Median Family Size in Robstown
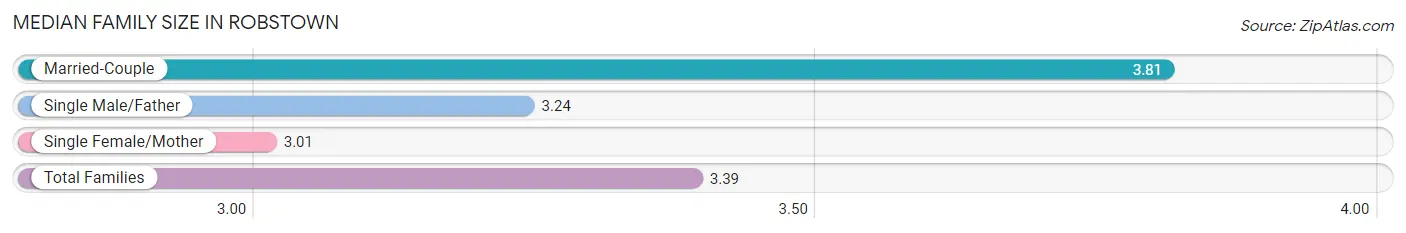
The median family size in Robstown is 3.39 persons per family, with married-couple families (1,132 | 45.2%) accounting for the largest median family size of 3.81 persons per family. On the other hand, single female/mother families (1,176 | 47.0%) represent the smallest median family size with 3.01 persons per family.
| Family Type | # Families | Family Size |
| Married-Couple | 1,132 (45.2%) | 3.81 |
| Single Male/Father | 194 (7.7%) | 3.24 |
| Single Female/Mother | 1,176 (47.0%) | 3.01 |
| Total Families | 2,502 (100.0%) | 3.39 |
Median Household Size in Robstown
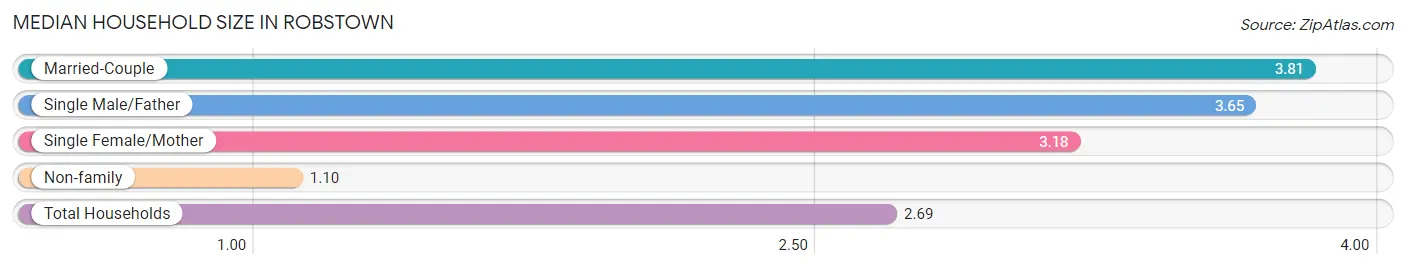
The median household size in Robstown is 2.69 persons per household, with married-couple households (1,132 | 30.1%) accounting for the largest median household size of 3.81 persons per household. non-family households (1,264 | 33.6%) represent the smallest median household size with 1.10 persons per household.
| Household Type | # Households | Household Size |
| Married-Couple | 1,132 (30.1%) | 3.81 |
| Single Male/Father | 194 (5.1%) | 3.65 |
| Single Female/Mother | 1,176 (31.2%) | 3.18 |
| Non-family | 1,264 (33.6%) | 1.10 |
| Total Households | 3,766 (100.0%) | 2.69 |
Household Size by Marriage Status in Robstown
Out of a total of 3,766 households in Robstown, 2,502 (66.4%) are family households, while 1,264 (33.6%) are nonfamily households. The most numerous type of family households are 2-person households, comprising 995, and the most common type of nonfamily households are 1-person households, comprising 1,157.
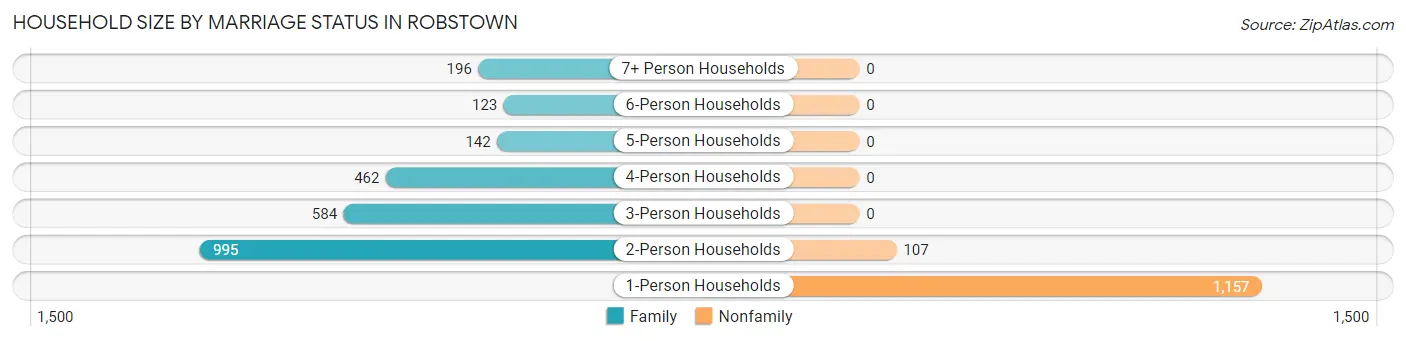
| Household Size | Family Households | Nonfamily Households |
| 1-Person Households | - | 1,157 (30.7%) |
| 2-Person Households | 995 (26.4%) | 107 (2.8%) |
| 3-Person Households | 584 (15.5%) | 0 (0.0%) |
| 4-Person Households | 462 (12.3%) | 0 (0.0%) |
| 5-Person Households | 142 (3.8%) | 0 (0.0%) |
| 6-Person Households | 123 (3.3%) | 0 (0.0%) |
| 7+ Person Households | 196 (5.2%) | 0 (0.0%) |
| Total | 2,502 (66.4%) | 1,264 (33.6%) |
Female Fertility in Robstown
Fertility by Age in Robstown
Average fertility rate in Robstown is 60.0 births per 1,000 women. Women in the age bracket of 20 to 34 years have the highest fertility rate with 130.0 births per 1,000 women. Women in the age bracket of 20 to 34 years acount for 85.3% of all women with births.
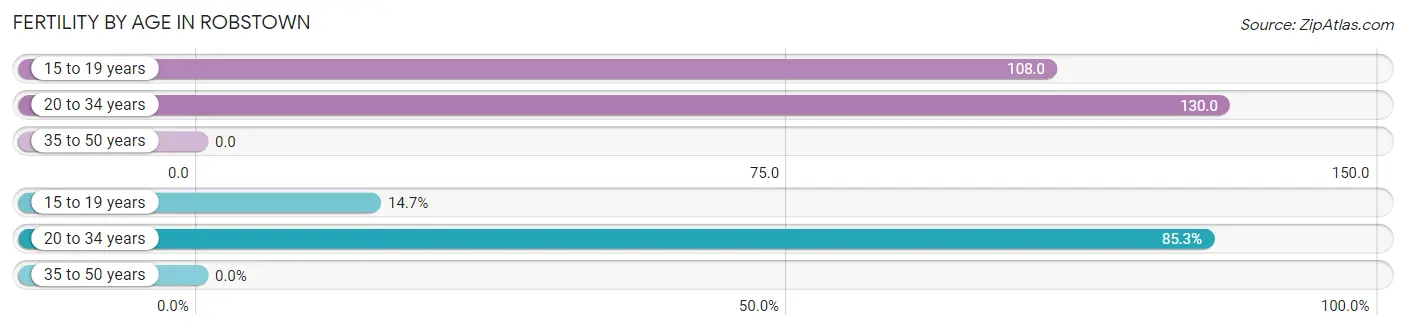
| Age Bracket | Women with Births | Births / 1,000 Women |
| 15 to 19 years | 16 (14.7%) | 108.0 |
| 20 to 34 years | 93 (85.3%) | 130.0 |
| 35 to 50 years | 0 (0.0%) | 0.0 |
| Total | 109 (100.0%) | 60.0 |
Fertility by Age by Marriage Status in Robstown
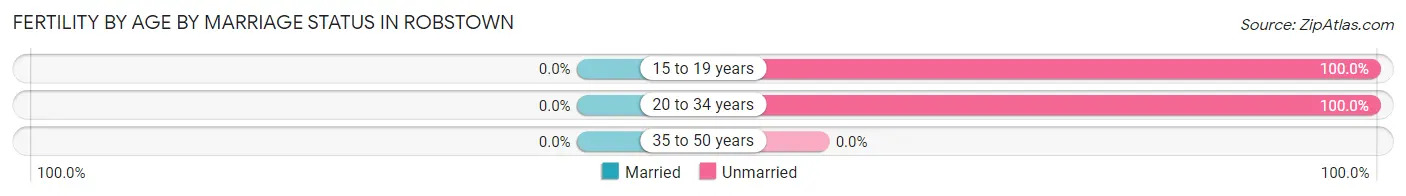
| Age Bracket | Married | Unmarried |
| 15 to 19 years | 0 (0.0%) | 16 (100.0%) |
| 20 to 34 years | 0 (0.0%) | 93 (100.0%) |
| 35 to 50 years | 0 (0.0%) | 0 (0.0%) |
| Total | 0 (0.0%) | 109 (100.0%) |
Fertility by Education in Robstown
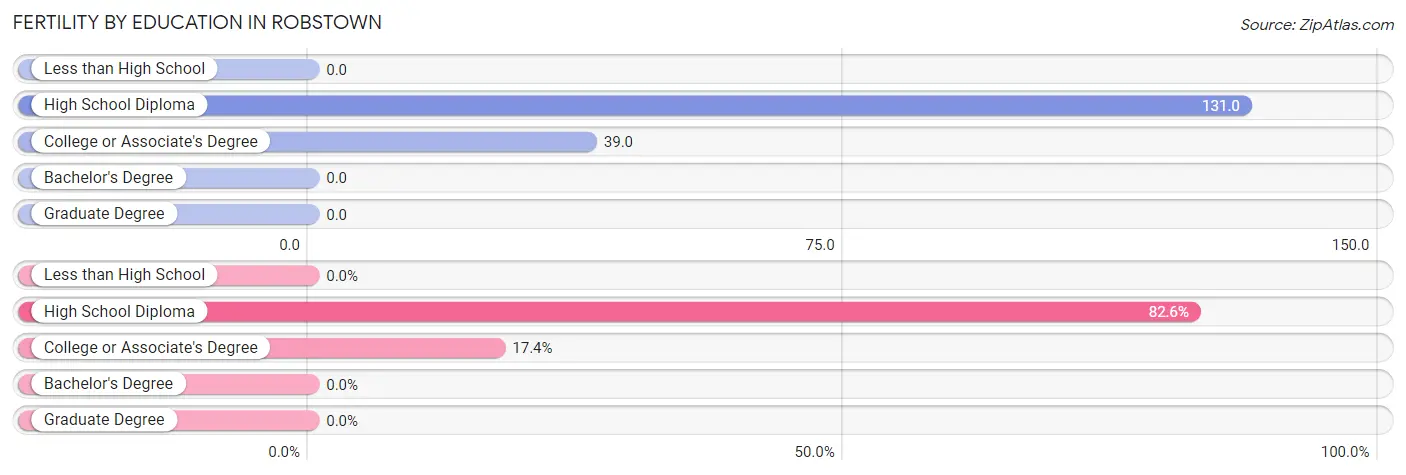
| Educational Attainment | Women with Births | Births / 1,000 Women |
| Less than High School | 0 (0.0%) | 0.0 |
| High School Diploma | 90 (82.6%) | 131.0 |
| College or Associate's Degree | 19 (17.4%) | 39.0 |
| Bachelor's Degree | 0 (0.0%) | 0.0 |
| Graduate Degree | 0 (0.0%) | 0.0 |
| Total | 109 (100.0%) | 60.0 |
Fertility by Education by Marriage Status in Robstown
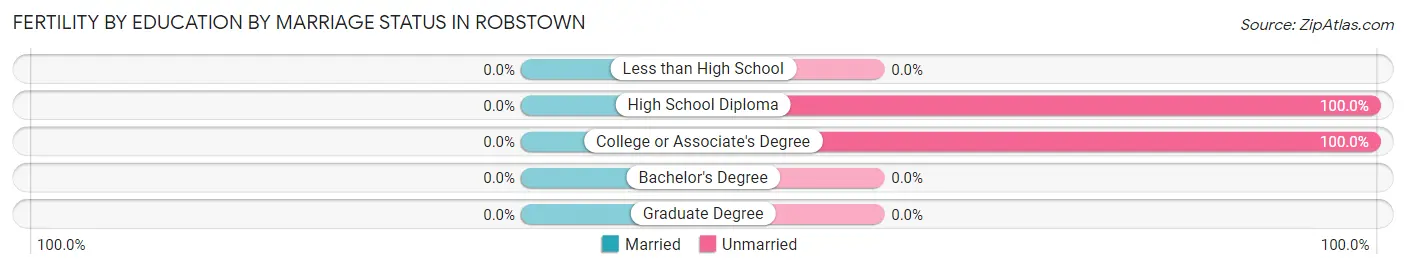
| Educational Attainment | Married | Unmarried |
| Less than High School | 0 (0.0%) | 0 (0.0%) |
| High School Diploma | 0 (0.0%) | 90 (100.0%) |
| College or Associate's Degree | 0 (0.0%) | 19 (100.0%) |
| Bachelor's Degree | 0 (0.0%) | 0 (0.0%) |
| Graduate Degree | 0 (0.0%) | 0 (0.0%) |
| Total | 0 (0.0%) | 109 (100.0%) |
Employment Characteristics in Robstown
Employment by Class of Employer in Robstown
Among the 3,960 employed individuals in Robstown, private company employees (2,714 | 68.5%), local government employees (753 | 19.0%), and state government employees (209 | 5.3%) make up the most common classes of employment.
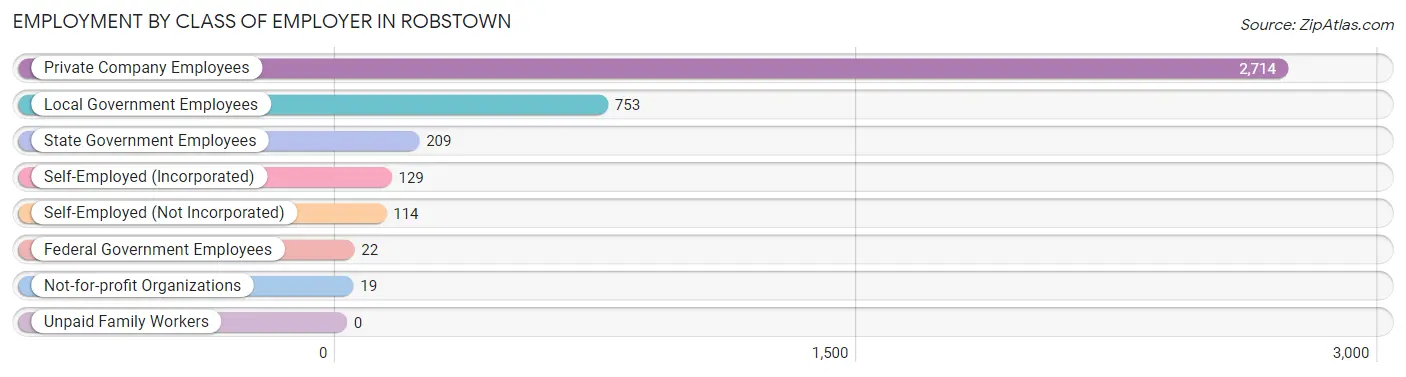
| Employer Class | # Employees | % Employees |
| Private Company Employees | 2,714 | 68.5% |
| Self-Employed (Incorporated) | 129 | 3.3% |
| Self-Employed (Not Incorporated) | 114 | 2.9% |
| Not-for-profit Organizations | 19 | 0.5% |
| Local Government Employees | 753 | 19.0% |
| State Government Employees | 209 | 5.3% |
| Federal Government Employees | 22 | 0.6% |
| Unpaid Family Workers | 0 | 0.0% |
| Total | 3,960 | 100.0% |
Employment Status by Age in Robstown
According to the labor force statistics for Robstown, out of the total population over 16 years of age (8,363), 53.5% or 4,474 individuals are in the labor force, with 10.3% or 461 of them unemployed. The age group with the highest labor force participation rate is 30 to 34 years, with 92.5% or 298 individuals in the labor force. Within the labor force, the 16 to 19 years age range has the highest percentage of unemployed individuals, with 35.3% or 12 of them being unemployed.
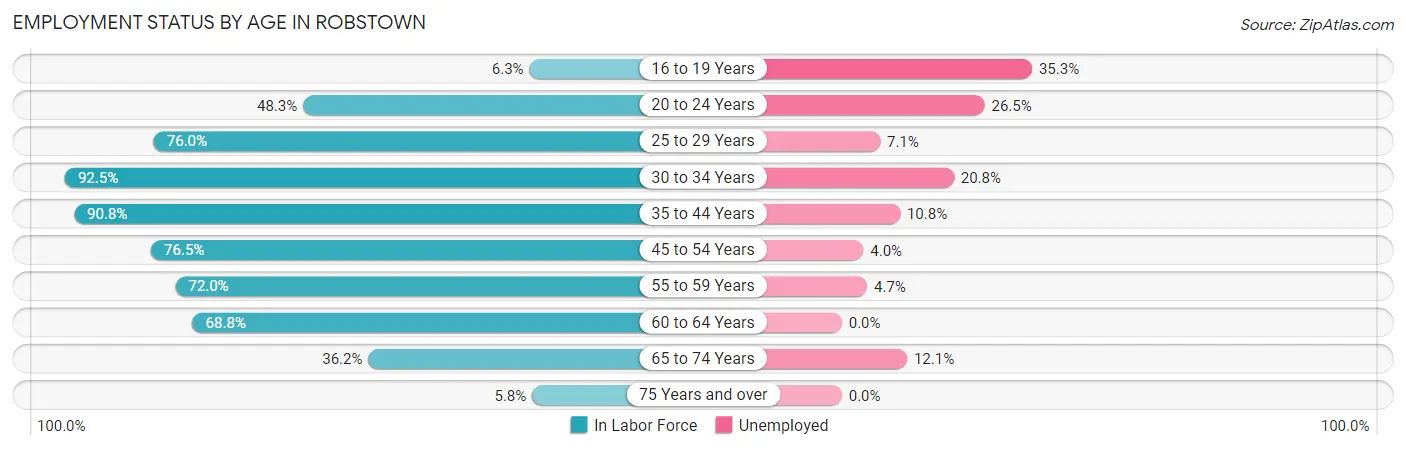
| Age Bracket | In Labor Force | Unemployed |
| 16 to 19 Years | 34 (6.3%) | 12 (35.3%) |
| 20 to 24 Years | 486 (48.3%) | 129 (26.5%) |
| 25 to 29 Years | 438 (76.0%) | 31 (7.1%) |
| 30 to 34 Years | 298 (92.5%) | 62 (20.8%) |
| 35 to 44 Years | 1,165 (90.8%) | 126 (10.8%) |
| 45 to 54 Years | 744 (76.5%) | 30 (4.0%) |
| 55 to 59 Years | 444 (72.0%) | 21 (4.7%) |
| 60 to 64 Years | 366 (68.8%) | 0 (0.0%) |
| 65 to 74 Years | 422 (36.2%) | 51 (12.1%) |
| 75 Years and over | 78 (5.8%) | 0 (0.0%) |
| Total | 4,474 (53.5%) | 461 (10.3%) |
Employment Status by Educational Attainment in Robstown
According to labor force statistics for Robstown, 80.3% of individuals (3,455) out of the total population between 25 and 64 years of age (4,302) are in the labor force, with 7.8% or 269 of them being unemployed. The group with the highest labor force participation rate are those with the educational attainment of bachelor's degree or higher, with 97.4% or 407 individuals in the labor force. Within the labor force, individuals with less than high school education have the highest percentage of unemployment, with 13.8% or 135 of them being unemployed.
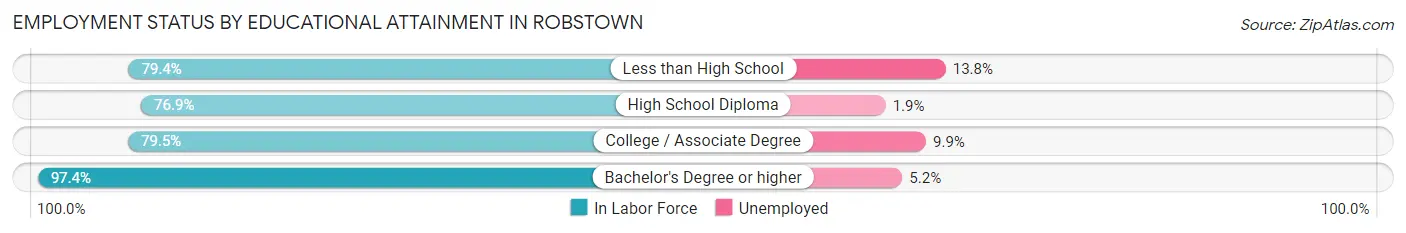
| Educational Attainment | In Labor Force | Unemployed |
| Less than High School | 979 (79.4%) | 170 (13.8%) |
| High School Diploma | 1,142 (76.9%) | 28 (1.9%) |
| College / Associate Degree | 927 (79.5%) | 115 (9.9%) |
| Bachelor's Degree or higher | 407 (97.4%) | 22 (5.2%) |
| Total | 3,455 (80.3%) | 336 (7.8%) |
Employment Occupations by Sex in Robstown
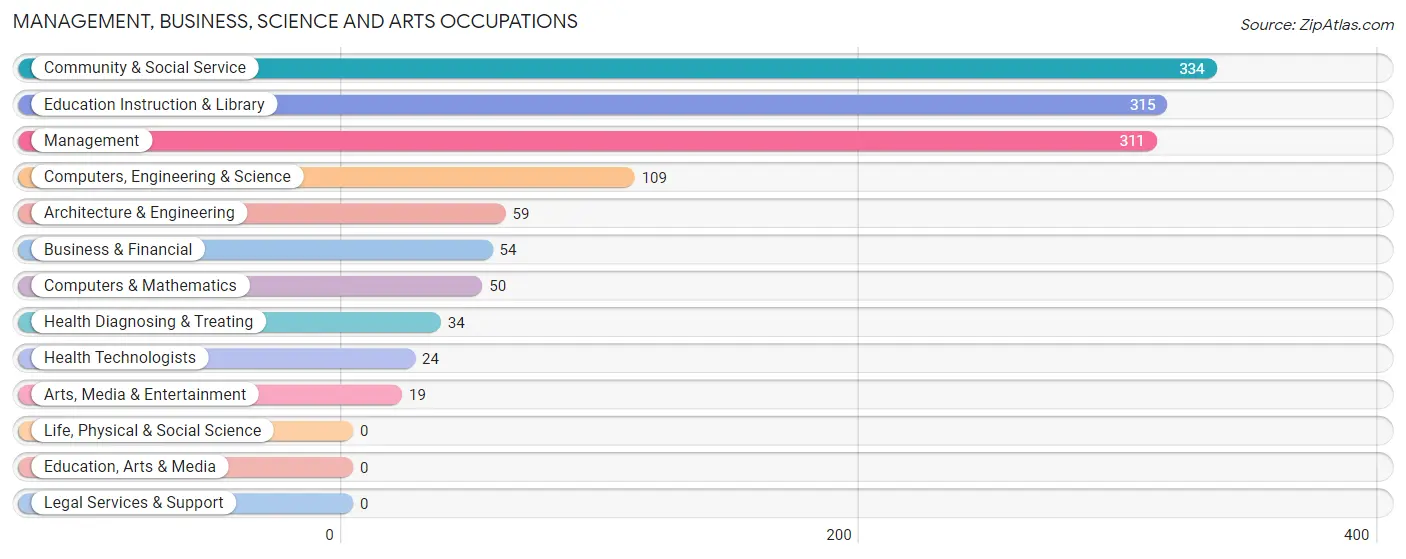
Management, Business, Science and Arts Occupations
The most common Management, Business, Science and Arts occupations in Robstown are Community & Social Service (334 | 8.3%), Education Instruction & Library (315 | 7.9%), Management (311 | 7.7%), Computers, Engineering & Science (109 | 2.7%), and Architecture & Engineering (59 | 1.5%).
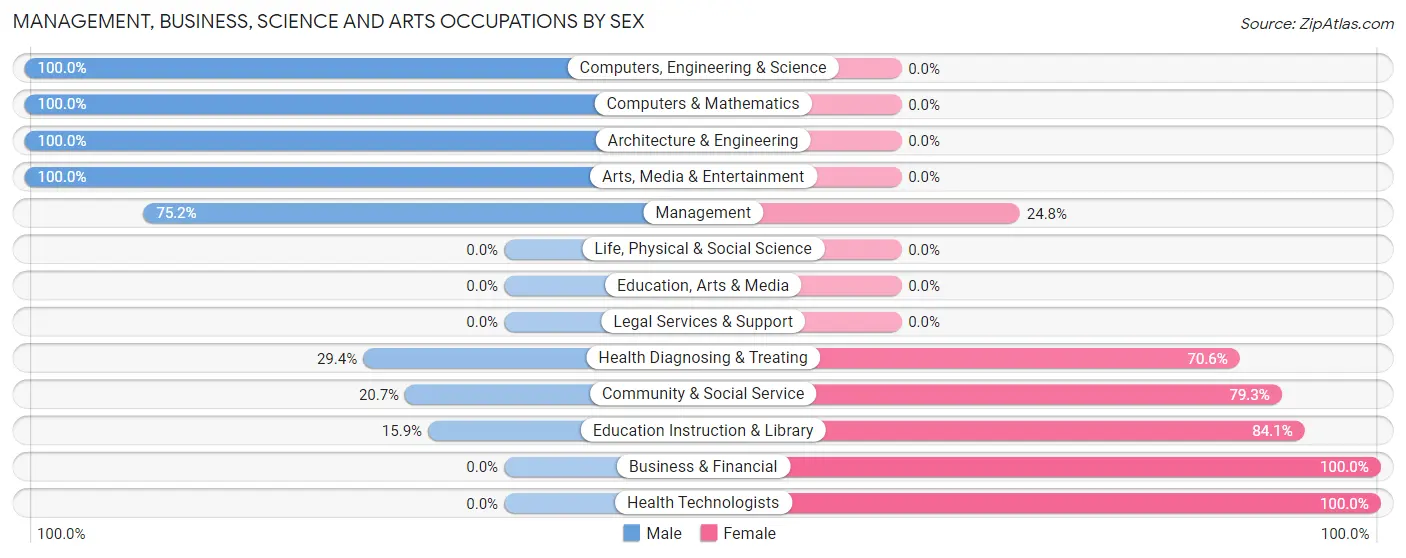
Management, Business, Science and Arts Occupations by Sex
Within the Management, Business, Science and Arts occupations in Robstown, the most male-oriented occupations are Computers, Engineering & Science (100.0%), Computers & Mathematics (100.0%), and Architecture & Engineering (100.0%), while the most female-oriented occupations are Business & Financial (100.0%), Health Technologists (100.0%), and Education Instruction & Library (84.1%).
| Occupation | Male | Female |
| Management | 234 (75.2%) | 77 (24.8%) |
| Business & Financial | 0 (0.0%) | 54 (100.0%) |
| Computers, Engineering & Science | 109 (100.0%) | 0 (0.0%) |
| Computers & Mathematics | 50 (100.0%) | 0 (0.0%) |
| Architecture & Engineering | 59 (100.0%) | 0 (0.0%) |
| Life, Physical & Social Science | 0 (0.0%) | 0 (0.0%) |
| Community & Social Service | 69 (20.7%) | 265 (79.3%) |
| Education, Arts & Media | 0 (0.0%) | 0 (0.0%) |
| Legal Services & Support | 0 (0.0%) | 0 (0.0%) |
| Education Instruction & Library | 50 (15.9%) | 265 (84.1%) |
| Arts, Media & Entertainment | 19 (100.0%) | 0 (0.0%) |
| Health Diagnosing & Treating | 10 (29.4%) | 24 (70.6%) |
| Health Technologists | 0 (0.0%) | 24 (100.0%) |
| Total (Category) | 422 (50.1%) | 420 (49.9%) |
| Total (Overall) | 2,138 (53.3%) | 1,876 (46.7%) |
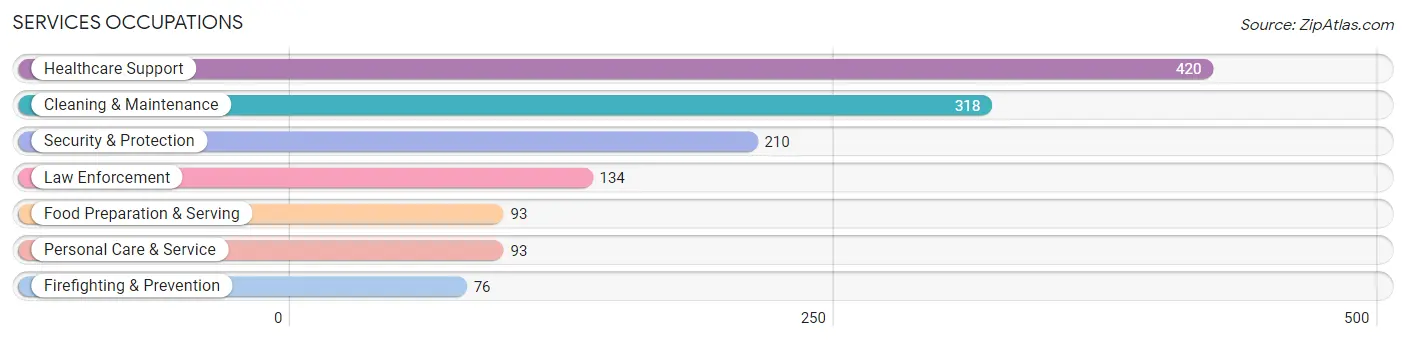
Services Occupations
The most common Services occupations in Robstown are Healthcare Support (420 | 10.5%), Cleaning & Maintenance (318 | 7.9%), Security & Protection (210 | 5.2%), Law Enforcement (134 | 3.3%), and Food Preparation & Serving (93 | 2.3%).
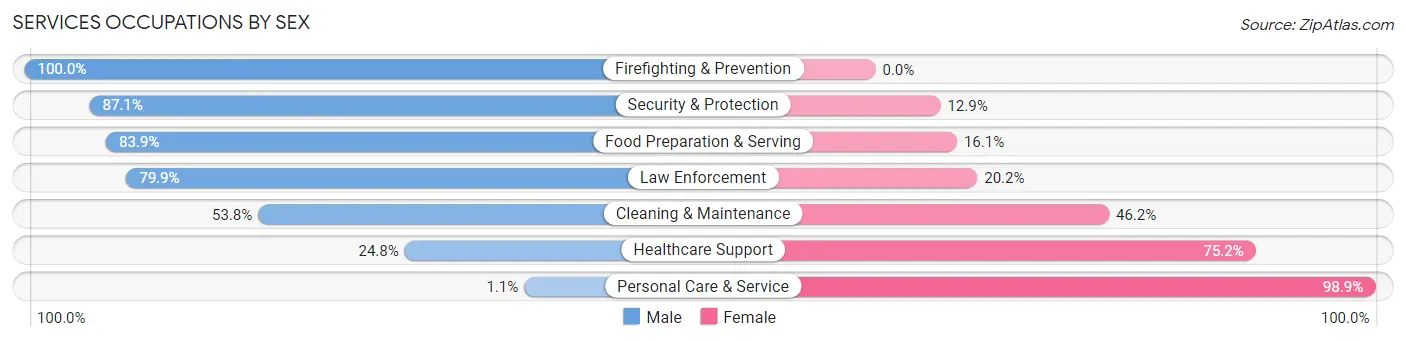
Services Occupations by Sex
Within the Services occupations in Robstown, the most male-oriented occupations are Firefighting & Prevention (100.0%), Security & Protection (87.1%), and Food Preparation & Serving (83.9%), while the most female-oriented occupations are Personal Care & Service (98.9%), Healthcare Support (75.2%), and Cleaning & Maintenance (46.2%).
| Occupation | Male | Female |
| Healthcare Support | 104 (24.8%) | 316 (75.2%) |
| Security & Protection | 183 (87.1%) | 27 (12.9%) |
| Firefighting & Prevention | 76 (100.0%) | 0 (0.0%) |
| Law Enforcement | 107 (79.8%) | 27 (20.2%) |
| Food Preparation & Serving | 78 (83.9%) | 15 (16.1%) |
| Cleaning & Maintenance | 171 (53.8%) | 147 (46.2%) |
| Personal Care & Service | 1 (1.1%) | 92 (98.9%) |
| Total (Category) | 537 (47.3%) | 597 (52.6%) |
| Total (Overall) | 2,138 (53.3%) | 1,876 (46.7%) |
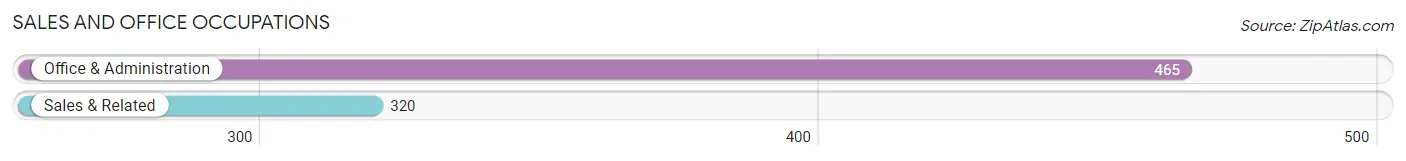
Sales and Office Occupations
The most common Sales and Office occupations in Robstown are Office & Administration (465 | 11.6%), and Sales & Related (320 | 8.0%).
Sales and Office Occupations by Sex
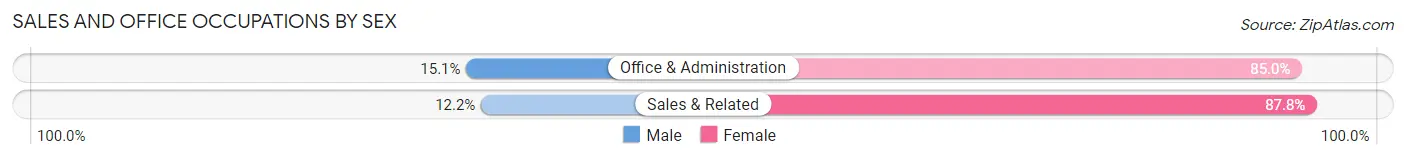
| Occupation | Male | Female |
| Sales & Related | 39 (12.2%) | 281 (87.8%) |
| Office & Administration | 70 (15.0%) | 395 (85.0%) |
| Total (Category) | 109 (13.9%) | 676 (86.1%) |
| Total (Overall) | 2,138 (53.3%) | 1,876 (46.7%) |
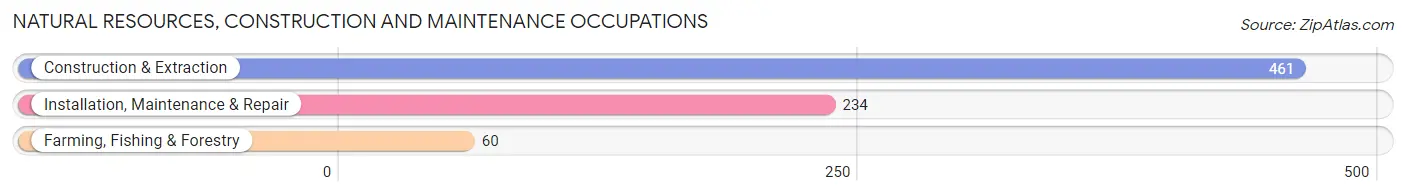
Natural Resources, Construction and Maintenance Occupations
The most common Natural Resources, Construction and Maintenance occupations in Robstown are Construction & Extraction (461 | 11.5%), Installation, Maintenance & Repair (234 | 5.8%), and Farming, Fishing & Forestry (60 | 1.5%).
Natural Resources, Construction and Maintenance Occupations by Sex
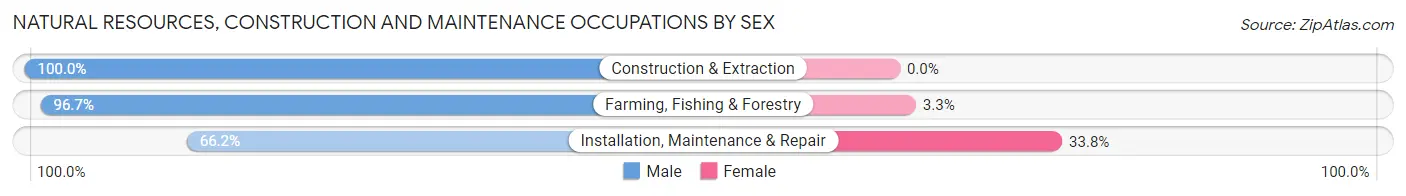
| Occupation | Male | Female |
| Farming, Fishing & Forestry | 58 (96.7%) | 2 (3.3%) |
| Construction & Extraction | 461 (100.0%) | 0 (0.0%) |
| Installation, Maintenance & Repair | 155 (66.2%) | 79 (33.8%) |
| Total (Category) | 674 (89.3%) | 81 (10.7%) |
| Total (Overall) | 2,138 (53.3%) | 1,876 (46.7%) |
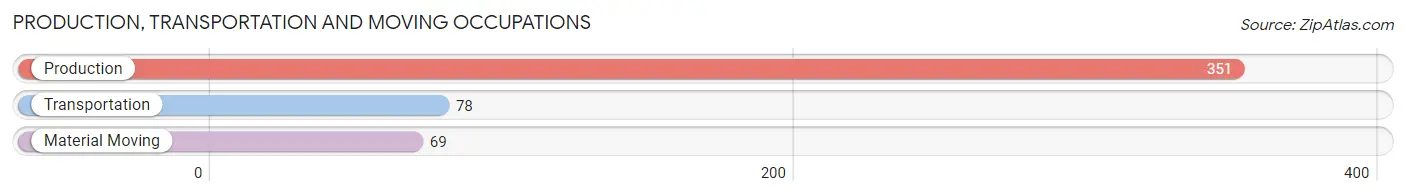
Production, Transportation and Moving Occupations
The most common Production, Transportation and Moving occupations in Robstown are Production (351 | 8.7%), Transportation (78 | 1.9%), and Material Moving (69 | 1.7%).
Production, Transportation and Moving Occupations by Sex
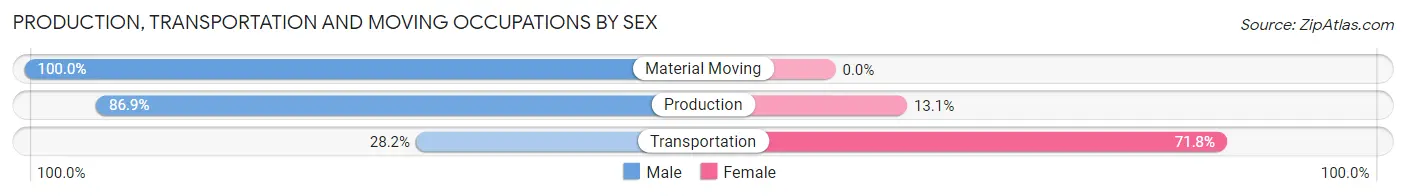
| Occupation | Male | Female |
| Production | 305 (86.9%) | 46 (13.1%) |
| Transportation | 22 (28.2%) | 56 (71.8%) |
| Material Moving | 69 (100.0%) | 0 (0.0%) |
| Total (Category) | 396 (79.5%) | 102 (20.5%) |
| Total (Overall) | 2,138 (53.3%) | 1,876 (46.7%) |
Employment Industries by Sex in Robstown
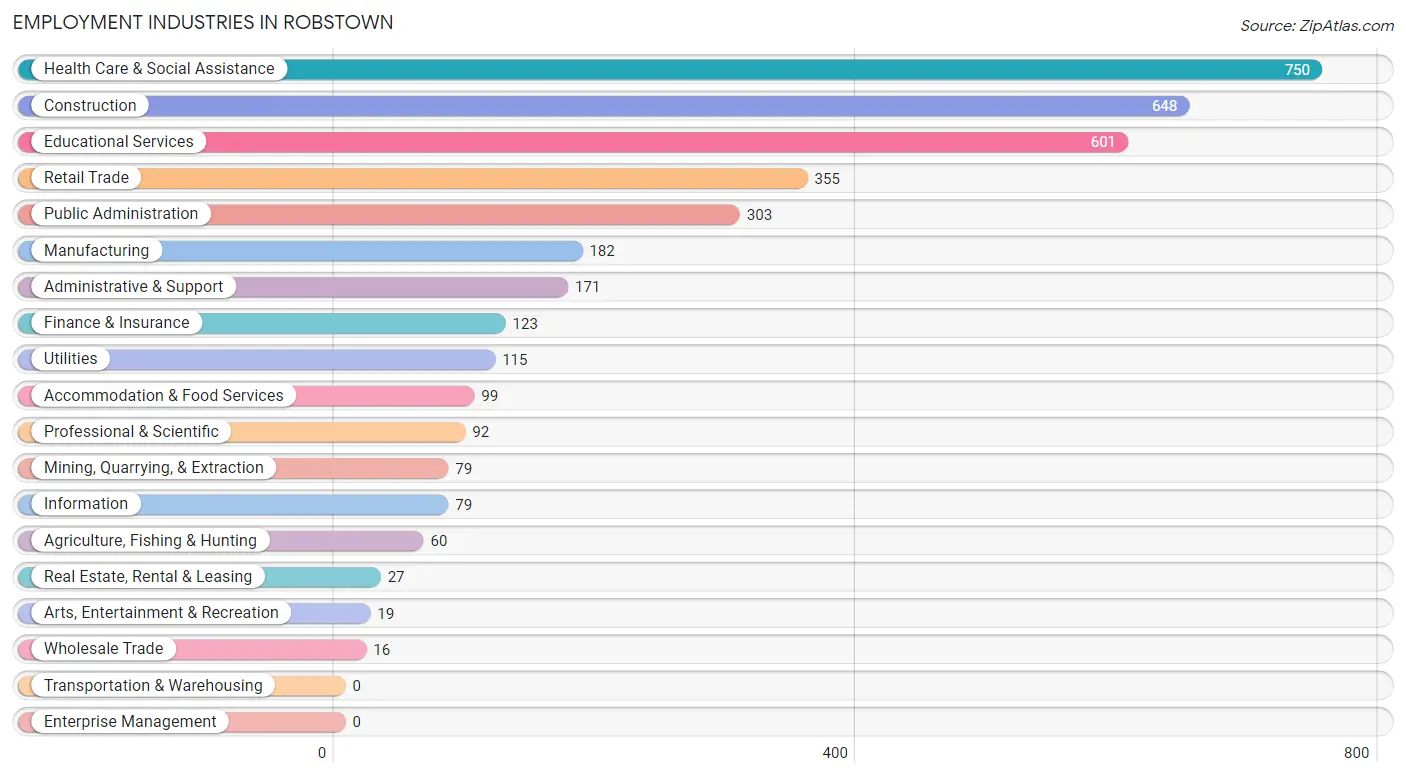
Employment Industries in Robstown
The major employment industries in Robstown include Health Care & Social Assistance (750 | 18.7%), Construction (648 | 16.1%), Educational Services (601 | 15.0%), Retail Trade (355 | 8.8%), and Public Administration (303 | 7.5%).
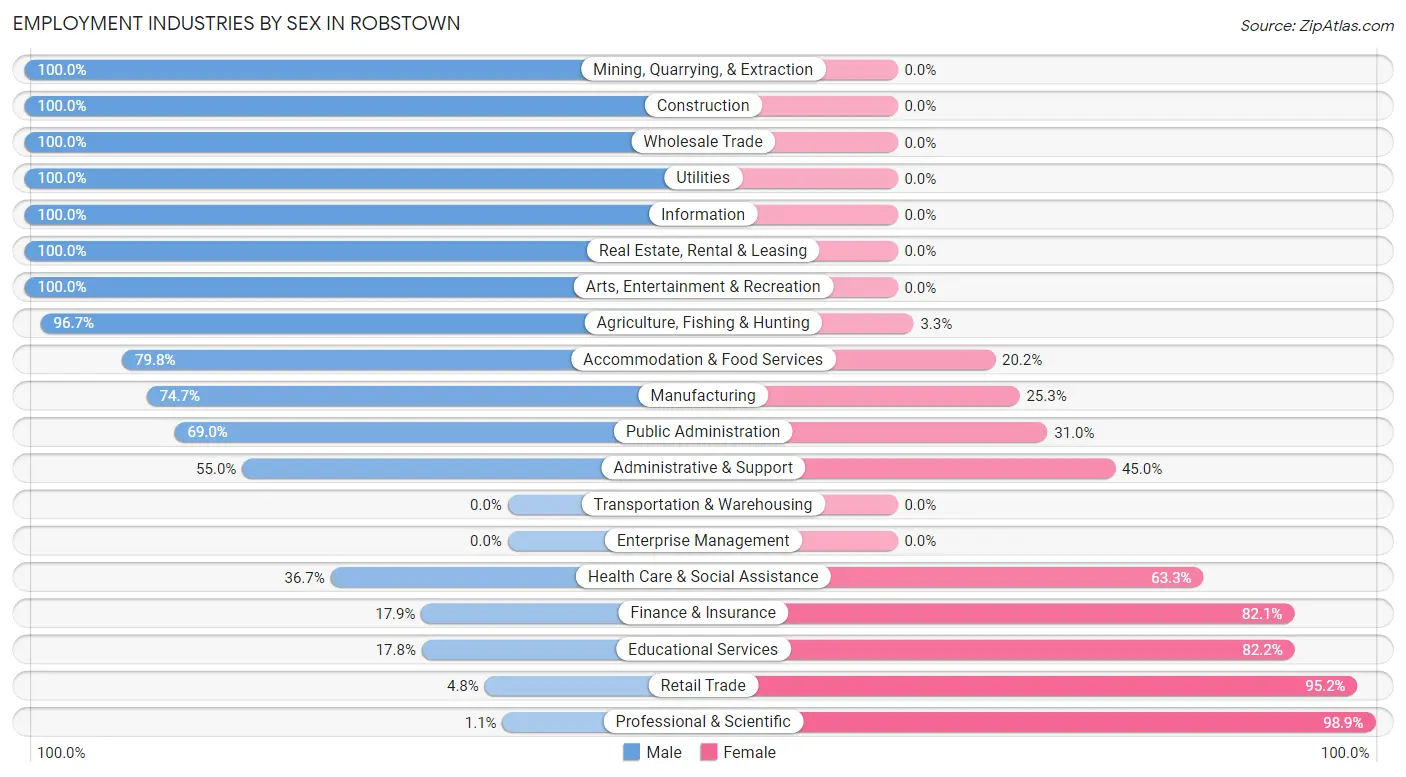
Employment Industries by Sex in Robstown
The Robstown industries that see more men than women are Mining, Quarrying, & Extraction (100.0%), Construction (100.0%), and Wholesale Trade (100.0%), whereas the industries that tend to have a higher number of women are Professional & Scientific (98.9%), Retail Trade (95.2%), and Educational Services (82.2%).
| Industry | Male | Female |
| Agriculture, Fishing & Hunting | 58 (96.7%) | 2 (3.3%) |
| Mining, Quarrying, & Extraction | 79 (100.0%) | 0 (0.0%) |
| Construction | 648 (100.0%) | 0 (0.0%) |
| Manufacturing | 136 (74.7%) | 46 (25.3%) |
| Wholesale Trade | 16 (100.0%) | 0 (0.0%) |
| Retail Trade | 17 (4.8%) | 338 (95.2%) |
| Transportation & Warehousing | 0 (0.0%) | 0 (0.0%) |
| Utilities | 115 (100.0%) | 0 (0.0%) |
| Information | 79 (100.0%) | 0 (0.0%) |
| Finance & Insurance | 22 (17.9%) | 101 (82.1%) |
| Real Estate, Rental & Leasing | 27 (100.0%) | 0 (0.0%) |
| Professional & Scientific | 1 (1.1%) | 91 (98.9%) |
| Enterprise Management | 0 (0.0%) | 0 (0.0%) |
| Administrative & Support | 94 (55.0%) | 77 (45.0%) |
| Educational Services | 107 (17.8%) | 494 (82.2%) |
| Health Care & Social Assistance | 275 (36.7%) | 475 (63.3%) |
| Arts, Entertainment & Recreation | 19 (100.0%) | 0 (0.0%) |
| Accommodation & Food Services | 79 (79.8%) | 20 (20.2%) |
| Public Administration | 209 (69.0%) | 94 (31.0%) |
| Total | 2,138 (53.3%) | 1,876 (46.7%) |
Education in Robstown
School Enrollment in Robstown
The most common levels of schooling among the 2,328 students in Robstown are elementary school (588 | 25.3%), high school (487 | 20.9%), and middle school (440 | 18.9%).
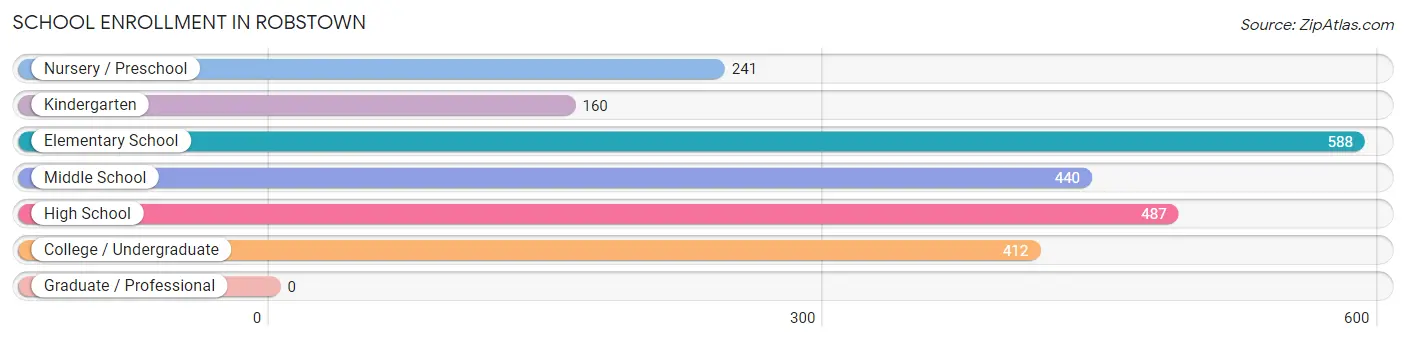
| School Level | # Students | % Students |
| Nursery / Preschool | 241 | 10.3% |
| Kindergarten | 160 | 6.9% |
| Elementary School | 588 | 25.3% |
| Middle School | 440 | 18.9% |
| High School | 487 | 20.9% |
| College / Undergraduate | 412 | 17.7% |
| Graduate / Professional | 0 | 0.0% |
| Total | 2,328 | 100.0% |
School Enrollment by Age by Funding Source in Robstown
Out of a total of 2,328 students who are enrolled in schools in Robstown, 114 (4.9%) attend a private institution, while the remaining 2,214 (95.1%) are enrolled in public schools. The age group of 15 to 17 year olds has the highest likelihood of being enrolled in private schools, with 114 (28.7% in the age bracket) enrolled. Conversely, the age group of 3 to 4 year olds has the lowest likelihood of being enrolled in a private school, with 241 (100.0% in the age bracket) attending a public institution.
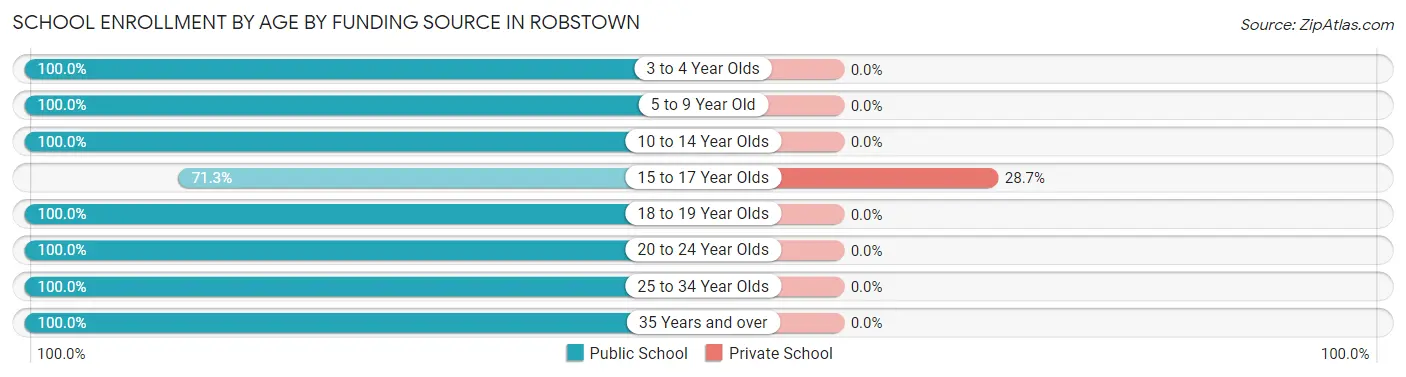
| Age Bracket | Public School | Private School |
| 3 to 4 Year Olds | 241 (100.0%) | 0 (0.0%) |
| 5 to 9 Year Old | 672 (100.0%) | 0 (0.0%) |
| 10 to 14 Year Olds | 565 (100.0%) | 0 (0.0%) |
| 15 to 17 Year Olds | 283 (71.3%) | 114 (28.7%) |
| 18 to 19 Year Olds | 111 (100.0%) | 0 (0.0%) |
| 20 to 24 Year Olds | 224 (100.0%) | 0 (0.0%) |
| 25 to 34 Year Olds | 72 (100.0%) | 0 (0.0%) |
| 35 Years and over | 46 (100.0%) | 0 (0.0%) |
| Total | 2,214 (95.1%) | 114 (4.9%) |
Educational Attainment by Field of Study in Robstown
Education (179 | 26.5%), engineering (125 | 18.5%), bio, nature & agricultural (63 | 9.3%), science & technology (58 | 8.6%), and arts & humanities (58 | 8.6%) are the most common fields of study among 676 individuals in Robstown who have obtained a bachelor's degree or higher.
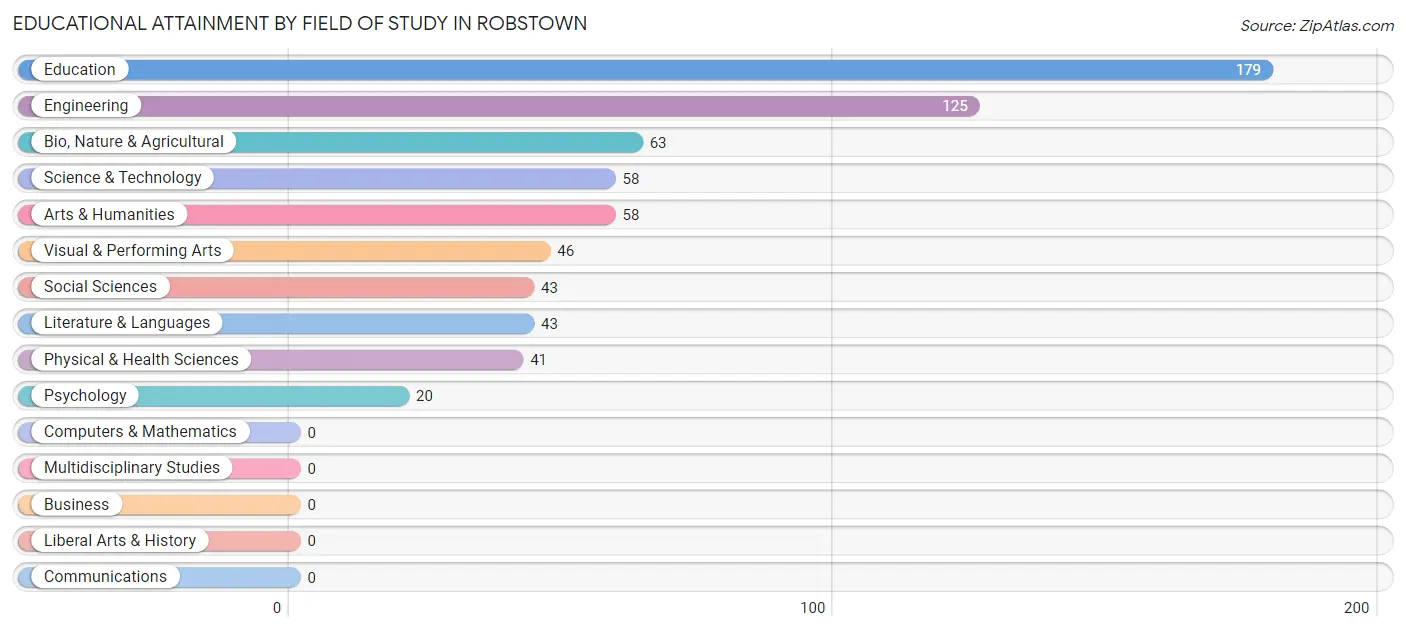
| Field of Study | # Graduates | % Graduates |
| Computers & Mathematics | 0 | 0.0% |
| Bio, Nature & Agricultural | 63 | 9.3% |
| Physical & Health Sciences | 41 | 6.1% |
| Psychology | 20 | 3.0% |
| Social Sciences | 43 | 6.4% |
| Engineering | 125 | 18.5% |
| Multidisciplinary Studies | 0 | 0.0% |
| Science & Technology | 58 | 8.6% |
| Business | 0 | 0.0% |
| Education | 179 | 26.5% |
| Literature & Languages | 43 | 6.4% |
| Liberal Arts & History | 0 | 0.0% |
| Visual & Performing Arts | 46 | 6.8% |
| Communications | 0 | 0.0% |
| Arts & Humanities | 58 | 8.6% |
| Total | 676 | 100.0% |
Transportation & Commute in Robstown
Vehicle Availability by Sex in Robstown
The most prevalent vehicle ownership categories in Robstown are males with 2 vehicles (957, accounting for 44.9%) and females with 2 vehicles (803, making up 52.6%).
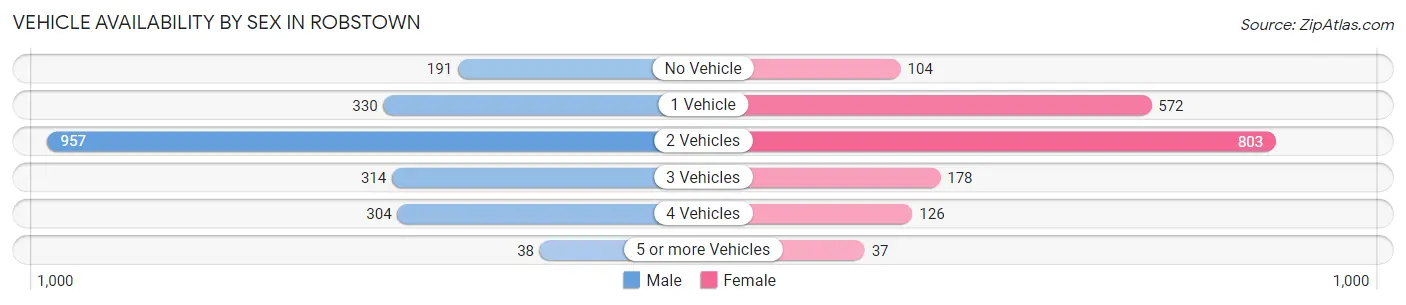
| Vehicles Available | Male | Female |
| No Vehicle | 191 (8.9%) | 104 (5.7%) |
| 1 Vehicle | 330 (15.5%) | 572 (31.4%) |
| 2 Vehicles | 957 (44.9%) | 803 (44.1%) |
| 3 Vehicles | 314 (14.7%) | 178 (9.8%) |
| 4 Vehicles | 304 (14.2%) | 126 (6.9%) |
| 5 or more Vehicles | 38 (1.8%) | 37 (2.0%) |
| Total | 2,134 (100.0%) | 1,820 (100.0%) |
Commute Time in Robstown
The most frequently occuring commute durations in Robstown are 5 to 9 minutes (795 commuters, 21.0%), 30 to 34 minutes (791 commuters, 20.9%), and 15 to 19 minutes (590 commuters, 15.6%).
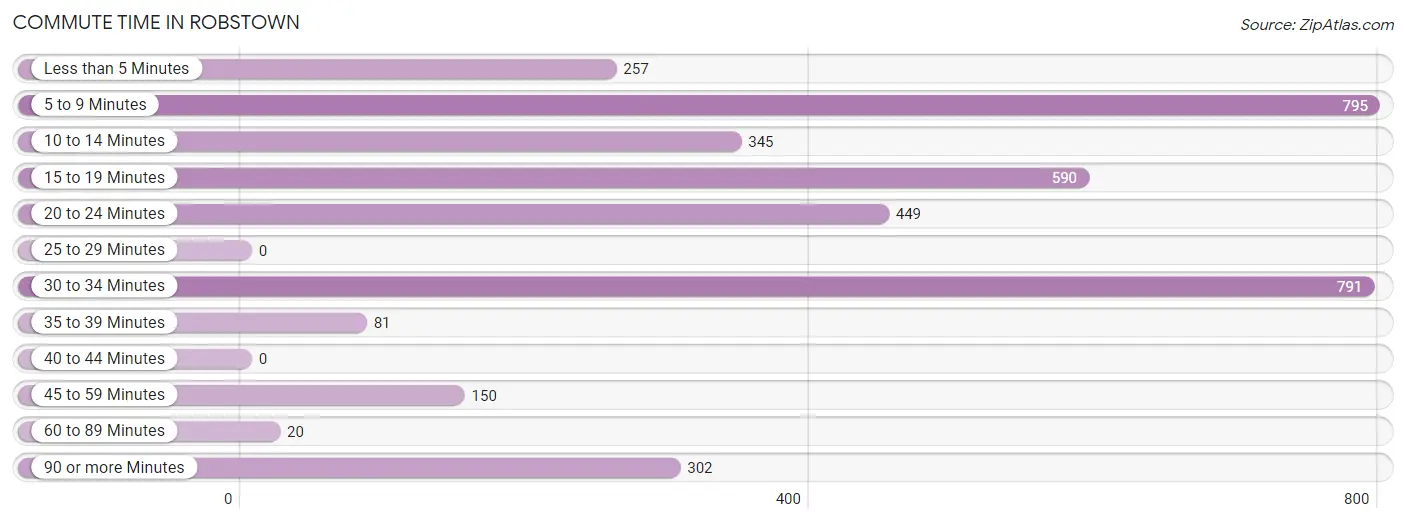
| Commute Time | # Commuters | % Commuters |
| Less than 5 Minutes | 257 | 6.8% |
| 5 to 9 Minutes | 795 | 21.0% |
| 10 to 14 Minutes | 345 | 9.1% |
| 15 to 19 Minutes | 590 | 15.6% |
| 20 to 24 Minutes | 449 | 11.9% |
| 25 to 29 Minutes | 0 | 0.0% |
| 30 to 34 Minutes | 791 | 20.9% |
| 35 to 39 Minutes | 81 | 2.1% |
| 40 to 44 Minutes | 0 | 0.0% |
| 45 to 59 Minutes | 150 | 4.0% |
| 60 to 89 Minutes | 20 | 0.5% |
| 90 or more Minutes | 302 | 8.0% |
Commute Time by Sex in Robstown
The most common commute times in Robstown are 30 to 34 minutes (505 commuters, 24.6%) for males and 5 to 9 minutes (381 commuters, 22.0%) for females.
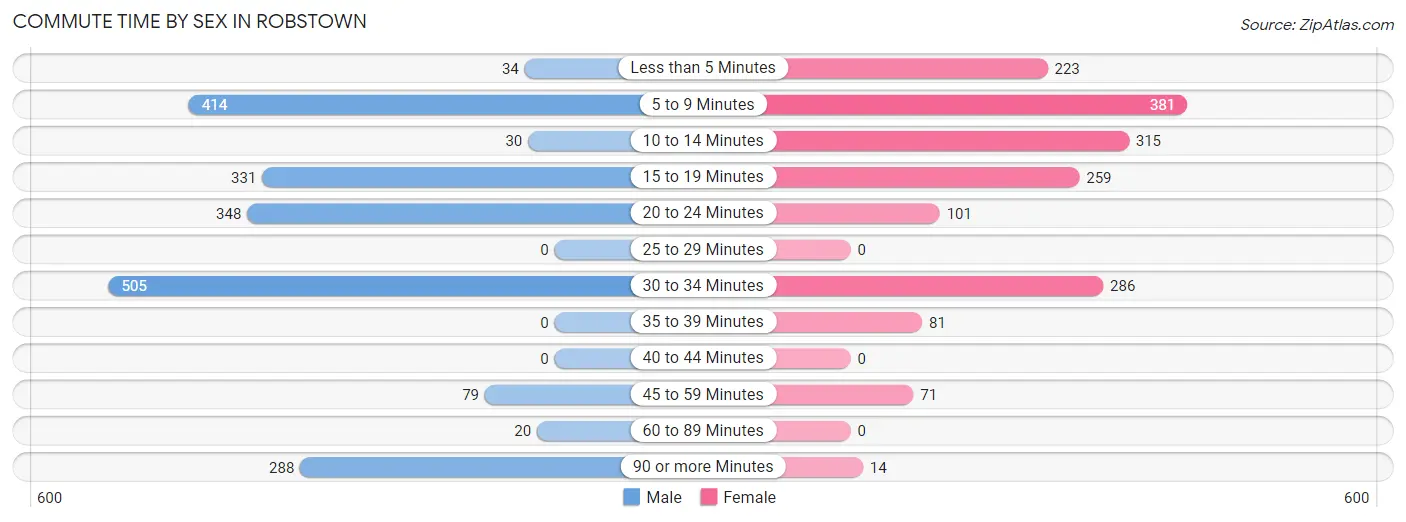
| Commute Time | Male | Female |
| Less than 5 Minutes | 34 (1.7%) | 223 (12.9%) |
| 5 to 9 Minutes | 414 (20.2%) | 381 (22.0%) |
| 10 to 14 Minutes | 30 (1.5%) | 315 (18.2%) |
| 15 to 19 Minutes | 331 (16.2%) | 259 (15.0%) |
| 20 to 24 Minutes | 348 (17.0%) | 101 (5.8%) |
| 25 to 29 Minutes | 0 (0.0%) | 0 (0.0%) |
| 30 to 34 Minutes | 505 (24.6%) | 286 (16.5%) |
| 35 to 39 Minutes | 0 (0.0%) | 81 (4.7%) |
| 40 to 44 Minutes | 0 (0.0%) | 0 (0.0%) |
| 45 to 59 Minutes | 79 (3.9%) | 71 (4.1%) |
| 60 to 89 Minutes | 20 (1.0%) | 0 (0.0%) |
| 90 or more Minutes | 288 (14.1%) | 14 (0.8%) |
Time of Departure to Work by Sex in Robstown
The most frequent times of departure to work in Robstown are 7:30 AM to 7:59 AM (411, 20.1%) for males and 7:30 AM to 7:59 AM (472, 27.3%) for females.
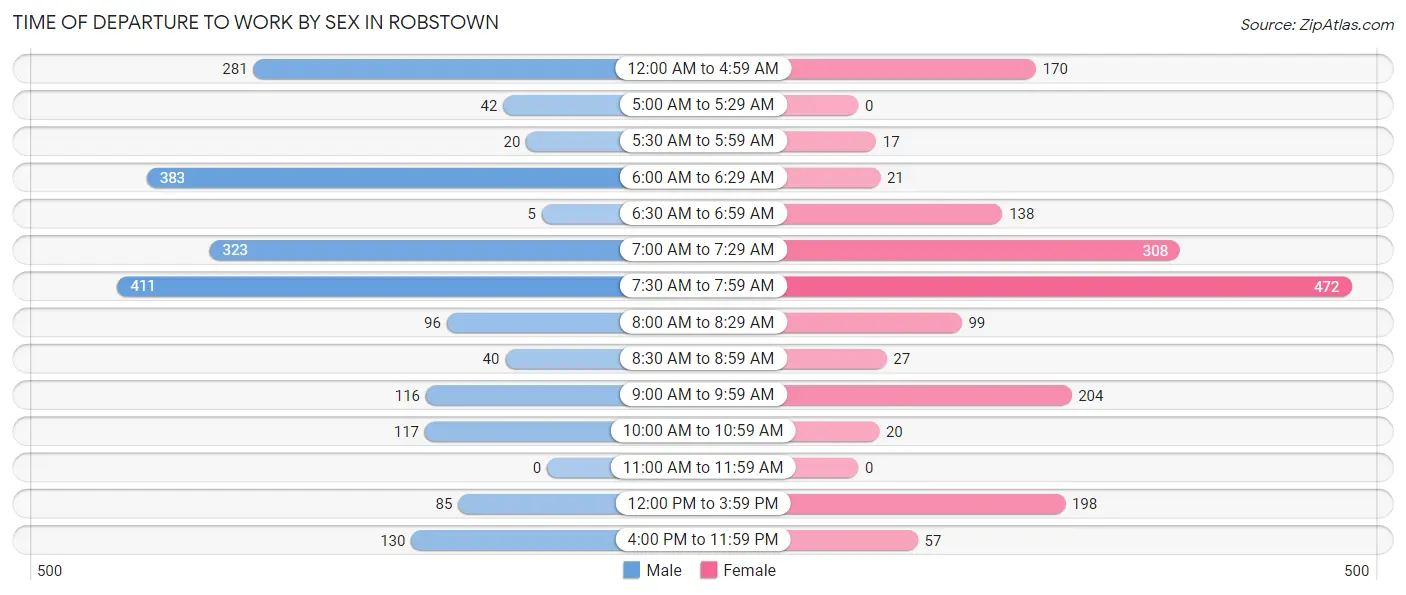
| Time of Departure | Male | Female |
| 12:00 AM to 4:59 AM | 281 (13.7%) | 170 (9.8%) |
| 5:00 AM to 5:29 AM | 42 (2.1%) | 0 (0.0%) |
| 5:30 AM to 5:59 AM | 20 (1.0%) | 17 (1.0%) |
| 6:00 AM to 6:29 AM | 383 (18.7%) | 21 (1.2%) |
| 6:30 AM to 6:59 AM | 5 (0.2%) | 138 (8.0%) |
| 7:00 AM to 7:29 AM | 323 (15.8%) | 308 (17.8%) |
| 7:30 AM to 7:59 AM | 411 (20.1%) | 472 (27.3%) |
| 8:00 AM to 8:29 AM | 96 (4.7%) | 99 (5.7%) |
| 8:30 AM to 8:59 AM | 40 (1.9%) | 27 (1.6%) |
| 9:00 AM to 9:59 AM | 116 (5.7%) | 204 (11.8%) |
| 10:00 AM to 10:59 AM | 117 (5.7%) | 20 (1.2%) |
| 11:00 AM to 11:59 AM | 0 (0.0%) | 0 (0.0%) |
| 12:00 PM to 3:59 PM | 85 (4.2%) | 198 (11.4%) |
| 4:00 PM to 11:59 PM | 130 (6.3%) | 57 (3.3%) |
| Total | 2,049 (100.0%) | 1,731 (100.0%) |
Housing Occupancy in Robstown
Occupancy by Ownership in Robstown
Of the total 3,766 dwellings in Robstown, owner-occupied units account for 2,663 (70.7%), while renter-occupied units make up 1,103 (29.3%).
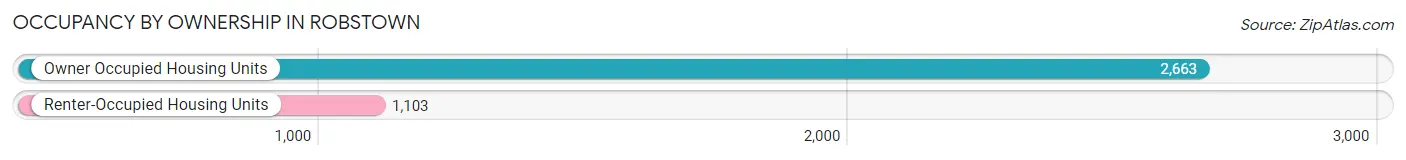
| Occupancy | # Housing Units | % Housing Units |
| Owner Occupied Housing Units | 2,663 | 70.7% |
| Renter-Occupied Housing Units | 1,103 | 29.3% |
| Total Occupied Housing Units | 3,766 | 100.0% |
Occupancy by Household Size in Robstown
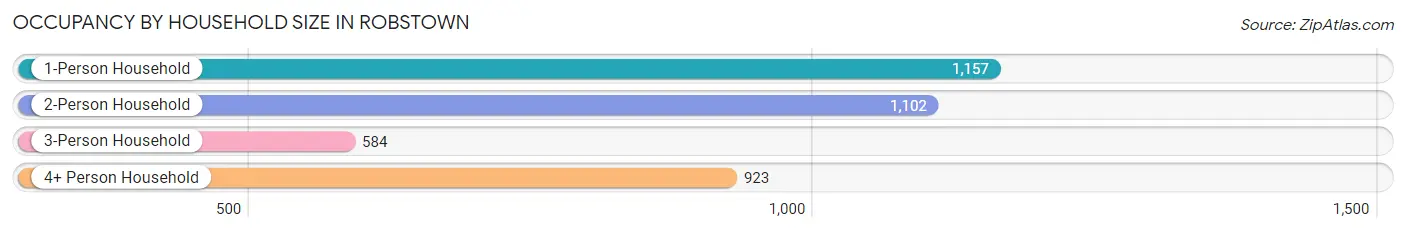
| Household Size | # Housing Units | % Housing Units |
| 1-Person Household | 1,157 | 30.7% |
| 2-Person Household | 1,102 | 29.3% |
| 3-Person Household | 584 | 15.5% |
| 4+ Person Household | 923 | 24.5% |
| Total Housing Units | 3,766 | 100.0% |
Occupancy by Ownership by Household Size in Robstown
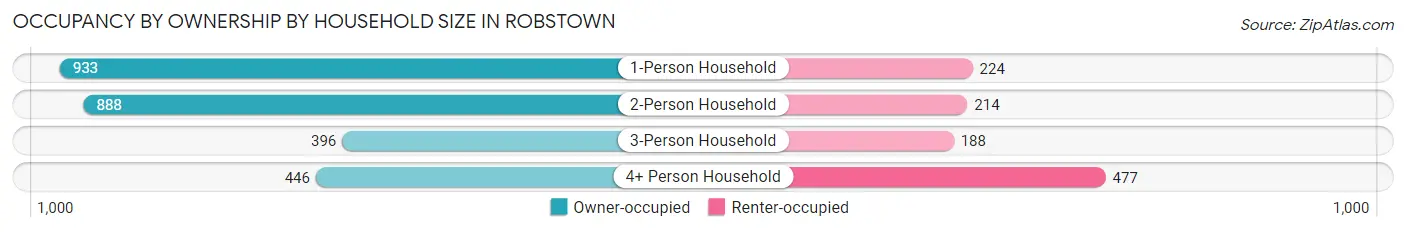
| Household Size | Owner-occupied | Renter-occupied |
| 1-Person Household | 933 (80.6%) | 224 (19.4%) |
| 2-Person Household | 888 (80.6%) | 214 (19.4%) |
| 3-Person Household | 396 (67.8%) | 188 (32.2%) |
| 4+ Person Household | 446 (48.3%) | 477 (51.7%) |
| Total Housing Units | 2,663 (70.7%) | 1,103 (29.3%) |
Occupancy by Educational Attainment in Robstown
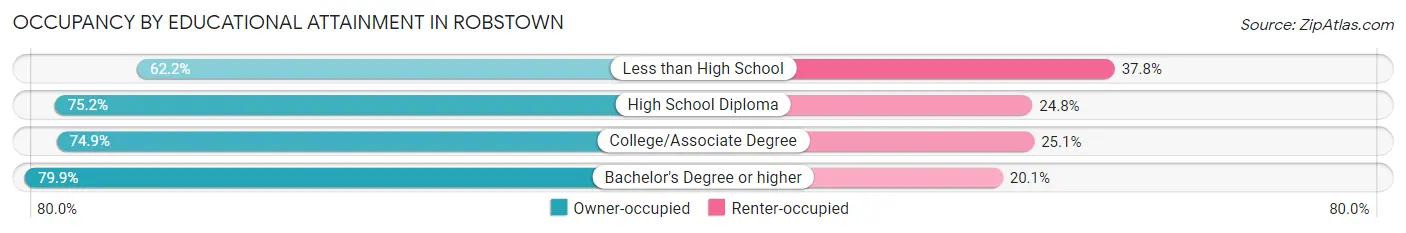
| Household Size | Owner-occupied | Renter-occupied |
| Less than High School | 846 (62.2%) | 515 (37.8%) |
| High School Diploma | 586 (75.2%) | 193 (24.8%) |
| College/Associate Degree | 1,028 (74.9%) | 344 (25.1%) |
| Bachelor's Degree or higher | 203 (79.9%) | 51 (20.1%) |
Occupancy by Age of Householder in Robstown
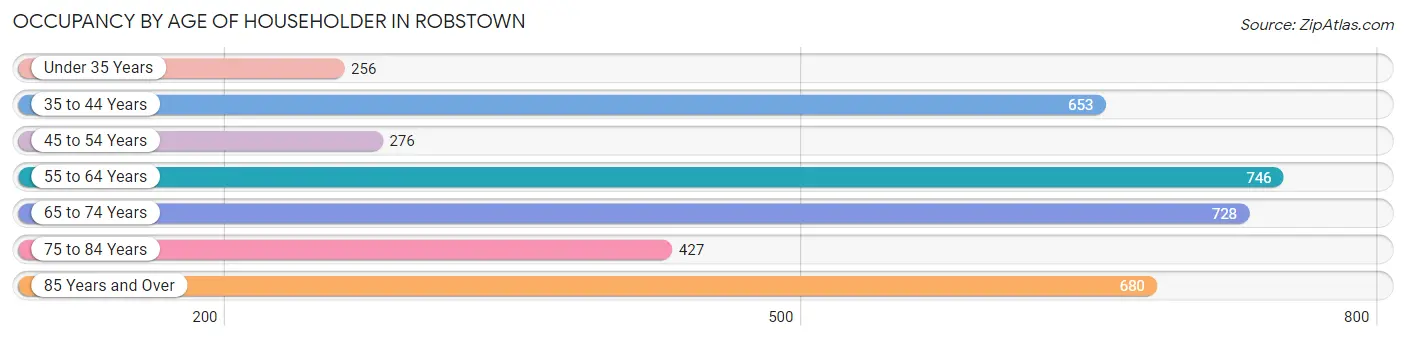
| Age Bracket | # Households | % Households |
| Under 35 Years | 256 | 6.8% |
| 35 to 44 Years | 653 | 17.3% |
| 45 to 54 Years | 276 | 7.3% |
| 55 to 64 Years | 746 | 19.8% |
| 65 to 74 Years | 728 | 19.3% |
| 75 to 84 Years | 427 | 11.3% |
| 85 Years and Over | 680 | 18.1% |
| Total | 3,766 | 100.0% |
Housing Finances in Robstown
Median Income by Occupancy in Robstown
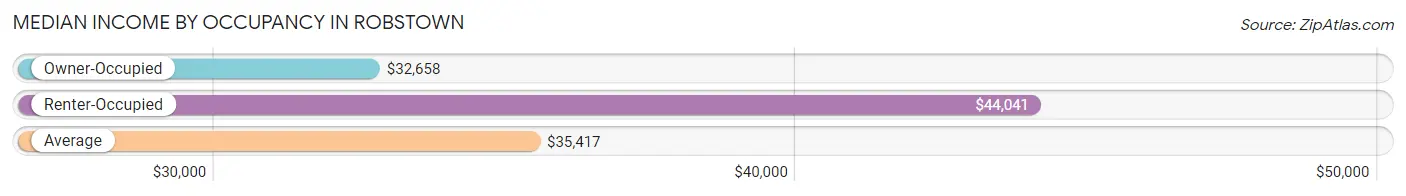
| Occupancy Type | # Households | Median Income |
| Owner-Occupied | 2,663 (70.7%) | $32,658 |
| Renter-Occupied | 1,103 (29.3%) | $44,041 |
| Average | 3,766 (100.0%) | $35,417 |
Occupancy by Householder Income Bracket in Robstown
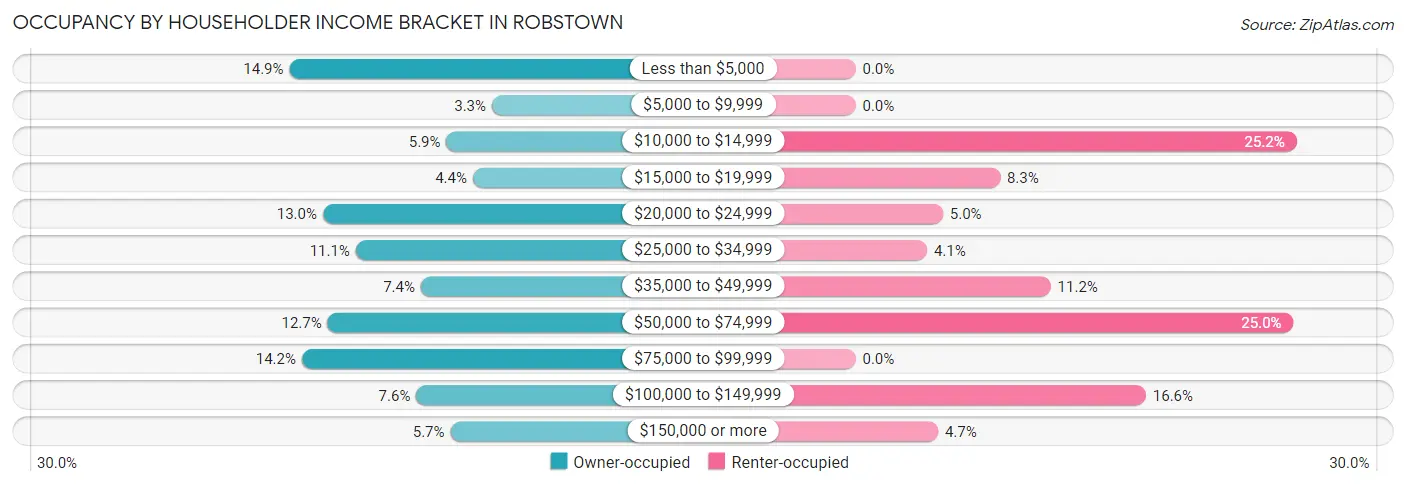
| Income Bracket | Owner-occupied | Renter-occupied |
| Less than $5,000 | 396 (14.9%) | 0 (0.0%) |
| $5,000 to $9,999 | 88 (3.3%) | 0 (0.0%) |
| $10,000 to $14,999 | 157 (5.9%) | 278 (25.2%) |
| $15,000 to $19,999 | 117 (4.4%) | 91 (8.3%) |
| $20,000 to $24,999 | 345 (13.0%) | 55 (5.0%) |
| $25,000 to $34,999 | 295 (11.1%) | 45 (4.1%) |
| $35,000 to $49,999 | 196 (7.4%) | 123 (11.2%) |
| $50,000 to $74,999 | 338 (12.7%) | 276 (25.0%) |
| $75,000 to $99,999 | 377 (14.2%) | 0 (0.0%) |
| $100,000 to $149,999 | 203 (7.6%) | 183 (16.6%) |
| $150,000 or more | 151 (5.7%) | 52 (4.7%) |
| Total | 2,663 (100.0%) | 1,103 (100.0%) |
Monthly Housing Cost Tiers in Robstown
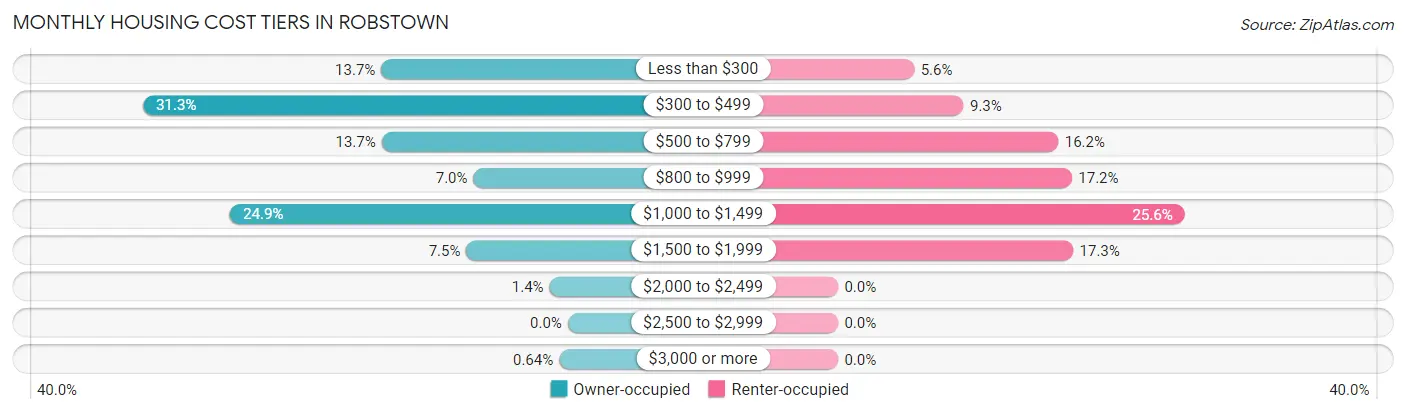
| Monthly Cost | Owner-occupied | Renter-occupied |
| Less than $300 | 366 (13.7%) | 62 (5.6%) |
| $300 to $499 | 833 (31.3%) | 102 (9.2%) |
| $500 to $799 | 365 (13.7%) | 179 (16.2%) |
| $800 to $999 | 185 (7.0%) | 190 (17.2%) |
| $1,000 to $1,499 | 662 (24.9%) | 282 (25.6%) |
| $1,500 to $1,999 | 199 (7.5%) | 191 (17.3%) |
| $2,000 to $2,499 | 36 (1.3%) | 0 (0.0%) |
| $2,500 to $2,999 | 0 (0.0%) | 0 (0.0%) |
| $3,000 or more | 17 (0.6%) | 0 (0.0%) |
| Total | 2,663 (100.0%) | 1,103 (100.0%) |
Physical Housing Characteristics in Robstown
Housing Structures in Robstown
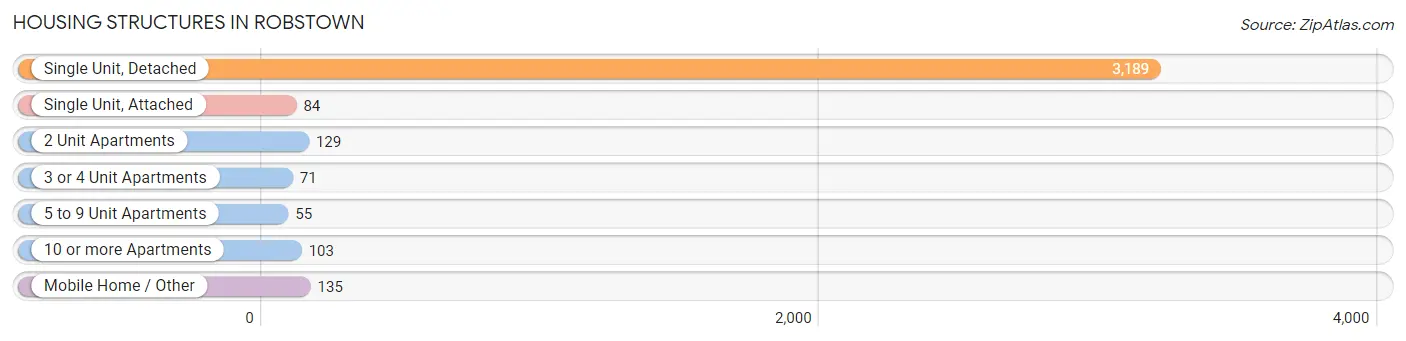
| Structure Type | # Housing Units | % Housing Units |
| Single Unit, Detached | 3,189 | 84.7% |
| Single Unit, Attached | 84 | 2.2% |
| 2 Unit Apartments | 129 | 3.4% |
| 3 or 4 Unit Apartments | 71 | 1.9% |
| 5 to 9 Unit Apartments | 55 | 1.5% |
| 10 or more Apartments | 103 | 2.7% |
| Mobile Home / Other | 135 | 3.6% |
| Total | 3,766 | 100.0% |
Housing Structures by Occupancy in Robstown
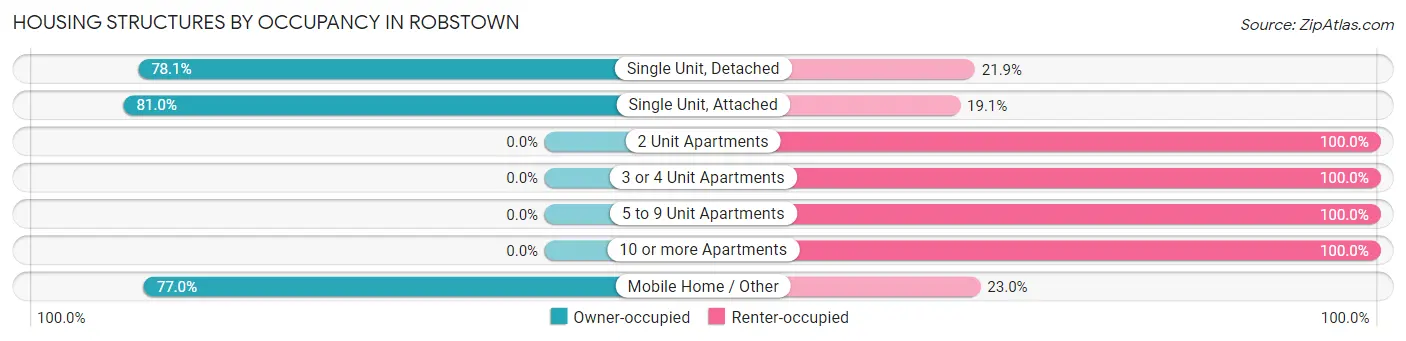
| Structure Type | Owner-occupied | Renter-occupied |
| Single Unit, Detached | 2,491 (78.1%) | 698 (21.9%) |
| Single Unit, Attached | 68 (80.9%) | 16 (19.1%) |
| 2 Unit Apartments | 0 (0.0%) | 129 (100.0%) |
| 3 or 4 Unit Apartments | 0 (0.0%) | 71 (100.0%) |
| 5 to 9 Unit Apartments | 0 (0.0%) | 55 (100.0%) |
| 10 or more Apartments | 0 (0.0%) | 103 (100.0%) |
| Mobile Home / Other | 104 (77.0%) | 31 (23.0%) |
| Total | 2,663 (70.7%) | 1,103 (29.3%) |
Housing Structures by Number of Rooms in Robstown
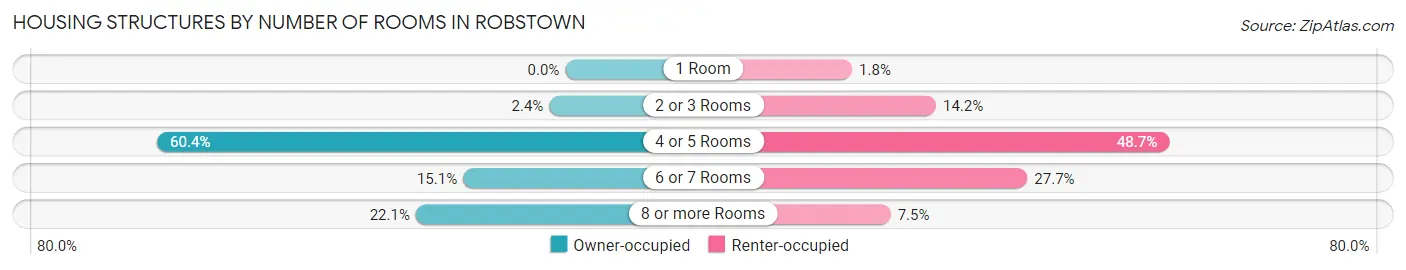
| Number of Rooms | Owner-occupied | Renter-occupied |
| 1 Room | 0 (0.0%) | 20 (1.8%) |
| 2 or 3 Rooms | 63 (2.4%) | 157 (14.2%) |
| 4 or 5 Rooms | 1,608 (60.4%) | 537 (48.7%) |
| 6 or 7 Rooms | 403 (15.1%) | 306 (27.7%) |
| 8 or more Rooms | 589 (22.1%) | 83 (7.5%) |
| Total | 2,663 (100.0%) | 1,103 (100.0%) |
Housing Structure by Heating Type in Robstown
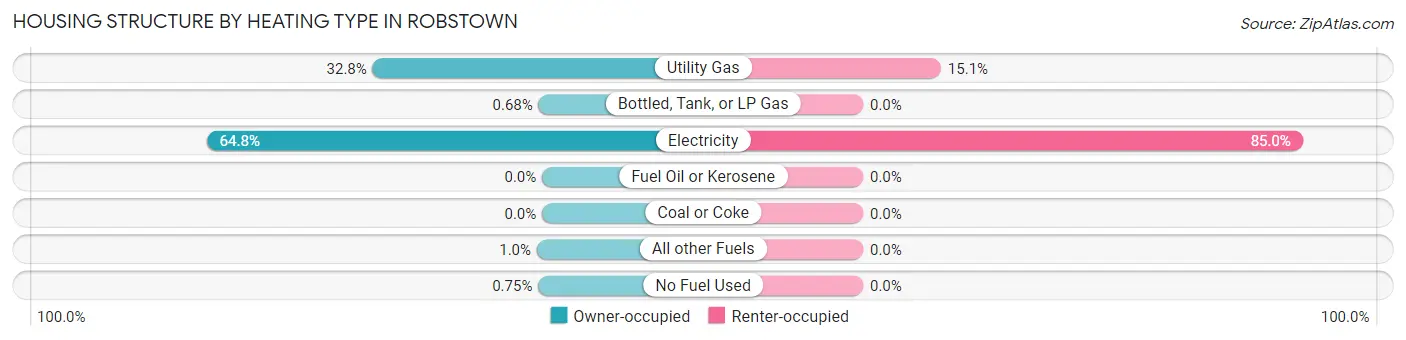
| Heating Type | Owner-occupied | Renter-occupied |
| Utility Gas | 872 (32.8%) | 166 (15.0%) |
| Bottled, Tank, or LP Gas | 18 (0.7%) | 0 (0.0%) |
| Electricity | 1,726 (64.8%) | 937 (85.0%) |
| Fuel Oil or Kerosene | 0 (0.0%) | 0 (0.0%) |
| Coal or Coke | 0 (0.0%) | 0 (0.0%) |
| All other Fuels | 27 (1.0%) | 0 (0.0%) |
| No Fuel Used | 20 (0.7%) | 0 (0.0%) |
| Total | 2,663 (100.0%) | 1,103 (100.0%) |
Household Vehicle Usage in Robstown
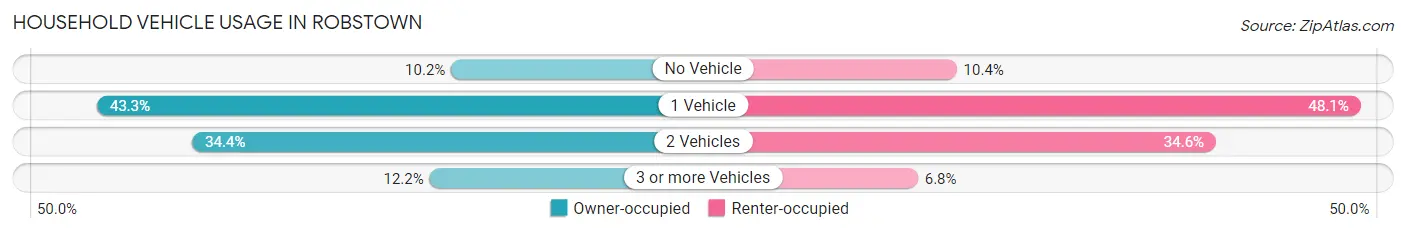
| Vehicles per Household | Owner-occupied | Renter-occupied |
| No Vehicle | 271 (10.2%) | 115 (10.4%) |
| 1 Vehicle | 1,152 (43.3%) | 531 (48.1%) |
| 2 Vehicles | 915 (34.4%) | 382 (34.6%) |
| 3 or more Vehicles | 325 (12.2%) | 75 (6.8%) |
| Total | 2,663 (100.0%) | 1,103 (100.0%) |
Real Estate & Mortgages in Robstown
Real Estate and Mortgage Overview in Robstown
| Characteristic | Without Mortgage | With Mortgage |
| Housing Units | 2,050 | 613 |
| Median Property Value | $67,300 | $106,700 |
| Median Household Income | $25,270 | $93 |
| Monthly Housing Costs | $437 | $17 |
| Real Estate Taxes | $1,496 | $0 |
Property Value by Mortgage Status in Robstown
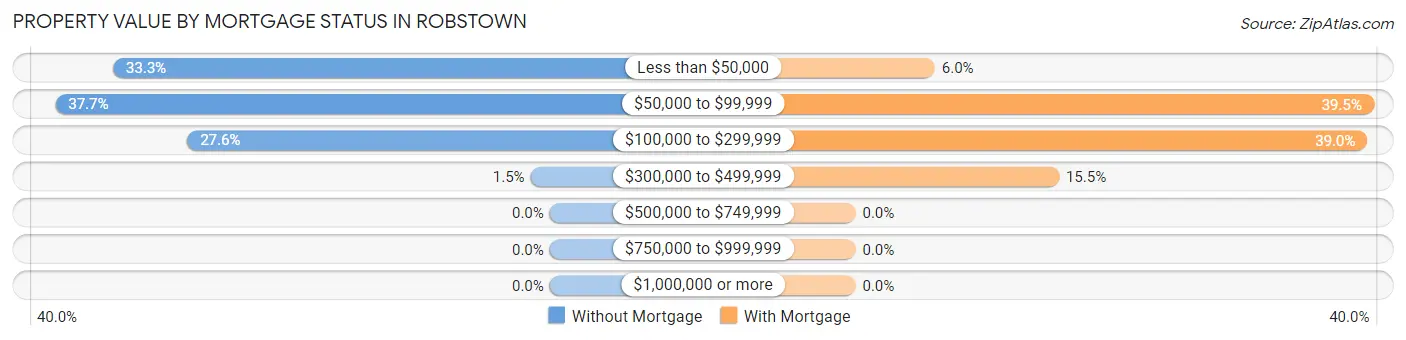
| Property Value | Without Mortgage | With Mortgage |
| Less than $50,000 | 682 (33.3%) | 37 (6.0%) |
| $50,000 to $99,999 | 772 (37.7%) | 242 (39.5%) |
| $100,000 to $299,999 | 566 (27.6%) | 239 (39.0%) |
| $300,000 to $499,999 | 30 (1.5%) | 95 (15.5%) |
| $500,000 to $749,999 | 0 (0.0%) | 0 (0.0%) |
| $750,000 to $999,999 | 0 (0.0%) | 0 (0.0%) |
| $1,000,000 or more | 0 (0.0%) | 0 (0.0%) |
| Total | 2,050 (100.0%) | 613 (100.0%) |
Household Income by Mortgage Status in Robstown
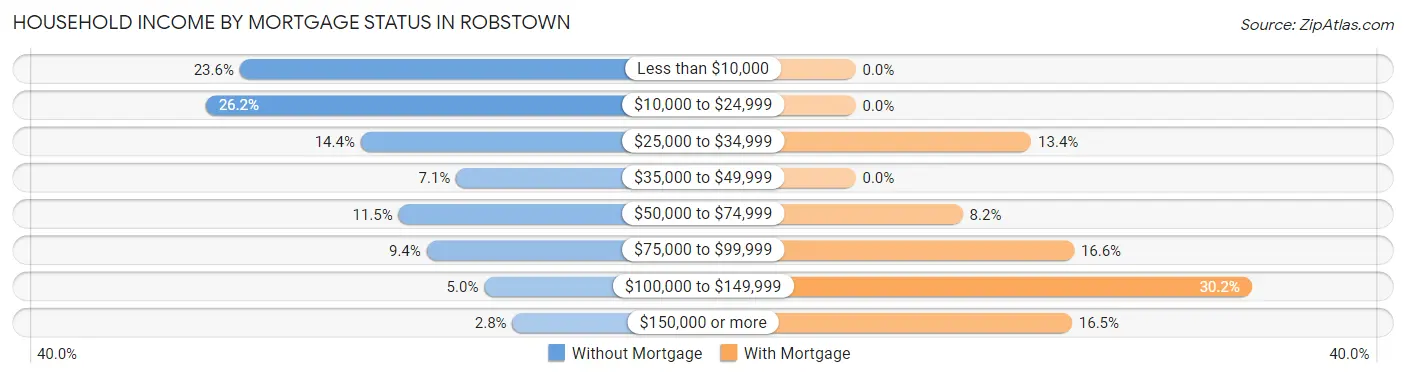
| Household Income | Without Mortgage | With Mortgage |
| Less than $10,000 | 484 (23.6%) | 0 (0.0%) |
| $10,000 to $24,999 | 537 (26.2%) | 0 (0.0%) |
| $25,000 to $34,999 | 295 (14.4%) | 82 (13.4%) |
| $35,000 to $49,999 | 146 (7.1%) | 0 (0.0%) |
| $50,000 to $74,999 | 236 (11.5%) | 50 (8.2%) |
| $75,000 to $99,999 | 192 (9.4%) | 102 (16.6%) |
| $100,000 to $149,999 | 102 (5.0%) | 185 (30.2%) |
| $150,000 or more | 58 (2.8%) | 101 (16.5%) |
| Total | 2,050 (100.0%) | 613 (100.0%) |
Property Value to Household Income Ratio in Robstown
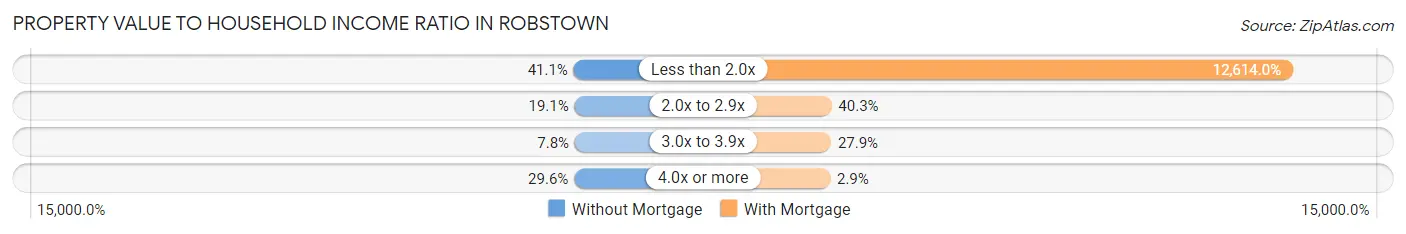
| Value-to-Income Ratio | Without Mortgage | With Mortgage |
| Less than 2.0x | 843 (41.1%) | 77,324 (12,614.0%) |
| 2.0x to 2.9x | 392 (19.1%) | 247 (40.3%) |
| 3.0x to 3.9x | 159 (7.8%) | 171 (27.9%) |
| 4.0x or more | 606 (29.6%) | 18 (2.9%) |
| Total | 2,050 (100.0%) | 613 (100.0%) |
Real Estate Taxes by Mortgage Status in Robstown
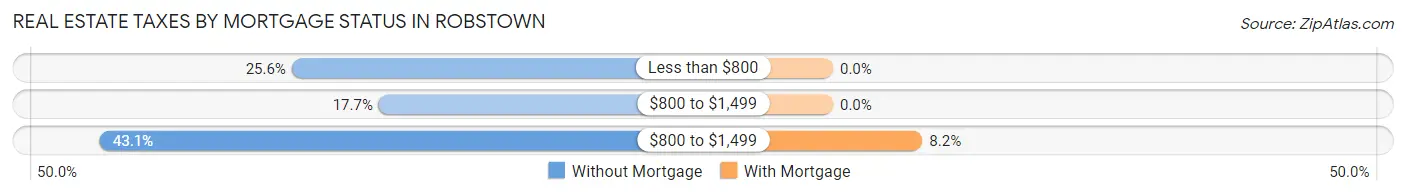
| Property Taxes | Without Mortgage | With Mortgage |
| Less than $800 | 525 (25.6%) | 0 (0.0%) |
| $800 to $1,499 | 362 (17.7%) | 0 (0.0%) |
| $800 to $1,499 | 884 (43.1%) | 50 (8.2%) |
| Total | 2,050 (100.0%) | 613 (100.0%) |
Health & Disability in Robstown
Health Insurance Coverage by Age in Robstown
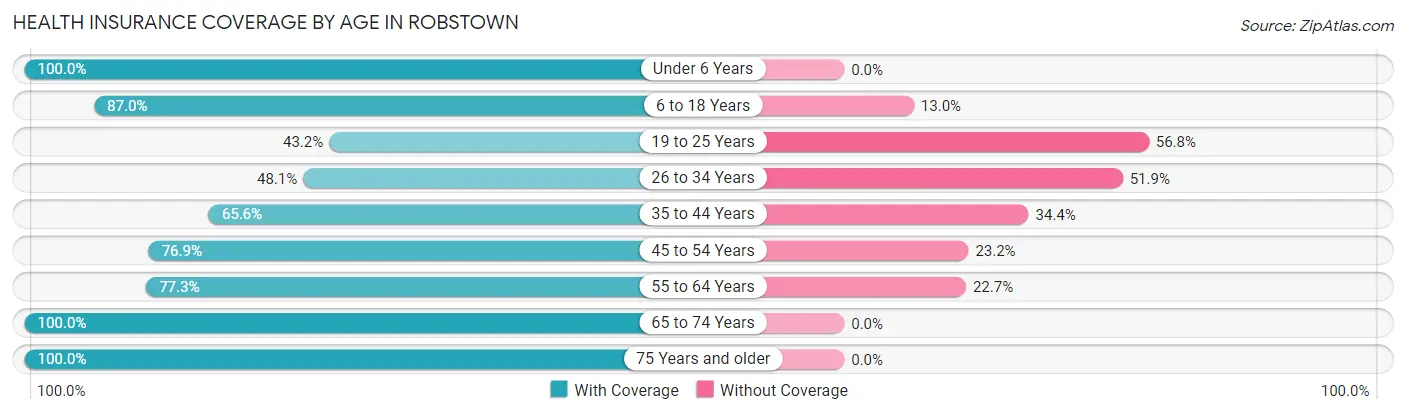
| Age Bracket | With Coverage | Without Coverage |
| Under 6 Years | 688 (100.0%) | 0 (0.0%) |
| 6 to 18 Years | 1,455 (87.0%) | 217 (13.0%) |
| 19 to 25 Years | 523 (43.2%) | 687 (56.8%) |
| 26 to 34 Years | 363 (48.1%) | 392 (51.9%) |
| 35 to 44 Years | 842 (65.6%) | 441 (34.4%) |
| 45 to 54 Years | 747 (76.8%) | 225 (23.2%) |
| 55 to 64 Years | 879 (77.3%) | 258 (22.7%) |
| 65 to 74 Years | 1,149 (100.0%) | 0 (0.0%) |
| 75 Years and older | 1,316 (100.0%) | 0 (0.0%) |
| Total | 7,962 (78.2%) | 2,220 (21.8%) |
Health Insurance Coverage by Citizenship Status in Robstown
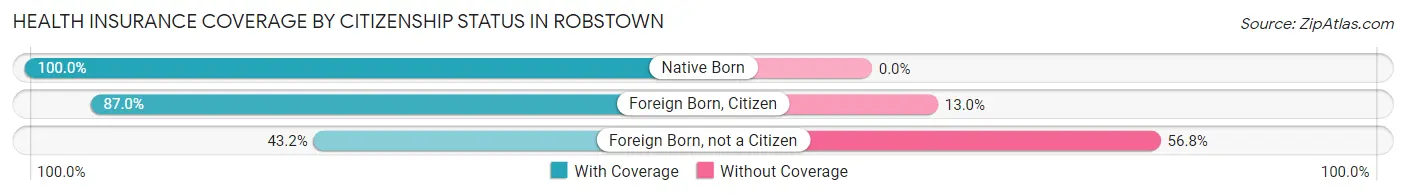
| Citizenship Status | With Coverage | Without Coverage |
| Native Born | 688 (100.0%) | 0 (0.0%) |
| Foreign Born, Citizen | 1,455 (87.0%) | 217 (13.0%) |
| Foreign Born, not a Citizen | 523 (43.2%) | 687 (56.8%) |
Health Insurance Coverage by Household Income in Robstown
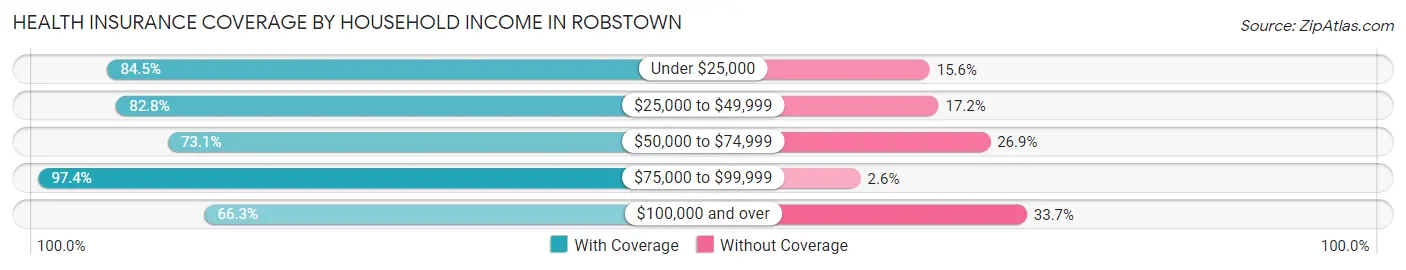
| Household Income | With Coverage | Without Coverage |
| Under $25,000 | 2,324 (84.5%) | 428 (15.5%) |
| $25,000 to $49,999 | 1,575 (82.8%) | 327 (17.2%) |
| $50,000 to $74,999 | 1,200 (73.1%) | 441 (26.9%) |
| $75,000 to $99,999 | 898 (97.4%) | 24 (2.6%) |
| $100,000 and over | 1,940 (66.3%) | 988 (33.7%) |
Public vs Private Health Insurance Coverage by Age in Robstown
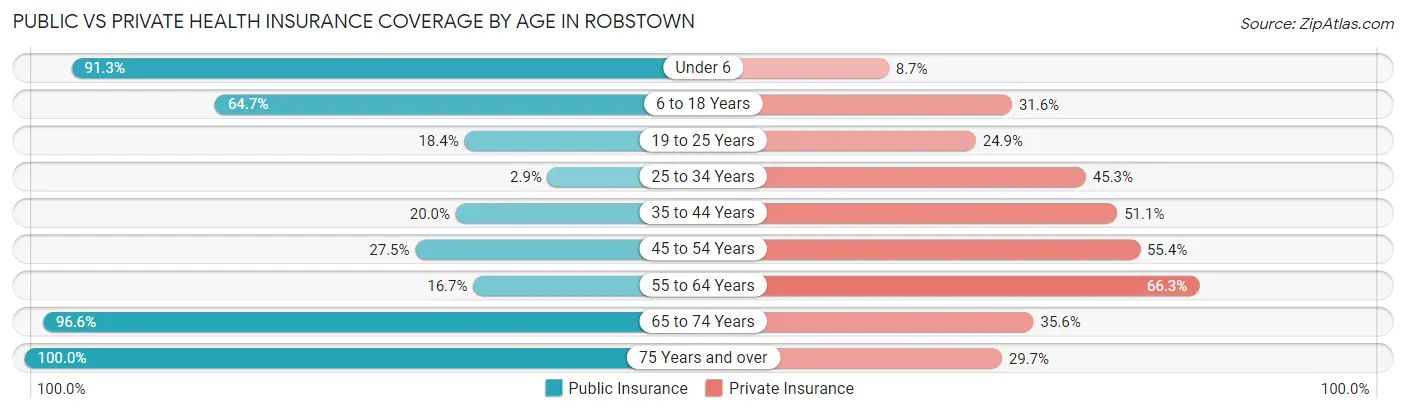
| Age Bracket | Public Insurance | Private Insurance |
| Under 6 | 628 (91.3%) | 60 (8.7%) |
| 6 to 18 Years | 1,081 (64.6%) | 528 (31.6%) |
| 19 to 25 Years | 222 (18.3%) | 301 (24.9%) |
| 25 to 34 Years | 22 (2.9%) | 342 (45.3%) |
| 35 to 44 Years | 256 (20.0%) | 656 (51.1%) |
| 45 to 54 Years | 267 (27.5%) | 538 (55.3%) |
| 55 to 64 Years | 190 (16.7%) | 754 (66.3%) |
| 65 to 74 Years | 1,110 (96.6%) | 409 (35.6%) |
| 75 Years and over | 1,316 (100.0%) | 391 (29.7%) |
| Total | 5,092 (50.0%) | 3,979 (39.1%) |
Disability Status by Sex by Age in Robstown
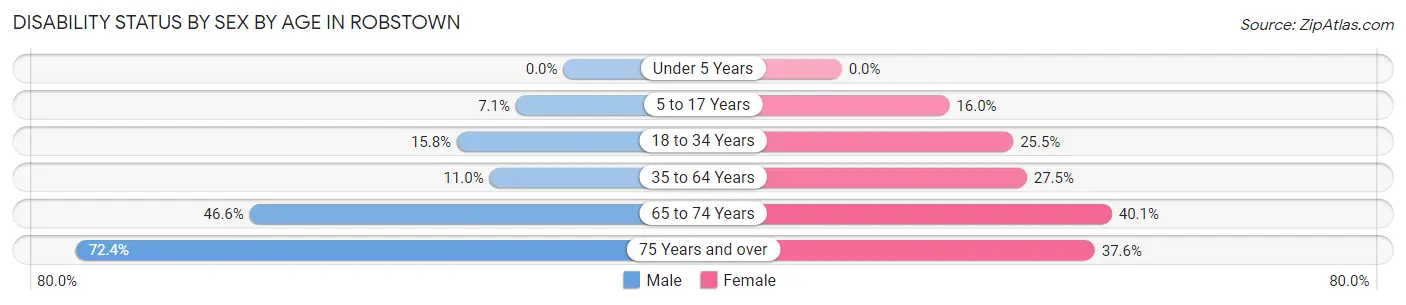
| Age Bracket | Male | Female |
| Under 5 Years | 0 (0.0%) | 0 (0.0%) |
| 5 to 17 Years | 68 (7.1%) | 112 (16.0%) |
| 18 to 34 Years | 191 (15.8%) | 211 (25.5%) |
| 35 to 64 Years | 175 (11.0%) | 493 (27.5%) |
| 65 to 74 Years | 239 (46.6%) | 255 (40.1%) |
| 75 Years and over | 126 (72.4%) | 429 (37.6%) |
Disability Class by Sex by Age in Robstown
Disability Class: Hearing Difficulty
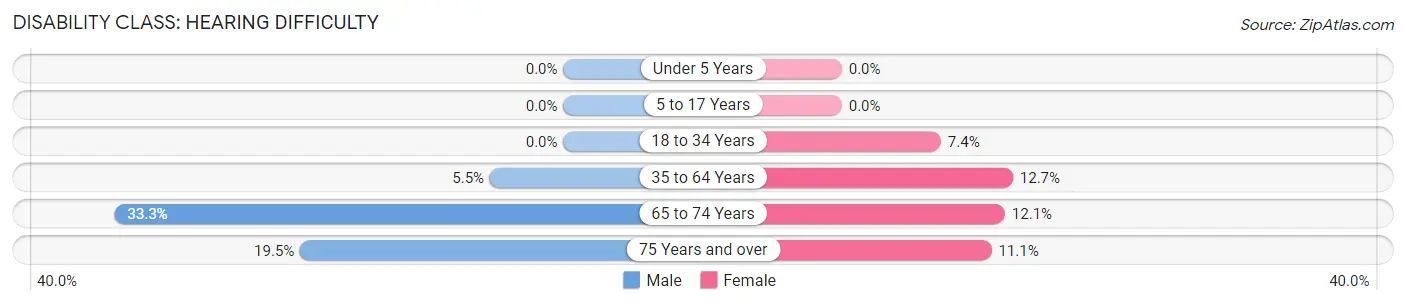
| Age Bracket | Male | Female |
| Under 5 Years | 0 (0.0%) | 0 (0.0%) |
| 5 to 17 Years | 0 (0.0%) | 0 (0.0%) |
| 18 to 34 Years | 0 (0.0%) | 61 (7.4%) |
| 35 to 64 Years | 87 (5.4%) | 228 (12.7%) |
| 65 to 74 Years | 171 (33.3%) | 77 (12.1%) |
| 75 Years and over | 34 (19.5%) | 127 (11.1%) |
Disability Class: Vision Difficulty
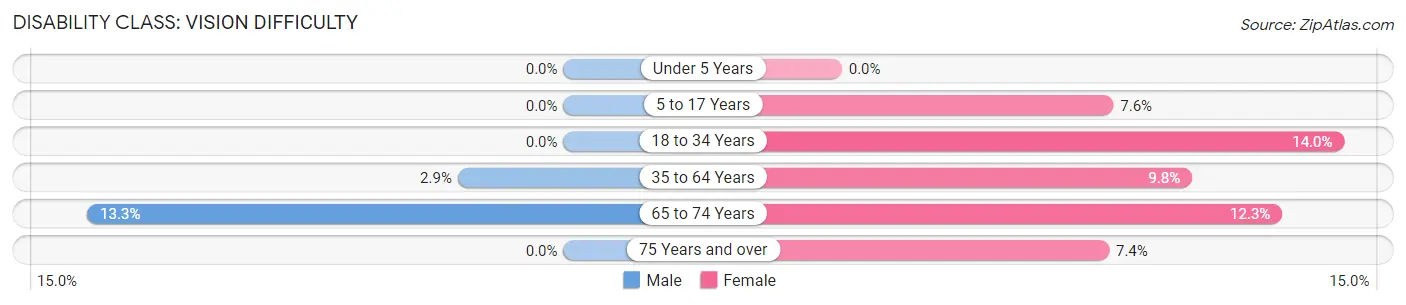
| Age Bracket | Male | Female |
| Under 5 Years | 0 (0.0%) | 0 (0.0%) |
| 5 to 17 Years | 0 (0.0%) | 53 (7.6%) |
| 18 to 34 Years | 0 (0.0%) | 116 (14.0%) |
| 35 to 64 Years | 47 (2.9%) | 175 (9.8%) |
| 65 to 74 Years | 68 (13.3%) | 78 (12.3%) |
| 75 Years and over | 0 (0.0%) | 85 (7.4%) |
Disability Class: Cognitive Difficulty
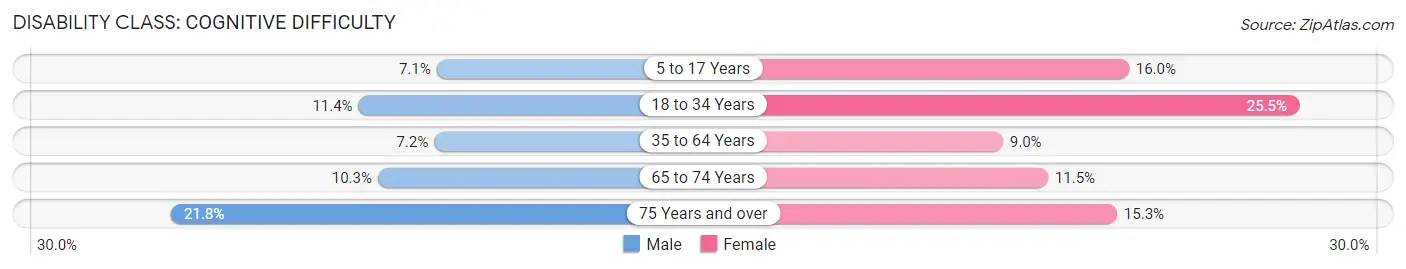
| Age Bracket | Male | Female |
| 5 to 17 Years | 68 (7.1%) | 112 (16.0%) |
| 18 to 34 Years | 138 (11.4%) | 211 (25.5%) |
| 35 to 64 Years | 115 (7.2%) | 161 (9.0%) |
| 65 to 74 Years | 53 (10.3%) | 73 (11.5%) |
| 75 Years and over | 38 (21.8%) | 175 (15.3%) |
Disability Class: Ambulatory Difficulty
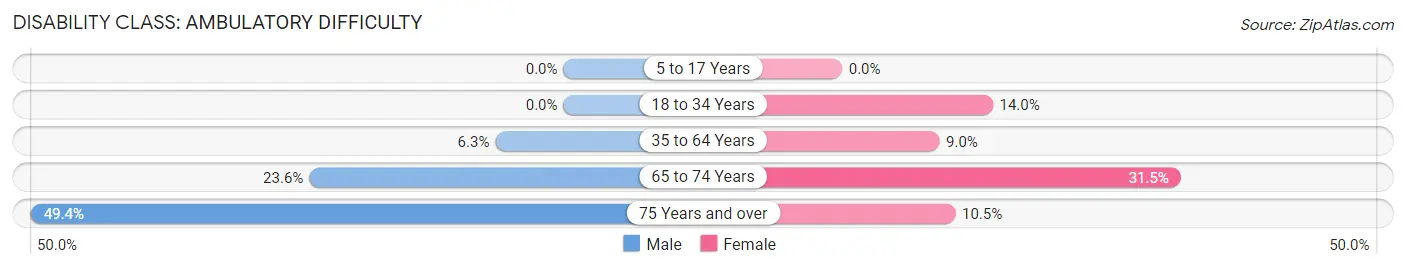
| Age Bracket | Male | Female |
| 5 to 17 Years | 0 (0.0%) | 0 (0.0%) |
| 18 to 34 Years | 0 (0.0%) | 116 (14.0%) |
| 35 to 64 Years | 101 (6.3%) | 162 (9.0%) |
| 65 to 74 Years | 121 (23.6%) | 200 (31.5%) |
| 75 Years and over | 86 (49.4%) | 120 (10.5%) |
Disability Class: Self-Care Difficulty
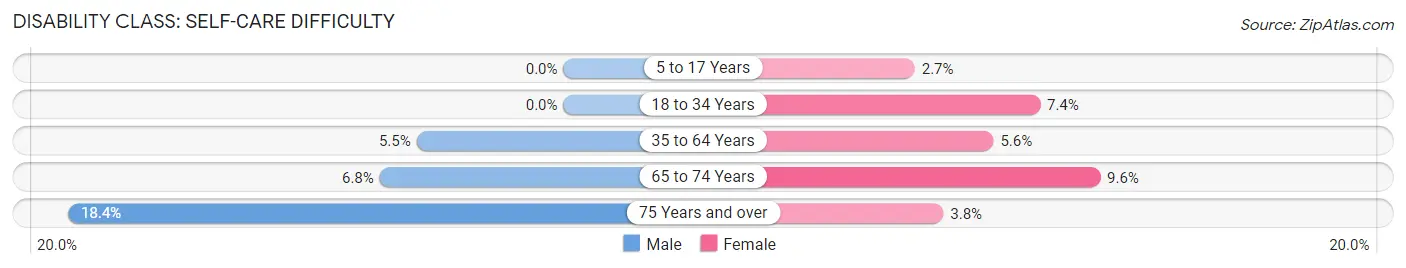
| Age Bracket | Male | Female |
| 5 to 17 Years | 0 (0.0%) | 19 (2.7%) |
| 18 to 34 Years | 0 (0.0%) | 61 (7.4%) |
| 35 to 64 Years | 87 (5.4%) | 101 (5.6%) |
| 65 to 74 Years | 35 (6.8%) | 61 (9.6%) |
| 75 Years and over | 32 (18.4%) | 43 (3.8%) |
Technology Access in Robstown
Computing Device Access in Robstown
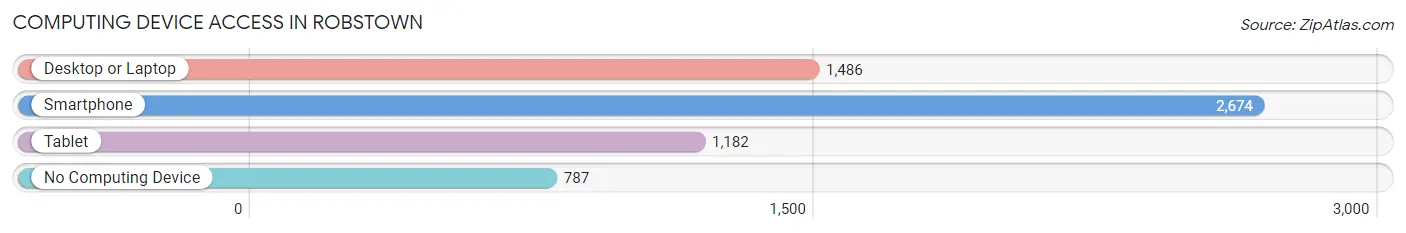
| Device Type | # Households | % Households |
| Desktop or Laptop | 1,486 | 39.5% |
| Smartphone | 2,674 | 71.0% |
| Tablet | 1,182 | 31.4% |
| No Computing Device | 787 | 20.9% |
| Total | 3,766 | 100.0% |
Internet Access in Robstown
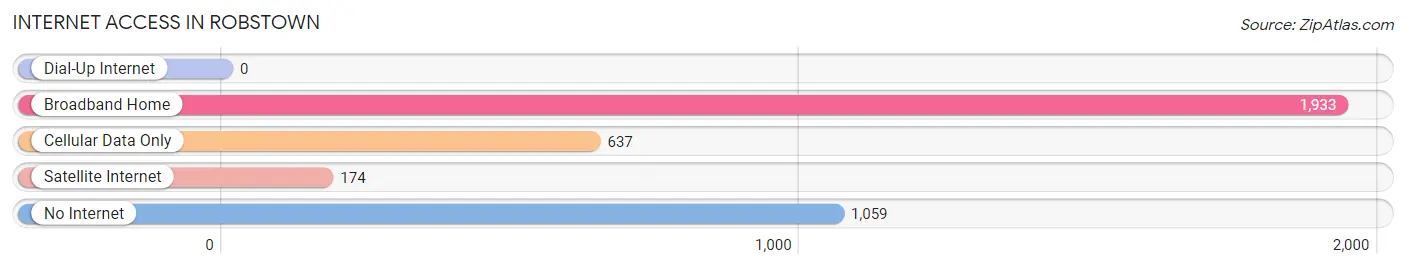
| Internet Type | # Households | % Households |
| Dial-Up Internet | 0 | 0.0% |
| Broadband Home | 1,933 | 51.3% |
| Cellular Data Only | 637 | 16.9% |
| Satellite Internet | 174 | 4.6% |
| No Internet | 1,059 | 28.1% |
| Total | 3,766 | 100.0% |
Robstown Summary
Robstown, Texas is a small city located in Nueces County, Texas. It is situated about 30 miles west of Corpus Christi and is part of the Corpus Christi Metropolitan Statistical Area. The city was founded in 1906 and is named after John Henry Robson, a local rancher. As of the 2010 census, the population of Robstown was 11,267.
Geography
Robstown is located at 27°48'N 97°37'W (27.8, -97.6). It is situated in the Coastal Bend region of Texas, near the Gulf of Mexico. The city has a total area of 4.3 square miles, all of which is land. The climate is humid subtropical, with hot summers and mild winters.
Economy
Robstown’s economy is largely based on agriculture and oil production. The city is home to several large cotton gins, as well as a number of oil refineries and related industries. The city also has a large retail sector, with several shopping centers and a variety of restaurants.
Demographics
As of the 2010 census, the population of Robstown was 11,267. The racial makeup of the city was 77.3% White, 0.7% African American, 0.7% Native American, 0.3% Asian, 0.1% Pacific Islander, 19.2% from other races, and 2.0% from two or more races. Hispanic or Latino of any race were 81.2% of the population.
The median income for a household in Robstown was $30,917, and the median income for a family was $35,917. About 24.2% of families and 28.2% of the population were below the poverty line, including 37.2% of those under age 18 and 24.2% of those age 65 or over.
History
Robstown was founded in 1906 by John Henry Robson, a local rancher. The city was incorporated in 1911 and was named after Robson. In the early 20th century, Robstown was a major center for cotton production and processing. The city was also home to several oil refineries, which provided jobs for many of the city’s residents.
In the 1950s, Robstown was the site of a major oil spill, which caused significant environmental damage to the area. The spill was eventually cleaned up, but the damage to the environment was long-lasting.
In the late 20th century, Robstown experienced a period of economic decline, as the oil industry began to decline and the cotton industry moved away from the area. However, the city has since seen a resurgence in economic activity, with the opening of several new businesses and the expansion of existing ones.
Robstown is now a vibrant and diverse city, with a strong economy and a growing population. The city is home to a variety of cultural attractions, including the Robstown Cotton Gin Museum, the Robstown Historical Museum, and the Robstown Arts Center. The city is also home to a number of parks and recreational facilities, including the Robstown City Park and the Robstown Golf Course.
Common Questions
What is Per Capita Income in Robstown?
Per Capita income in Robstown is $21,670.
What is the Median Family Income in Robstown?
Median Family Income in Robstown is $56,947.
What is the Median Household income in Robstown?
Median Household Income in Robstown is $35,417.
What is Income or Wage Gap in Robstown?
Income or Wage Gap in Robstown is 38.1%.
Women in Robstown earn 61.9 cents for every dollar earned by a man.
What is Family Income Deficit in Robstown?
Family Income Deficit in Robstown is $9,167.
Families that are below poverty line in Robstown earn $9,167 less on average than the poverty threshold level.
What is Inequality or Gini Index in Robstown?
Inequality or Gini Index in Robstown is 0.51.
What is the Total Population of Robstown?
Total Population of Robstown is 10,246.
What is the Total Male Population of Robstown?
Total Male Population of Robstown is 4,829.
What is the Total Female Population of Robstown?
Total Female Population of Robstown is 5,417.
What is the Ratio of Males per 100 Females in Robstown?
There are 89.15 Males per 100 Females in Robstown.
What is the Ratio of Females per 100 Males in Robstown?
There are 112.18 Females per 100 Males in Robstown.
What is the Median Population Age in Robstown?
Median Population Age in Robstown is 42.1 Years.
What is the Average Family Size in Robstown
Average Family Size in Robstown is 3.4 People.
What is the Average Household Size in Robstown
Average Household Size in Robstown is 2.7 People.
How Large is the Labor Force in Robstown?
There are 4,474 People in the Labor Forcein in Robstown.
What is the Percentage of People in the Labor Force in Robstown?
53.5% of People are in the Labor Force in Robstown.
What is the Unemployment Rate in Robstown?
Unemployment Rate in Robstown is 10.3%.