Zip Codes with the Highest Percentage of Population with a Degree in Science and Engineering in Tennessee
RELATED REPORTS & OPTIONS
Science and Engineering
Tennessee
Compare Zip Codes
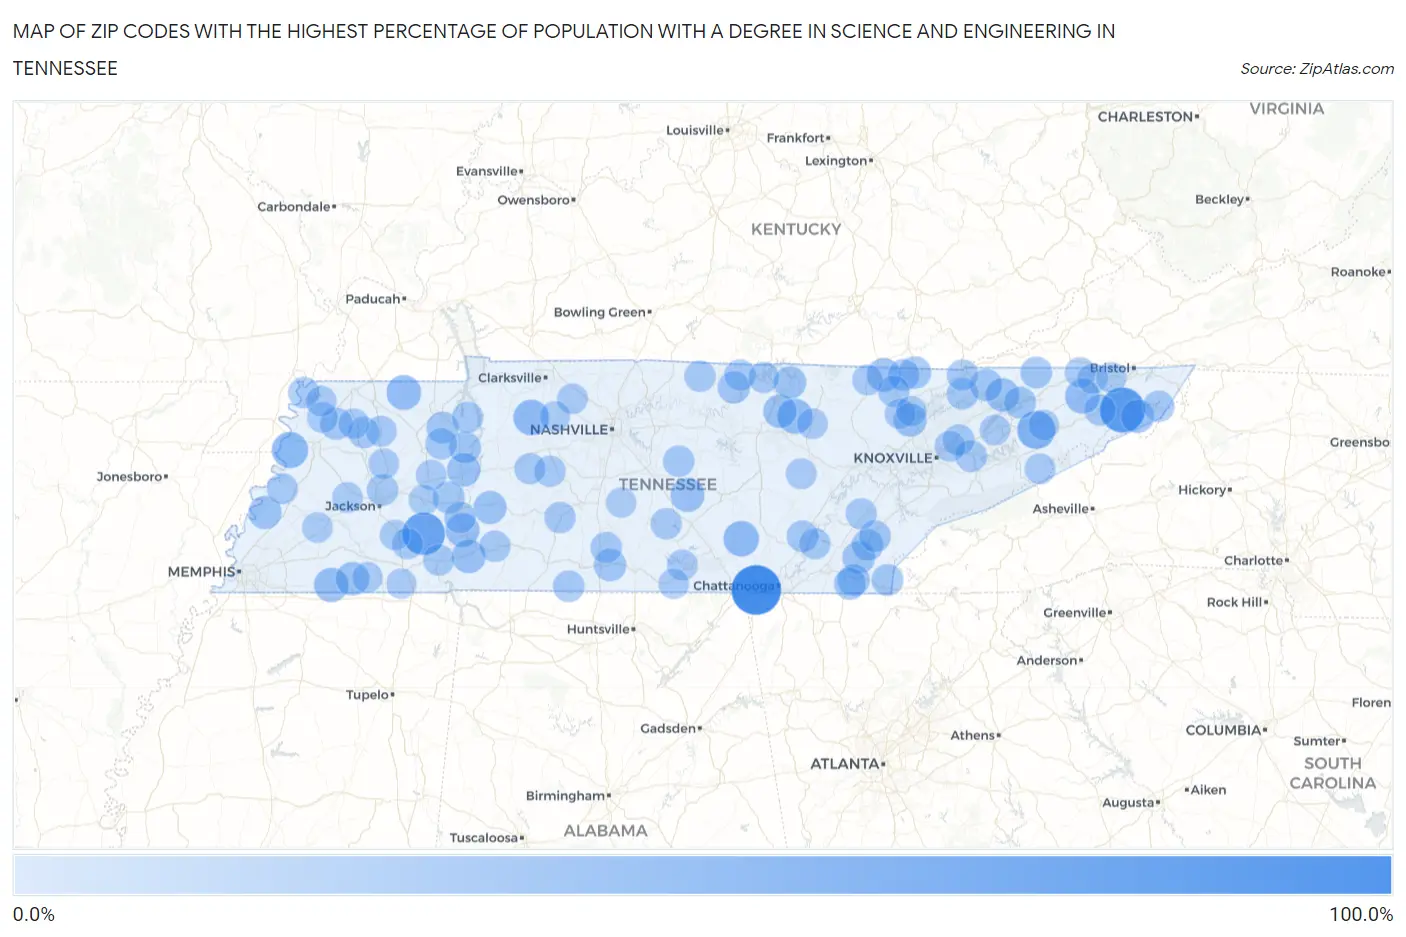
Map of Zip Codes with the Highest Percentage of Population with a Degree in Science and Engineering in Tennessee
0.0%
100.0%
Zip Codes with the Highest Percentage of Population with a Degree in Science and Engineering in Tennessee
| Zip Code | % Graduates | vs State | vs National | |
| 1. | 37396 | 100.0% | 10.9%(+89.1)#1 | 9.8%(+90.2)#52 |
| 2. | 37682 | 80.0% | 10.9%(+69.1)#2 | 9.8%(+70.2)#134 |
| 3. | 38332 | 68.7% | 10.9%(+57.8)#3 | 9.8%(+58.9)#186 |
| 4. | 37809 | 49.5% | 10.9%(+38.5)#4 | 9.8%(+39.7)#429 |
| 5. | 38030 | 41.9% | 10.9%(+31.0)#5 | 9.8%(+32.2)#607 |
| 6. | 37181 | 39.3% | 10.9%(+28.4)#6 | 9.8%(+29.5)#701 |
| 7. | 37339 | 39.0% | 10.9%(+28.1)#7 | 9.8%(+29.2)#714 |
| 8. | 38554 | 37.0% | 10.9%(+26.0)#8 | 9.8%(+27.2)#810 |
| 9. | 38241 | 35.7% | 10.9%(+24.8)#9 | 9.8%(+25.9)#887 |
| 10. | 37656 | 35.3% | 10.9%(+24.4)#10 | 9.8%(+25.5)#916 |
| 11. | 38046 | 33.3% | 10.9%(+22.4)#11 | 9.8%(+23.6)#1,069 |
| 12. | 38311 | 32.2% | 10.9%(+21.3)#12 | 9.8%(+22.4)#1,120 |
| 13. | 37026 | 32.2% | 10.9%(+21.3)#13 | 9.8%(+22.4)#1,122 |
| 14. | 38475 | 31.9% | 10.9%(+21.0)#14 | 9.8%(+22.2)#1,141 |
| 15. | 37892 | 31.6% | 10.9%(+20.7)#15 | 9.8%(+21.8)#1,163 |
| 16. | 38067 | 30.9% | 10.9%(+19.9)#16 | 9.8%(+21.1)#1,234 |
| 17. | 37769 | 30.4% | 10.9%(+19.4)#17 | 9.8%(+20.6)#1,280 |
| 18. | 38580 | 30.1% | 10.9%(+19.2)#18 | 9.8%(+20.3)#1,302 |
| 19. | 38341 | 29.7% | 10.9%(+18.8)#19 | 9.8%(+19.9)#1,341 |
| 20. | 37881 | 29.5% | 10.9%(+18.6)#20 | 9.8%(+19.7)#1,359 |
| 21. | 37658 | 29.3% | 10.9%(+18.3)#21 | 9.8%(+19.5)#1,384 |
| 22. | 38015 | 29.1% | 10.9%(+18.2)#22 | 9.8%(+19.4)#1,402 |
| 23. | 37096 | 28.4% | 10.9%(+17.5)#23 | 9.8%(+18.6)#1,482 |
| 24. | 37325 | 27.1% | 10.9%(+16.2)#24 | 9.8%(+17.3)#1,649 |
| 25. | 38573 | 26.2% | 10.9%(+15.3)#25 | 9.8%(+16.5)#1,755 |
| 26. | 38459 | 26.2% | 10.9%(+15.3)#26 | 9.8%(+16.4)#1,765 |
| 27. | 37762 | 25.4% | 10.9%(+14.5)#27 | 9.8%(+15.6)#1,879 |
| 28. | 37879 | 25.3% | 10.9%(+14.4)#28 | 9.8%(+15.5)#1,893 |
| 29. | 38588 | 25.3% | 10.9%(+14.3)#29 | 9.8%(+15.5)#1,903 |
| 30. | 38259 | 25.0% | 10.9%(+14.1)#30 | 9.8%(+15.2)#1,952 |
| 31. | 38328 | 24.5% | 10.9%(+13.6)#31 | 9.8%(+14.7)#2,062 |
| 32. | 38320 | 24.4% | 10.9%(+13.5)#32 | 9.8%(+14.6)#2,079 |
| 33. | 37361 | 24.1% | 10.9%(+13.2)#33 | 9.8%(+14.3)#2,132 |
| 34. | 37362 | 24.1% | 10.9%(+13.2)#34 | 9.8%(+14.3)#2,135 |
| 35. | 37811 | 23.8% | 10.9%(+12.9)#35 | 9.8%(+14.0)#2,205 |
| 36. | 37331 | 23.3% | 10.9%(+12.3)#36 | 9.8%(+13.5)#2,328 |
| 37. | 38236 | 23.2% | 10.9%(+12.3)#37 | 9.8%(+13.4)#2,336 |
| 38. | 37765 | 23.1% | 10.9%(+12.2)#38 | 9.8%(+13.3)#2,366 |
| 39. | 37391 | 23.0% | 10.9%(+12.1)#39 | 9.8%(+13.3)#2,381 |
| 40. | 37329 | 22.9% | 10.9%(+12.0)#40 | 9.8%(+13.2)#2,398 |
| 41. | 37819 | 22.7% | 10.9%(+11.8)#41 | 9.8%(+12.9)#2,451 |
| 42. | 38473 | 22.6% | 10.9%(+11.7)#42 | 9.8%(+12.8)#2,482 |
| 43. | 38362 | 22.6% | 10.9%(+11.6)#43 | 9.8%(+12.8)#2,494 |
| 44. | 38317 | 22.5% | 10.9%(+11.6)#44 | 9.8%(+12.7)#2,511 |
| 45. | 37373 | 22.3% | 10.9%(+11.4)#45 | 9.8%(+12.6)#2,543 |
| 46. | 37764 | 22.2% | 10.9%(+11.3)#46 | 9.8%(+12.4)#2,606 |
| 47. | 37825 | 22.1% | 10.9%(+11.2)#47 | 9.8%(+12.3)#2,617 |
| 48. | 37806 | 22.0% | 10.9%(+11.1)#48 | 9.8%(+12.2)#2,650 |
| 49. | 37118 | 22.0% | 10.9%(+11.0)#49 | 9.8%(+12.2)#2,653 |
| 50. | 37847 | 21.6% | 10.9%(+10.7)#50 | 9.8%(+11.8)#2,744 |
| 51. | 38474 | 21.5% | 10.9%(+10.6)#51 | 9.8%(+11.7)#2,782 |
| 52. | 37047 | 21.4% | 10.9%(+10.5)#52 | 9.8%(+11.6)#2,795 |
| 53. | 37659 | 21.4% | 10.9%(+10.5)#53 | 9.8%(+11.6)#2,821 |
| 54. | 38329 | 21.4% | 10.9%(+10.5)#54 | 9.8%(+11.6)#2,823 |
| 55. | 38369 | 21.4% | 10.9%(+10.5)#55 | 9.8%(+11.6)#2,829 |
| 56. | 38327 | 21.2% | 10.9%(+10.3)#56 | 9.8%(+11.4)#2,882 |
| 57. | 38485 | 21.2% | 10.9%(+10.2)#57 | 9.8%(+11.4)#2,902 |
| 58. | 37098 | 21.1% | 10.9%(+10.2)#58 | 9.8%(+11.3)#2,922 |
| 59. | 37083 | 21.1% | 10.9%(+10.2)#59 | 9.8%(+11.3)#2,935 |
| 60. | 38221 | 21.0% | 10.9%(+10.1)#60 | 9.8%(+11.2)#2,953 |
| 61. | 38575 | 21.0% | 10.9%(+10.1)#61 | 9.8%(+11.2)#2,957 |
| 62. | 37724 | 21.0% | 10.9%(+10.1)#62 | 9.8%(+11.2)#2,960 |
| 63. | 37640 | 20.9% | 10.9%(+9.96)#63 | 9.8%(+11.1)#3,003 |
| 64. | 37183 | 20.8% | 10.9%(+9.91)#64 | 9.8%(+11.1)#3,018 |
| 65. | 37137 | 20.6% | 10.9%(+9.72)#65 | 9.8%(+10.9)#3,094 |
| 66. | 37308 | 20.4% | 10.9%(+9.50)#66 | 9.8%(+10.6)#3,174 |
| 67. | 38079 | 20.3% | 10.9%(+9.37)#67 | 9.8%(+10.5)#3,228 |
| 68. | 37826 | 20.3% | 10.9%(+9.34)#68 | 9.8%(+10.5)#3,242 |
| 69. | 38334 | 19.9% | 10.9%(+8.98)#69 | 9.8%(+10.1)#3,413 |
| 70. | 38551 | 19.8% | 10.9%(+8.84)#70 | 9.8%(+9.98)#3,457 |
| 71. | 38230 | 19.6% | 10.9%(+8.68)#71 | 9.8%(+9.82)#3,517 |
| 72. | 37398 | 19.6% | 10.9%(+8.63)#72 | 9.8%(+9.77)#3,541 |
| 73. | 38240 | 19.4% | 10.9%(+8.50)#73 | 9.8%(+9.64)#3,606 |
| 74. | 37727 | 19.3% | 10.9%(+8.37)#74 | 9.8%(+9.50)#3,656 |
| 75. | 37924 | 19.3% | 10.9%(+8.35)#75 | 9.8%(+9.48)#3,667 |
| 76. | 38063 | 19.1% | 10.9%(+8.13)#76 | 9.8%(+9.27)#3,767 |
| 77. | 38006 | 18.8% | 10.9%(+7.91)#77 | 9.8%(+9.05)#3,874 |
| 78. | 38553 | 18.8% | 10.9%(+7.91)#78 | 9.8%(+9.05)#3,875 |
| 79. | 37841 | 18.8% | 10.9%(+7.85)#79 | 9.8%(+8.98)#3,905 |
| 80. | 38572 | 18.7% | 10.9%(+7.82)#80 | 9.8%(+8.96)#3,925 |
| 81. | 38358 | 18.7% | 10.9%(+7.80)#81 | 9.8%(+8.94)#3,932 |
| 82. | 38069 | 18.6% | 10.9%(+7.65)#82 | 9.8%(+8.79)#4,012 |
| 83. | 37035 | 18.4% | 10.9%(+7.45)#83 | 9.8%(+8.59)#4,103 |
| 84. | 38233 | 18.3% | 10.9%(+7.42)#84 | 9.8%(+8.56)#4,120 |
| 85. | 38232 | 18.2% | 10.9%(+7.32)#85 | 9.8%(+8.46)#4,160 |
| 86. | 37714 | 18.1% | 10.9%(+7.20)#86 | 9.8%(+8.34)#4,253 |
| 87. | 38390 | 18.0% | 10.9%(+7.08)#87 | 9.8%(+8.22)#4,320 |
| 88. | 37645 | 18.0% | 10.9%(+7.07)#88 | 9.8%(+8.20)#4,333 |
| 89. | 37877 | 18.0% | 10.9%(+7.06)#89 | 9.8%(+8.20)#4,335 |
| 90. | 37757 | 17.9% | 10.9%(+6.93)#90 | 9.8%(+8.07)#4,404 |
| 91. | 38052 | 17.8% | 10.9%(+6.93)#91 | 9.8%(+8.07)#4,406 |
| 92. | 38351 | 17.8% | 10.9%(+6.88)#92 | 9.8%(+8.02)#4,429 |
| 93. | 37036 | 17.7% | 10.9%(+6.81)#93 | 9.8%(+7.94)#4,462 |
| 94. | 37818 | 17.6% | 10.9%(+6.73)#94 | 9.8%(+7.87)#4,499 |
| 95. | 37345 | 17.6% | 10.9%(+6.67)#95 | 9.8%(+7.81)#4,555 |
| 96. | 38340 | 17.6% | 10.9%(+6.65)#96 | 9.8%(+7.79)#4,571 |
| 97. | 37660 | 17.2% | 10.9%(+6.26)#97 | 9.8%(+7.40)#4,797 |
| 98. | 37617 | 17.2% | 10.9%(+6.25)#98 | 9.8%(+7.38)#4,807 |
| 99. | 37034 | 17.1% | 10.9%(+6.21)#99 | 9.8%(+7.35)#4,845 |
| 100. | 38367 | 17.1% | 10.9%(+6.15)#100 | 9.8%(+7.29)#4,889 |
Common Questions
What are the Top 10 Zip Codes with the Highest Percentage of Population with a Degree in Science and Engineering in Tennessee?
Top 10 Zip Codes with the Highest Percentage of Population with a Degree in Science and Engineering in Tennessee are:
What zip code has the Highest Percentage of Population with a Degree in Science and Engineering in Tennessee?
37396 has the Highest Percentage of Population with a Degree in Science and Engineering in Tennessee with 100.0%.
What is the Percentage of Population with a Degree in Science and Engineering in the State of Tennessee?
Percentage of Population with a Degree in Science and Engineering in Tennessee is 10.9%.
What is the Percentage of Population with a Degree in Science and Engineering in the United States?
Percentage of Population with a Degree in Science and Engineering in the United States is 9.8%.