Grass Valley, OR Map & Demographics
Grass Valley Map
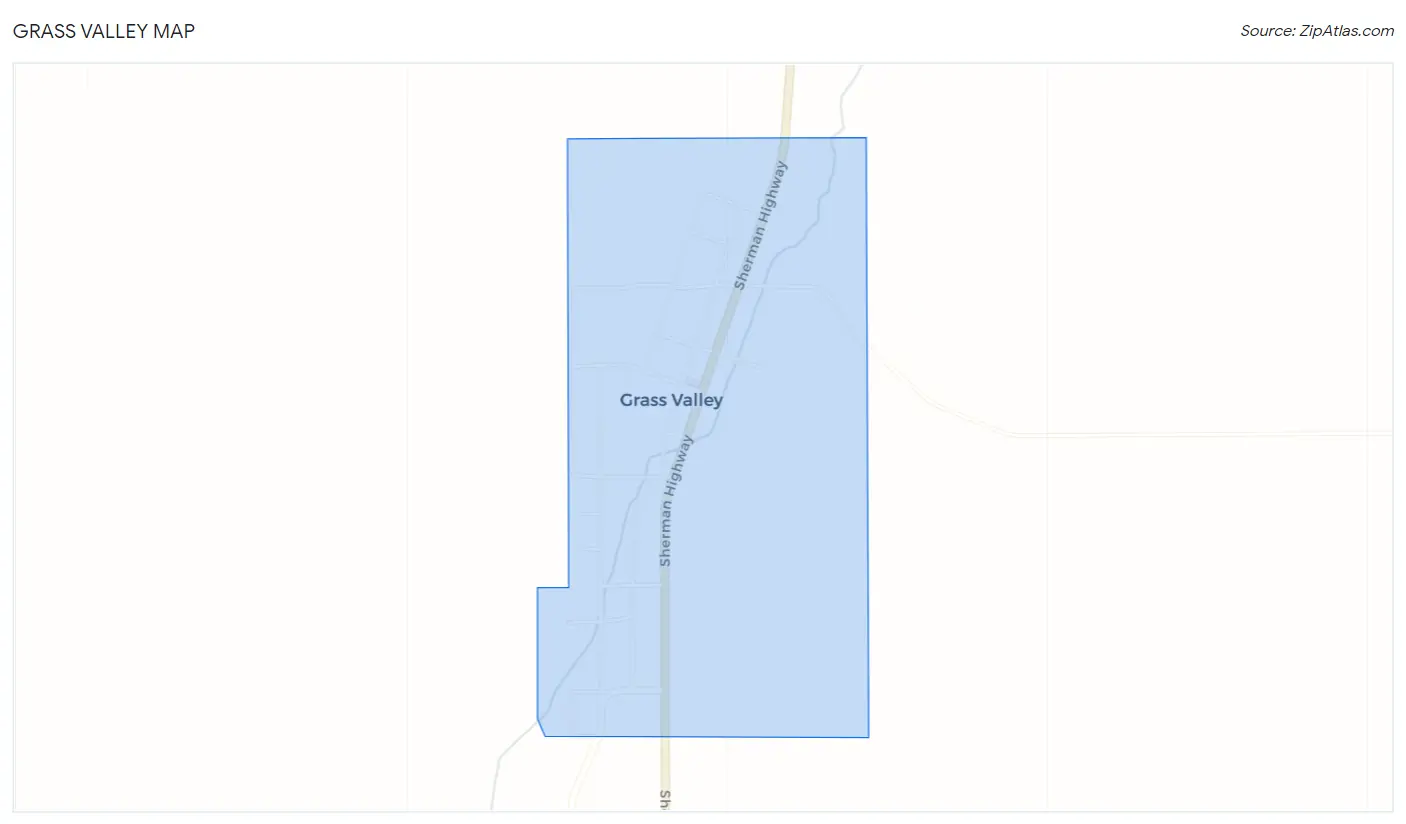
Grass Valley Overview
$22,034
PER CAPITA INCOME
$57,292
AVG FAMILY INCOME
$55,982
AVG HOUSEHOLD INCOME
0.33
INEQUALITY / GINI INDEX
278
TOTAL POPULATION
117
MALE POPULATION
161
FEMALE POPULATION
72.67
MALES / 100 FEMALES
137.61
FEMALES / 100 MALES
32.8
MEDIAN AGE
3.6
AVG FAMILY SIZE
2.9
AVG HOUSEHOLD SIZE
121
LABOR FORCE [ PEOPLE ]
52.8%
PERCENT IN LABOR FORCE
0.8%
UNEMPLOYMENT RATE
Grass Valley Zip Codes
Grass Valley Area Codes
Income in Grass Valley
Income Overview in Grass Valley
Per Capita Income in Grass Valley is $22,034, while median incomes of families and households are $57,292 and $55,982 respectively.
| Characteristic | Number | Measure |
| Per Capita Income | 278 | $22,034 |
| Median Family Income | 57 | $57,292 |
| Mean Family Income | 57 | $65,796 |
| Median Household Income | 92 | $55,982 |
| Mean Household Income | 92 | $57,339 |
| Income Deficit | 57 | $0 |
| Wage / Income Gap (%) | 278 | 0.00% |
| Wage / Income Gap ($) | 278 | 100.00¢ per $1 |
| Gini / Inequality Index | 278 | 0.33 |
Earnings by Sex in Grass Valley
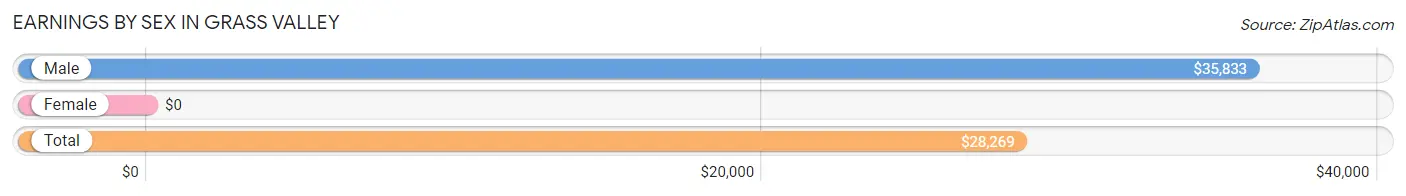
| Sex | Number | Average Earnings |
| Male | 72 (52.2%) | $35,833 |
| Female | 66 (47.8%) | $0 |
| Total | 138 (100.0%) | $28,269 |
Earnings by Sex by Income Bracket in Grass Valley
The most common earnings brackets in Grass Valley are $35,000 to $39,999 for men (19 | 26.4%) and $55,000 to $64,999 for women (21 | 31.8%).
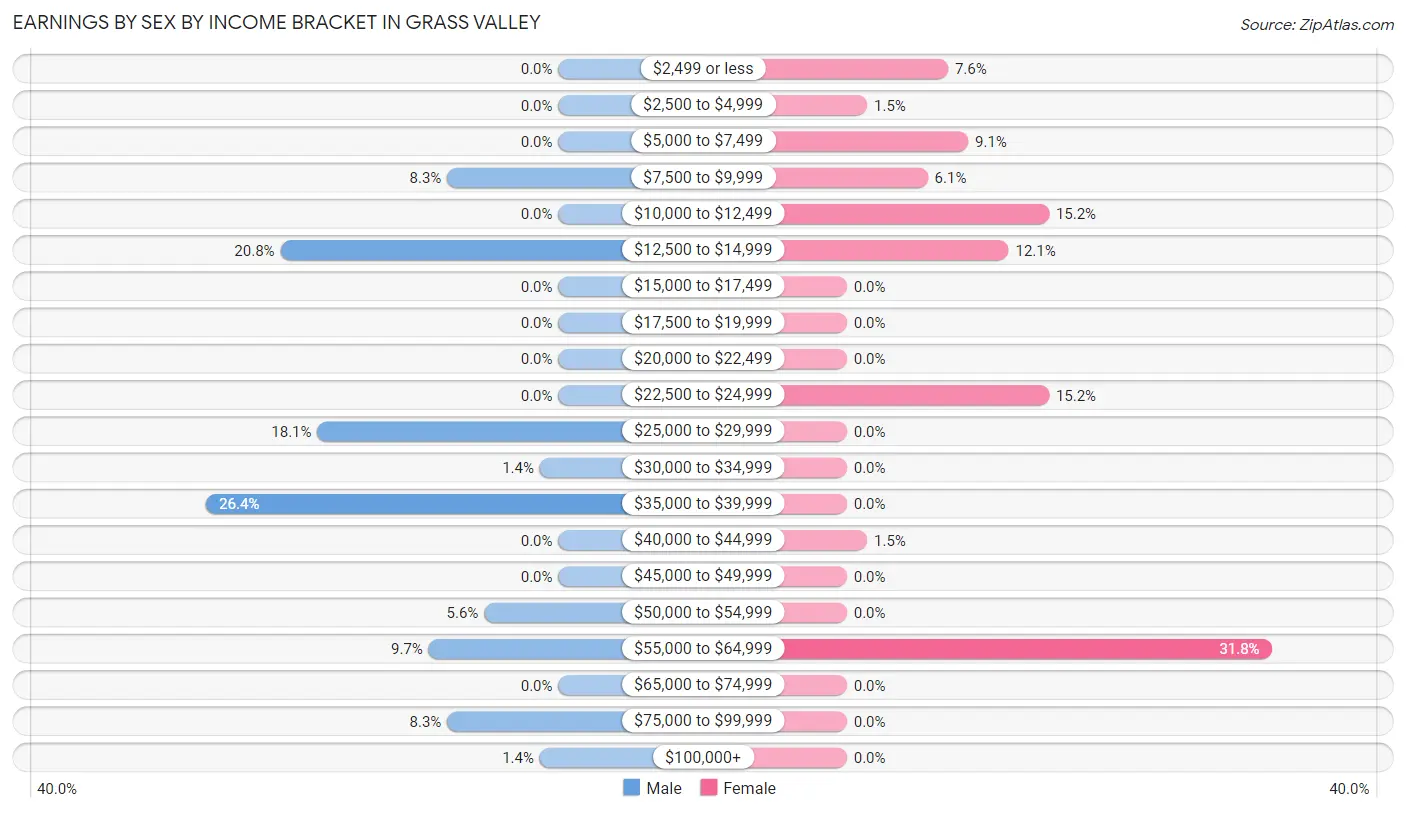
| Income | Male | Female |
| $2,499 or less | 0 (0.0%) | 5 (7.6%) |
| $2,500 to $4,999 | 0 (0.0%) | 1 (1.5%) |
| $5,000 to $7,499 | 0 (0.0%) | 6 (9.1%) |
| $7,500 to $9,999 | 6 (8.3%) | 4 (6.1%) |
| $10,000 to $12,499 | 0 (0.0%) | 10 (15.1%) |
| $12,500 to $14,999 | 15 (20.8%) | 8 (12.1%) |
| $15,000 to $17,499 | 0 (0.0%) | 0 (0.0%) |
| $17,500 to $19,999 | 0 (0.0%) | 0 (0.0%) |
| $20,000 to $22,499 | 0 (0.0%) | 0 (0.0%) |
| $22,500 to $24,999 | 0 (0.0%) | 10 (15.1%) |
| $25,000 to $29,999 | 13 (18.1%) | 0 (0.0%) |
| $30,000 to $34,999 | 1 (1.4%) | 0 (0.0%) |
| $35,000 to $39,999 | 19 (26.4%) | 0 (0.0%) |
| $40,000 to $44,999 | 0 (0.0%) | 1 (1.5%) |
| $45,000 to $49,999 | 0 (0.0%) | 0 (0.0%) |
| $50,000 to $54,999 | 4 (5.6%) | 0 (0.0%) |
| $55,000 to $64,999 | 7 (9.7%) | 21 (31.8%) |
| $65,000 to $74,999 | 0 (0.0%) | 0 (0.0%) |
| $75,000 to $99,999 | 6 (8.3%) | 0 (0.0%) |
| $100,000+ | 1 (1.4%) | 0 (0.0%) |
| Total | 72 (100.0%) | 66 (100.0%) |
Earnings by Sex by Educational Attainment in Grass Valley
Average earnings in Grass Valley are $31,250 for men and $22,625 for women, a difference of 27.6%. Men with an educational attainment of college or associate's degree enjoy the highest average annual earnings of $39,141, while those with college or associate's degree education earn the least with $39,141. Women with an educational attainment of college or associate's degree earn the most with the average annual earnings of $23,625, while those with high school diploma education have the smallest earnings of $12,188.
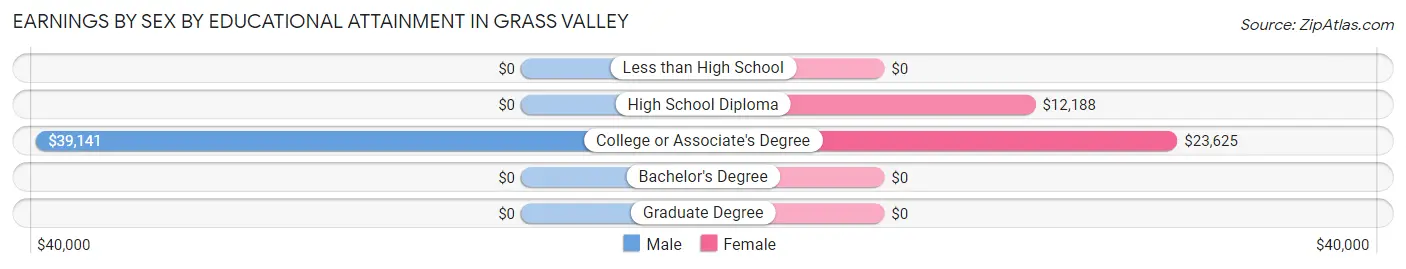
| Educational Attainment | Male Income | Female Income |
| Less than High School | - | - |
| High School Diploma | - | - |
| College or Associate's Degree | $39,141 | $23,625 |
| Bachelor's Degree | - | - |
| Graduate Degree | - | - |
| Total | $31,250 | $22,625 |
Family Income in Grass Valley
Family Income Brackets in Grass Valley
According to the Grass Valley family income data, there are 21 families falling into the $75,000 to $99,999 income range, which is the most common income bracket and makes up 36.8% of all families.
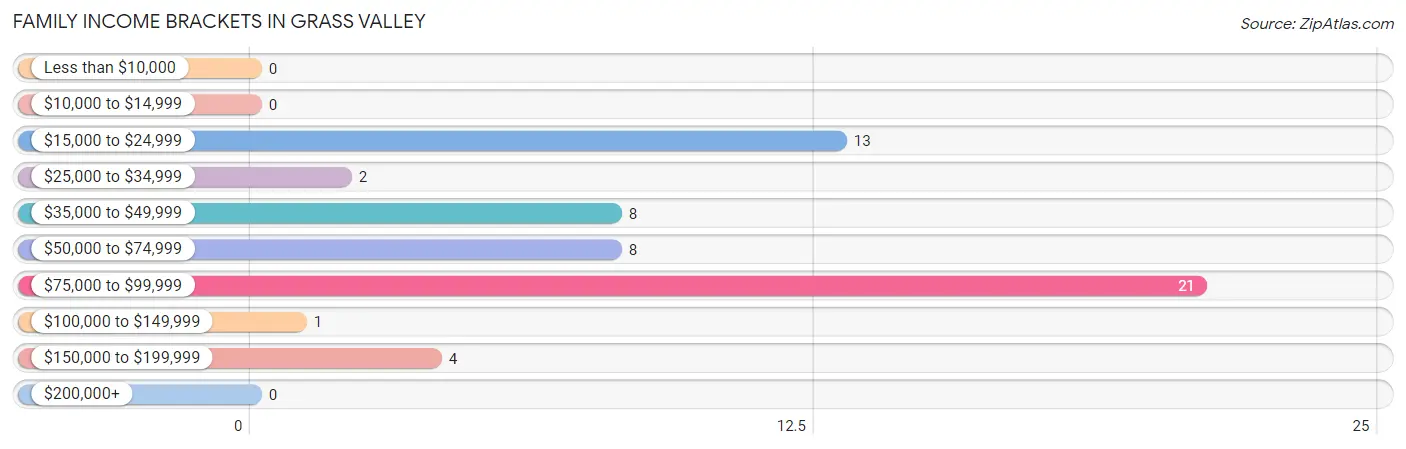
| Income Bracket | # Families | % Families |
| Less than $10,000 | 0 | 0.0% |
| $10,000 to $14,999 | 0 | 0.0% |
| $15,000 to $24,999 | 13 | 22.8% |
| $25,000 to $34,999 | 2 | 3.5% |
| $35,000 to $49,999 | 8 | 14.0% |
| $50,000 to $74,999 | 8 | 14.0% |
| $75,000 to $99,999 | 21 | 36.8% |
| $100,000 to $149,999 | 1 | 1.8% |
| $150,000 to $199,999 | 4 | 7.0% |
| $200,000+ | 0 | 0.0% |
Family Income by Famaliy Size in Grass Valley
2-person families (19 | 33.3%) account for the highest median family income in Grass Valley with $41,250 per family, while 2-person families (19 | 33.3%) have the highest median income of $20,625 per family member.
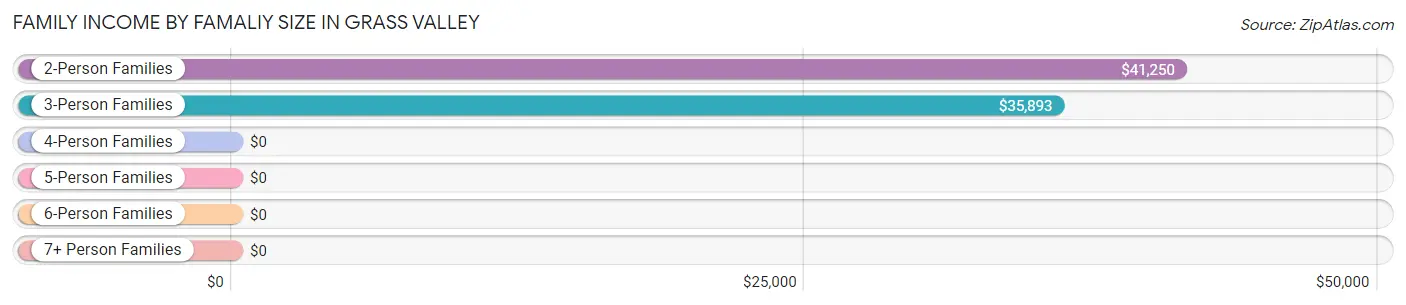
| Income Bracket | # Families | Median Income |
| 2-Person Families | 19 (33.3%) | $41,250 |
| 3-Person Families | 17 (29.8%) | $35,893 |
| 4-Person Families | 17 (29.8%) | $0 |
| 5-Person Families | 0 (0.0%) | $0 |
| 6-Person Families | 4 (7.0%) | $0 |
| 7+ Person Families | 0 (0.0%) | $0 |
| Total | 57 (100.0%) | $57,292 |
Family Income by Number of Earners in Grass Valley
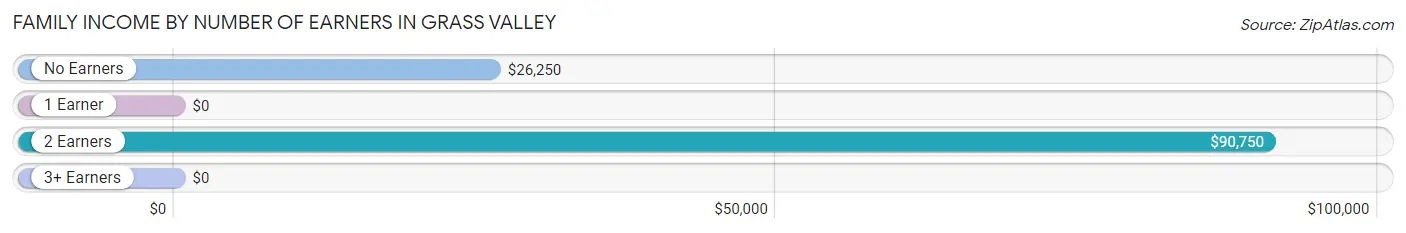
| Number of Earners | # Families | Median Income |
| No Earners | 12 (21.0%) | $26,250 |
| 1 Earner | 12 (21.0%) | $0 |
| 2 Earners | 29 (50.9%) | $90,750 |
| 3+ Earners | 4 (7.0%) | $0 |
| Total | 57 (100.0%) | $57,292 |
Household Income in Grass Valley
Household Income Brackets in Grass Valley
With 32 households falling in the category, the $50,000 to $74,999 income range is the most frequent in Grass Valley, accounting for 34.8% of all households.
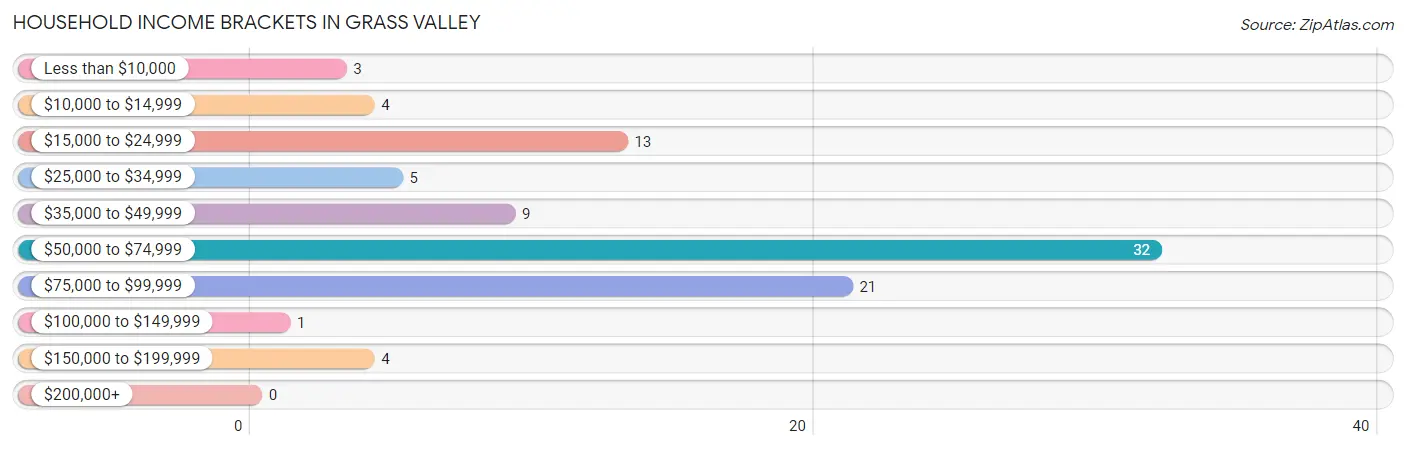
| Income Bracket | # Households | % Households |
| Less than $10,000 | 3 | 3.3% |
| $10,000 to $14,999 | 4 | 4.3% |
| $15,000 to $24,999 | 13 | 14.1% |
| $25,000 to $34,999 | 5 | 5.4% |
| $35,000 to $49,999 | 9 | 9.8% |
| $50,000 to $74,999 | 32 | 34.8% |
| $75,000 to $99,999 | 21 | 22.8% |
| $100,000 to $149,999 | 1 | 1.1% |
| $150,000 to $199,999 | 4 | 4.3% |
| $200,000+ | 0 | 0.0% |
Household Income by Householder Age in Grass Valley
The median household income in Grass Valley is $55,982, with the highest median household income of $90,167 found in the 65+ years age bracket for the primary householder. A total of 36 households (39.1%) fall into this category. Meanwhile, the 15 to 24 years age bracket for the primary householder has the lowest median household income of $0, with 3 households (3.3%) in this group.
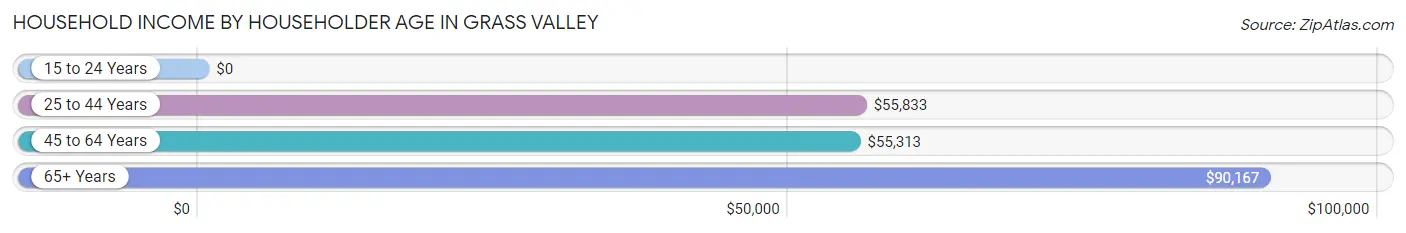
| Income Bracket | # Households | Median Income |
| 15 to 24 Years | 3 (3.3%) | $0 |
| 25 to 44 Years | 40 (43.5%) | $55,833 |
| 45 to 64 Years | 13 (14.1%) | $55,313 |
| 65+ Years | 36 (39.1%) | $90,167 |
| Total | 92 (100.0%) | $55,982 |
Poverty in Grass Valley
Income Below Poverty by Sex and Age in Grass Valley
With 5.1% poverty level for males and 33.5% for females among the residents of Grass Valley, 6 to 11 year old males and 18 to 24 year old females are the most vulnerable to poverty, with 4 males (50.0%) and 38 females (100.0%) in their respective age groups living below the poverty level.
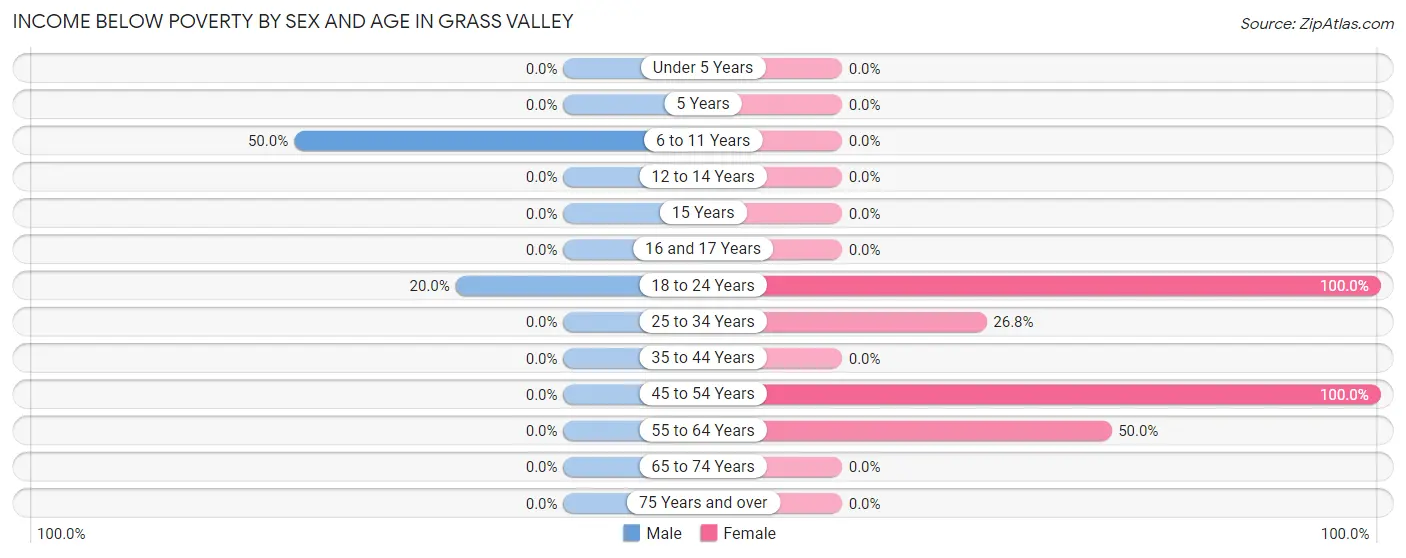
| Age Bracket | Male | Female |
| Under 5 Years | 0 (0.0%) | 0 (0.0%) |
| 5 Years | 0 (0.0%) | 0 (0.0%) |
| 6 to 11 Years | 4 (50.0%) | 0 (0.0%) |
| 12 to 14 Years | 0 (0.0%) | 0 (0.0%) |
| 15 Years | 0 (0.0%) | 0 (0.0%) |
| 16 and 17 Years | 0 (0.0%) | 0 (0.0%) |
| 18 to 24 Years | 2 (20.0%) | 38 (100.0%) |
| 25 to 34 Years | 0 (0.0%) | 11 (26.8%) |
| 35 to 44 Years | 0 (0.0%) | 0 (0.0%) |
| 45 to 54 Years | 0 (0.0%) | 1 (100.0%) |
| 55 to 64 Years | 0 (0.0%) | 4 (50.0%) |
| 65 to 74 Years | 0 (0.0%) | 0 (0.0%) |
| 75 Years and over | 0 (0.0%) | 0 (0.0%) |
| Total | 6 (5.1%) | 54 (33.5%) |
Income Above Poverty by Sex and Age in Grass Valley
According to the poverty statistics in Grass Valley, males aged under 5 years and females aged under 5 years are the age groups that are most secure financially, with 100.0% of males and 100.0% of females in these age groups living above the poverty line.
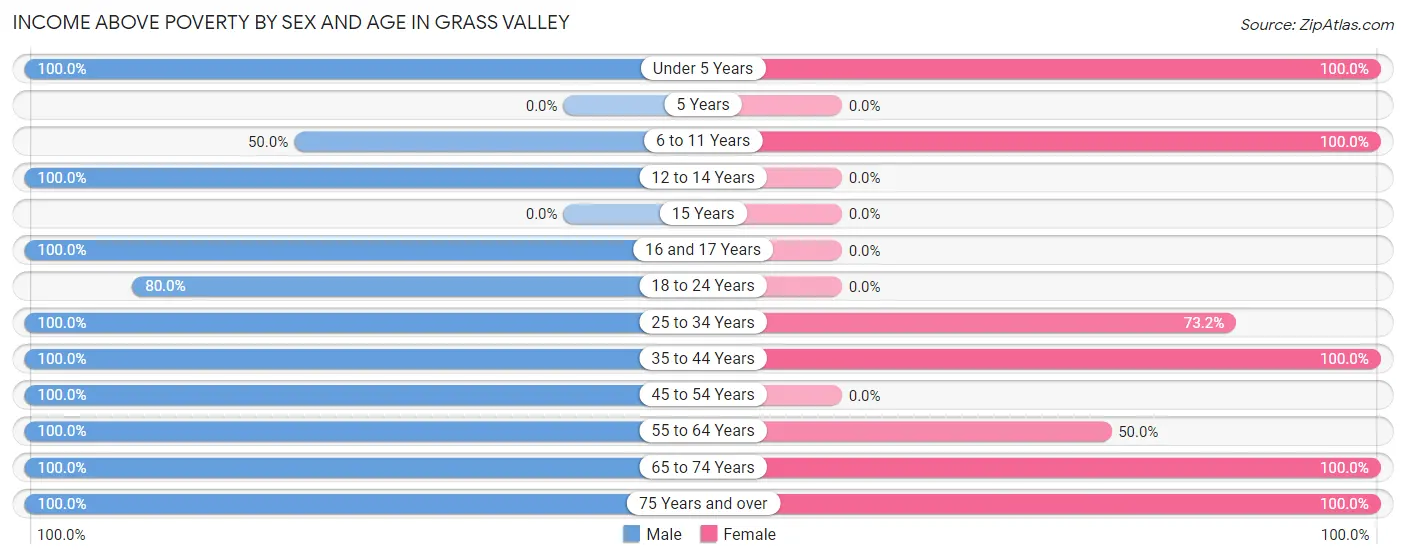
| Age Bracket | Male | Female |
| Under 5 Years | 4 (100.0%) | 23 (100.0%) |
| 5 Years | 0 (0.0%) | 0 (0.0%) |
| 6 to 11 Years | 4 (50.0%) | 5 (100.0%) |
| 12 to 14 Years | 9 (100.0%) | 0 (0.0%) |
| 15 Years | 0 (0.0%) | 0 (0.0%) |
| 16 and 17 Years | 4 (100.0%) | 0 (0.0%) |
| 18 to 24 Years | 8 (80.0%) | 0 (0.0%) |
| 25 to 34 Years | 8 (100.0%) | 30 (73.2%) |
| 35 to 44 Years | 18 (100.0%) | 13 (100.0%) |
| 45 to 54 Years | 17 (100.0%) | 0 (0.0%) |
| 55 to 64 Years | 3 (100.0%) | 4 (50.0%) |
| 65 to 74 Years | 7 (100.0%) | 22 (100.0%) |
| 75 Years and over | 29 (100.0%) | 10 (100.0%) |
| Total | 111 (94.9%) | 107 (66.5%) |
Income Below Poverty Among Married-Couple Families in Grass Valley
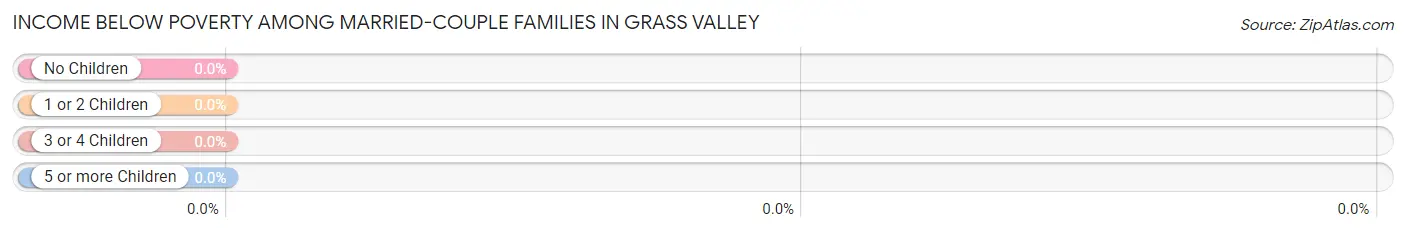
| Children | Above Poverty | Below Poverty |
| No Children | 18 (100.0%) | 0 (0.0%) |
| 1 or 2 Children | 24 (100.0%) | 0 (0.0%) |
| 3 or 4 Children | 0 (0.0%) | 0 (0.0%) |
| 5 or more Children | 0 (0.0%) | 0 (0.0%) |
| Total | 42 (100.0%) | 0 (0.0%) |
Income Below Poverty Among Single-Parent Households in Grass Valley
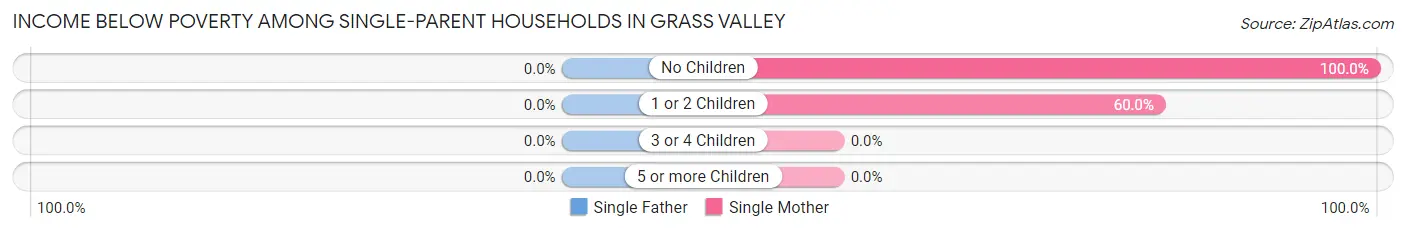
| Children | Single Father | Single Mother |
| No Children | 0 (0.0%) | 1 (100.0%) |
| 1 or 2 Children | 0 (0.0%) | 6 (60.0%) |
| 3 or 4 Children | 0 (0.0%) | 0 (0.0%) |
| 5 or more Children | 0 (0.0%) | 0 (0.0%) |
| Total | 0 (0.0%) | 7 (46.7%) |
Income Below Poverty Among Married-Couple vs Single-Parent Households in Grass Valley
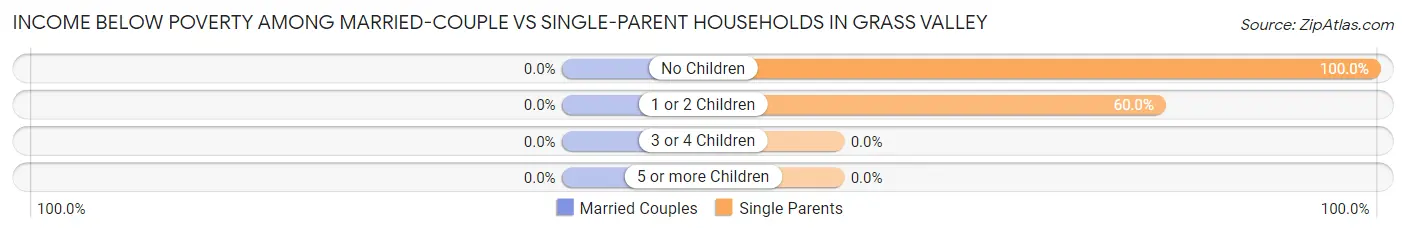
| Children | Married-Couple Families | Single-Parent Households |
| No Children | 0 (0.0%) | 1 (100.0%) |
| 1 or 2 Children | 0 (0.0%) | 6 (60.0%) |
| 3 or 4 Children | 0 (0.0%) | 0 (0.0%) |
| 5 or more Children | 0 (0.0%) | 0 (0.0%) |
| Total | 0 (0.0%) | 7 (46.7%) |
Race in Grass Valley
The most populous races in Grass Valley are White / Caucasian (245 | 88.1%), Hawaiian / Pacific (28 | 10.1%), and Hispanic or Latino (7 | 2.5%).
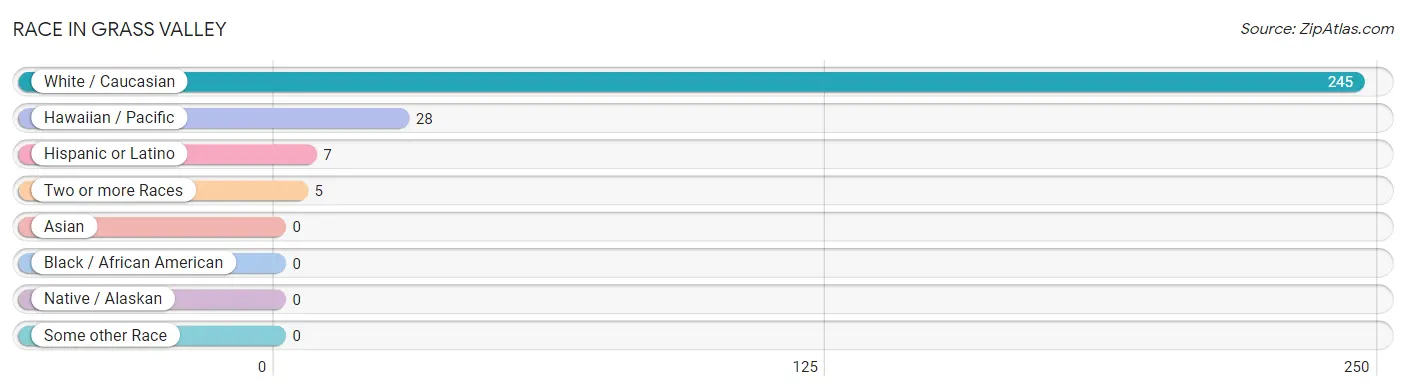
| Race | # Population | % Population |
| Asian | 0 | 0.0% |
| Black / African American | 0 | 0.0% |
| Hawaiian / Pacific | 28 | 10.1% |
| Hispanic or Latino | 7 | 2.5% |
| Native / Alaskan | 0 | 0.0% |
| White / Caucasian | 245 | 88.1% |
| Two or more Races | 5 | 1.8% |
| Some other Race | 0 | 0.0% |
| Total | 278 | 100.0% |
Ancestry in Grass Valley
The most populous ancestries reported in Grass Valley are German (73 | 26.3%), English (62 | 22.3%), Irish (27 | 9.7%), Swedish (18 | 6.5%), and Norwegian (16 | 5.8%), together accounting for 70.5% of all Grass Valley residents.
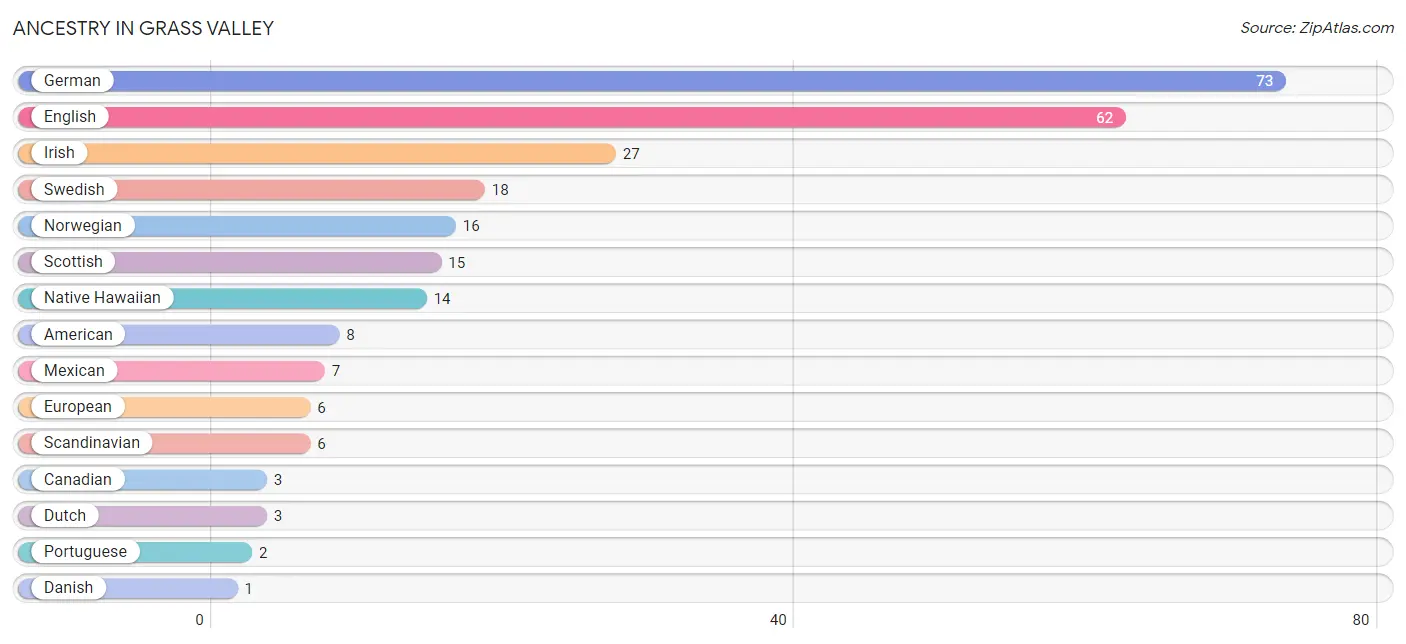
| Ancestry | # Population | % Population |
| American | 8 | 2.9% |
| Canadian | 3 | 1.1% |
| Danish | 1 | 0.4% |
| Dutch | 3 | 1.1% |
| English | 62 | 22.3% |
| European | 6 | 2.2% |
| German | 73 | 26.3% |
| Irish | 27 | 9.7% |
| Mexican | 7 | 2.5% |
| Native Hawaiian | 14 | 5.0% |
| Norwegian | 16 | 5.8% |
| Portuguese | 2 | 0.7% |
| Scandinavian | 6 | 2.2% |
| Scottish | 15 | 5.4% |
| Swedish | 18 | 6.5% | View All 15 Rows |
Immigrants in Grass Valley
The most numerous immigrant groups reported in Grass Valley came from Central America (7 | 2.5%), Latin America (7 | 2.5%), Mexico (7 | 2.5%), and Canada (3 | 1.1%), together accounting for 8.6% of all Grass Valley residents.
| Immigration Origin | # Population | % Population |
| Canada | 3 | 1.1% |
| Central America | 7 | 2.5% |
| Latin America | 7 | 2.5% |
| Mexico | 7 | 2.5% | View All 4 Rows |
Sex and Age in Grass Valley
Sex and Age in Grass Valley
The most populous age groups in Grass Valley are 75 to 79 Years (25 | 21.4%) for men and 15 to 19 Years (38 | 23.6%) for women.
| Age Bracket | Male | Female |
| Under 5 Years | 4 (3.4%) | 23 (14.3%) |
| 5 to 9 Years | 4 (3.4%) | 0 (0.0%) |
| 10 to 14 Years | 13 (11.1%) | 5 (3.1%) |
| 15 to 19 Years | 8 (6.8%) | 38 (23.6%) |
| 20 to 24 Years | 6 (5.1%) | 0 (0.0%) |
| 25 to 29 Years | 2 (1.7%) | 7 (4.3%) |
| 30 to 34 Years | 6 (5.1%) | 34 (21.1%) |
| 35 to 39 Years | 3 (2.6%) | 8 (5.0%) |
| 40 to 44 Years | 15 (12.8%) | 5 (3.1%) |
| 45 to 49 Years | 12 (10.3%) | 1 (0.6%) |
| 50 to 54 Years | 5 (4.3%) | 0 (0.0%) |
| 55 to 59 Years | 1 (0.9%) | 0 (0.0%) |
| 60 to 64 Years | 2 (1.7%) | 8 (5.0%) |
| 65 to 69 Years | 4 (3.4%) | 6 (3.7%) |
| 70 to 74 Years | 3 (2.6%) | 16 (9.9%) |
| 75 to 79 Years | 25 (21.4%) | 10 (6.2%) |
| 80 to 84 Years | 0 (0.0%) | 0 (0.0%) |
| 85 Years and over | 4 (3.4%) | 0 (0.0%) |
| Total | 117 (100.0%) | 161 (100.0%) |
Families and Households in Grass Valley
Median Family Size in Grass Valley
| Family Type | # Families | Family Size |
| Married-Couple | 42 (73.7%) | 3.12 |
| Single Male/Father | 0 (0.0%) | - |
| Single Female/Mother | 15 (26.3%) | 4.87 |
| Total Families | 57 (100.0%) | 3.58 |
Median Household Size in Grass Valley
| Household Type | # Households | Household Size |
| Married-Couple | 42 (45.7%) | 3.12 |
| Single Male/Father | 0 (0.0%) | - |
| Single Female/Mother | 15 (16.3%) | 4.87 |
| Non-family | 35 (38.0%) | 1.80 |
| Total Households | 92 (100.0%) | 2.90 |
Household Size by Marriage Status in Grass Valley
Out of a total of 92 households in Grass Valley, 57 (62.0%) are family households, while 35 (38.0%) are nonfamily households. The most numerous type of family households are 2-person households, comprising 19, and the most common type of nonfamily households are 1-person households, comprising 32.
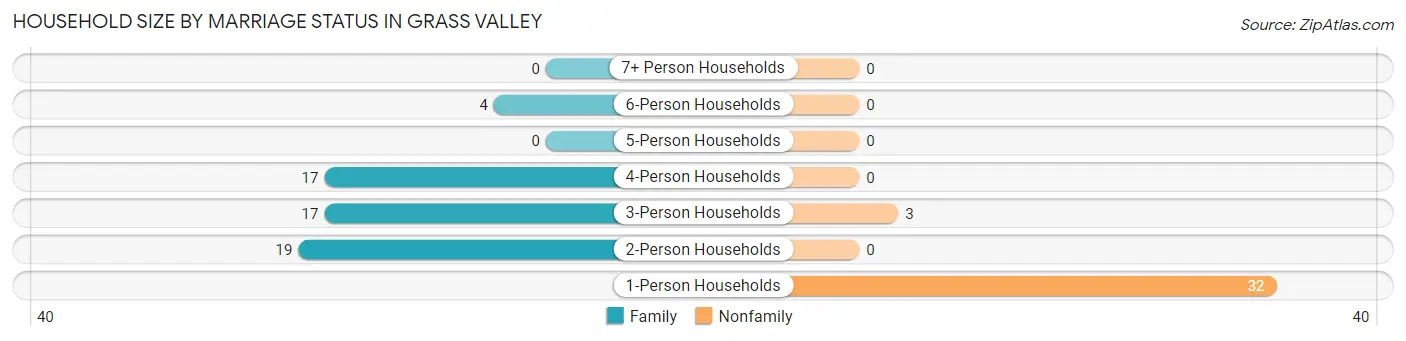
| Household Size | Family Households | Nonfamily Households |
| 1-Person Households | - | 32 (34.8%) |
| 2-Person Households | 19 (20.6%) | 0 (0.0%) |
| 3-Person Households | 17 (18.5%) | 3 (3.3%) |
| 4-Person Households | 17 (18.5%) | 0 (0.0%) |
| 5-Person Households | 0 (0.0%) | 0 (0.0%) |
| 6-Person Households | 4 (4.3%) | 0 (0.0%) |
| 7+ Person Households | 0 (0.0%) | 0 (0.0%) |
| Total | 57 (62.0%) | 35 (38.0%) |
Female Fertility in Grass Valley
Fertility by Age in Grass Valley
| Age Bracket | Women with Births | Births / 1,000 Women |
| 15 to 19 years | 0 (0.0%) | 0.0 |
| 20 to 34 years | 0 (0.0%) | 0.0 |
| 35 to 50 years | 0 (0.0%) | 0.0 |
| Total | 0 (0.0%) | 0.0 |
Fertility by Age by Marriage Status in Grass Valley
| Age Bracket | Married | Unmarried |
| 15 to 19 years | 0 (0.0%) | 0 (0.0%) |
| 20 to 34 years | 0 (0.0%) | 0 (0.0%) |
| 35 to 50 years | 0 (0.0%) | 0 (0.0%) |
| Total | 0 (0.0%) | 0 (0.0%) |
Fertility by Education in Grass Valley
| Educational Attainment | Women with Births | Births / 1,000 Women |
| Less than High School | 0 (0.0%) | 0.0 |
| High School Diploma | 0 (0.0%) | 0.0 |
| College or Associate's Degree | 0 (0.0%) | 0.0 |
| Bachelor's Degree | 0 (0.0%) | 0.0 |
| Graduate Degree | 0 (0.0%) | 0.0 |
| Total | 0 (0.0%) | 0.0 |
Fertility by Education by Marriage Status in Grass Valley
| Educational Attainment | Married | Unmarried |
| Less than High School | 0 (0.0%) | 0 (0.0%) |
| High School Diploma | 0 (0.0%) | 0 (0.0%) |
| College or Associate's Degree | 0 (0.0%) | 0 (0.0%) |
| Bachelor's Degree | 0 (0.0%) | 0 (0.0%) |
| Graduate Degree | 0 (0.0%) | 0 (0.0%) |
| Total | 0 (0.0%) | 0 (0.0%) |
Employment Characteristics in Grass Valley
Employment by Class of Employer in Grass Valley
Among the 114 employed individuals in Grass Valley, private company employees (53 | 46.5%), federal government employees (28 | 24.6%), and local government employees (22 | 19.3%) make up the most common classes of employment.
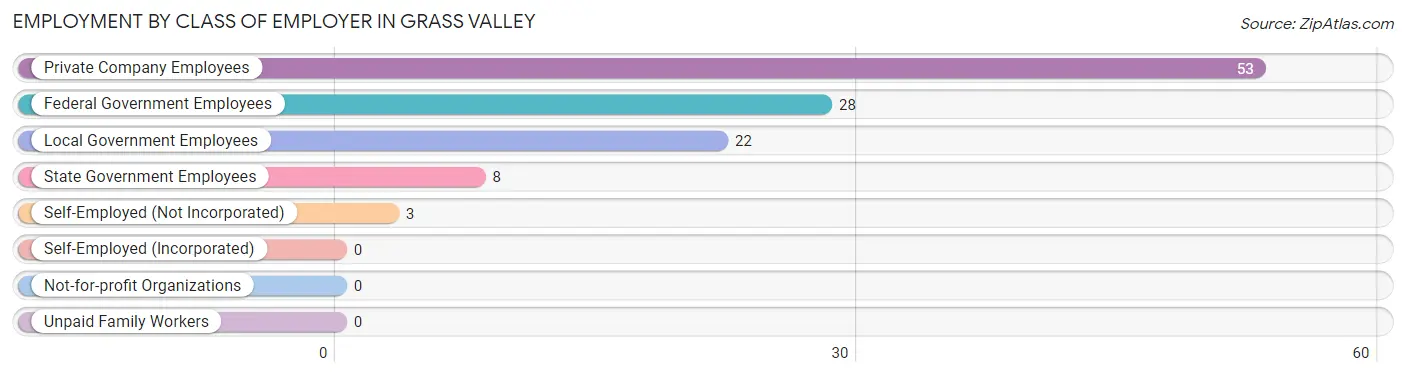
| Employer Class | # Employees | % Employees |
| Private Company Employees | 53 | 46.5% |
| Self-Employed (Incorporated) | 0 | 0.0% |
| Self-Employed (Not Incorporated) | 3 | 2.6% |
| Not-for-profit Organizations | 0 | 0.0% |
| Local Government Employees | 22 | 19.3% |
| State Government Employees | 8 | 7.0% |
| Federal Government Employees | 28 | 24.6% |
| Unpaid Family Workers | 0 | 0.0% |
| Total | 114 | 100.0% |
Employment Status by Age in Grass Valley
According to the labor force statistics for Grass Valley, out of the total population over 16 years of age (229), 52.8% or 121 individuals are in the labor force, with 0.8% or 1 of them unemployed. The age group with the highest labor force participation rate is 20 to 24 years, with 100.0% or 6 individuals in the labor force. Within the labor force, the 35 to 44 years age range has the highest percentage of unemployed individuals, with 5.3% or 1 of them being unemployed.
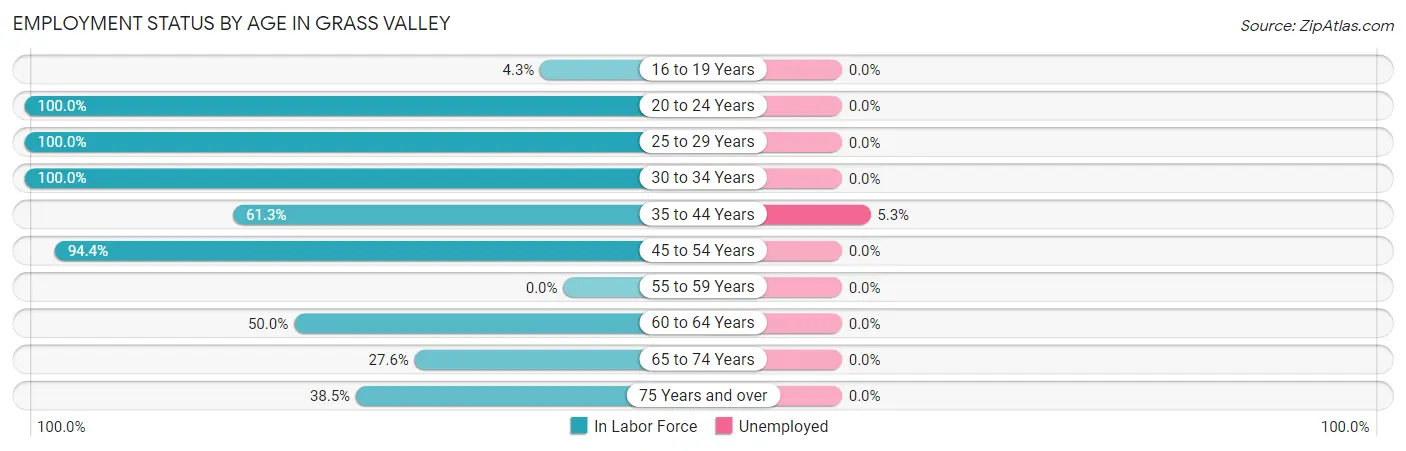
| Age Bracket | In Labor Force | Unemployed |
| 16 to 19 Years | 2 (4.3%) | 0 (0.0%) |
| 20 to 24 Years | 6 (100.0%) | 0 (0.0%) |
| 25 to 29 Years | 9 (100.0%) | 0 (0.0%) |
| 30 to 34 Years | 40 (100.0%) | 0 (0.0%) |
| 35 to 44 Years | 19 (61.3%) | 1 (5.3%) |
| 45 to 54 Years | 17 (94.4%) | 0 (0.0%) |
| 55 to 59 Years | 0 (0.0%) | 0 (0.0%) |
| 60 to 64 Years | 5 (50.0%) | 0 (0.0%) |
| 65 to 74 Years | 8 (27.6%) | 0 (0.0%) |
| 75 Years and over | 15 (38.5%) | 0 (0.0%) |
| Total | 121 (52.8%) | 1 (0.8%) |
Employment Status by Educational Attainment in Grass Valley
According to labor force statistics for Grass Valley, 82.6% of individuals (90) out of the total population between 25 and 64 years of age (109) are in the labor force, with 1.1% or 1 of them being unemployed. The group with the highest labor force participation rate are those with the educational attainment of college / associate degree, with 100.0% or 10 individuals in the labor force. Within the labor force, individuals with college / associate degree education have the highest percentage of unemployment, with 10.0% or 1 of them being unemployed.
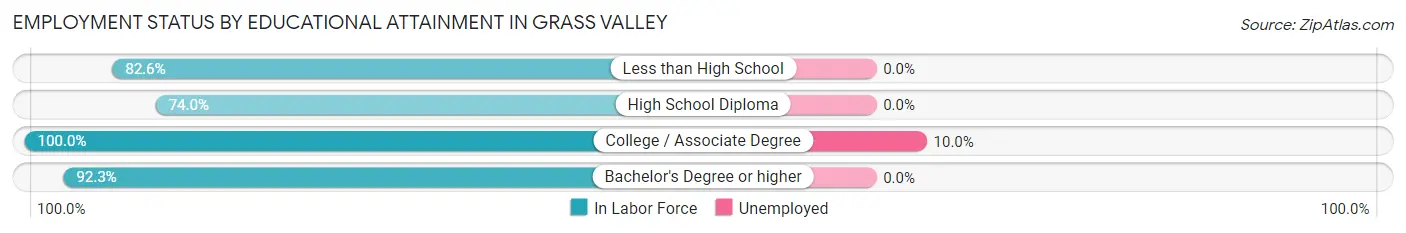
| Educational Attainment | In Labor Force | Unemployed |
| Less than High School | 19 (82.6%) | 0 (0.0%) |
| High School Diploma | 37 (74.0%) | 0 (0.0%) |
| College / Associate Degree | 10 (100.0%) | 1 (10.0%) |
| Bachelor's Degree or higher | 24 (92.3%) | 0 (0.0%) |
| Total | 90 (82.6%) | 1 (1.1%) |
Employment Occupations by Sex in Grass Valley
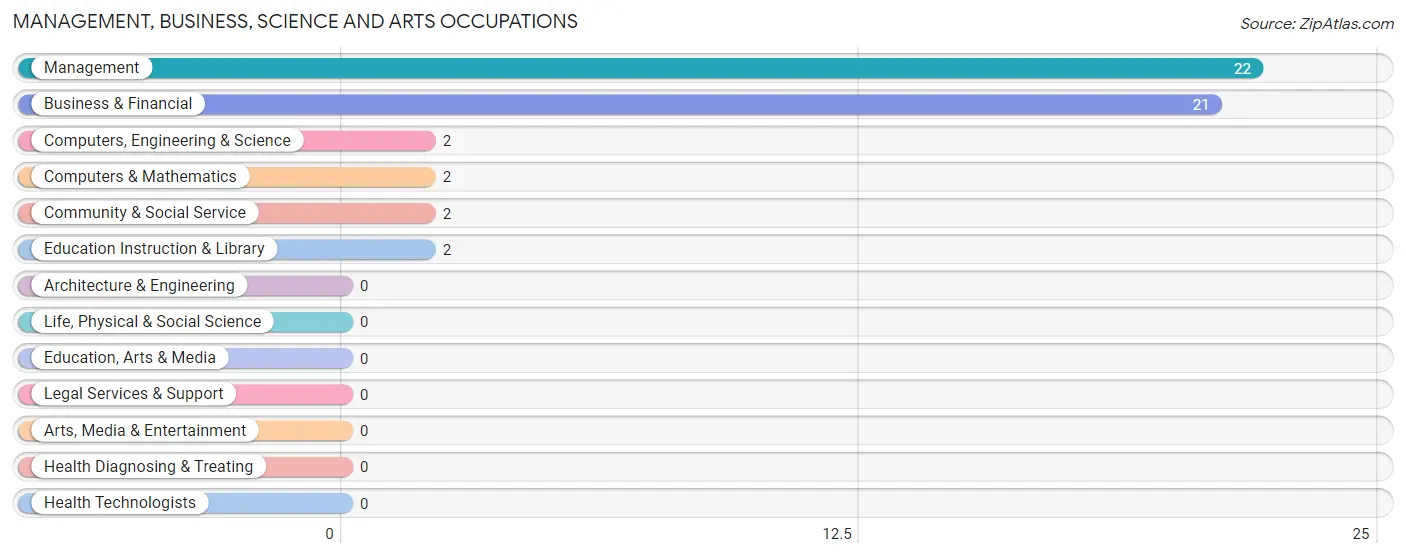
Management, Business, Science and Arts Occupations
The most common Management, Business, Science and Arts occupations in Grass Valley are Management (22 | 18.3%), Business & Financial (21 | 17.5%), Computers, Engineering & Science (2 | 1.7%), Computers & Mathematics (2 | 1.7%), and Community & Social Service (2 | 1.7%).
Management, Business, Science and Arts Occupations by Sex
Within the Management, Business, Science and Arts occupations in Grass Valley, the most male-oriented occupations are Computers, Engineering & Science (100.0%), Computers & Mathematics (100.0%), and Management (81.8%), while the most female-oriented occupations are Business & Financial (100.0%), Community & Social Service (100.0%), and Education Instruction & Library (100.0%).
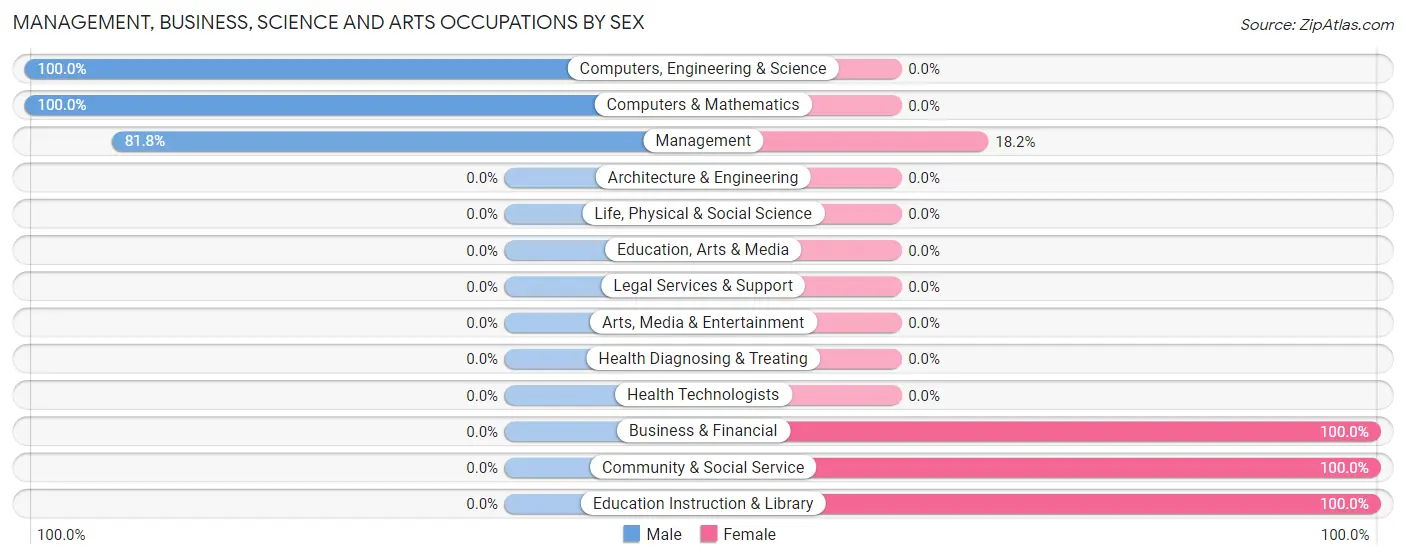
| Occupation | Male | Female |
| Management | 18 (81.8%) | 4 (18.2%) |
| Business & Financial | 0 (0.0%) | 21 (100.0%) |
| Computers, Engineering & Science | 2 (100.0%) | 0 (0.0%) |
| Computers & Mathematics | 2 (100.0%) | 0 (0.0%) |
| Architecture & Engineering | 0 (0.0%) | 0 (0.0%) |
| Life, Physical & Social Science | 0 (0.0%) | 0 (0.0%) |
| Community & Social Service | 0 (0.0%) | 2 (100.0%) |
| Education, Arts & Media | 0 (0.0%) | 0 (0.0%) |
| Legal Services & Support | 0 (0.0%) | 0 (0.0%) |
| Education Instruction & Library | 0 (0.0%) | 2 (100.0%) |
| Arts, Media & Entertainment | 0 (0.0%) | 0 (0.0%) |
| Health Diagnosing & Treating | 0 (0.0%) | 0 (0.0%) |
| Health Technologists | 0 (0.0%) | 0 (0.0%) |
| Total (Category) | 20 (42.5%) | 27 (57.5%) |
| Total (Overall) | 71 (59.2%) | 49 (40.8%) |
Services Occupations
The most common Services occupations in Grass Valley are Healthcare Support (7 | 5.8%), Personal Care & Service (6 | 5.0%), Food Preparation & Serving (5 | 4.2%), and Cleaning & Maintenance (1 | 0.8%).
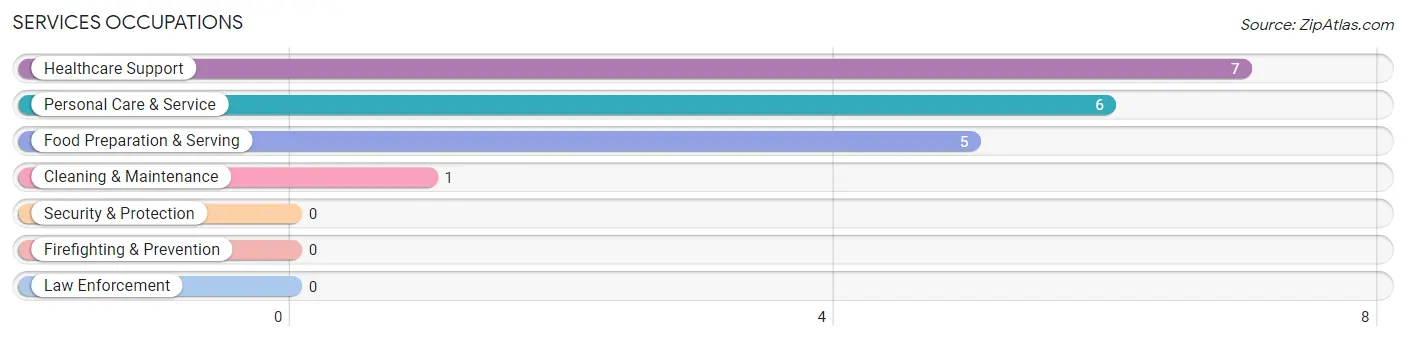
Services Occupations by Sex
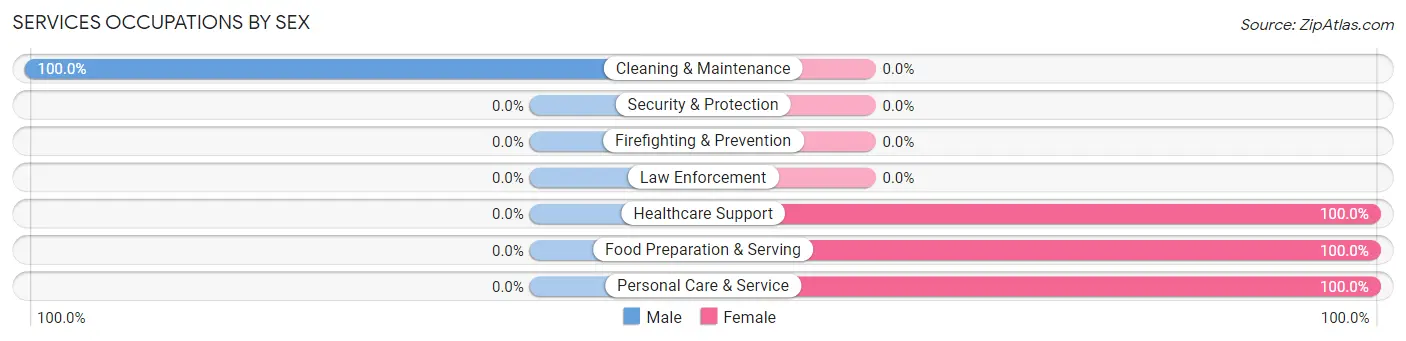
| Occupation | Male | Female |
| Healthcare Support | 0 (0.0%) | 7 (100.0%) |
| Security & Protection | 0 (0.0%) | 0 (0.0%) |
| Firefighting & Prevention | 0 (0.0%) | 0 (0.0%) |
| Law Enforcement | 0 (0.0%) | 0 (0.0%) |
| Food Preparation & Serving | 0 (0.0%) | 5 (100.0%) |
| Cleaning & Maintenance | 1 (100.0%) | 0 (0.0%) |
| Personal Care & Service | 0 (0.0%) | 6 (100.0%) |
| Total (Category) | 1 (5.3%) | 18 (94.7%) |
| Total (Overall) | 71 (59.2%) | 49 (40.8%) |
Sales and Office Occupations
The most common Sales and Office occupations in Grass Valley are Sales & Related (16 | 13.3%), and Office & Administration (4 | 3.3%).
Sales and Office Occupations by Sex
| Occupation | Male | Female |
| Sales & Related | 16 (100.0%) | 0 (0.0%) |
| Office & Administration | 0 (0.0%) | 4 (100.0%) |
| Total (Category) | 16 (80.0%) | 4 (20.0%) |
| Total (Overall) | 71 (59.2%) | 49 (40.8%) |
Natural Resources, Construction and Maintenance Occupations
The most common Natural Resources, Construction and Maintenance occupations in Grass Valley are Farming, Fishing & Forestry (18 | 15.0%), Construction & Extraction (1 | 0.8%), and Installation, Maintenance & Repair (1 | 0.8%).
Natural Resources, Construction and Maintenance Occupations by Sex
| Occupation | Male | Female |
| Farming, Fishing & Forestry | 18 (100.0%) | 0 (0.0%) |
| Construction & Extraction | 1 (100.0%) | 0 (0.0%) |
| Installation, Maintenance & Repair | 1 (100.0%) | 0 (0.0%) |
| Total (Category) | 20 (100.0%) | 0 (0.0%) |
| Total (Overall) | 71 (59.2%) | 49 (40.8%) |
Production, Transportation and Moving Occupations
The most common Production, Transportation and Moving occupations in Grass Valley are Material Moving (8 | 6.7%), and Transportation (6 | 5.0%).
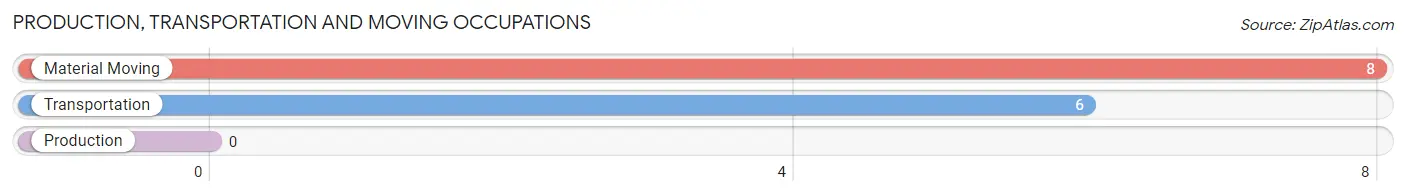
Production, Transportation and Moving Occupations by Sex
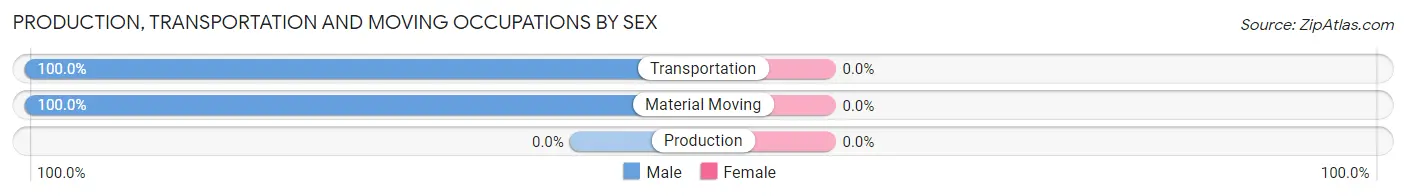
| Occupation | Male | Female |
| Production | 0 (0.0%) | 0 (0.0%) |
| Transportation | 6 (100.0%) | 0 (0.0%) |
| Material Moving | 8 (100.0%) | 0 (0.0%) |
| Total (Category) | 14 (100.0%) | 0 (0.0%) |
| Total (Overall) | 71 (59.2%) | 49 (40.8%) |
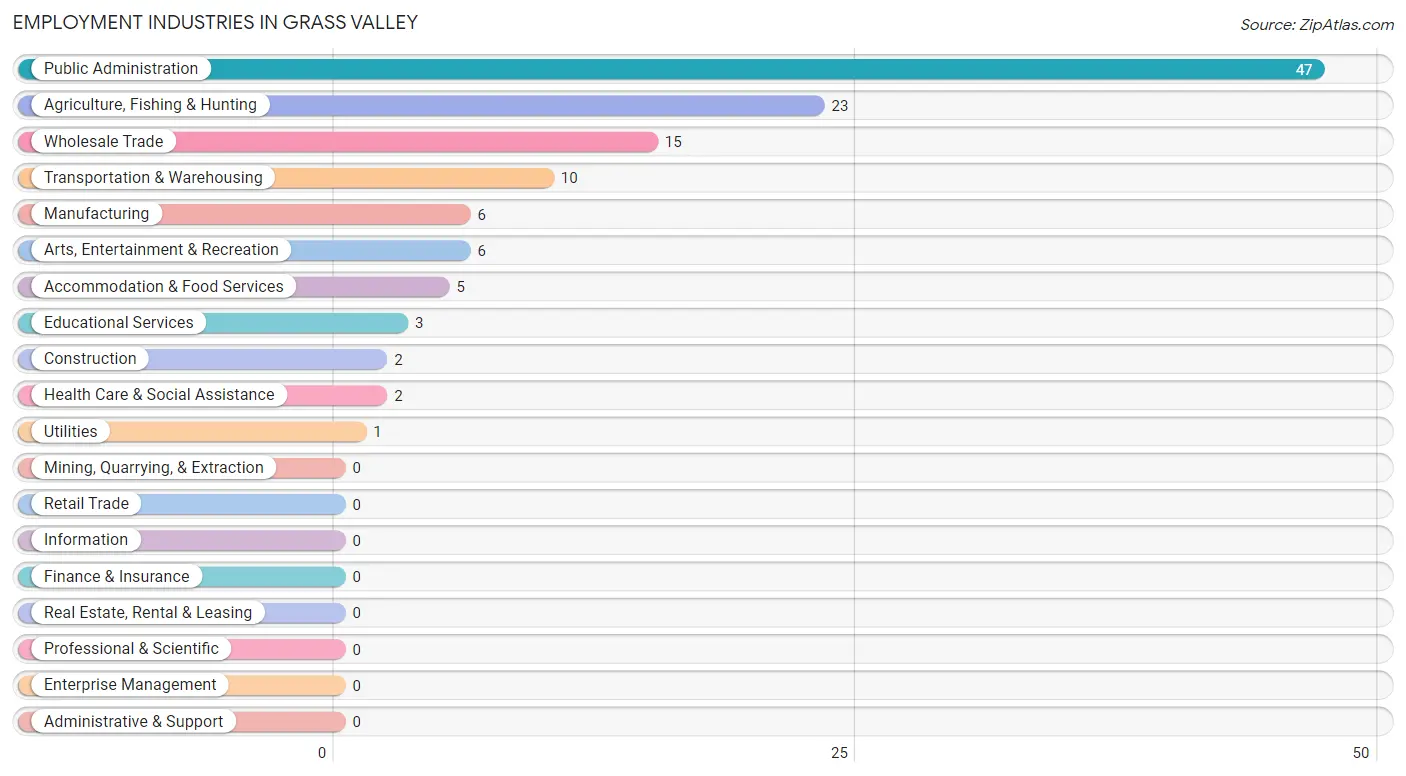
Employment Industries by Sex in Grass Valley
Employment Industries in Grass Valley
The major employment industries in Grass Valley include Public Administration (47 | 39.2%), Agriculture, Fishing & Hunting (23 | 19.2%), Wholesale Trade (15 | 12.5%), Transportation & Warehousing (10 | 8.3%), and Manufacturing (6 | 5.0%).
Employment Industries by Sex in Grass Valley
The Grass Valley industries that see more men than women are Agriculture, Fishing & Hunting (100.0%), Construction (100.0%), and Manufacturing (100.0%), whereas the industries that tend to have a higher number of women are Arts, Entertainment & Recreation (100.0%), Accommodation & Food Services (100.0%), and Public Administration (68.1%).
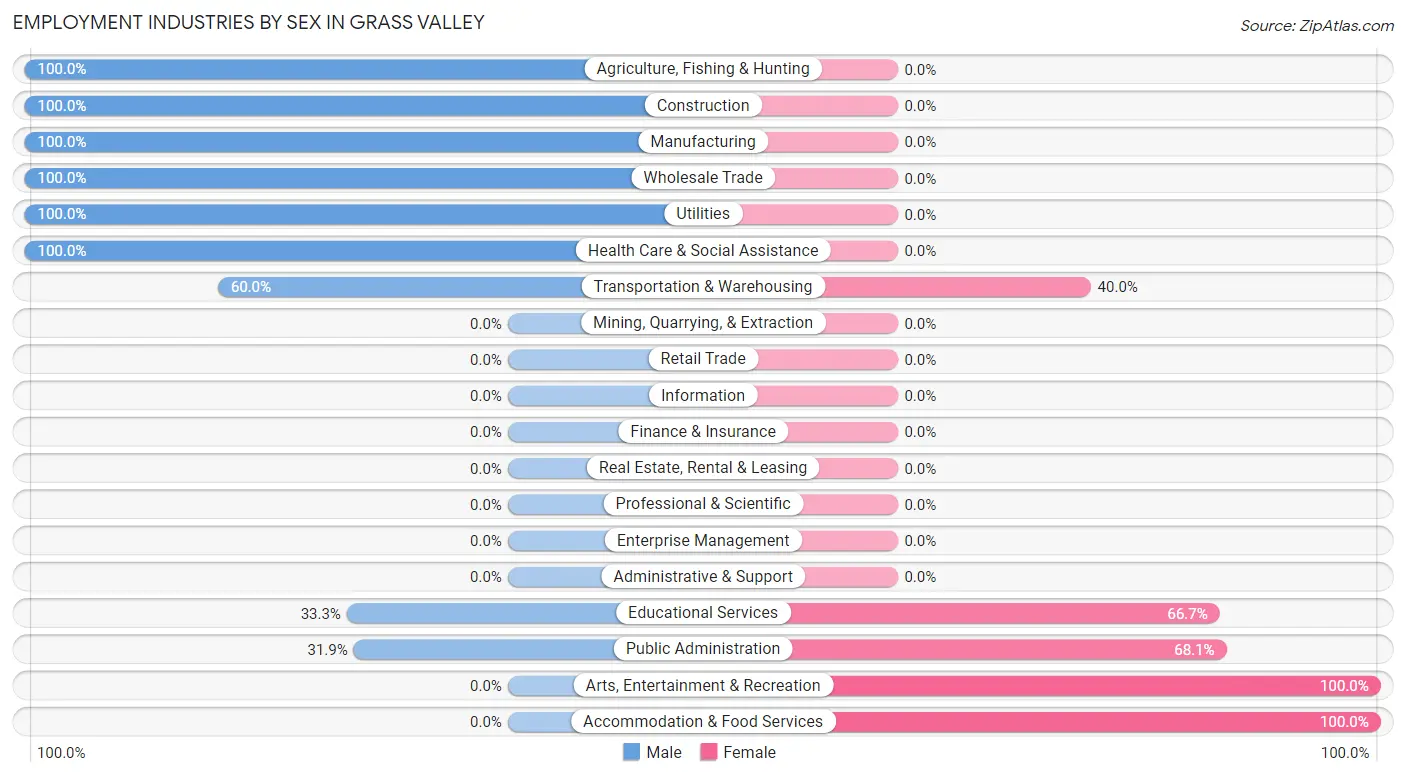
| Industry | Male | Female |
| Agriculture, Fishing & Hunting | 23 (100.0%) | 0 (0.0%) |
| Mining, Quarrying, & Extraction | 0 (0.0%) | 0 (0.0%) |
| Construction | 2 (100.0%) | 0 (0.0%) |
| Manufacturing | 6 (100.0%) | 0 (0.0%) |
| Wholesale Trade | 15 (100.0%) | 0 (0.0%) |
| Retail Trade | 0 (0.0%) | 0 (0.0%) |
| Transportation & Warehousing | 6 (60.0%) | 4 (40.0%) |
| Utilities | 1 (100.0%) | 0 (0.0%) |
| Information | 0 (0.0%) | 0 (0.0%) |
| Finance & Insurance | 0 (0.0%) | 0 (0.0%) |
| Real Estate, Rental & Leasing | 0 (0.0%) | 0 (0.0%) |
| Professional & Scientific | 0 (0.0%) | 0 (0.0%) |
| Enterprise Management | 0 (0.0%) | 0 (0.0%) |
| Administrative & Support | 0 (0.0%) | 0 (0.0%) |
| Educational Services | 1 (33.3%) | 2 (66.7%) |
| Health Care & Social Assistance | 2 (100.0%) | 0 (0.0%) |
| Arts, Entertainment & Recreation | 0 (0.0%) | 6 (100.0%) |
| Accommodation & Food Services | 0 (0.0%) | 5 (100.0%) |
| Public Administration | 15 (31.9%) | 32 (68.1%) |
| Total | 71 (59.2%) | 49 (40.8%) |
Education in Grass Valley
School Enrollment in Grass Valley
The most common levels of schooling among the 68 students in Grass Valley are college / undergraduate (31 | 45.6%), middle school (18 | 26.5%), and high school (9 | 13.2%).
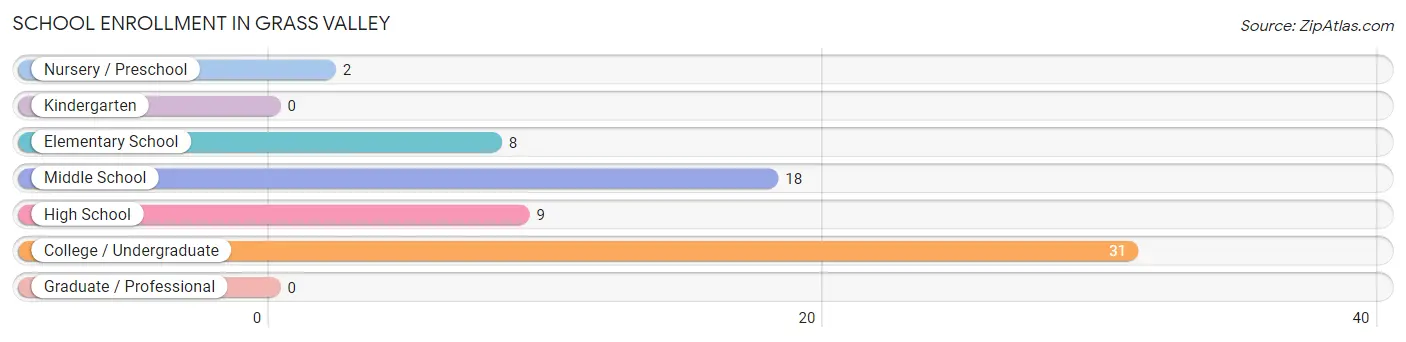
| School Level | # Students | % Students |
| Nursery / Preschool | 2 | 2.9% |
| Kindergarten | 0 | 0.0% |
| Elementary School | 8 | 11.8% |
| Middle School | 18 | 26.5% |
| High School | 9 | 13.2% |
| College / Undergraduate | 31 | 45.6% |
| Graduate / Professional | 0 | 0.0% |
| Total | 68 | 100.0% |
School Enrollment by Age by Funding Source in Grass Valley
Out of a total of 68 students who are enrolled in schools in Grass Valley, 2 (2.9%) attend a private institution, while the remaining 66 (97.1%) are enrolled in public schools. The age group of 3 to 4 year olds has the highest likelihood of being enrolled in private schools, with 2 (100.0% in the age bracket) enrolled. Conversely, the age group of 5 to 9 year old has the lowest likelihood of being enrolled in a private school, with 4 (100.0% in the age bracket) attending a public institution.
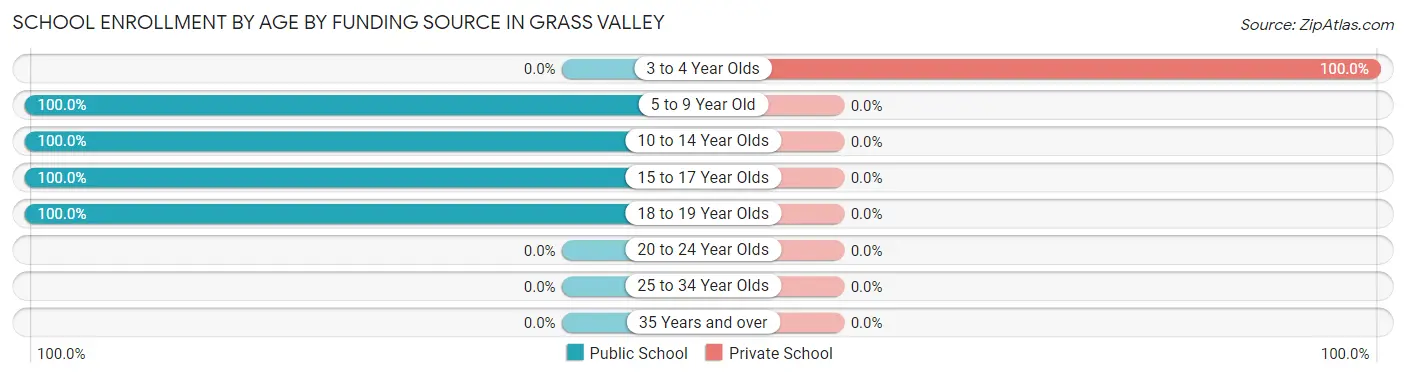
| Age Bracket | Public School | Private School |
| 3 to 4 Year Olds | 0 (0.0%) | 2 (100.0%) |
| 5 to 9 Year Old | 4 (100.0%) | 0 (0.0%) |
| 10 to 14 Year Olds | 18 (100.0%) | 0 (0.0%) |
| 15 to 17 Year Olds | 4 (100.0%) | 0 (0.0%) |
| 18 to 19 Year Olds | 40 (100.0%) | 0 (0.0%) |
| 20 to 24 Year Olds | 0 (0.0%) | 0 (0.0%) |
| 25 to 34 Year Olds | 0 (0.0%) | 0 (0.0%) |
| 35 Years and over | 0 (0.0%) | 0 (0.0%) |
| Total | 66 (97.1%) | 2 (2.9%) |
Educational Attainment by Field of Study in Grass Valley
Bio, nature & agricultural (21 | 80.8%), education (2 | 7.7%), social sciences (1 | 3.8%), science & technology (1 | 3.8%), and business (1 | 3.8%) are the most common fields of study among 26 individuals in Grass Valley who have obtained a bachelor's degree or higher.
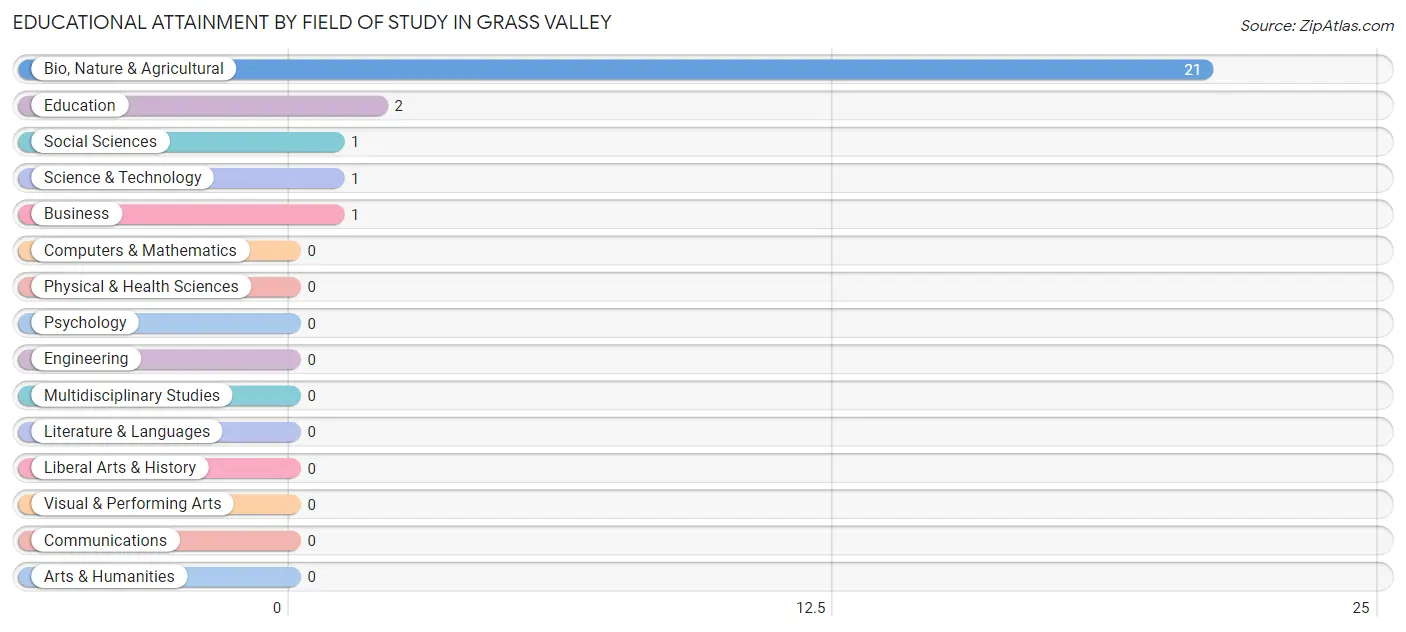
| Field of Study | # Graduates | % Graduates |
| Computers & Mathematics | 0 | 0.0% |
| Bio, Nature & Agricultural | 21 | 80.8% |
| Physical & Health Sciences | 0 | 0.0% |
| Psychology | 0 | 0.0% |
| Social Sciences | 1 | 3.8% |
| Engineering | 0 | 0.0% |
| Multidisciplinary Studies | 0 | 0.0% |
| Science & Technology | 1 | 3.8% |
| Business | 1 | 3.8% |
| Education | 2 | 7.7% |
| Literature & Languages | 0 | 0.0% |
| Liberal Arts & History | 0 | 0.0% |
| Visual & Performing Arts | 0 | 0.0% |
| Communications | 0 | 0.0% |
| Arts & Humanities | 0 | 0.0% |
| Total | 26 | 100.0% |
Transportation & Commute in Grass Valley
Vehicle Availability by Sex in Grass Valley
The most prevalent vehicle ownership categories in Grass Valley are males with 3 vehicles (31, accounting for 55.4%) and females with 3 vehicles (0, making up 63.3%).
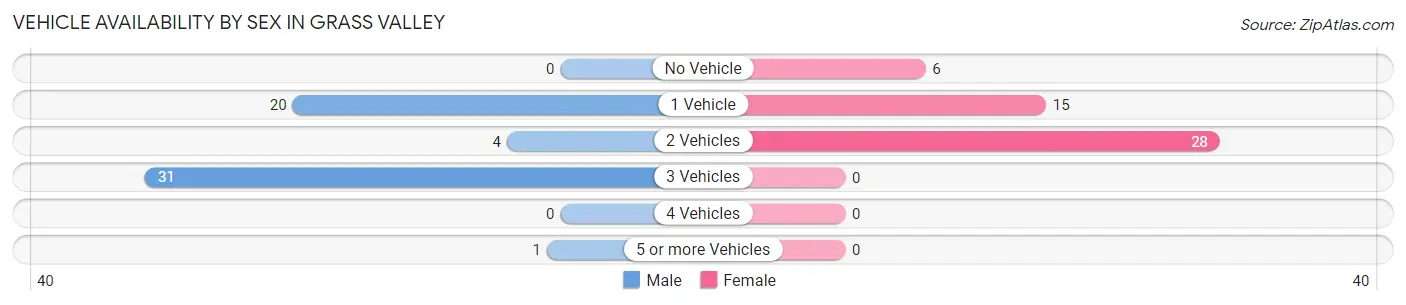
| Vehicles Available | Male | Female |
| No Vehicle | 0 (0.0%) | 6 (12.2%) |
| 1 Vehicle | 20 (35.7%) | 15 (30.6%) |
| 2 Vehicles | 4 (7.1%) | 28 (57.1%) |
| 3 Vehicles | 31 (55.4%) | 0 (0.0%) |
| 4 Vehicles | 0 (0.0%) | 0 (0.0%) |
| 5 or more Vehicles | 1 (1.8%) | 0 (0.0%) |
| Total | 56 (100.0%) | 49 (100.0%) |
Commute Time in Grass Valley
The most frequently occuring commute durations in Grass Valley are 10 to 14 minutes (32 commuters, 28.6%), 15 to 19 minutes (28 commuters, 25.0%), and 20 to 24 minutes (22 commuters, 19.6%).
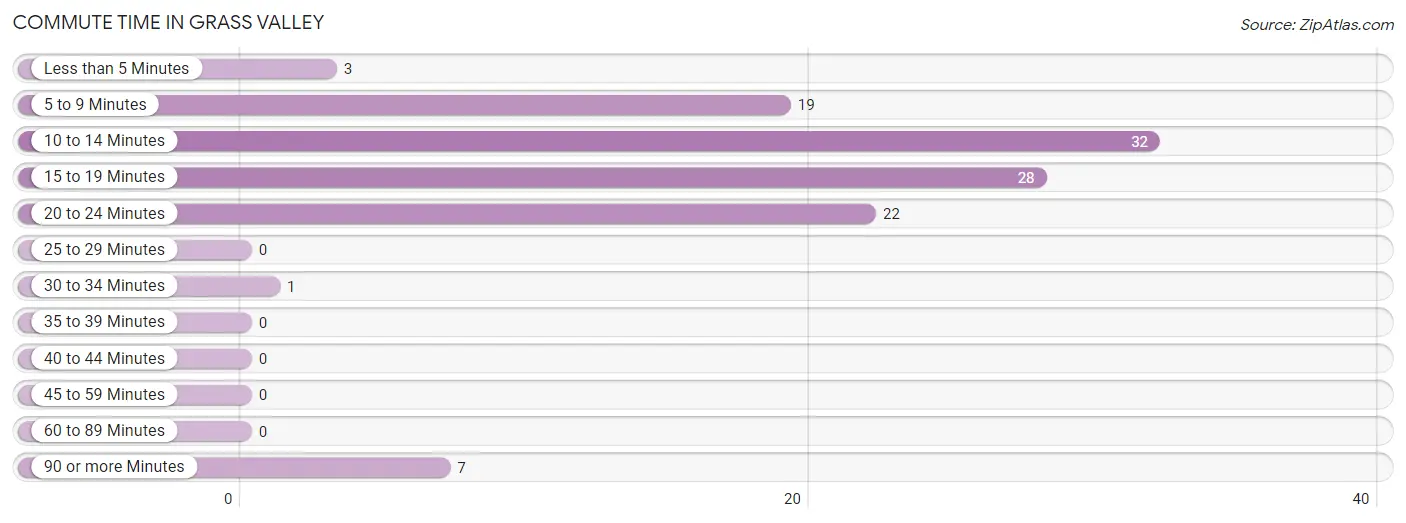
| Commute Time | # Commuters | % Commuters |
| Less than 5 Minutes | 3 | 2.7% |
| 5 to 9 Minutes | 19 | 17.0% |
| 10 to 14 Minutes | 32 | 28.6% |
| 15 to 19 Minutes | 28 | 25.0% |
| 20 to 24 Minutes | 22 | 19.6% |
| 25 to 29 Minutes | 0 | 0.0% |
| 30 to 34 Minutes | 1 | 0.9% |
| 35 to 39 Minutes | 0 | 0.0% |
| 40 to 44 Minutes | 0 | 0.0% |
| 45 to 59 Minutes | 0 | 0.0% |
| 60 to 89 Minutes | 0 | 0.0% |
| 90 or more Minutes | 7 | 6.2% |
Commute Time by Sex in Grass Valley
The most common commute times in Grass Valley are 15 to 19 minutes (22 commuters, 34.9%) for males and 10 to 14 minutes (31 commuters, 63.3%) for females.
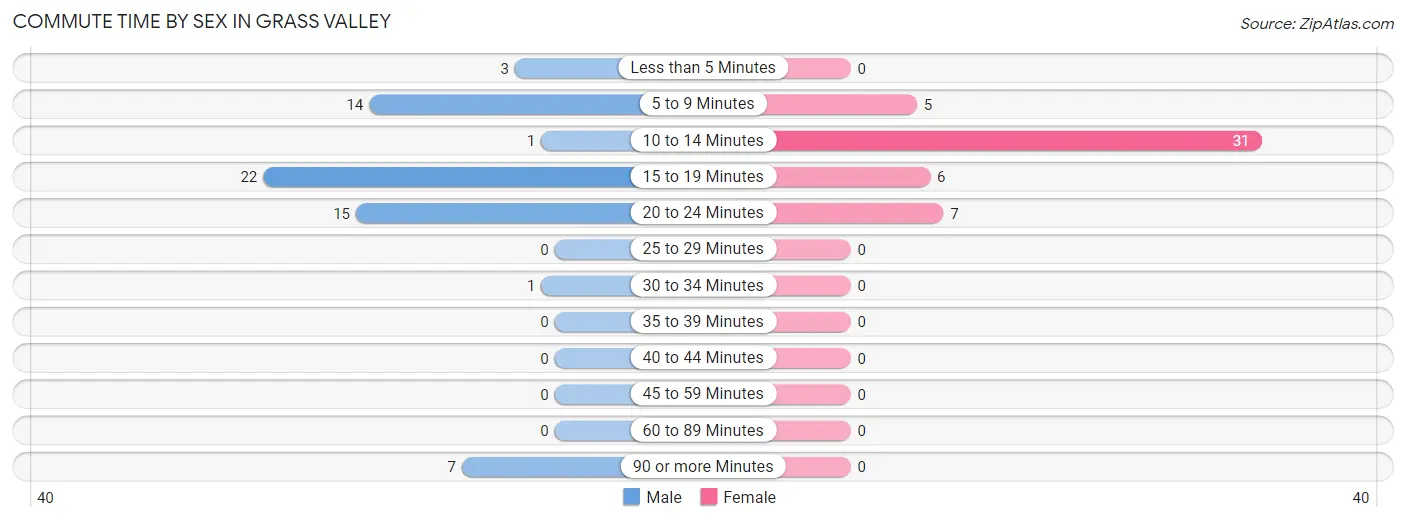
| Commute Time | Male | Female |
| Less than 5 Minutes | 3 (4.8%) | 0 (0.0%) |
| 5 to 9 Minutes | 14 (22.2%) | 5 (10.2%) |
| 10 to 14 Minutes | 1 (1.6%) | 31 (63.3%) |
| 15 to 19 Minutes | 22 (34.9%) | 6 (12.2%) |
| 20 to 24 Minutes | 15 (23.8%) | 7 (14.3%) |
| 25 to 29 Minutes | 0 (0.0%) | 0 (0.0%) |
| 30 to 34 Minutes | 1 (1.6%) | 0 (0.0%) |
| 35 to 39 Minutes | 0 (0.0%) | 0 (0.0%) |
| 40 to 44 Minutes | 0 (0.0%) | 0 (0.0%) |
| 45 to 59 Minutes | 0 (0.0%) | 0 (0.0%) |
| 60 to 89 Minutes | 0 (0.0%) | 0 (0.0%) |
| 90 or more Minutes | 7 (11.1%) | 0 (0.0%) |
Time of Departure to Work by Sex in Grass Valley
The most frequent times of departure to work in Grass Valley are 12:00 AM to 4:59 AM (18, 28.6%) for males and 6:30 AM to 6:59 AM (21, 42.9%) for females.
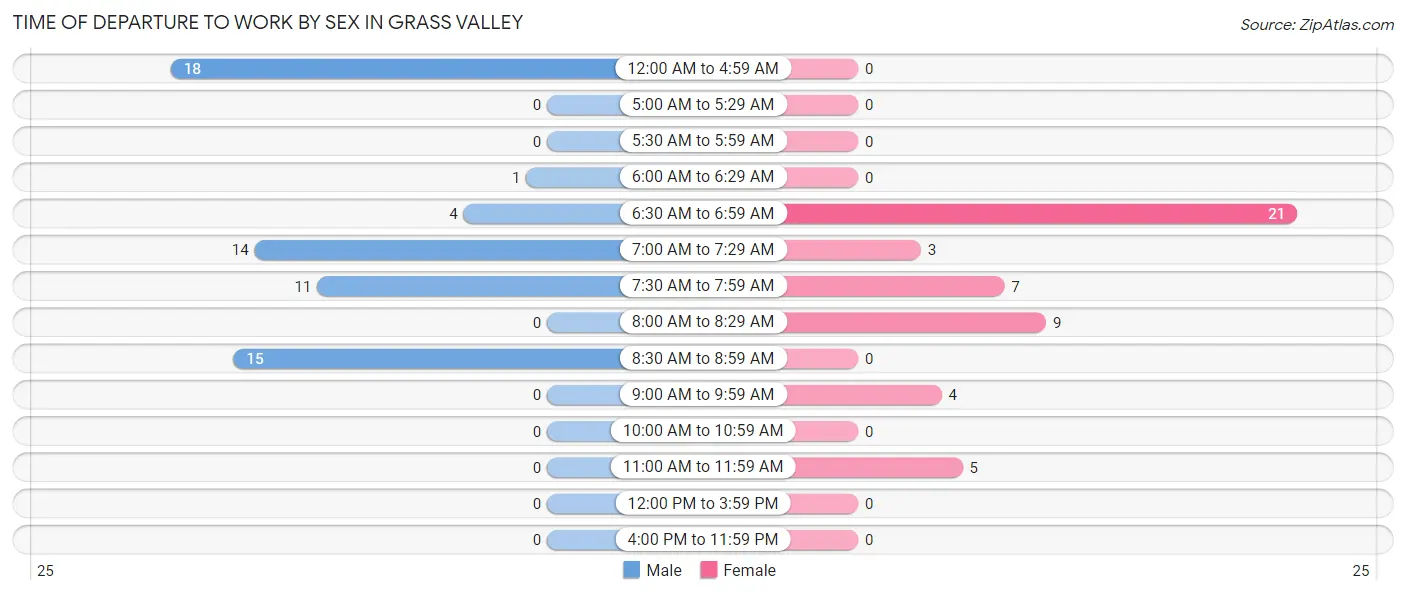
| Time of Departure | Male | Female |
| 12:00 AM to 4:59 AM | 18 (28.6%) | 0 (0.0%) |
| 5:00 AM to 5:29 AM | 0 (0.0%) | 0 (0.0%) |
| 5:30 AM to 5:59 AM | 0 (0.0%) | 0 (0.0%) |
| 6:00 AM to 6:29 AM | 1 (1.6%) | 0 (0.0%) |
| 6:30 AM to 6:59 AM | 4 (6.4%) | 21 (42.9%) |
| 7:00 AM to 7:29 AM | 14 (22.2%) | 3 (6.1%) |
| 7:30 AM to 7:59 AM | 11 (17.5%) | 7 (14.3%) |
| 8:00 AM to 8:29 AM | 0 (0.0%) | 9 (18.4%) |
| 8:30 AM to 8:59 AM | 15 (23.8%) | 0 (0.0%) |
| 9:00 AM to 9:59 AM | 0 (0.0%) | 4 (8.2%) |
| 10:00 AM to 10:59 AM | 0 (0.0%) | 0 (0.0%) |
| 11:00 AM to 11:59 AM | 0 (0.0%) | 5 (10.2%) |
| 12:00 PM to 3:59 PM | 0 (0.0%) | 0 (0.0%) |
| 4:00 PM to 11:59 PM | 0 (0.0%) | 0 (0.0%) |
| Total | 63 (100.0%) | 49 (100.0%) |
Housing Occupancy in Grass Valley
Occupancy by Ownership in Grass Valley
Of the total 92 dwellings in Grass Valley, owner-occupied units account for 49 (53.3%), while renter-occupied units make up 43 (46.7%).
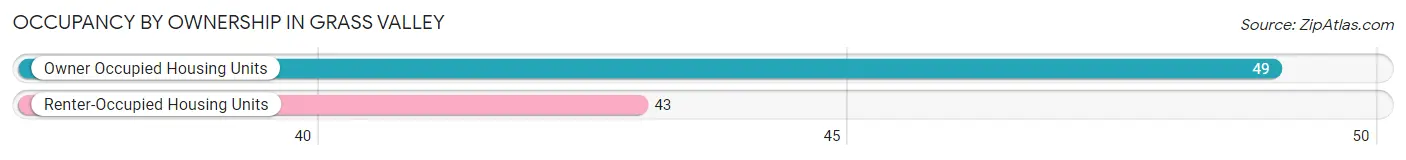
| Occupancy | # Housing Units | % Housing Units |
| Owner Occupied Housing Units | 49 | 53.3% |
| Renter-Occupied Housing Units | 43 | 46.7% |
| Total Occupied Housing Units | 92 | 100.0% |
Occupancy by Household Size in Grass Valley
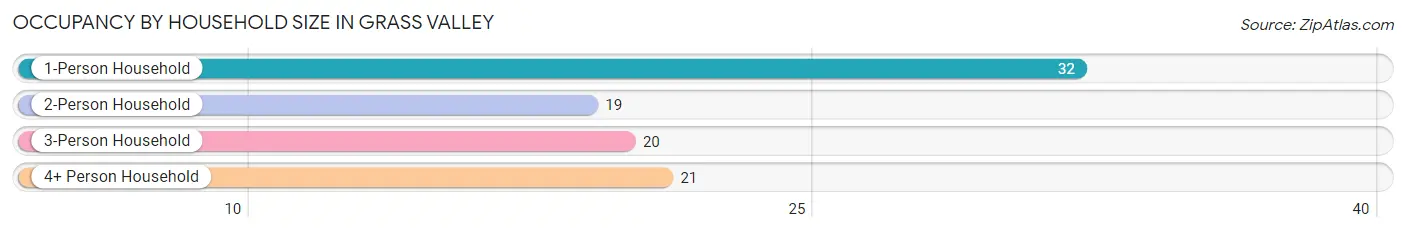
| Household Size | # Housing Units | % Housing Units |
| 1-Person Household | 32 | 34.8% |
| 2-Person Household | 19 | 20.6% |
| 3-Person Household | 20 | 21.7% |
| 4+ Person Household | 21 | 22.8% |
| Total Housing Units | 92 | 100.0% |
Occupancy by Ownership by Household Size in Grass Valley
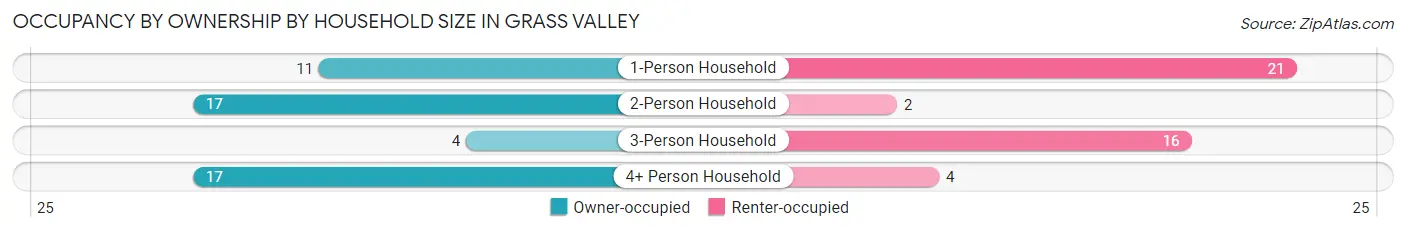
| Household Size | Owner-occupied | Renter-occupied |
| 1-Person Household | 11 (34.4%) | 21 (65.6%) |
| 2-Person Household | 17 (89.5%) | 2 (10.5%) |
| 3-Person Household | 4 (20.0%) | 16 (80.0%) |
| 4+ Person Household | 17 (80.9%) | 4 (19.1%) |
| Total Housing Units | 49 (53.3%) | 43 (46.7%) |
Occupancy by Educational Attainment in Grass Valley
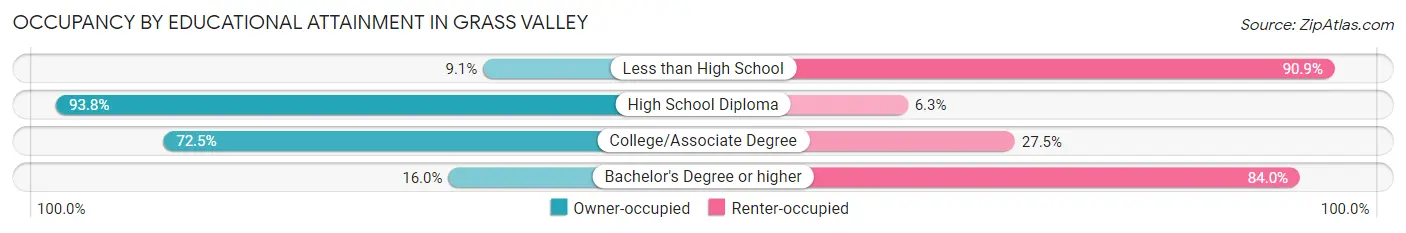
| Household Size | Owner-occupied | Renter-occupied |
| Less than High School | 1 (9.1%) | 10 (90.9%) |
| High School Diploma | 15 (93.8%) | 1 (6.2%) |
| College/Associate Degree | 29 (72.5%) | 11 (27.5%) |
| Bachelor's Degree or higher | 4 (16.0%) | 21 (84.0%) |
Occupancy by Age of Householder in Grass Valley
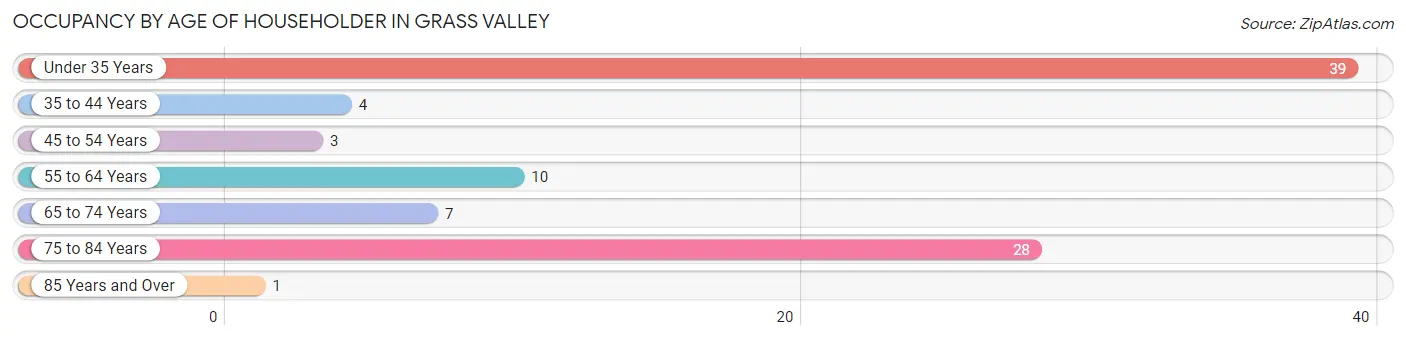
| Age Bracket | # Households | % Households |
| Under 35 Years | 39 | 42.4% |
| 35 to 44 Years | 4 | 4.3% |
| 45 to 54 Years | 3 | 3.3% |
| 55 to 64 Years | 10 | 10.9% |
| 65 to 74 Years | 7 | 7.6% |
| 75 to 84 Years | 28 | 30.4% |
| 85 Years and Over | 1 | 1.1% |
| Total | 92 | 100.0% |
Housing Finances in Grass Valley
Median Income by Occupancy in Grass Valley
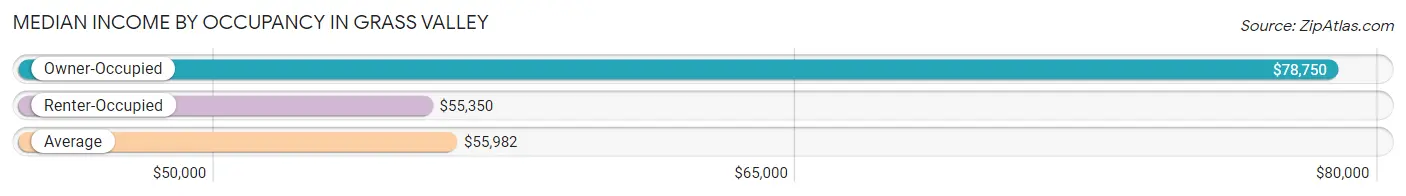
| Occupancy Type | # Households | Median Income |
| Owner-Occupied | 49 (53.3%) | $78,750 |
| Renter-Occupied | 43 (46.7%) | $55,350 |
| Average | 92 (100.0%) | $55,982 |
Occupancy by Householder Income Bracket in Grass Valley
| Income Bracket | Owner-occupied | Renter-occupied |
| Less than $5,000 | 0 (0.0%) | 3 (7.0%) |
| $5,000 to $9,999 | 0 (0.0%) | 0 (0.0%) |
| $10,000 to $14,999 | 4 (8.2%) | 0 (0.0%) |
| $15,000 to $19,999 | 0 (0.0%) | 1 (2.3%) |
| $20,000 to $24,999 | 6 (12.2%) | 6 (14.0%) |
| $25,000 to $34,999 | 5 (10.2%) | 0 (0.0%) |
| $35,000 to $49,999 | 1 (2.0%) | 8 (18.6%) |
| $50,000 to $74,999 | 7 (14.3%) | 25 (58.1%) |
| $75,000 to $99,999 | 21 (42.9%) | 0 (0.0%) |
| $100,000 to $149,999 | 1 (2.0%) | 0 (0.0%) |
| $150,000 or more | 4 (8.2%) | 0 (0.0%) |
| Total | 49 (100.0%) | 43 (100.0%) |
Monthly Housing Cost Tiers in Grass Valley
| Monthly Cost | Owner-occupied | Renter-occupied |
| Less than $300 | 6 (12.2%) | 0 (0.0%) |
| $300 to $499 | 7 (14.3%) | 28 (65.1%) |
| $500 to $799 | 11 (22.5%) | 2 (4.6%) |
| $800 to $999 | 15 (30.6%) | 3 (7.0%) |
| $1,000 to $1,499 | 8 (16.3%) | 10 (23.3%) |
| $1,500 to $1,999 | 0 (0.0%) | 0 (0.0%) |
| $2,000 to $2,499 | 1 (2.0%) | 0 (0.0%) |
| $2,500 to $2,999 | 1 (2.0%) | 0 (0.0%) |
| $3,000 or more | 0 (0.0%) | 0 (0.0%) |
| Total | 49 (100.0%) | 43 (100.0%) |
Physical Housing Characteristics in Grass Valley
Housing Structures in Grass Valley
| Structure Type | # Housing Units | % Housing Units |
| Single Unit, Detached | 41 | 44.6% |
| Single Unit, Attached | 0 | 0.0% |
| 2 Unit Apartments | 1 | 1.1% |
| 3 or 4 Unit Apartments | 0 | 0.0% |
| 5 to 9 Unit Apartments | 3 | 3.3% |
| 10 or more Apartments | 7 | 7.6% |
| Mobile Home / Other | 40 | 43.5% |
| Total | 92 | 100.0% |
Housing Structures by Occupancy in Grass Valley
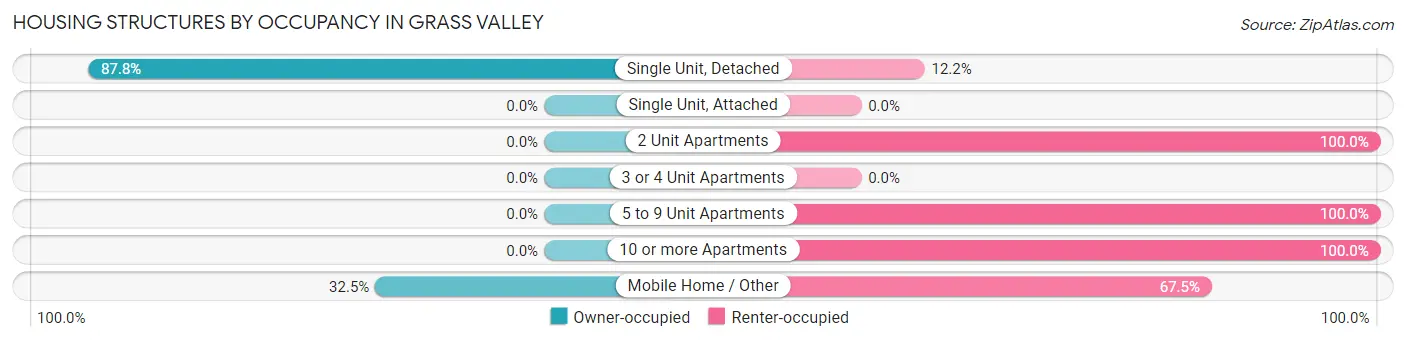
| Structure Type | Owner-occupied | Renter-occupied |
| Single Unit, Detached | 36 (87.8%) | 5 (12.2%) |
| Single Unit, Attached | 0 (0.0%) | 0 (0.0%) |
| 2 Unit Apartments | 0 (0.0%) | 1 (100.0%) |
| 3 or 4 Unit Apartments | 0 (0.0%) | 0 (0.0%) |
| 5 to 9 Unit Apartments | 0 (0.0%) | 3 (100.0%) |
| 10 or more Apartments | 0 (0.0%) | 7 (100.0%) |
| Mobile Home / Other | 13 (32.5%) | 27 (67.5%) |
| Total | 49 (53.3%) | 43 (46.7%) |
Housing Structures by Number of Rooms in Grass Valley
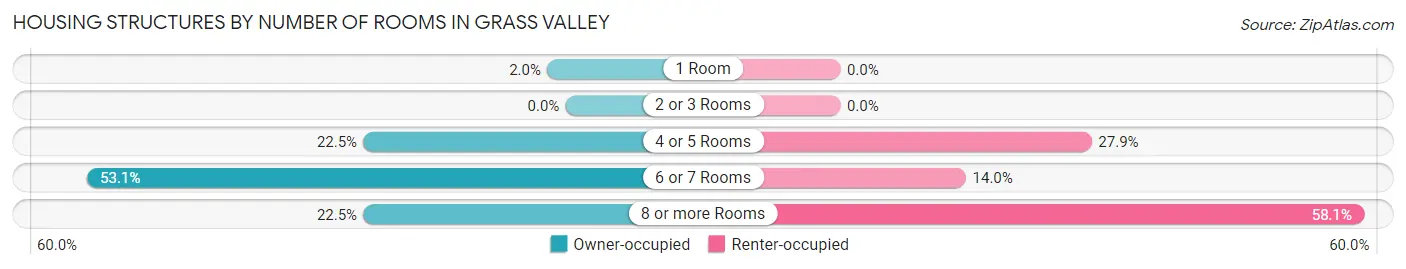
| Number of Rooms | Owner-occupied | Renter-occupied |
| 1 Room | 1 (2.0%) | 0 (0.0%) |
| 2 or 3 Rooms | 0 (0.0%) | 0 (0.0%) |
| 4 or 5 Rooms | 11 (22.5%) | 12 (27.9%) |
| 6 or 7 Rooms | 26 (53.1%) | 6 (14.0%) |
| 8 or more Rooms | 11 (22.5%) | 25 (58.1%) |
| Total | 49 (100.0%) | 43 (100.0%) |
Housing Structure by Heating Type in Grass Valley
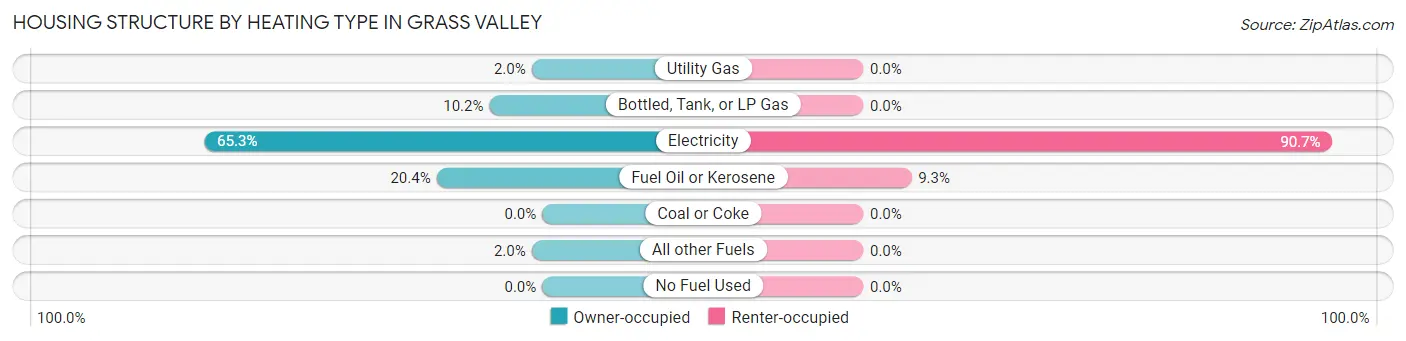
| Heating Type | Owner-occupied | Renter-occupied |
| Utility Gas | 1 (2.0%) | 0 (0.0%) |
| Bottled, Tank, or LP Gas | 5 (10.2%) | 0 (0.0%) |
| Electricity | 32 (65.3%) | 39 (90.7%) |
| Fuel Oil or Kerosene | 10 (20.4%) | 4 (9.3%) |
| Coal or Coke | 0 (0.0%) | 0 (0.0%) |
| All other Fuels | 1 (2.0%) | 0 (0.0%) |
| No Fuel Used | 0 (0.0%) | 0 (0.0%) |
| Total | 49 (100.0%) | 43 (100.0%) |
Household Vehicle Usage in Grass Valley
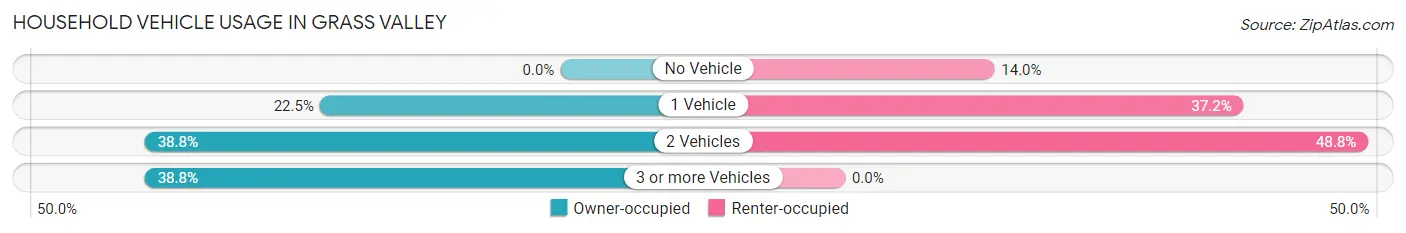
| Vehicles per Household | Owner-occupied | Renter-occupied |
| No Vehicle | 0 (0.0%) | 6 (14.0%) |
| 1 Vehicle | 11 (22.5%) | 16 (37.2%) |
| 2 Vehicles | 19 (38.8%) | 21 (48.8%) |
| 3 or more Vehicles | 19 (38.8%) | 0 (0.0%) |
| Total | 49 (100.0%) | 43 (100.0%) |
Real Estate & Mortgages in Grass Valley
Real Estate and Mortgage Overview in Grass Valley
| Characteristic | Without Mortgage | With Mortgage |
| Housing Units | 33 | 16 |
| Median Property Value | $121,500 | $0 |
| Median Household Income | $90,250 | $1 |
| Monthly Housing Costs | $688 | $0 |
| Real Estate Taxes | $2,029 | $0 |
Property Value by Mortgage Status in Grass Valley
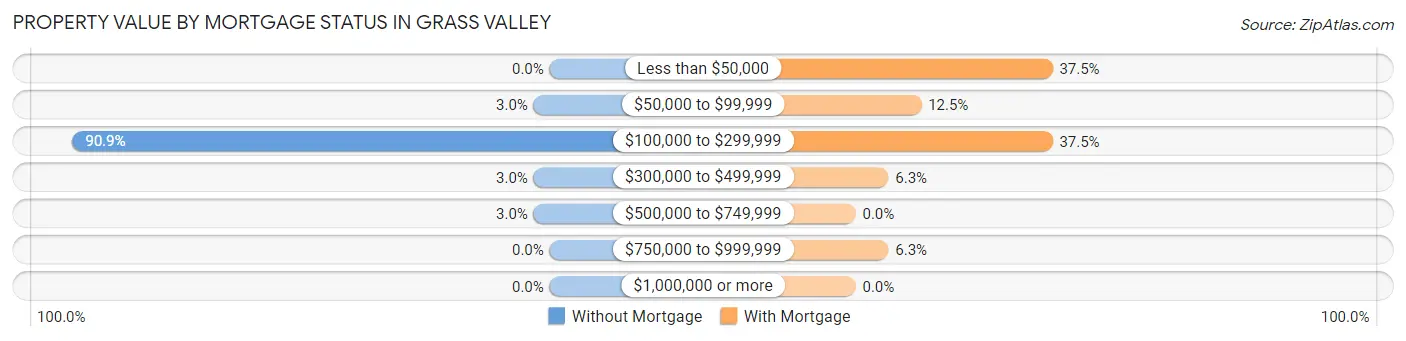
| Property Value | Without Mortgage | With Mortgage |
| Less than $50,000 | 0 (0.0%) | 6 (37.5%) |
| $50,000 to $99,999 | 1 (3.0%) | 2 (12.5%) |
| $100,000 to $299,999 | 30 (90.9%) | 6 (37.5%) |
| $300,000 to $499,999 | 1 (3.0%) | 1 (6.2%) |
| $500,000 to $749,999 | 1 (3.0%) | 0 (0.0%) |
| $750,000 to $999,999 | 0 (0.0%) | 1 (6.2%) |
| $1,000,000 or more | 0 (0.0%) | 0 (0.0%) |
| Total | 33 (100.0%) | 16 (100.0%) |
Household Income by Mortgage Status in Grass Valley
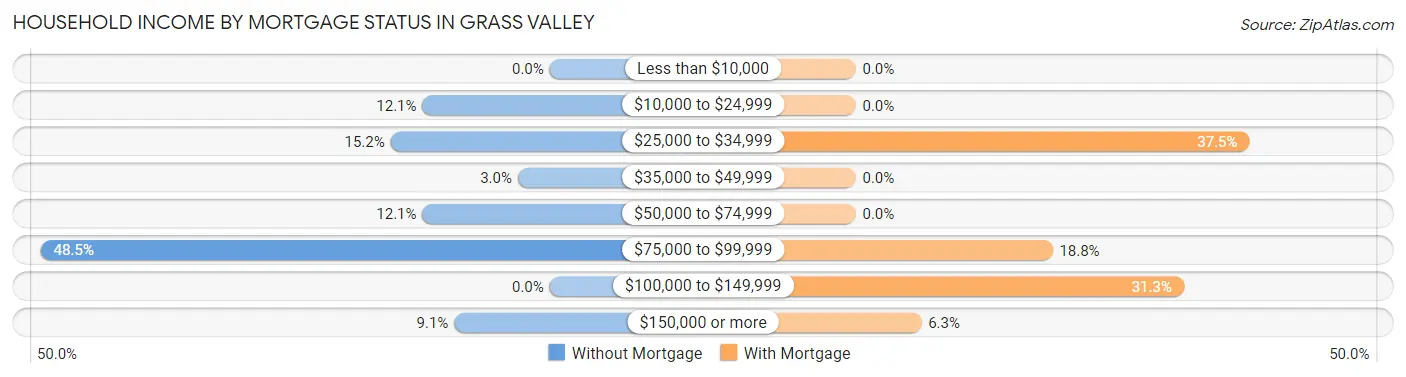
| Household Income | Without Mortgage | With Mortgage |
| Less than $10,000 | 0 (0.0%) | 0 (0.0%) |
| $10,000 to $24,999 | 4 (12.1%) | 0 (0.0%) |
| $25,000 to $34,999 | 5 (15.1%) | 6 (37.5%) |
| $35,000 to $49,999 | 1 (3.0%) | 0 (0.0%) |
| $50,000 to $74,999 | 4 (12.1%) | 0 (0.0%) |
| $75,000 to $99,999 | 16 (48.5%) | 3 (18.8%) |
| $100,000 to $149,999 | 0 (0.0%) | 5 (31.2%) |
| $150,000 or more | 3 (9.1%) | 1 (6.2%) |
| Total | 33 (100.0%) | 16 (100.0%) |
Property Value to Household Income Ratio in Grass Valley
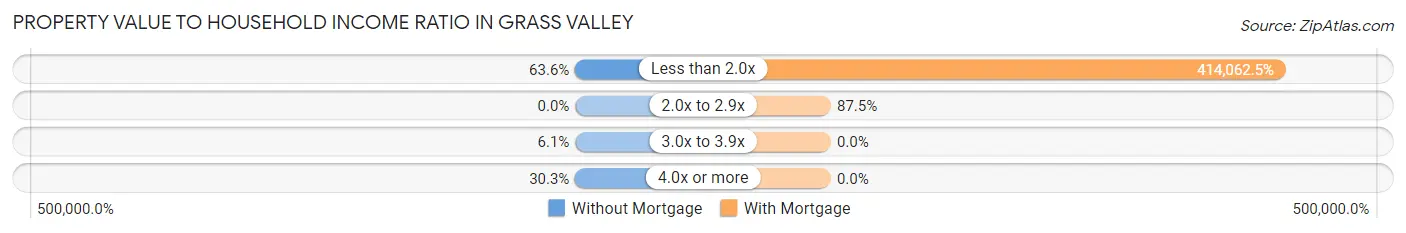
| Value-to-Income Ratio | Without Mortgage | With Mortgage |
| Less than 2.0x | 21 (63.6%) | 66,250 (414,062.5%) |
| 2.0x to 2.9x | 0 (0.0%) | 14 (87.5%) |
| 3.0x to 3.9x | 2 (6.1%) | 0 (0.0%) |
| 4.0x or more | 10 (30.3%) | 0 (0.0%) |
| Total | 33 (100.0%) | 16 (100.0%) |
Real Estate Taxes by Mortgage Status in Grass Valley
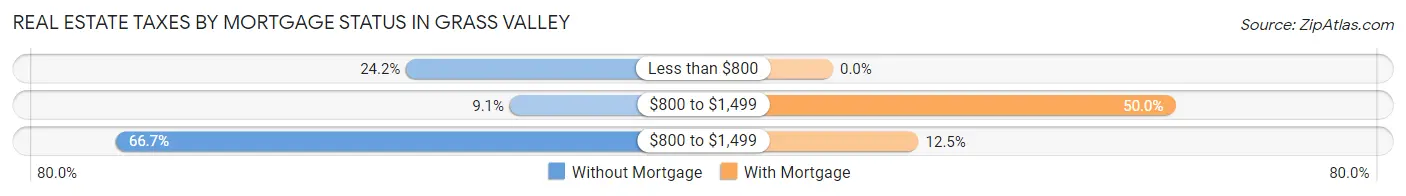
| Property Taxes | Without Mortgage | With Mortgage |
| Less than $800 | 8 (24.2%) | 0 (0.0%) |
| $800 to $1,499 | 3 (9.1%) | 8 (50.0%) |
| $800 to $1,499 | 22 (66.7%) | 2 (12.5%) |
| Total | 33 (100.0%) | 16 (100.0%) |
Health & Disability in Grass Valley
Health Insurance Coverage by Age in Grass Valley
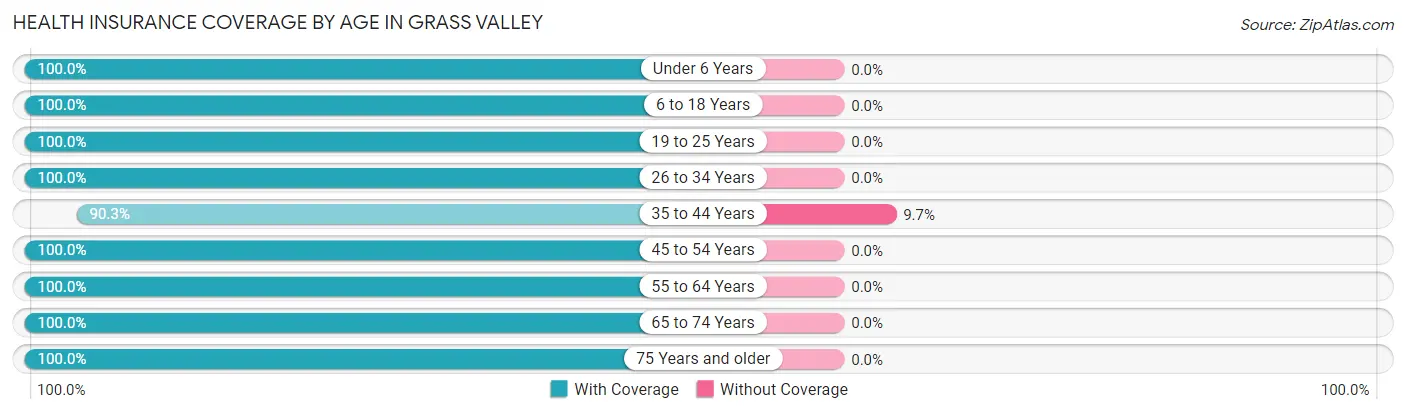
| Age Bracket | With Coverage | Without Coverage |
| Under 6 Years | 27 (100.0%) | 0 (0.0%) |
| 6 to 18 Years | 52 (100.0%) | 0 (0.0%) |
| 19 to 25 Years | 27 (100.0%) | 0 (0.0%) |
| 26 to 34 Years | 44 (100.0%) | 0 (0.0%) |
| 35 to 44 Years | 28 (90.3%) | 3 (9.7%) |
| 45 to 54 Years | 18 (100.0%) | 0 (0.0%) |
| 55 to 64 Years | 11 (100.0%) | 0 (0.0%) |
| 65 to 74 Years | 29 (100.0%) | 0 (0.0%) |
| 75 Years and older | 39 (100.0%) | 0 (0.0%) |
| Total | 275 (98.9%) | 3 (1.1%) |
Health Insurance Coverage by Citizenship Status in Grass Valley
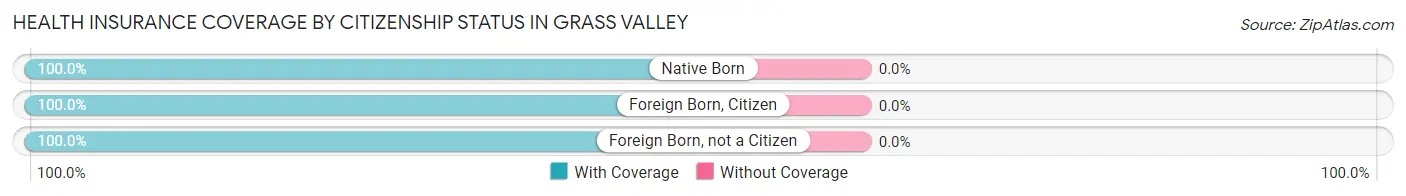
| Citizenship Status | With Coverage | Without Coverage |
| Native Born | 27 (100.0%) | 0 (0.0%) |
| Foreign Born, Citizen | 52 (100.0%) | 0 (0.0%) |
| Foreign Born, not a Citizen | 27 (100.0%) | 0 (0.0%) |
Health Insurance Coverage by Household Income in Grass Valley
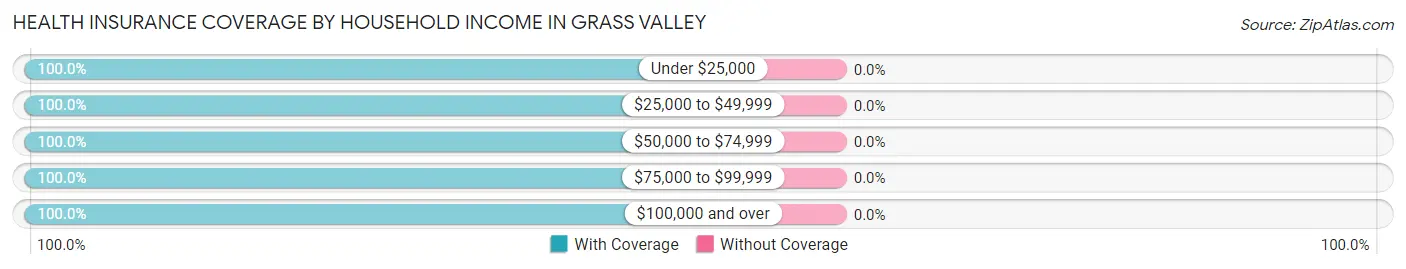
| Household Income | With Coverage | Without Coverage |
| Under $25,000 | 67 (100.0%) | 0 (0.0%) |
| $25,000 to $49,999 | 34 (100.0%) | 0 (0.0%) |
| $50,000 to $74,999 | 71 (100.0%) | 0 (0.0%) |
| $75,000 to $99,999 | 85 (100.0%) | 0 (0.0%) |
| $100,000 and over | 10 (100.0%) | 0 (0.0%) |
Public vs Private Health Insurance Coverage by Age in Grass Valley
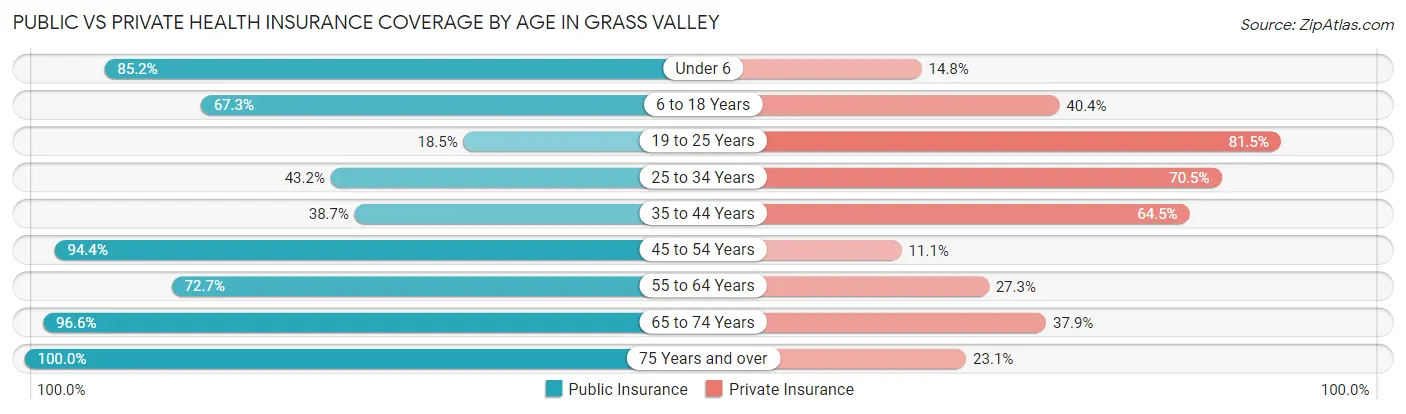
| Age Bracket | Public Insurance | Private Insurance |
| Under 6 | 23 (85.2%) | 4 (14.8%) |
| 6 to 18 Years | 35 (67.3%) | 21 (40.4%) |
| 19 to 25 Years | 5 (18.5%) | 22 (81.5%) |
| 25 to 34 Years | 19 (43.2%) | 31 (70.5%) |
| 35 to 44 Years | 12 (38.7%) | 20 (64.5%) |
| 45 to 54 Years | 17 (94.4%) | 2 (11.1%) |
| 55 to 64 Years | 8 (72.7%) | 3 (27.3%) |
| 65 to 74 Years | 28 (96.6%) | 11 (37.9%) |
| 75 Years and over | 39 (100.0%) | 9 (23.1%) |
| Total | 186 (66.9%) | 123 (44.2%) |
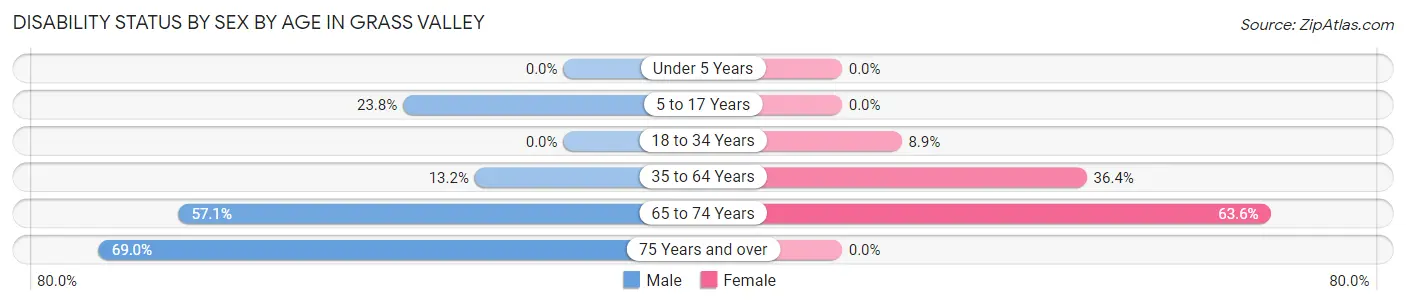
Disability Status by Sex by Age in Grass Valley
| Age Bracket | Male | Female |
| Under 5 Years | 0 (0.0%) | 0 (0.0%) |
| 5 to 17 Years | 5 (23.8%) | 0 (0.0%) |
| 18 to 34 Years | 0 (0.0%) | 7 (8.9%) |
| 35 to 64 Years | 5 (13.2%) | 8 (36.4%) |
| 65 to 74 Years | 4 (57.1%) | 14 (63.6%) |
| 75 Years and over | 20 (69.0%) | 0 (0.0%) |
Disability Class by Sex by Age in Grass Valley
Disability Class: Hearing Difficulty
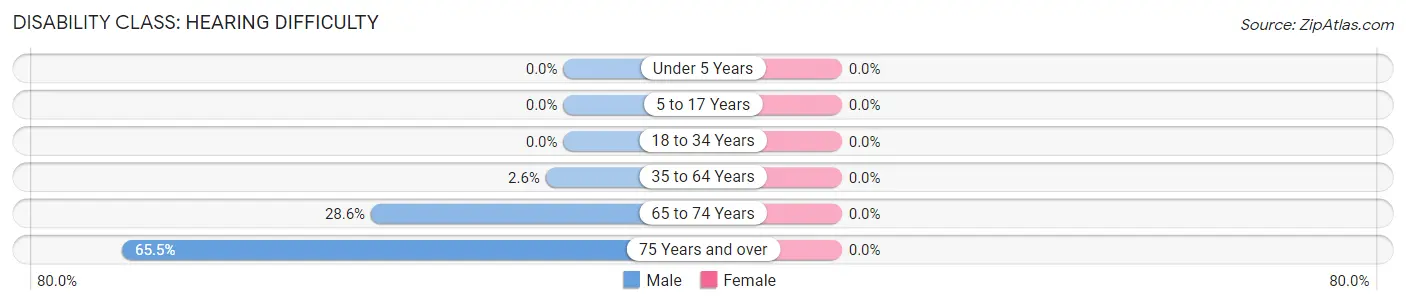
| Age Bracket | Male | Female |
| Under 5 Years | 0 (0.0%) | 0 (0.0%) |
| 5 to 17 Years | 0 (0.0%) | 0 (0.0%) |
| 18 to 34 Years | 0 (0.0%) | 0 (0.0%) |
| 35 to 64 Years | 1 (2.6%) | 0 (0.0%) |
| 65 to 74 Years | 2 (28.6%) | 0 (0.0%) |
| 75 Years and over | 19 (65.5%) | 0 (0.0%) |
Disability Class: Vision Difficulty
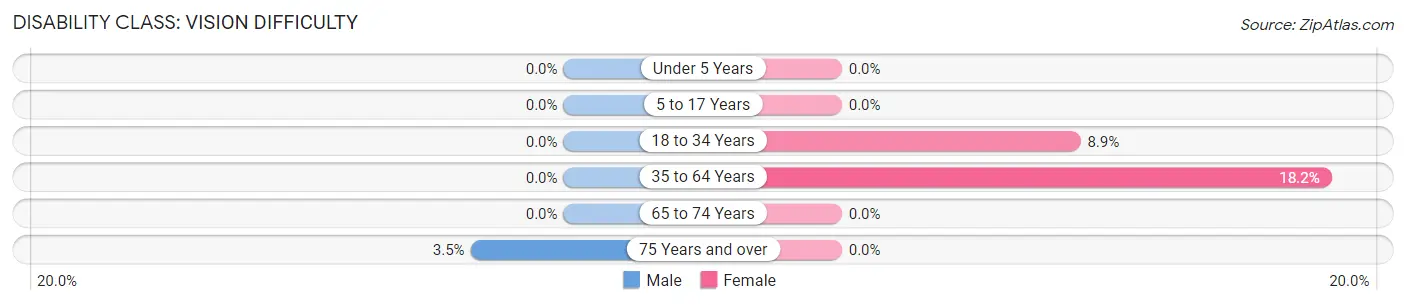
| Age Bracket | Male | Female |
| Under 5 Years | 0 (0.0%) | 0 (0.0%) |
| 5 to 17 Years | 0 (0.0%) | 0 (0.0%) |
| 18 to 34 Years | 0 (0.0%) | 7 (8.9%) |
| 35 to 64 Years | 0 (0.0%) | 4 (18.2%) |
| 65 to 74 Years | 0 (0.0%) | 0 (0.0%) |
| 75 Years and over | 1 (3.5%) | 0 (0.0%) |
Disability Class: Cognitive Difficulty
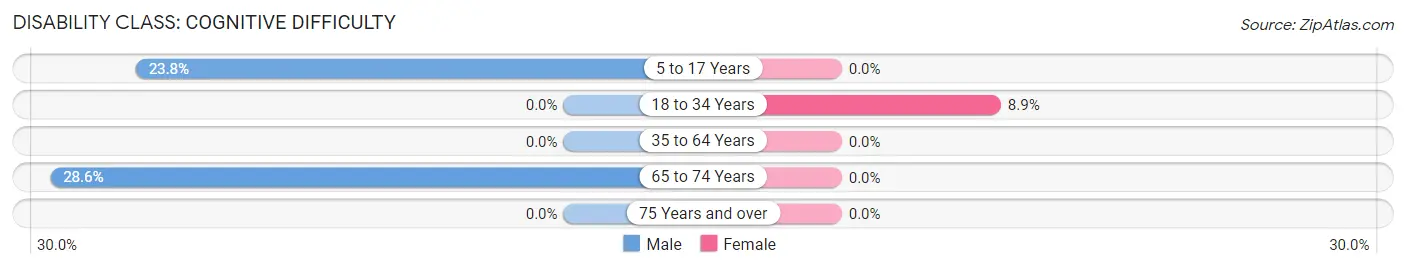
| Age Bracket | Male | Female |
| 5 to 17 Years | 5 (23.8%) | 0 (0.0%) |
| 18 to 34 Years | 0 (0.0%) | 7 (8.9%) |
| 35 to 64 Years | 0 (0.0%) | 0 (0.0%) |
| 65 to 74 Years | 2 (28.6%) | 0 (0.0%) |
| 75 Years and over | 0 (0.0%) | 0 (0.0%) |
Disability Class: Ambulatory Difficulty
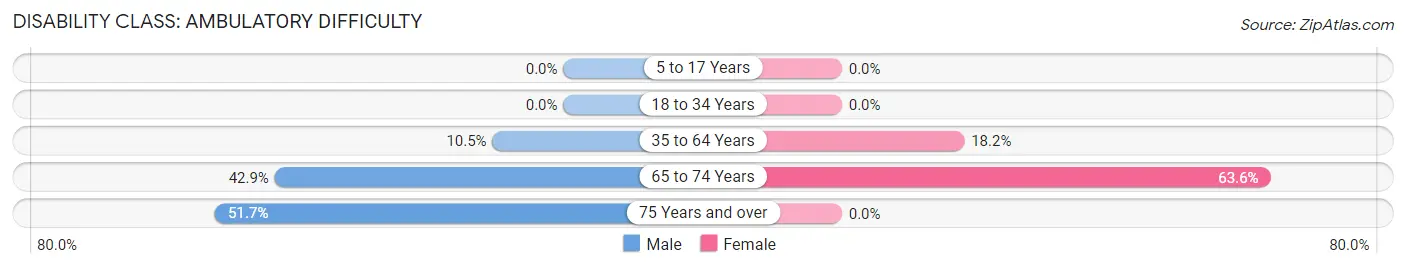
| Age Bracket | Male | Female |
| 5 to 17 Years | 0 (0.0%) | 0 (0.0%) |
| 18 to 34 Years | 0 (0.0%) | 0 (0.0%) |
| 35 to 64 Years | 4 (10.5%) | 4 (18.2%) |
| 65 to 74 Years | 3 (42.9%) | 14 (63.6%) |
| 75 Years and over | 15 (51.7%) | 0 (0.0%) |
Disability Class: Self-Care Difficulty
| Age Bracket | Male | Female |
| 5 to 17 Years | 0 (0.0%) | 0 (0.0%) |
| 18 to 34 Years | 0 (0.0%) | 0 (0.0%) |
| 35 to 64 Years | 0 (0.0%) | 0 (0.0%) |
| 65 to 74 Years | 0 (0.0%) | 0 (0.0%) |
| 75 Years and over | 0 (0.0%) | 0 (0.0%) |
Technology Access in Grass Valley
Computing Device Access in Grass Valley
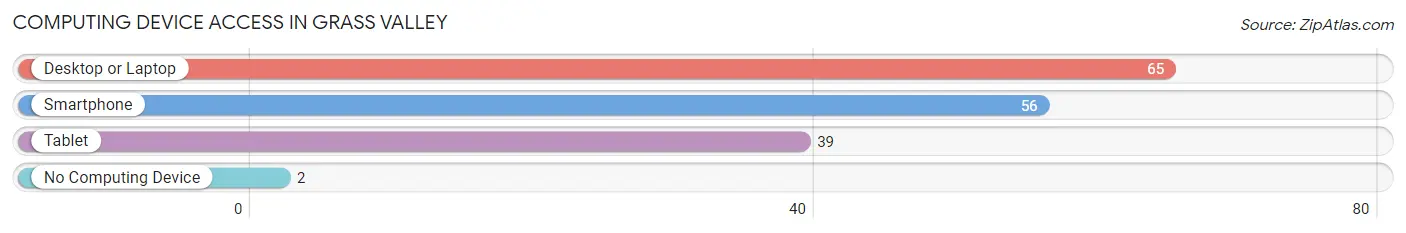
| Device Type | # Households | % Households |
| Desktop or Laptop | 65 | 70.7% |
| Smartphone | 56 | 60.9% |
| Tablet | 39 | 42.4% |
| No Computing Device | 2 | 2.2% |
| Total | 92 | 100.0% |
Internet Access in Grass Valley
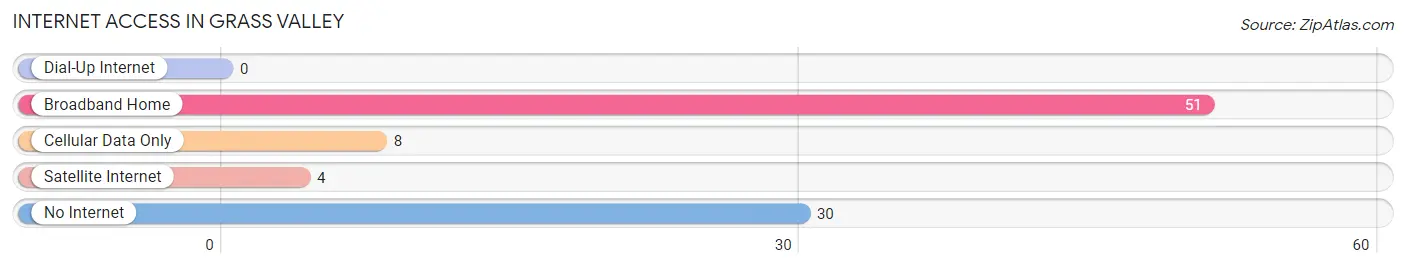
| Internet Type | # Households | % Households |
| Dial-Up Internet | 0 | 0.0% |
| Broadband Home | 51 | 55.4% |
| Cellular Data Only | 8 | 8.7% |
| Satellite Internet | 4 | 4.3% |
| No Internet | 30 | 32.6% |
| Total | 92 | 100.0% |
Grass Valley Summary
Grass Valley is a small unincorporated community located in the foothills of the Cascade Mountains in Lane County, Oregon. It is situated at the intersection of Oregon Route 58 and Oregon Route 126, approximately 25 miles east of Eugene. The population of Grass Valley was estimated to be around 500 in 2020.
History
Grass Valley was first settled in the late 1800s by homesteaders who were attracted to the area by its fertile soil and abundant water supply. The first post office was established in 1891 and the town was officially incorporated in 1895. The town was named after the grassy meadows that surrounded it.
In the early 1900s, Grass Valley was a thriving agricultural community, with a variety of crops being grown in the area. The town was also home to a number of businesses, including a general store, a blacksmith shop, a sawmill, and a hotel.
In the 1950s, the town began to decline as the local economy shifted away from agriculture and towards timber and logging. The population of Grass Valley decreased significantly during this time, and the town was eventually unincorporated in the 1970s.
Geography
Grass Valley is located in the foothills of the Cascade Mountains in Lane County, Oregon. The town is situated at the intersection of Oregon Route 58 and Oregon Route 126, approximately 25 miles east of Eugene.
The terrain around Grass Valley is mostly rolling hills and grassy meadows, with some areas of dense forest. The area is known for its abundant wildlife, including deer, elk, and a variety of birds.
The climate in Grass Valley is mild and temperate, with warm summers and cool winters. The average annual temperature is around 50°F, and the average annual precipitation is around 40 inches.
Economy
Grass Valley is a small, rural community with a limited economy. The primary industries in the area are agriculture and timber.
Agriculture is the main economic activity in Grass Valley, with a variety of crops being grown in the area. The most common crops are hay, wheat, and oats.
Timber is also an important part of the local economy, with several logging companies operating in the area. The timber industry has been in decline in recent years, however, due to environmental regulations and the increasing cost of timber.
Demographics
The population of Grass Valley was estimated to be around 500 in 2020. The town is predominantly white, with a small Hispanic population. The median household income in Grass Valley is around $45,000, and the median home value is around $200,000.
The town is served by the Lane County School District, with two elementary schools and one high school. The town also has a public library and a community center.
Common Questions
What is Per Capita Income in Grass Valley?
Per Capita income in Grass Valley is $22,034.
What is the Median Family Income in Grass Valley?
Median Family Income in Grass Valley is $57,292.
What is the Median Household income in Grass Valley?
Median Household Income in Grass Valley is $55,982.
What is Inequality or Gini Index in Grass Valley?
Inequality or Gini Index in Grass Valley is 0.33.
What is the Total Population of Grass Valley?
Total Population of Grass Valley is 278.
What is the Total Male Population of Grass Valley?
Total Male Population of Grass Valley is 117.
What is the Total Female Population of Grass Valley?
Total Female Population of Grass Valley is 161.
What is the Ratio of Males per 100 Females in Grass Valley?
There are 72.67 Males per 100 Females in Grass Valley.
What is the Ratio of Females per 100 Males in Grass Valley?
There are 137.61 Females per 100 Males in Grass Valley.
What is the Median Population Age in Grass Valley?
Median Population Age in Grass Valley is 32.8 Years.
What is the Average Family Size in Grass Valley
Average Family Size in Grass Valley is 3.6 People.
What is the Average Household Size in Grass Valley
Average Household Size in Grass Valley is 2.9 People.
How Large is the Labor Force in Grass Valley?
There are 121 People in the Labor Forcein in Grass Valley.
What is the Percentage of People in the Labor Force in Grass Valley?
52.8% of People are in the Labor Force in Grass Valley.
What is the Unemployment Rate in Grass Valley?
Unemployment Rate in Grass Valley is 0.8%.