Antelope, OR Map & Demographics
Antelope Map
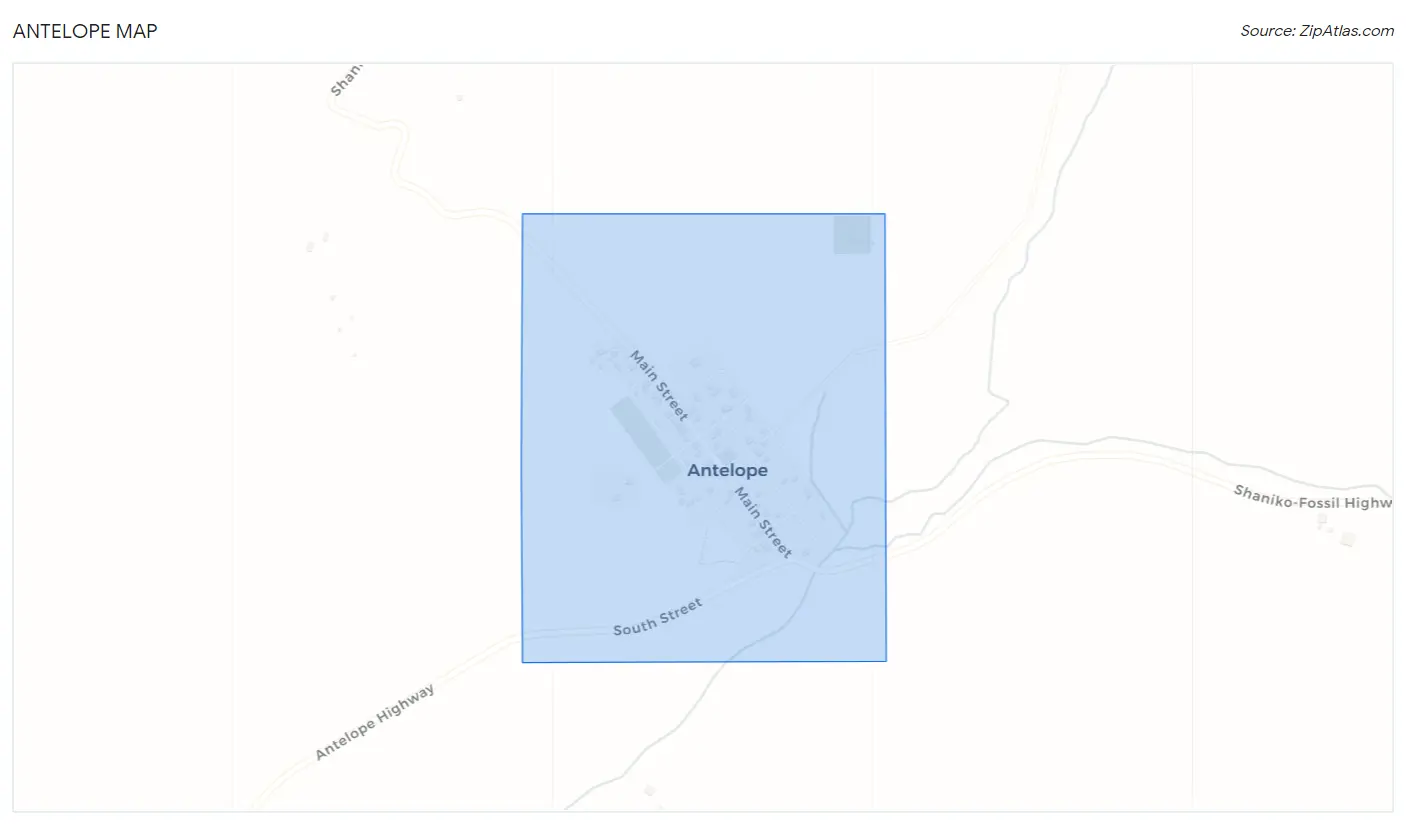
Antelope Overview
$30,449
PER CAPITA INCOME
$59,643
AVG HOUSEHOLD INCOME
0.17
INEQUALITY / GINI INDEX
71
TOTAL POPULATION
55
MALE POPULATION
16
FEMALE POPULATION
343.75
MALES / 100 FEMALES
29.09
FEMALES / 100 MALES
31.8
MEDIAN AGE
3.3
AVG FAMILY SIZE
3.2
AVG HOUSEHOLD SIZE
50
LABOR FORCE [ PEOPLE ]
74.6%
PERCENT IN LABOR FORCE
Antelope Zip Codes
Antelope Area Codes
Income in Antelope
Income Overview in Antelope
| Characteristic | Number | Measure |
| Per Capita Income | 71 | $30,449 |
| Median Family Income | 6 | $0 |
| Mean Family Income | 6 | $0 |
| Median Household Income | 22 | $59,643 |
| Mean Household Income | 22 | $58,291 |
| Income Deficit | 6 | $0 |
| Wage / Income Gap (%) | 71 | 0.00% |
| Wage / Income Gap ($) | 71 | 100.00¢ per $1 |
| Gini / Inequality Index | 71 | 0.17 |
Earnings by Sex in Antelope
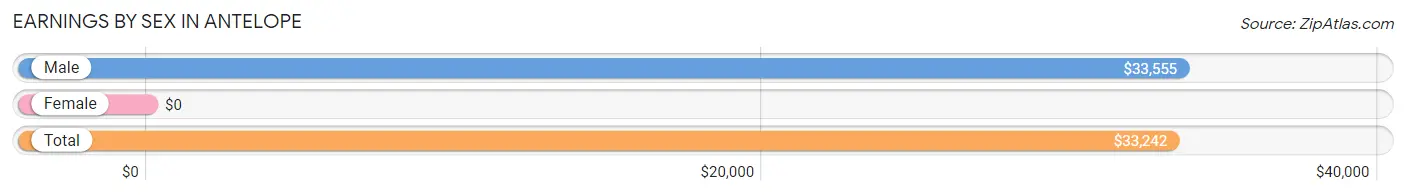
| Sex | Number | Average Earnings |
| Male | 45 (84.9%) | $33,555 |
| Female | 8 (15.1%) | $0 |
| Total | 53 (100.0%) | $33,242 |
Earnings by Sex by Income Bracket in Antelope
The most common earnings brackets in Antelope are $30,000 to $34,999 for men (32 | 71.1%) and $10,000 to $12,499 for women (3 | 37.5%).
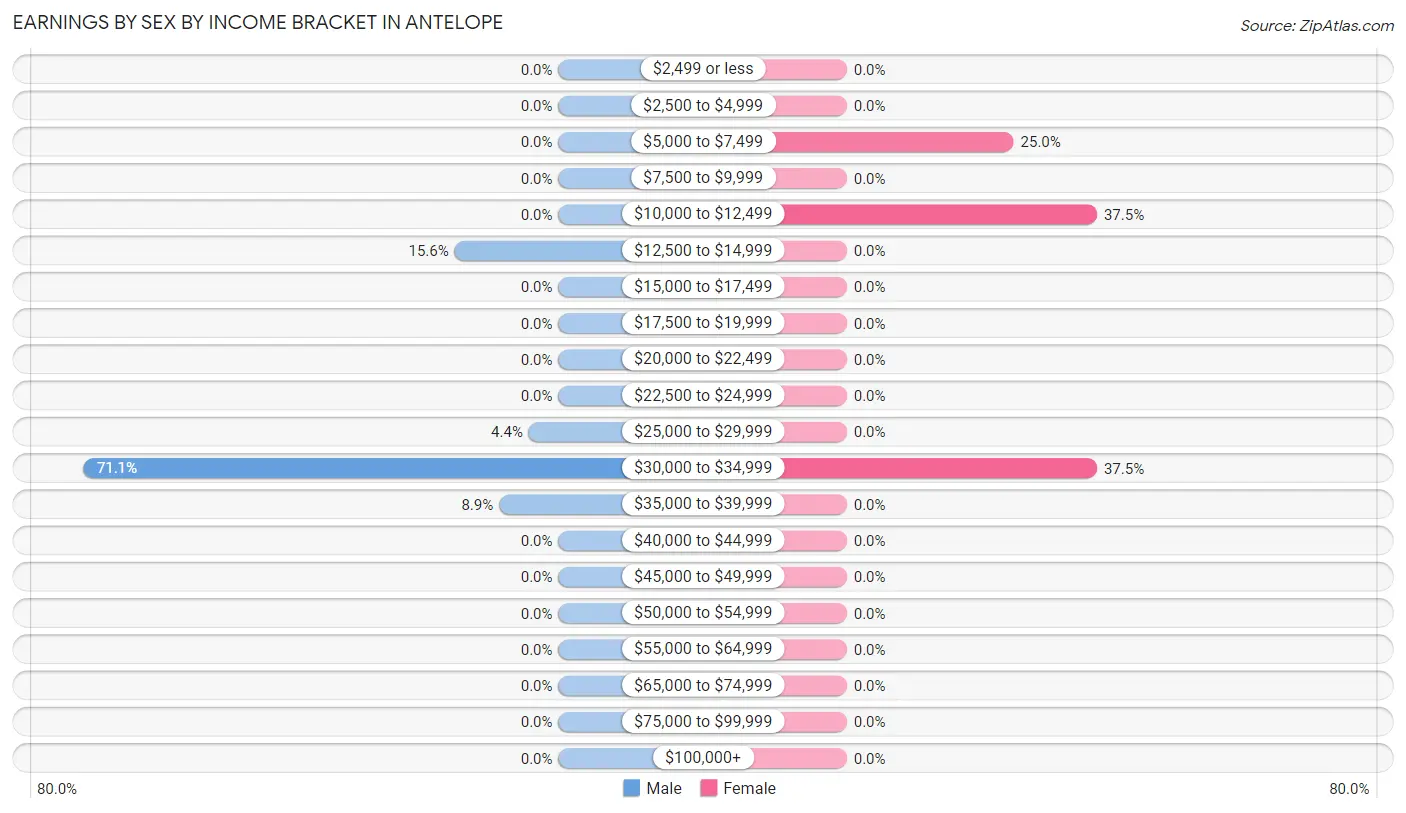
| Income | Male | Female |
| $2,499 or less | 0 (0.0%) | 0 (0.0%) |
| $2,500 to $4,999 | 0 (0.0%) | 0 (0.0%) |
| $5,000 to $7,499 | 0 (0.0%) | 2 (25.0%) |
| $7,500 to $9,999 | 0 (0.0%) | 0 (0.0%) |
| $10,000 to $12,499 | 0 (0.0%) | 3 (37.5%) |
| $12,500 to $14,999 | 7 (15.6%) | 0 (0.0%) |
| $15,000 to $17,499 | 0 (0.0%) | 0 (0.0%) |
| $17,500 to $19,999 | 0 (0.0%) | 0 (0.0%) |
| $20,000 to $22,499 | 0 (0.0%) | 0 (0.0%) |
| $22,500 to $24,999 | 0 (0.0%) | 0 (0.0%) |
| $25,000 to $29,999 | 2 (4.4%) | 0 (0.0%) |
| $30,000 to $34,999 | 32 (71.1%) | 3 (37.5%) |
| $35,000 to $39,999 | 4 (8.9%) | 0 (0.0%) |
| $40,000 to $44,999 | 0 (0.0%) | 0 (0.0%) |
| $45,000 to $49,999 | 0 (0.0%) | 0 (0.0%) |
| $50,000 to $54,999 | 0 (0.0%) | 0 (0.0%) |
| $55,000 to $64,999 | 0 (0.0%) | 0 (0.0%) |
| $65,000 to $74,999 | 0 (0.0%) | 0 (0.0%) |
| $75,000 to $99,999 | 0 (0.0%) | 0 (0.0%) |
| $100,000+ | 0 (0.0%) | 0 (0.0%) |
| Total | 45 (100.0%) | 8 (100.0%) |
Earnings by Sex by Educational Attainment in Antelope
| Educational Attainment | Male Income | Female Income |
| Less than High School | - | - |
| High School Diploma | - | - |
| College or Associate's Degree | - | - |
| Bachelor's Degree | - | - |
| Graduate Degree | - | - |
| Total | $33,555 | $0 |
Family Income in Antelope
Family Income Brackets in Antelope
According to the Antelope family income data, there are 4 families falling into the $50,000 to $74,999 income range, which is the most common income bracket and makes up 66.7% of all families.
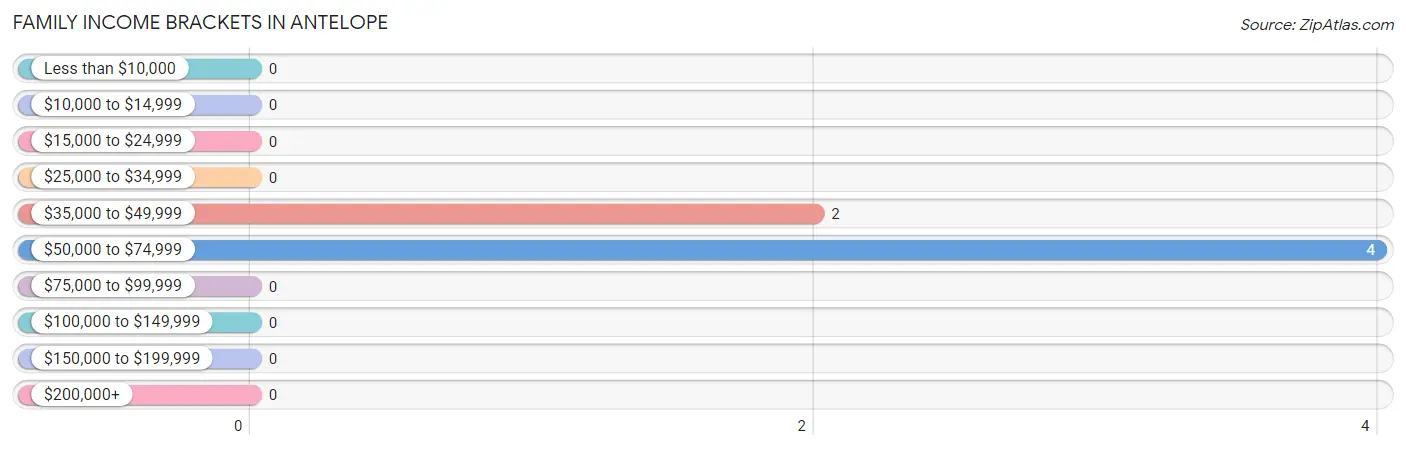
| Income Bracket | # Families | % Families |
| Less than $10,000 | 0 | 0.0% |
| $10,000 to $14,999 | 0 | 0.0% |
| $15,000 to $24,999 | 0 | 0.0% |
| $25,000 to $34,999 | 0 | 0.0% |
| $35,000 to $49,999 | 2 | 33.3% |
| $50,000 to $74,999 | 4 | 66.7% |
| $75,000 to $99,999 | 0 | 0.0% |
| $100,000 to $149,999 | 0 | 0.0% |
| $150,000 to $199,999 | 0 | 0.0% |
| $200,000+ | 0 | 0.0% |
Family Income by Famaliy Size in Antelope
| Income Bracket | # Families | Median Income |
| 2-Person Families | 0 (0.0%) | $0 |
| 3-Person Families | 4 (66.7%) | $0 |
| 4-Person Families | 2 (33.3%) | $0 |
| 5-Person Families | 0 (0.0%) | $0 |
| 6-Person Families | 0 (0.0%) | $0 |
| 7+ Person Families | 0 (0.0%) | $0 |
| Total | 6 (100.0%) | $0 |
Family Income by Number of Earners in Antelope
| Number of Earners | # Families | Median Income |
| No Earners | 0 (0.0%) | $0 |
| 1 Earner | 4 (66.7%) | $0 |
| 2 Earners | 2 (33.3%) | $0 |
| 3+ Earners | 0 (0.0%) | $0 |
| Total | 6 (100.0%) | $0 |
Household Income in Antelope
Household Income Brackets in Antelope
With 15 households falling in the category, the $50,000 to $74,999 income range is the most frequent in Antelope, accounting for 68.2% of all households.
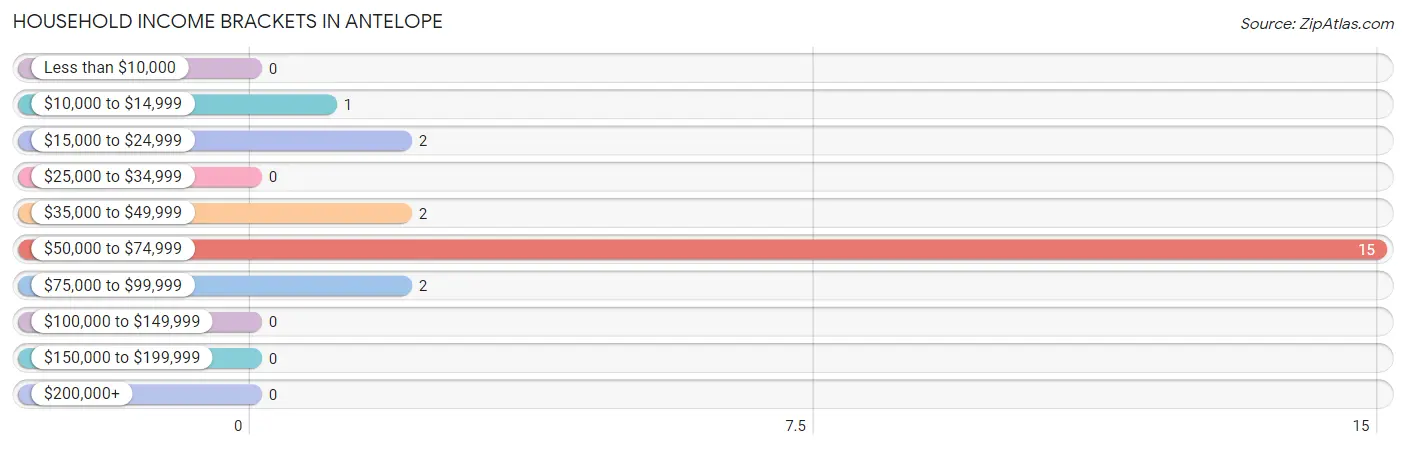
| Income Bracket | # Households | % Households |
| Less than $10,000 | 0 | 0.0% |
| $10,000 to $14,999 | 1 | 4.5% |
| $15,000 to $24,999 | 2 | 9.1% |
| $25,000 to $34,999 | 0 | 0.0% |
| $35,000 to $49,999 | 2 | 9.1% |
| $50,000 to $74,999 | 15 | 68.2% |
| $75,000 to $99,999 | 2 | 9.1% |
| $100,000 to $149,999 | 0 | 0.0% |
| $150,000 to $199,999 | 0 | 0.0% |
| $200,000+ | 0 | 0.0% |
Household Income by Householder Age in Antelope
The median household income in Antelope is $59,643, with the highest median household income of $64,063 found in the 65+ years age bracket for the primary householder. A total of 7 households (31.8%) fall into this category.
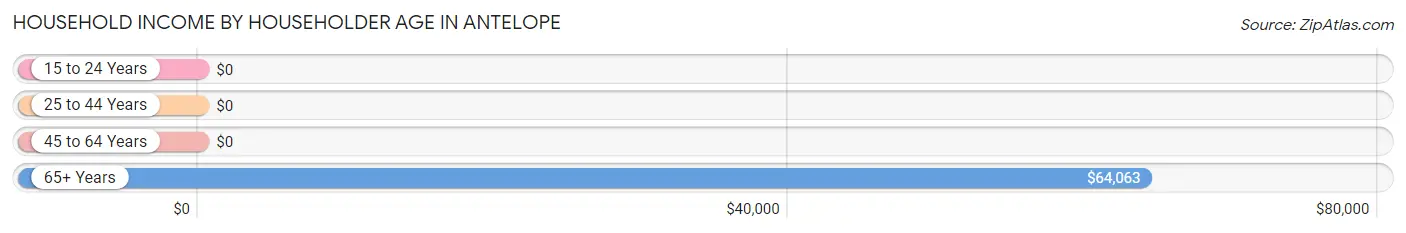
| Income Bracket | # Households | Median Income |
| 15 to 24 Years | 0 (0.0%) | $0 |
| 25 to 44 Years | 6 (27.3%) | $0 |
| 45 to 64 Years | 9 (40.9%) | $0 |
| 65+ Years | 7 (31.8%) | $64,063 |
| Total | 22 (100.0%) | $59,643 |
Poverty in Antelope
Income Below Poverty by Sex and Age in Antelope
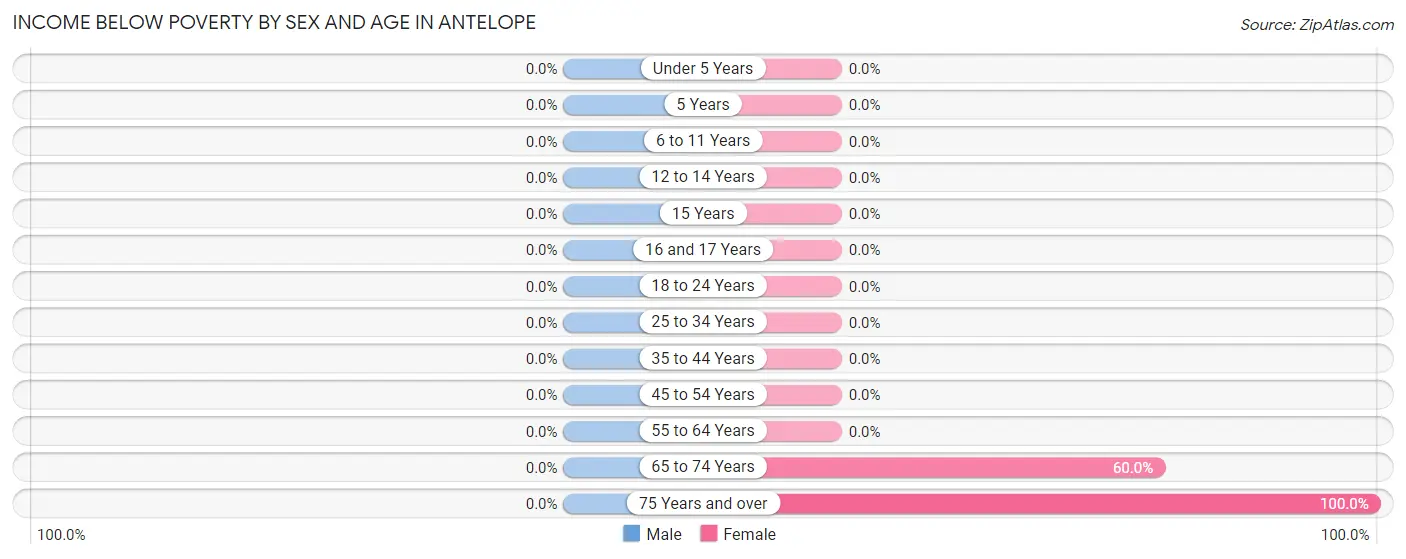
| Age Bracket | Male | Female |
| Under 5 Years | 0 (0.0%) | 0 (0.0%) |
| 5 Years | 0 (0.0%) | 0 (0.0%) |
| 6 to 11 Years | 0 (0.0%) | 0 (0.0%) |
| 12 to 14 Years | 0 (0.0%) | 0 (0.0%) |
| 15 Years | 0 (0.0%) | 0 (0.0%) |
| 16 and 17 Years | 0 (0.0%) | 0 (0.0%) |
| 18 to 24 Years | 0 (0.0%) | 0 (0.0%) |
| 25 to 34 Years | 0 (0.0%) | 0 (0.0%) |
| 35 to 44 Years | 0 (0.0%) | 0 (0.0%) |
| 45 to 54 Years | 0 (0.0%) | 0 (0.0%) |
| 55 to 64 Years | 0 (0.0%) | 0 (0.0%) |
| 65 to 74 Years | 0 (0.0%) | 3 (60.0%) |
| 75 Years and over | 0 (0.0%) | 1 (100.0%) |
| Total | 0 (0.0%) | 4 (25.0%) |
Income Above Poverty by Sex and Age in Antelope
According to the poverty statistics in Antelope, males aged under 5 years and females aged 6 to 11 years are the age groups that are most secure financially, with 100.0% of males and 100.0% of females in these age groups living above the poverty line.
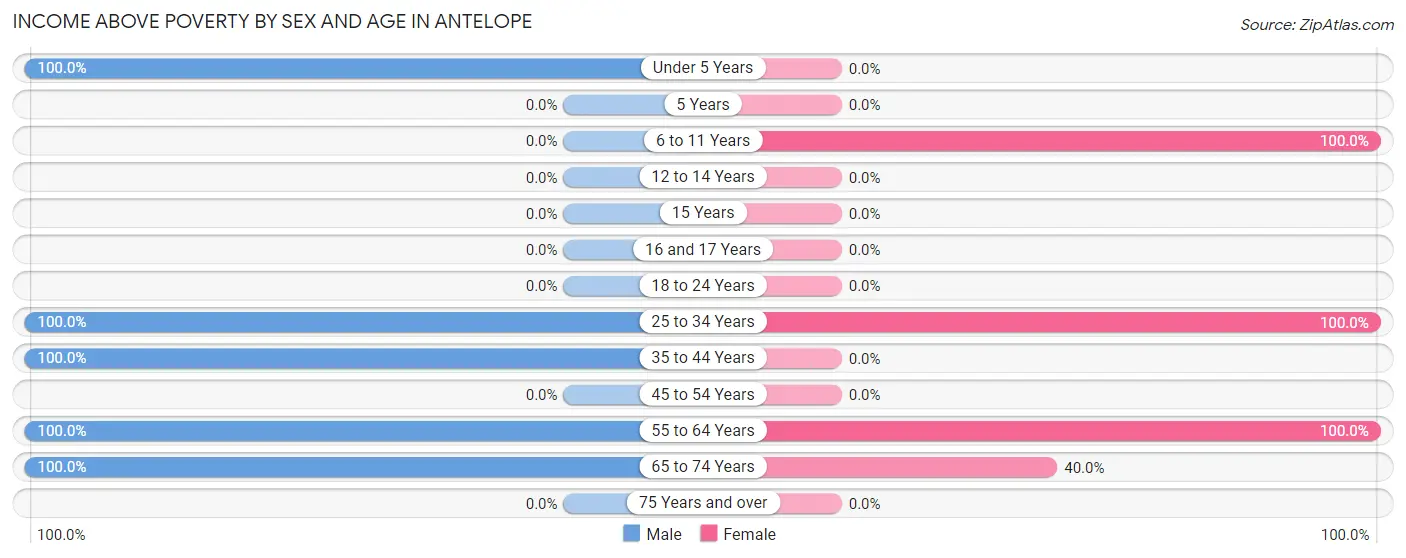
| Age Bracket | Male | Female |
| Under 5 Years | 2 (100.0%) | 0 (0.0%) |
| 5 Years | 0 (0.0%) | 0 (0.0%) |
| 6 to 11 Years | 0 (0.0%) | 2 (100.0%) |
| 12 to 14 Years | 0 (0.0%) | 0 (0.0%) |
| 15 Years | 0 (0.0%) | 0 (0.0%) |
| 16 and 17 Years | 0 (0.0%) | 0 (0.0%) |
| 18 to 24 Years | 0 (0.0%) | 0 (0.0%) |
| 25 to 34 Years | 36 (100.0%) | 3 (100.0%) |
| 35 to 44 Years | 4 (100.0%) | 0 (0.0%) |
| 45 to 54 Years | 0 (0.0%) | 0 (0.0%) |
| 55 to 64 Years | 7 (100.0%) | 5 (100.0%) |
| 65 to 74 Years | 6 (100.0%) | 2 (40.0%) |
| 75 Years and over | 0 (0.0%) | 0 (0.0%) |
| Total | 55 (100.0%) | 12 (75.0%) |
Income Below Poverty Among Married-Couple Families in Antelope
| Children | Above Poverty | Below Poverty |
| No Children | 4 (100.0%) | 0 (0.0%) |
| 1 or 2 Children | 2 (100.0%) | 0 (0.0%) |
| 3 or 4 Children | 0 (0.0%) | 0 (0.0%) |
| 5 or more Children | 0 (0.0%) | 0 (0.0%) |
| Total | 6 (100.0%) | 0 (0.0%) |
Income Below Poverty Among Single-Parent Households in Antelope
| Children | Single Father | Single Mother |
| No Children | 0 (0.0%) | 0 (0.0%) |
| 1 or 2 Children | 0 (0.0%) | 0 (0.0%) |
| 3 or 4 Children | 0 (0.0%) | 0 (0.0%) |
| 5 or more Children | 0 (0.0%) | 0 (0.0%) |
| Total | 0 (0.0%) | 0 (0.0%) |
Income Below Poverty Among Married-Couple vs Single-Parent Households in Antelope
| Children | Married-Couple Families | Single-Parent Households |
| No Children | 0 (0.0%) | 0 (0.0%) |
| 1 or 2 Children | 0 (0.0%) | 0 (0.0%) |
| 3 or 4 Children | 0 (0.0%) | 0 (0.0%) |
| 5 or more Children | 0 (0.0%) | 0 (0.0%) |
| Total | 0 (0.0%) | 0 (0.0%) |
Race in Antelope
The most populous races in Antelope are White / Caucasian (65 | 91.5%), Native / Alaskan (4 | 5.6%), and Hispanic or Latino (2 | 2.8%).
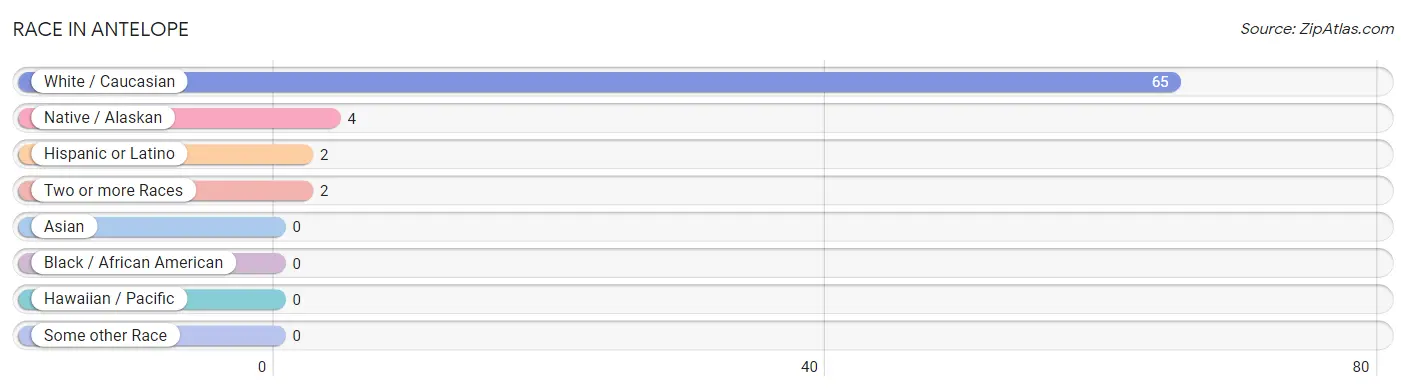
| Race | # Population | % Population |
| Asian | 0 | 0.0% |
| Black / African American | 0 | 0.0% |
| Hawaiian / Pacific | 0 | 0.0% |
| Hispanic or Latino | 2 | 2.8% |
| Native / Alaskan | 4 | 5.6% |
| White / Caucasian | 65 | 91.5% |
| Two or more Races | 2 | 2.8% |
| Some other Race | 0 | 0.0% |
| Total | 71 | 100.0% |
Ancestry in Antelope
The most populous ancestries reported in Antelope are German (11 | 15.5%), Swedish (8 | 11.3%), Sioux (4 | 5.6%), English (3 | 4.2%), and Norwegian (3 | 4.2%), together accounting for 40.9% of all Antelope residents.
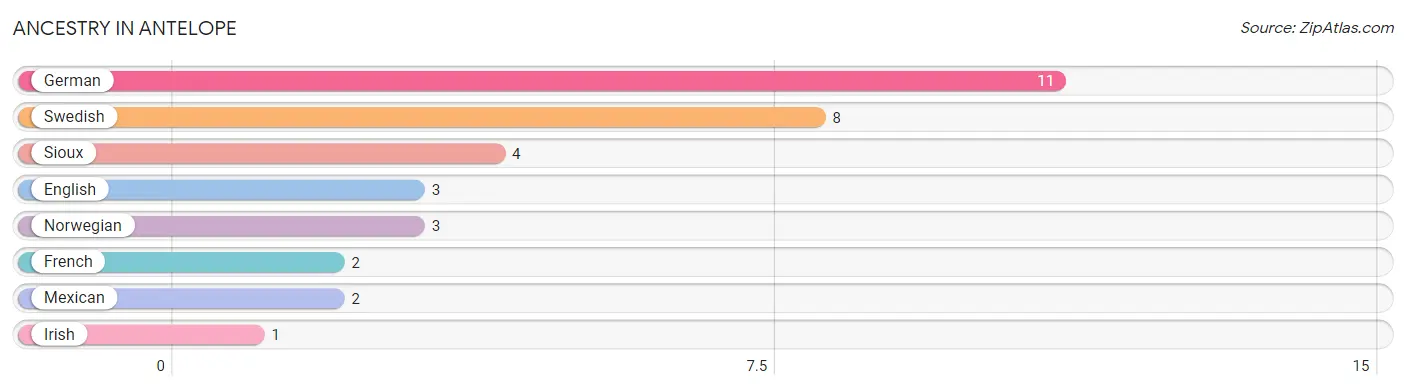
| Ancestry | # Population | % Population |
| English | 3 | 4.2% |
| French | 2 | 2.8% |
| German | 11 | 15.5% |
| Irish | 1 | 1.4% |
| Mexican | 2 | 2.8% |
| Norwegian | 3 | 4.2% |
| Sioux | 4 | 5.6% |
| Swedish | 8 | 11.3% | View All 8 Rows |
Immigrants in Antelope

| Immigration Origin | # Population | % Population | View All 0 Rows |
Sex and Age in Antelope
Sex and Age in Antelope
The most populous age groups in Antelope are 30 to 34 Years (36 | 65.4%) for men and 60 to 64 Years (5 | 31.2%) for women.
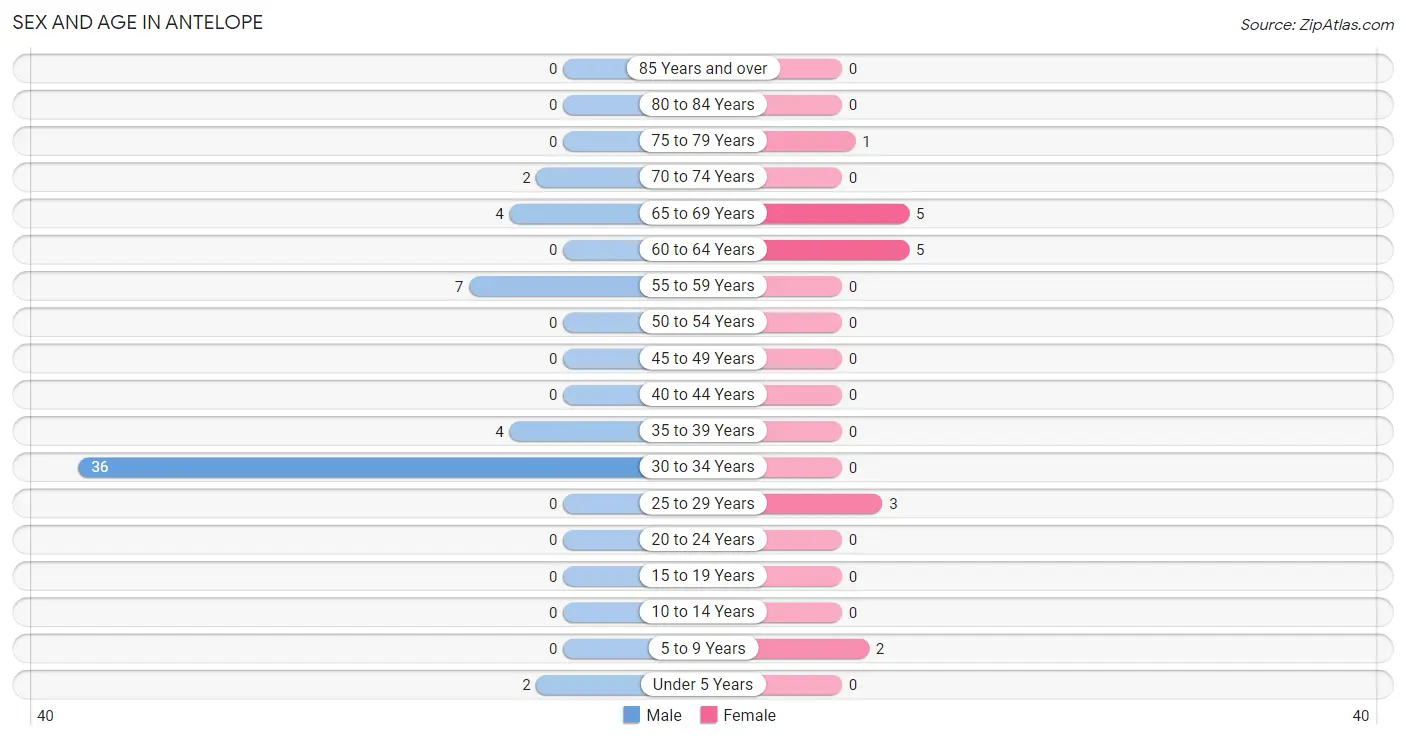
| Age Bracket | Male | Female |
| Under 5 Years | 2 (3.6%) | 0 (0.0%) |
| 5 to 9 Years | 0 (0.0%) | 2 (12.5%) |
| 10 to 14 Years | 0 (0.0%) | 0 (0.0%) |
| 15 to 19 Years | 0 (0.0%) | 0 (0.0%) |
| 20 to 24 Years | 0 (0.0%) | 0 (0.0%) |
| 25 to 29 Years | 0 (0.0%) | 3 (18.8%) |
| 30 to 34 Years | 36 (65.4%) | 0 (0.0%) |
| 35 to 39 Years | 4 (7.3%) | 0 (0.0%) |
| 40 to 44 Years | 0 (0.0%) | 0 (0.0%) |
| 45 to 49 Years | 0 (0.0%) | 0 (0.0%) |
| 50 to 54 Years | 0 (0.0%) | 0 (0.0%) |
| 55 to 59 Years | 7 (12.7%) | 0 (0.0%) |
| 60 to 64 Years | 0 (0.0%) | 5 (31.2%) |
| 65 to 69 Years | 4 (7.3%) | 5 (31.2%) |
| 70 to 74 Years | 2 (3.6%) | 0 (0.0%) |
| 75 to 79 Years | 0 (0.0%) | 1 (6.2%) |
| 80 to 84 Years | 0 (0.0%) | 0 (0.0%) |
| 85 Years and over | 0 (0.0%) | 0 (0.0%) |
| Total | 55 (100.0%) | 16 (100.0%) |
Families and Households in Antelope
Median Family Size in Antelope
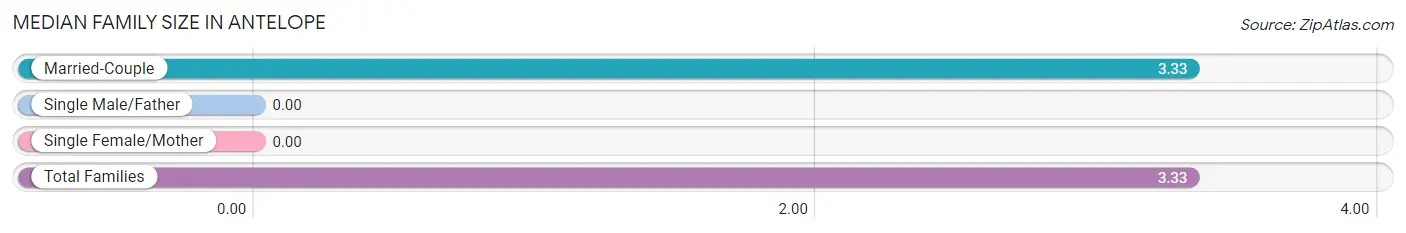
| Family Type | # Families | Family Size |
| Married-Couple | 6 (100.0%) | 3.33 |
| Single Male/Father | 0 (0.0%) | - |
| Single Female/Mother | 0 (0.0%) | - |
| Total Families | 6 (100.0%) | 3.33 |
Median Household Size in Antelope
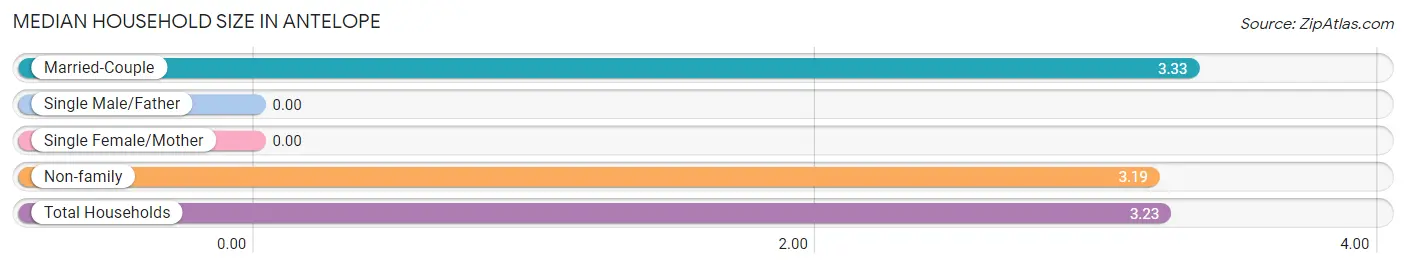
| Household Type | # Households | Household Size |
| Married-Couple | 6 (27.3%) | 3.33 |
| Single Male/Father | 0 (0.0%) | - |
| Single Female/Mother | 0 (0.0%) | - |
| Non-family | 16 (72.7%) | 3.19 |
| Total Households | 22 (100.0%) | 3.23 |
Household Size by Marriage Status in Antelope
Out of a total of 22 households in Antelope, 6 (27.3%) are family households, while 16 (72.7%) are nonfamily households. The most numerous type of family households are 3-person households, comprising 4, and the most common type of nonfamily households are 1-person households, comprising 10.
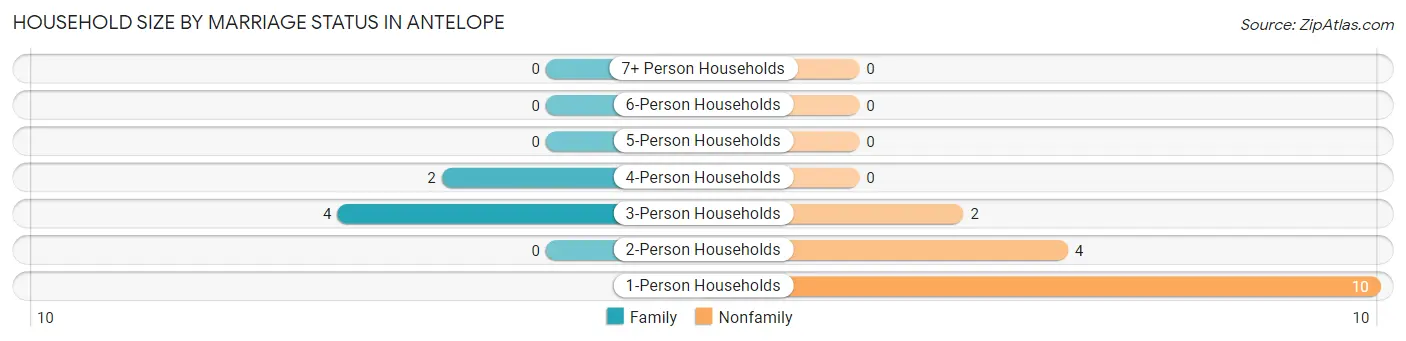
| Household Size | Family Households | Nonfamily Households |
| 1-Person Households | - | 10 (45.5%) |
| 2-Person Households | 0 (0.0%) | 4 (18.2%) |
| 3-Person Households | 4 (18.2%) | 2 (9.1%) |
| 4-Person Households | 2 (9.1%) | 0 (0.0%) |
| 5-Person Households | 0 (0.0%) | 0 (0.0%) |
| 6-Person Households | 0 (0.0%) | 0 (0.0%) |
| 7+ Person Households | 0 (0.0%) | 0 (0.0%) |
| Total | 6 (27.3%) | 16 (72.7%) |
Female Fertility in Antelope
Fertility by Age in Antelope
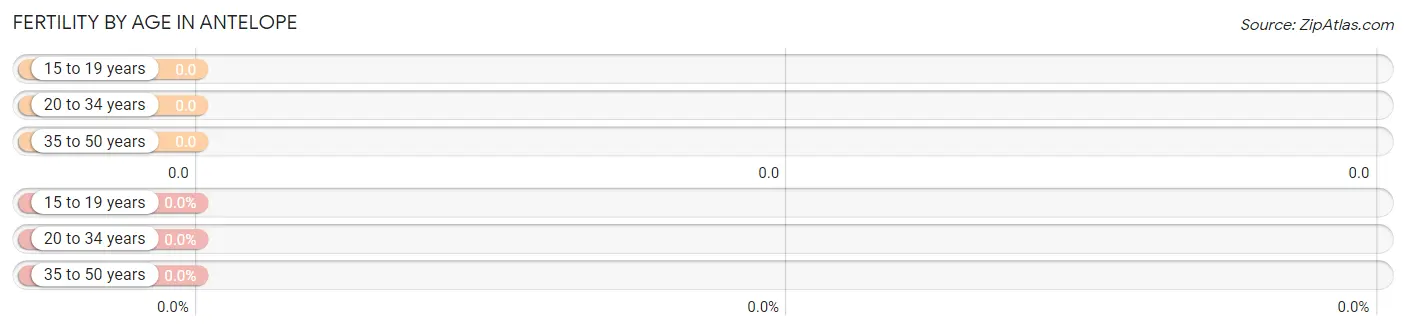
| Age Bracket | Women with Births | Births / 1,000 Women |
| 15 to 19 years | 0 (0.0%) | 0.0 |
| 20 to 34 years | 0 (0.0%) | 0.0 |
| 35 to 50 years | 0 (0.0%) | 0.0 |
| Total | 0 (0.0%) | 0.0 |
Fertility by Age by Marriage Status in Antelope
| Age Bracket | Married | Unmarried |
| 15 to 19 years | 0 (0.0%) | 0 (0.0%) |
| 20 to 34 years | 0 (0.0%) | 0 (0.0%) |
| 35 to 50 years | 0 (0.0%) | 0 (0.0%) |
| Total | 0 (0.0%) | 0 (0.0%) |
Fertility by Education in Antelope
| Educational Attainment | Women with Births | Births / 1,000 Women |
| Less than High School | 0 (0.0%) | 0.0 |
| High School Diploma | 0 (0.0%) | 0.0 |
| College or Associate's Degree | 0 (0.0%) | 0.0 |
| Bachelor's Degree | 0 (0.0%) | 0.0 |
| Graduate Degree | 0 (0.0%) | 0.0 |
| Total | 0 (0.0%) | 0.0 |
Fertility by Education by Marriage Status in Antelope
| Educational Attainment | Married | Unmarried |
| Less than High School | 0 (0.0%) | 0 (0.0%) |
| High School Diploma | 0 (0.0%) | 0 (0.0%) |
| College or Associate's Degree | 0 (0.0%) | 0 (0.0%) |
| Bachelor's Degree | 0 (0.0%) | 0 (0.0%) |
| Graduate Degree | 0 (0.0%) | 0 (0.0%) |
| Total | 0 (0.0%) | 0 (0.0%) |
Employment Characteristics in Antelope
Employment by Class of Employer in Antelope
Among the 50 employed individuals in Antelope, private company employees (37 | 74.0%), self-employed (not incorporated) (4 | 8.0%), and state government employees (4 | 8.0%) make up the most common classes of employment.
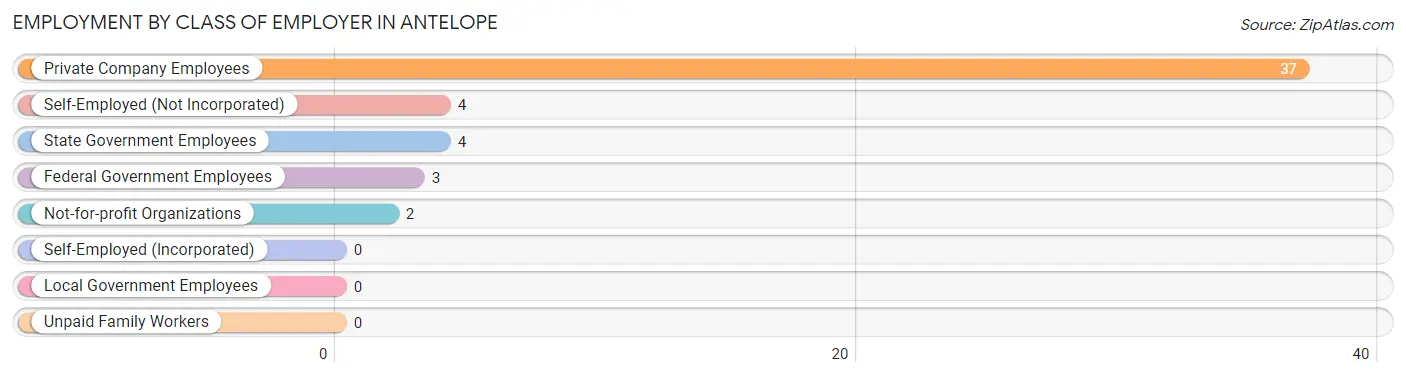
| Employer Class | # Employees | % Employees |
| Private Company Employees | 37 | 74.0% |
| Self-Employed (Incorporated) | 0 | 0.0% |
| Self-Employed (Not Incorporated) | 4 | 8.0% |
| Not-for-profit Organizations | 2 | 4.0% |
| Local Government Employees | 0 | 0.0% |
| State Government Employees | 4 | 8.0% |
| Federal Government Employees | 3 | 6.0% |
| Unpaid Family Workers | 0 | 0.0% |
| Total | 50 | 100.0% |
Employment Status by Age in Antelope
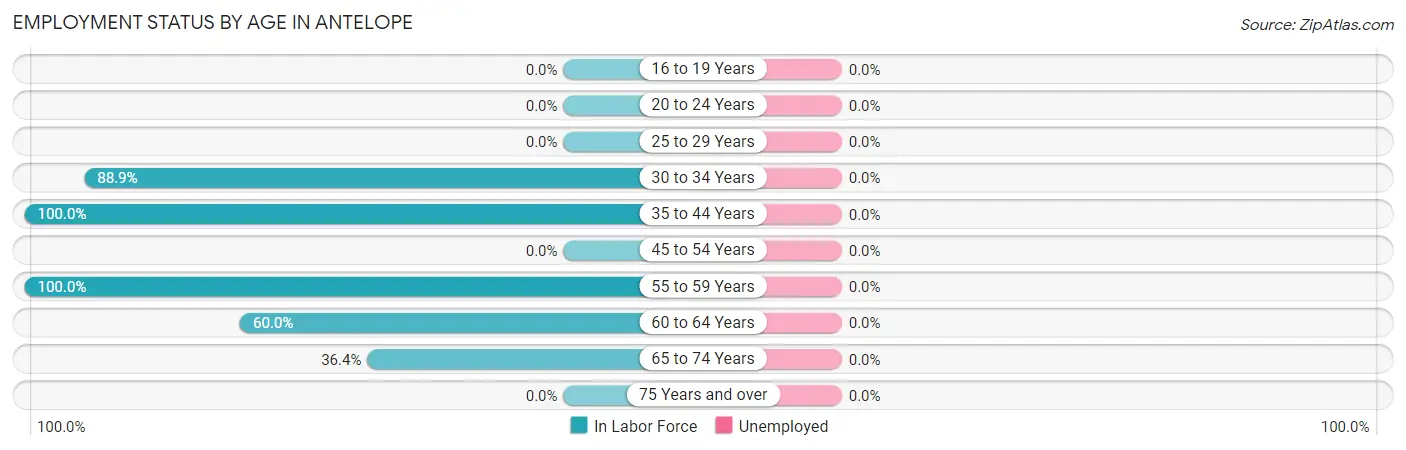
| Age Bracket | In Labor Force | Unemployed |
| 16 to 19 Years | 0 (0.0%) | 0 (0.0%) |
| 20 to 24 Years | 0 (0.0%) | 0 (0.0%) |
| 25 to 29 Years | 0 (0.0%) | 0 (0.0%) |
| 30 to 34 Years | 32 (88.9%) | 0 (0.0%) |
| 35 to 44 Years | 4 (100.0%) | 0 (0.0%) |
| 45 to 54 Years | 0 (0.0%) | 0 (0.0%) |
| 55 to 59 Years | 7 (100.0%) | 0 (0.0%) |
| 60 to 64 Years | 3 (60.0%) | 0 (0.0%) |
| 65 to 74 Years | 4 (36.4%) | 0 (0.0%) |
| 75 Years and over | 0 (0.0%) | 0 (0.0%) |
| Total | 50 (74.6%) | 0 (0.0%) |
Employment Status by Educational Attainment in Antelope
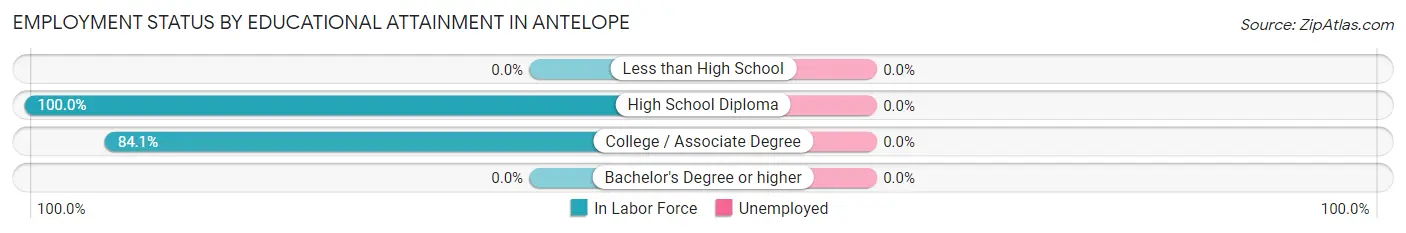
| Educational Attainment | In Labor Force | Unemployed |
| Less than High School | 0 (0.0%) | 0 (0.0%) |
| High School Diploma | 9 (100.0%) | 0 (0.0%) |
| College / Associate Degree | 37 (84.1%) | 0 (0.0%) |
| Bachelor's Degree or higher | 0 (0.0%) | 0 (0.0%) |
| Total | 46 (83.6%) | 0 (0.0%) |
Employment Occupations by Sex in Antelope
Management, Business, Science and Arts Occupations
The most common Management, Business, Science and Arts occupations in Antelope are , and Management (3 | 6.0%).
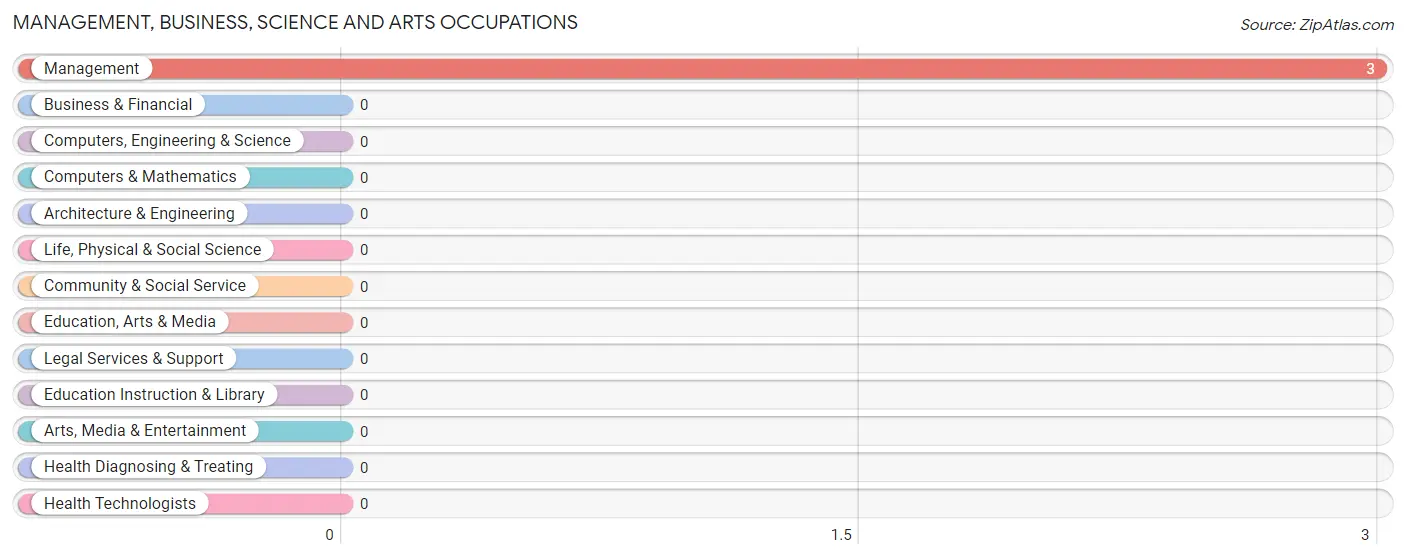
Management, Business, Science and Arts Occupations by Sex
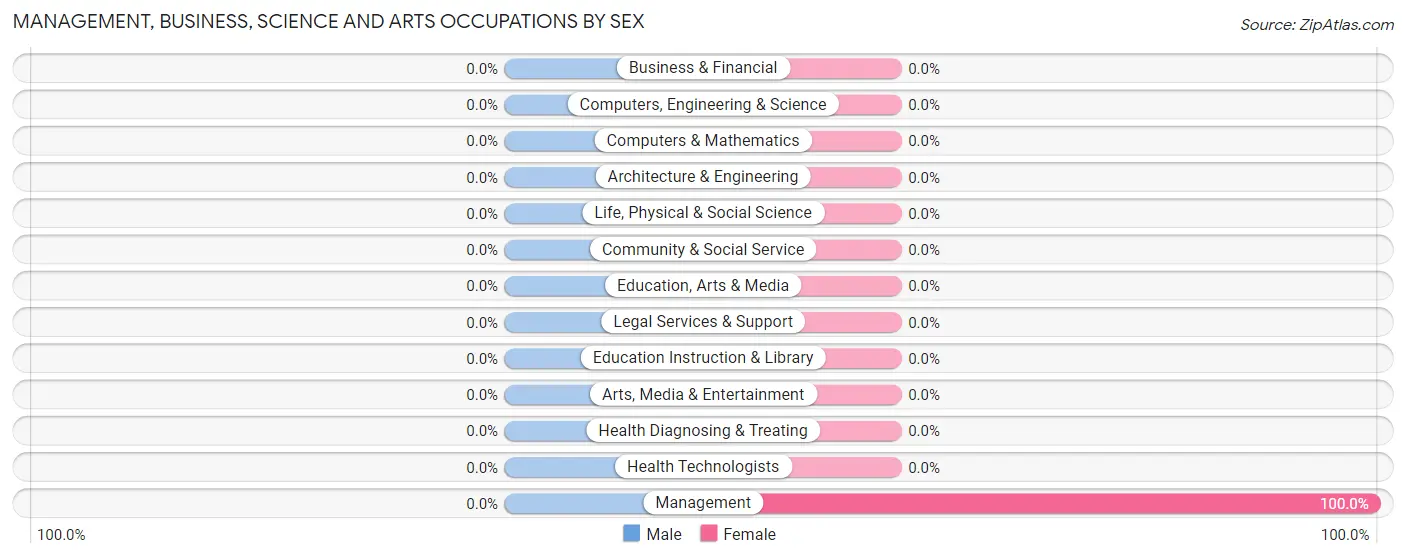
| Occupation | Male | Female |
| Management | 0 (0.0%) | 3 (100.0%) |
| Business & Financial | 0 (0.0%) | 0 (0.0%) |
| Computers, Engineering & Science | 0 (0.0%) | 0 (0.0%) |
| Computers & Mathematics | 0 (0.0%) | 0 (0.0%) |
| Architecture & Engineering | 0 (0.0%) | 0 (0.0%) |
| Life, Physical & Social Science | 0 (0.0%) | 0 (0.0%) |
| Community & Social Service | 0 (0.0%) | 0 (0.0%) |
| Education, Arts & Media | 0 (0.0%) | 0 (0.0%) |
| Legal Services & Support | 0 (0.0%) | 0 (0.0%) |
| Education Instruction & Library | 0 (0.0%) | 0 (0.0%) |
| Arts, Media & Entertainment | 0 (0.0%) | 0 (0.0%) |
| Health Diagnosing & Treating | 0 (0.0%) | 0 (0.0%) |
| Health Technologists | 0 (0.0%) | 0 (0.0%) |
| Total (Category) | 0 (0.0%) | 3 (100.0%) |
| Total (Overall) | 45 (90.0%) | 5 (10.0%) |
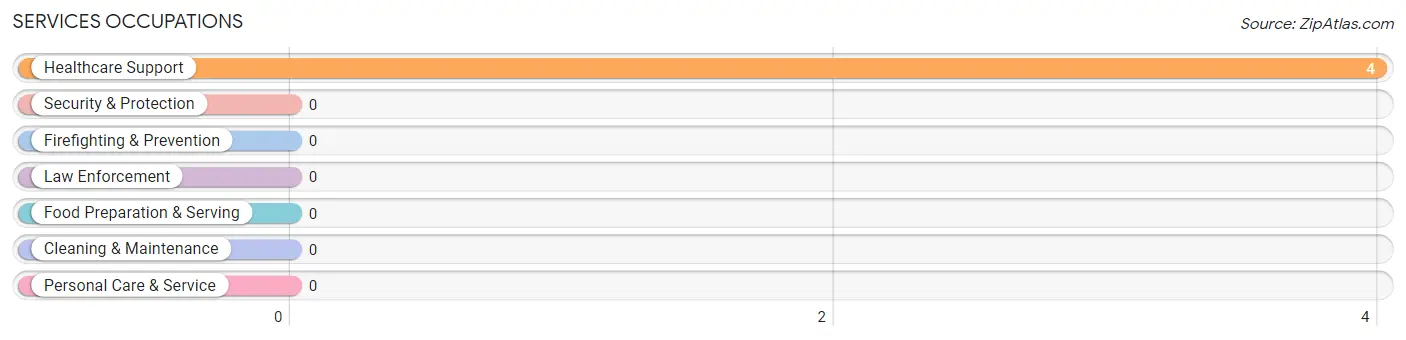
Services Occupations
The most common Services occupations in Antelope are , and Healthcare Support (4 | 8.0%).
Services Occupations by Sex
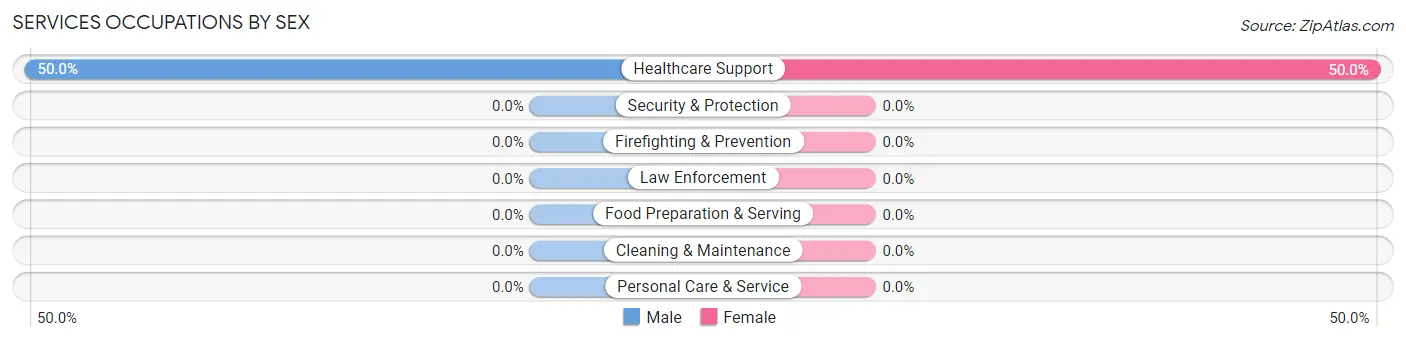
| Occupation | Male | Female |
| Healthcare Support | 2 (50.0%) | 2 (50.0%) |
| Security & Protection | 0 (0.0%) | 0 (0.0%) |
| Firefighting & Prevention | 0 (0.0%) | 0 (0.0%) |
| Law Enforcement | 0 (0.0%) | 0 (0.0%) |
| Food Preparation & Serving | 0 (0.0%) | 0 (0.0%) |
| Cleaning & Maintenance | 0 (0.0%) | 0 (0.0%) |
| Personal Care & Service | 0 (0.0%) | 0 (0.0%) |
| Total (Category) | 2 (50.0%) | 2 (50.0%) |
| Total (Overall) | 45 (90.0%) | 5 (10.0%) |
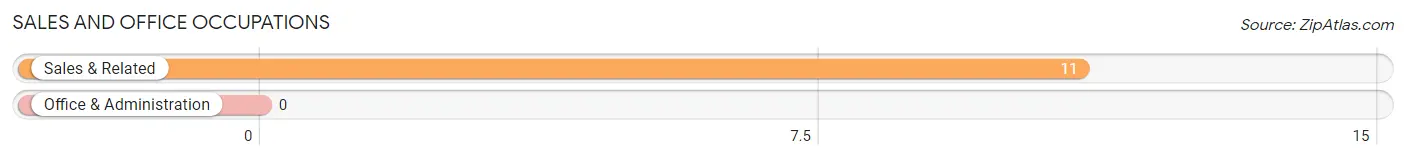
Sales and Office Occupations
The most common Sales and Office occupations in Antelope are , and Sales & Related (11 | 22.0%).
Sales and Office Occupations by Sex
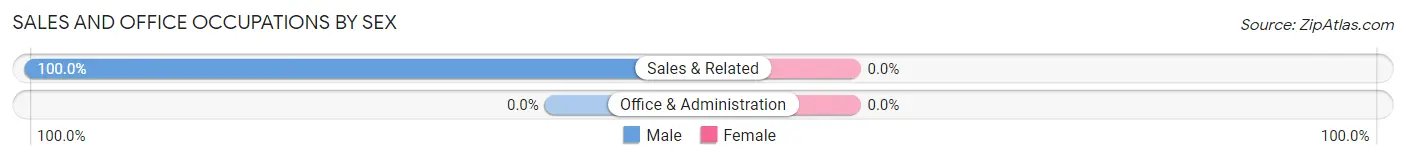
| Occupation | Male | Female |
| Sales & Related | 11 (100.0%) | 0 (0.0%) |
| Office & Administration | 0 (0.0%) | 0 (0.0%) |
| Total (Category) | 11 (100.0%) | 0 (0.0%) |
| Total (Overall) | 45 (90.0%) | 5 (10.0%) |
Natural Resources, Construction and Maintenance Occupations
The most common Natural Resources, Construction and Maintenance occupations in Antelope are , and Construction & Extraction (30 | 60.0%).
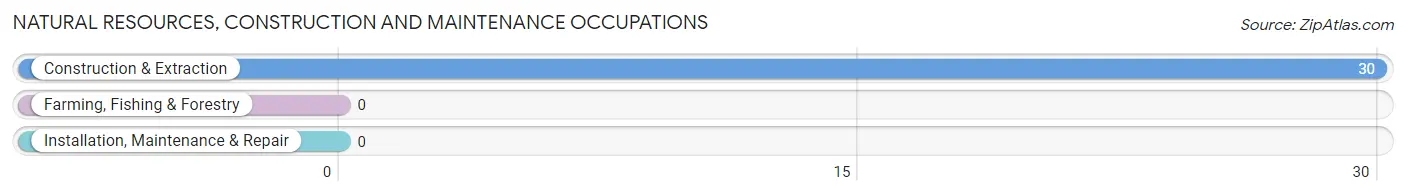
Natural Resources, Construction and Maintenance Occupations by Sex
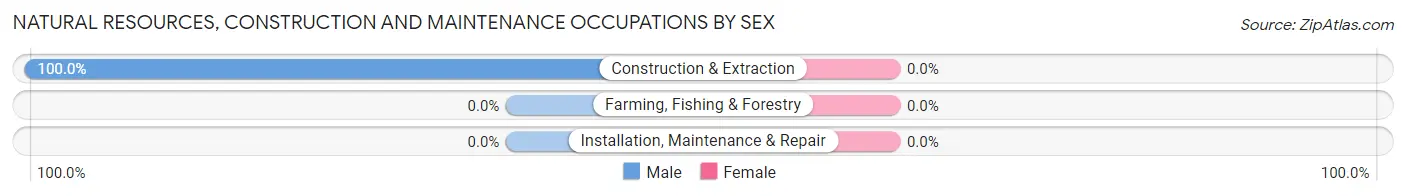
| Occupation | Male | Female |
| Farming, Fishing & Forestry | 0 (0.0%) | 0 (0.0%) |
| Construction & Extraction | 30 (100.0%) | 0 (0.0%) |
| Installation, Maintenance & Repair | 0 (0.0%) | 0 (0.0%) |
| Total (Category) | 30 (100.0%) | 0 (0.0%) |
| Total (Overall) | 45 (90.0%) | 5 (10.0%) |
Production, Transportation and Moving Occupations
The most common Production, Transportation and Moving occupations in Antelope are , and Transportation (2 | 4.0%).
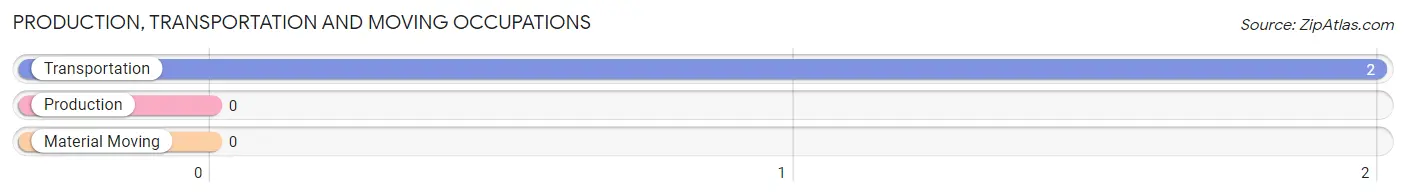
Production, Transportation and Moving Occupations by Sex
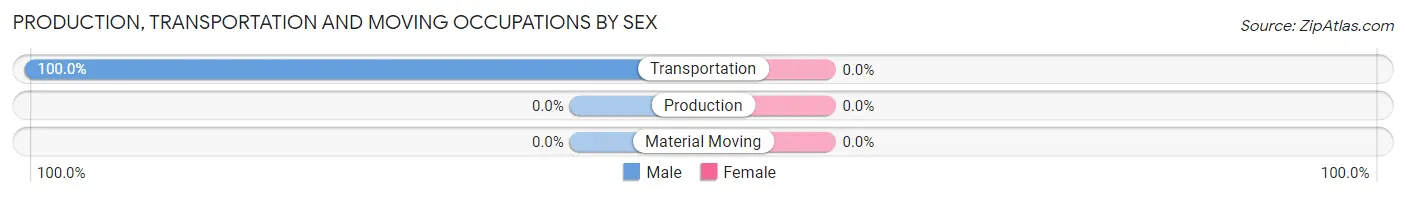
| Occupation | Male | Female |
| Production | 0 (0.0%) | 0 (0.0%) |
| Transportation | 2 (100.0%) | 0 (0.0%) |
| Material Moving | 0 (0.0%) | 0 (0.0%) |
| Total (Category) | 2 (100.0%) | 0 (0.0%) |
| Total (Overall) | 45 (90.0%) | 5 (10.0%) |
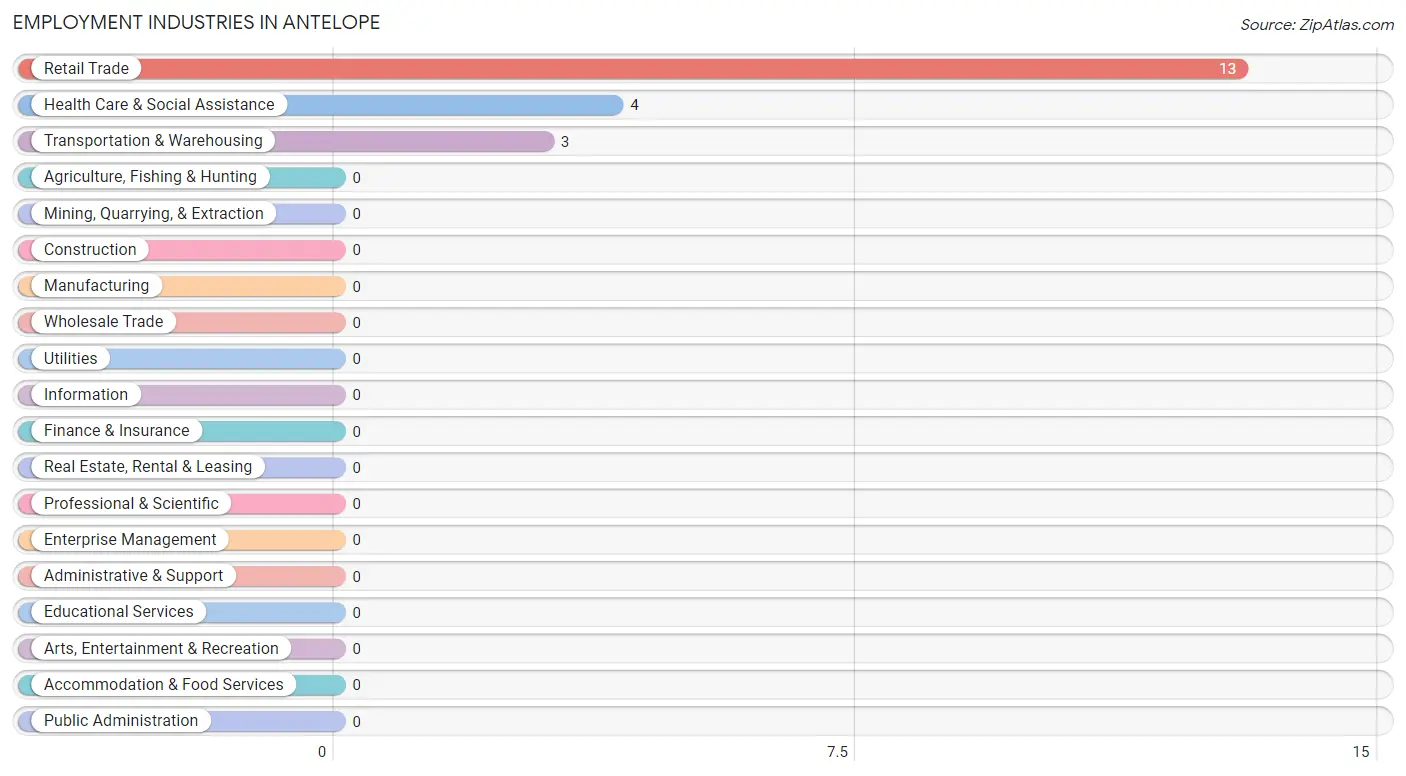
Employment Industries by Sex in Antelope
Employment Industries in Antelope
The major employment industries in Antelope include Retail Trade (13 | 26.0%), Health Care & Social Assistance (4 | 8.0%), and Transportation & Warehousing (3 | 6.0%).
Employment Industries by Sex in Antelope
The Antelope industries that see more men than women are Retail Trade (100.0%), and Health Care & Social Assistance (50.0%), whereas the industries that tend to have a higher number of women are Transportation & Warehousing (100.0%), and Health Care & Social Assistance (50.0%).
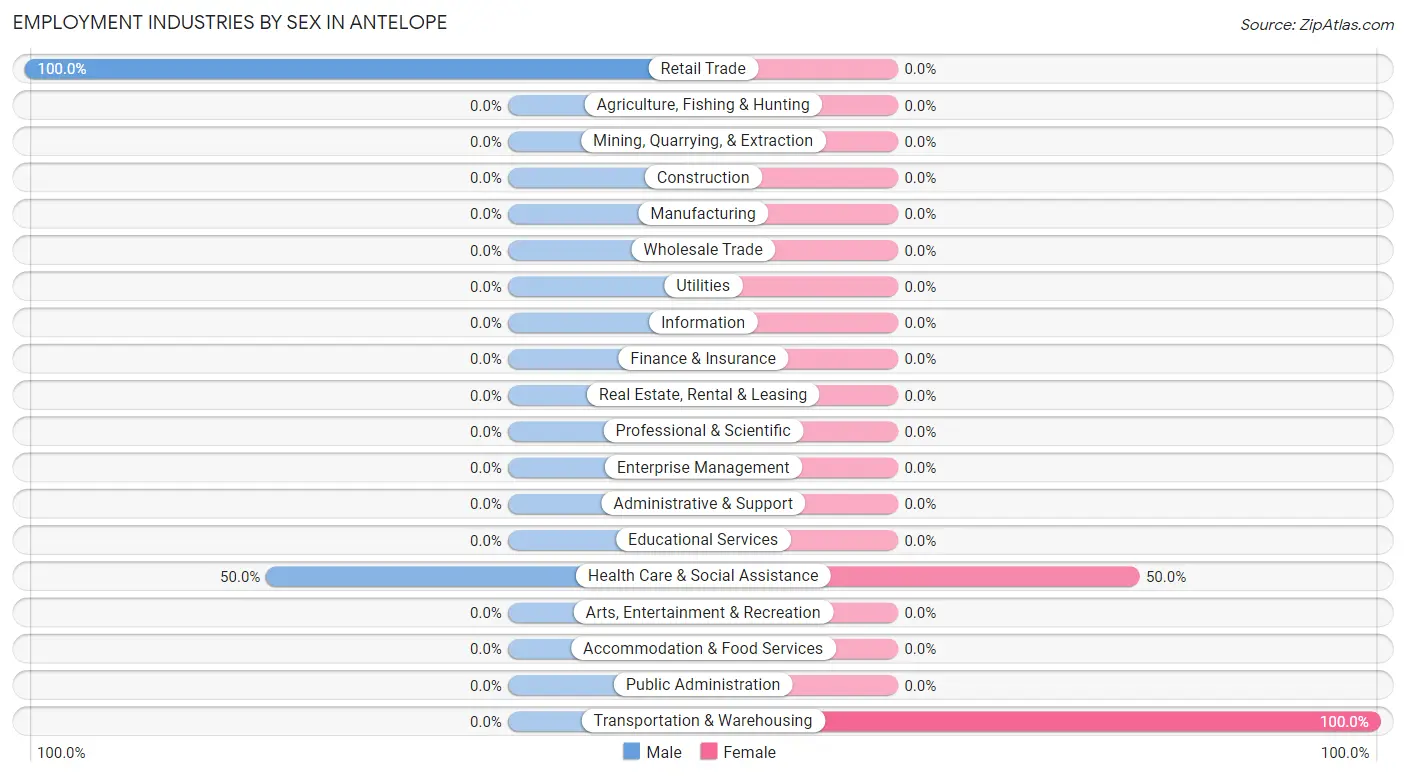
| Industry | Male | Female |
| Agriculture, Fishing & Hunting | 0 (0.0%) | 0 (0.0%) |
| Mining, Quarrying, & Extraction | 0 (0.0%) | 0 (0.0%) |
| Construction | 0 (0.0%) | 0 (0.0%) |
| Manufacturing | 0 (0.0%) | 0 (0.0%) |
| Wholesale Trade | 0 (0.0%) | 0 (0.0%) |
| Retail Trade | 13 (100.0%) | 0 (0.0%) |
| Transportation & Warehousing | 0 (0.0%) | 3 (100.0%) |
| Utilities | 0 (0.0%) | 0 (0.0%) |
| Information | 0 (0.0%) | 0 (0.0%) |
| Finance & Insurance | 0 (0.0%) | 0 (0.0%) |
| Real Estate, Rental & Leasing | 0 (0.0%) | 0 (0.0%) |
| Professional & Scientific | 0 (0.0%) | 0 (0.0%) |
| Enterprise Management | 0 (0.0%) | 0 (0.0%) |
| Administrative & Support | 0 (0.0%) | 0 (0.0%) |
| Educational Services | 0 (0.0%) | 0 (0.0%) |
| Health Care & Social Assistance | 2 (50.0%) | 2 (50.0%) |
| Arts, Entertainment & Recreation | 0 (0.0%) | 0 (0.0%) |
| Accommodation & Food Services | 0 (0.0%) | 0 (0.0%) |
| Public Administration | 0 (0.0%) | 0 (0.0%) |
| Total | 45 (90.0%) | 5 (10.0%) |
Education in Antelope
School Enrollment in Antelope
The most common levels of schooling among the 7 students in Antelope are college / undergraduate (3 | 42.9%), nursery / preschool (2 | 28.6%), and elementary school (2 | 28.6%).
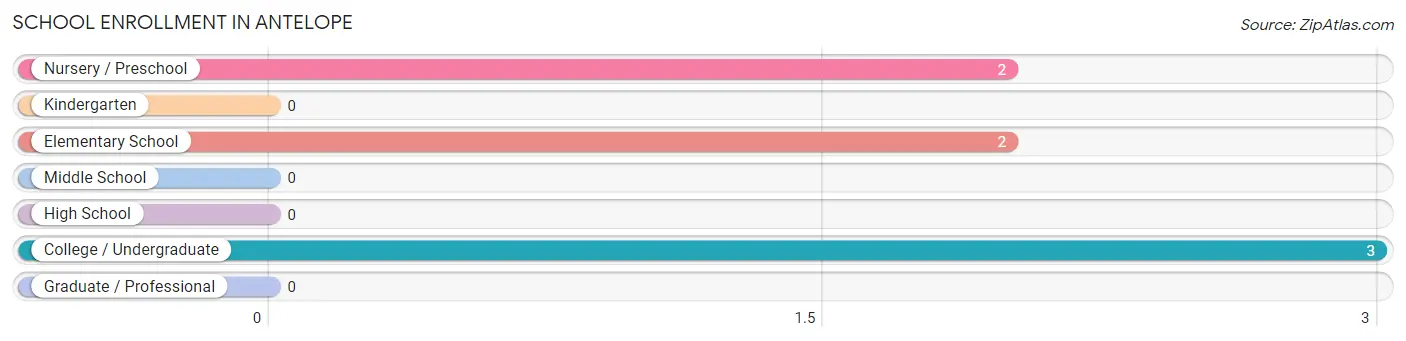
| School Level | # Students | % Students |
| Nursery / Preschool | 2 | 28.6% |
| Kindergarten | 0 | 0.0% |
| Elementary School | 2 | 28.6% |
| Middle School | 0 | 0.0% |
| High School | 0 | 0.0% |
| College / Undergraduate | 3 | 42.9% |
| Graduate / Professional | 0 | 0.0% |
| Total | 7 | 100.0% |
School Enrollment by Age by Funding Source in Antelope
Out of a total of 7 students who are enrolled in schools in Antelope, 3 (42.9%) attend a private institution, while the remaining 4 (57.1%) are enrolled in public schools. The age group of 25 to 34 year olds has the highest likelihood of being enrolled in private schools, with 3 (100.0% in the age bracket) enrolled. Conversely, the age group of 3 to 4 year olds has the lowest likelihood of being enrolled in a private school, with 2 (100.0% in the age bracket) attending a public institution.
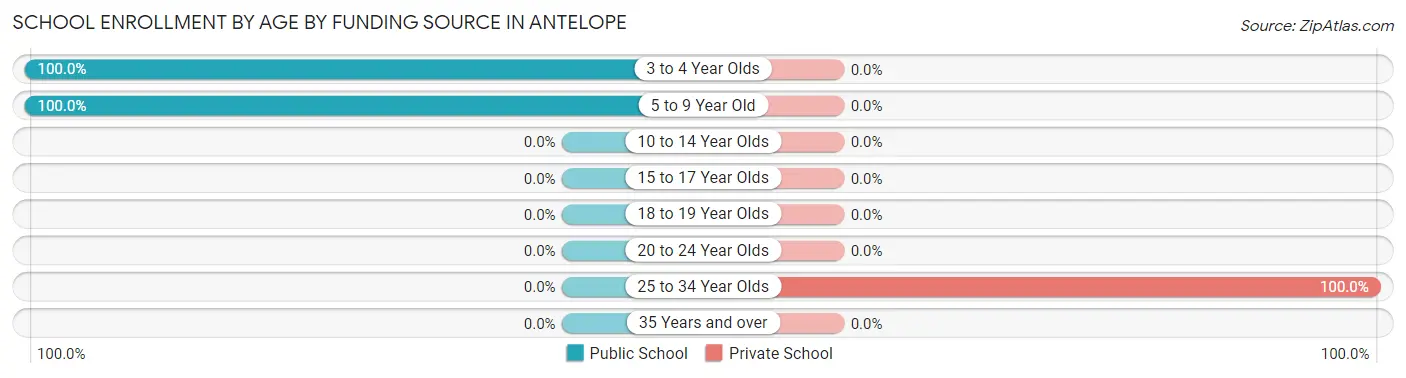
| Age Bracket | Public School | Private School |
| 3 to 4 Year Olds | 2 (100.0%) | 0 (0.0%) |
| 5 to 9 Year Old | 2 (100.0%) | 0 (0.0%) |
| 10 to 14 Year Olds | 0 (0.0%) | 0 (0.0%) |
| 15 to 17 Year Olds | 0 (0.0%) | 0 (0.0%) |
| 18 to 19 Year Olds | 0 (0.0%) | 0 (0.0%) |
| 20 to 24 Year Olds | 0 (0.0%) | 0 (0.0%) |
| 25 to 34 Year Olds | 0 (0.0%) | 3 (100.0%) |
| 35 Years and over | 0 (0.0%) | 0 (0.0%) |
| Total | 4 (57.1%) | 3 (42.9%) |
Educational Attainment by Field of Study in Antelope
Psychology (2 | 50.0%), and social sciences (2 | 50.0%) are the most common fields of study among 4 individuals in Antelope who have obtained a bachelor's degree or higher.
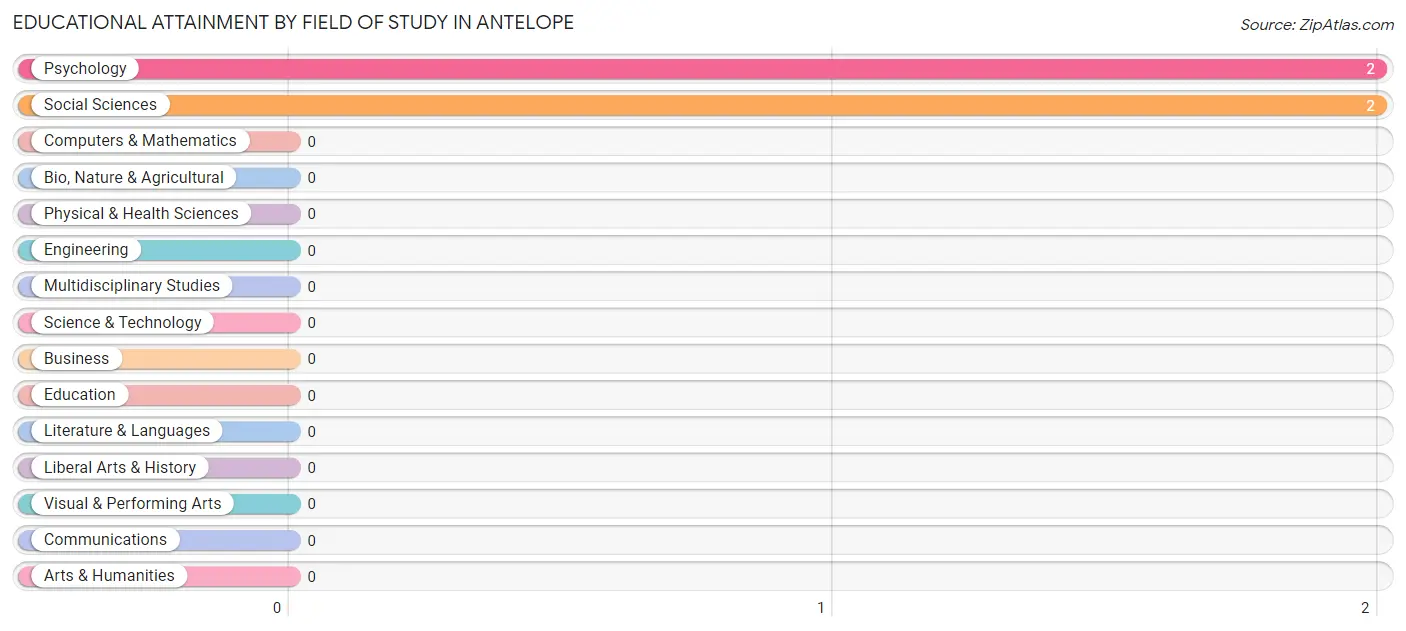
| Field of Study | # Graduates | % Graduates |
| Computers & Mathematics | 0 | 0.0% |
| Bio, Nature & Agricultural | 0 | 0.0% |
| Physical & Health Sciences | 0 | 0.0% |
| Psychology | 2 | 50.0% |
| Social Sciences | 2 | 50.0% |
| Engineering | 0 | 0.0% |
| Multidisciplinary Studies | 0 | 0.0% |
| Science & Technology | 0 | 0.0% |
| Business | 0 | 0.0% |
| Education | 0 | 0.0% |
| Literature & Languages | 0 | 0.0% |
| Liberal Arts & History | 0 | 0.0% |
| Visual & Performing Arts | 0 | 0.0% |
| Communications | 0 | 0.0% |
| Arts & Humanities | 0 | 0.0% |
| Total | 4 | 100.0% |
Transportation & Commute in Antelope
Vehicle Availability by Sex in Antelope
The most prevalent vehicle ownership categories in Antelope are males with 3 vehicles (38, accounting for 84.4%) and females with 3 vehicles (2, making up 760.0%).
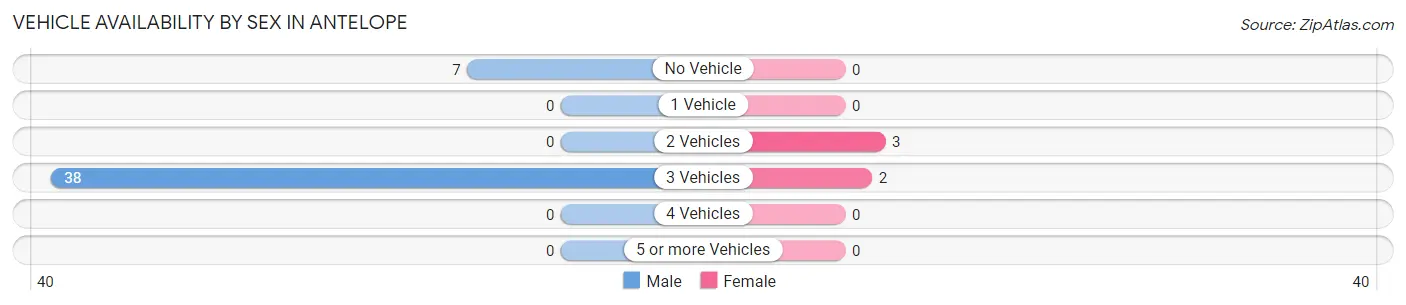
| Vehicles Available | Male | Female |
| No Vehicle | 7 (15.6%) | 0 (0.0%) |
| 1 Vehicle | 0 (0.0%) | 0 (0.0%) |
| 2 Vehicles | 0 (0.0%) | 3 (60.0%) |
| 3 Vehicles | 38 (84.4%) | 2 (40.0%) |
| 4 Vehicles | 0 (0.0%) | 0 (0.0%) |
| 5 or more Vehicles | 0 (0.0%) | 0 (0.0%) |
| Total | 45 (100.0%) | 5 (100.0%) |
Commute Time in Antelope
The most frequently occuring commute durations in Antelope are 60 to 89 minutes (30 commuters, 71.4%), less than 5 minutes (10 commuters, 23.8%), and 40 to 44 minutes (2 commuters, 4.8%).
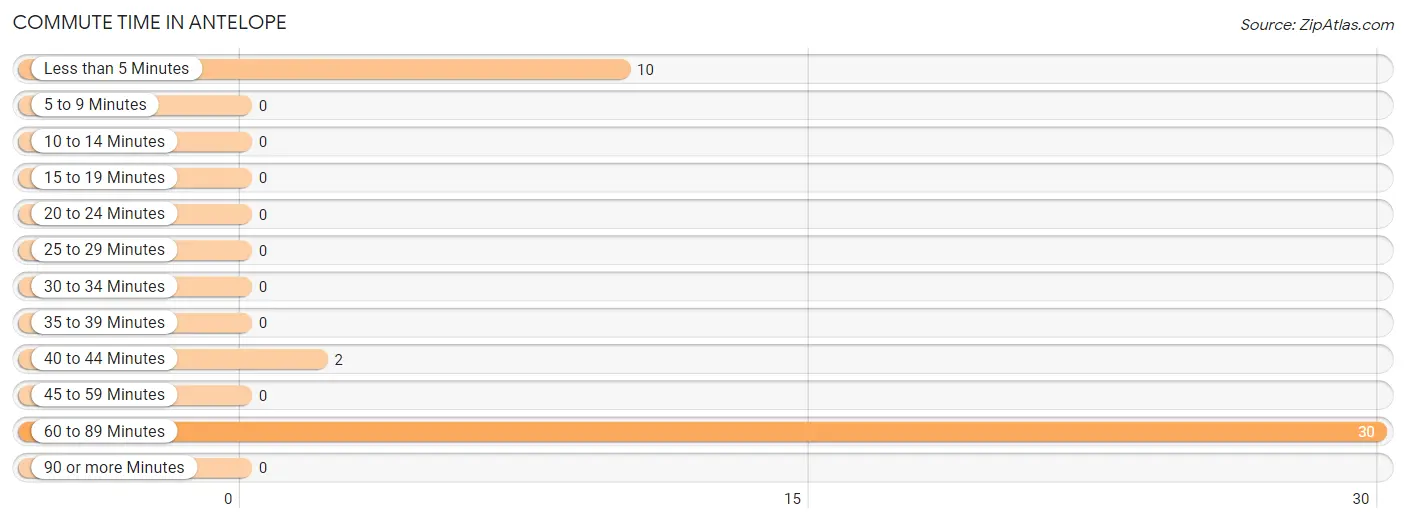
| Commute Time | # Commuters | % Commuters |
| Less than 5 Minutes | 10 | 23.8% |
| 5 to 9 Minutes | 0 | 0.0% |
| 10 to 14 Minutes | 0 | 0.0% |
| 15 to 19 Minutes | 0 | 0.0% |
| 20 to 24 Minutes | 0 | 0.0% |
| 25 to 29 Minutes | 0 | 0.0% |
| 30 to 34 Minutes | 0 | 0.0% |
| 35 to 39 Minutes | 0 | 0.0% |
| 40 to 44 Minutes | 2 | 4.8% |
| 45 to 59 Minutes | 0 | 0.0% |
| 60 to 89 Minutes | 30 | 71.4% |
| 90 or more Minutes | 0 | 0.0% |
Commute Time by Sex in Antelope
The most common commute times in Antelope are 60 to 89 minutes (30 commuters, 76.9%) for males and less than 5 minutes (3 commuters, 100.0%) for females.
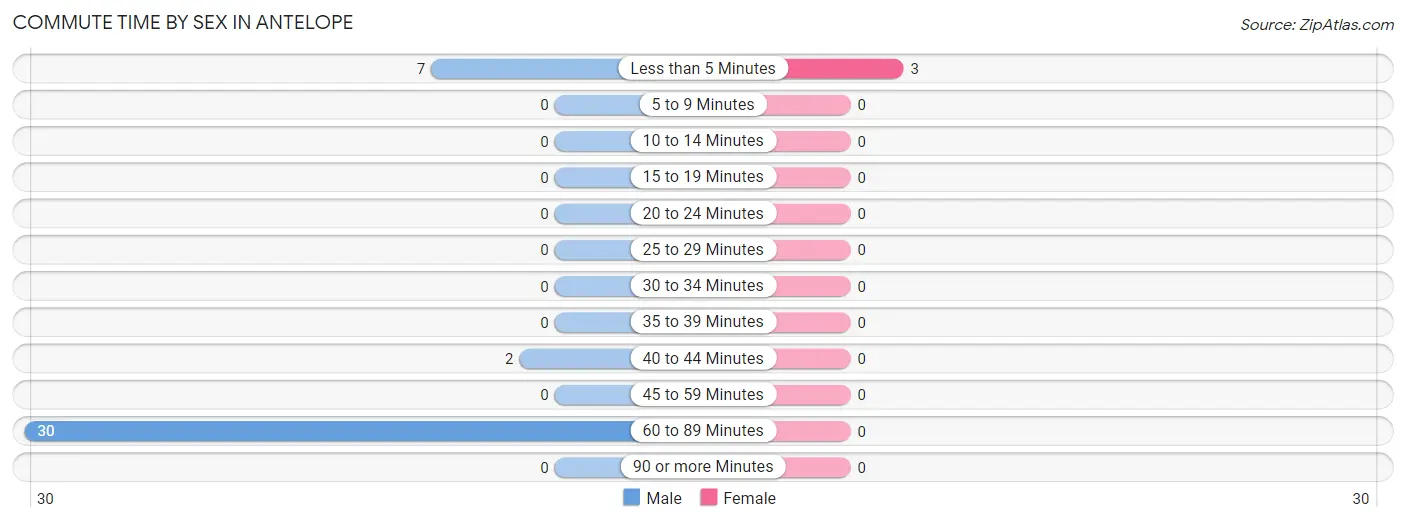
| Commute Time | Male | Female |
| Less than 5 Minutes | 7 (17.9%) | 3 (100.0%) |
| 5 to 9 Minutes | 0 (0.0%) | 0 (0.0%) |
| 10 to 14 Minutes | 0 (0.0%) | 0 (0.0%) |
| 15 to 19 Minutes | 0 (0.0%) | 0 (0.0%) |
| 20 to 24 Minutes | 0 (0.0%) | 0 (0.0%) |
| 25 to 29 Minutes | 0 (0.0%) | 0 (0.0%) |
| 30 to 34 Minutes | 0 (0.0%) | 0 (0.0%) |
| 35 to 39 Minutes | 0 (0.0%) | 0 (0.0%) |
| 40 to 44 Minutes | 2 (5.1%) | 0 (0.0%) |
| 45 to 59 Minutes | 0 (0.0%) | 0 (0.0%) |
| 60 to 89 Minutes | 30 (76.9%) | 0 (0.0%) |
| 90 or more Minutes | 0 (0.0%) | 0 (0.0%) |
Time of Departure to Work by Sex in Antelope
The most frequent times of departure to work in Antelope are 6:00 AM to 6:29 AM (30, 76.9%) for males and 8:00 AM to 8:29 AM (3, 100.0%) for females.
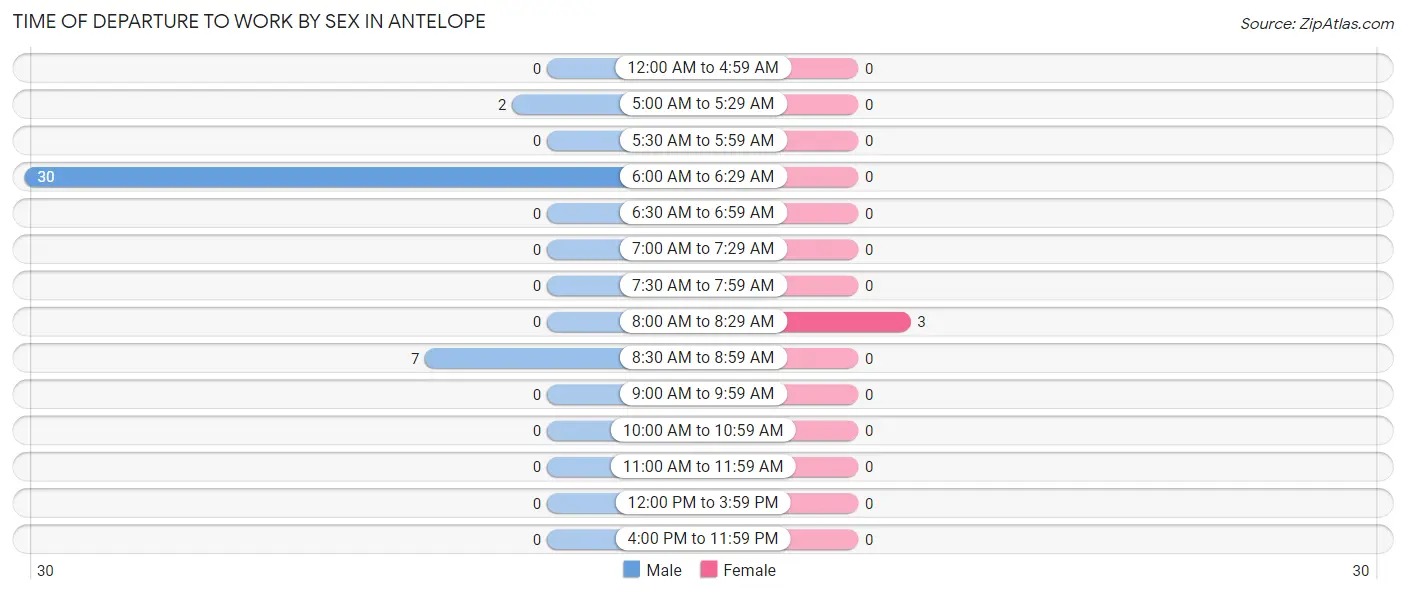
| Time of Departure | Male | Female |
| 12:00 AM to 4:59 AM | 0 (0.0%) | 0 (0.0%) |
| 5:00 AM to 5:29 AM | 2 (5.1%) | 0 (0.0%) |
| 5:30 AM to 5:59 AM | 0 (0.0%) | 0 (0.0%) |
| 6:00 AM to 6:29 AM | 30 (76.9%) | 0 (0.0%) |
| 6:30 AM to 6:59 AM | 0 (0.0%) | 0 (0.0%) |
| 7:00 AM to 7:29 AM | 0 (0.0%) | 0 (0.0%) |
| 7:30 AM to 7:59 AM | 0 (0.0%) | 0 (0.0%) |
| 8:00 AM to 8:29 AM | 0 (0.0%) | 3 (100.0%) |
| 8:30 AM to 8:59 AM | 7 (17.9%) | 0 (0.0%) |
| 9:00 AM to 9:59 AM | 0 (0.0%) | 0 (0.0%) |
| 10:00 AM to 10:59 AM | 0 (0.0%) | 0 (0.0%) |
| 11:00 AM to 11:59 AM | 0 (0.0%) | 0 (0.0%) |
| 12:00 PM to 3:59 PM | 0 (0.0%) | 0 (0.0%) |
| 4:00 PM to 11:59 PM | 0 (0.0%) | 0 (0.0%) |
| Total | 39 (100.0%) | 3 (100.0%) |
Housing Occupancy in Antelope
Occupancy by Ownership in Antelope
Of the total 22 dwellings in Antelope, owner-occupied units account for 13 (59.1%), while renter-occupied units make up 9 (40.9%).
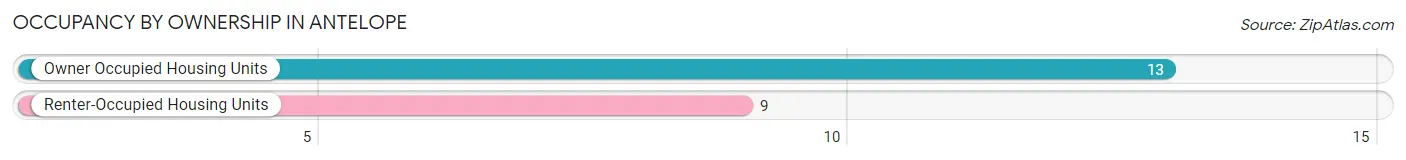
| Occupancy | # Housing Units | % Housing Units |
| Owner Occupied Housing Units | 13 | 59.1% |
| Renter-Occupied Housing Units | 9 | 40.9% |
| Total Occupied Housing Units | 22 | 100.0% |
Occupancy by Household Size in Antelope
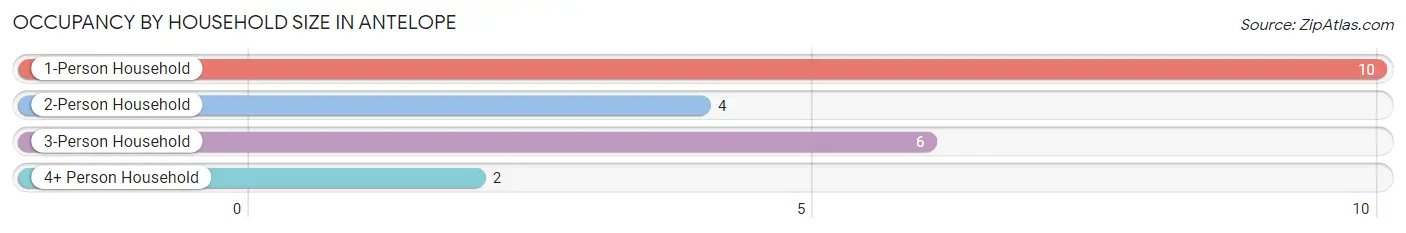
| Household Size | # Housing Units | % Housing Units |
| 1-Person Household | 10 | 45.5% |
| 2-Person Household | 4 | 18.2% |
| 3-Person Household | 6 | 27.3% |
| 4+ Person Household | 2 | 9.1% |
| Total Housing Units | 22 | 100.0% |
Occupancy by Ownership by Household Size in Antelope
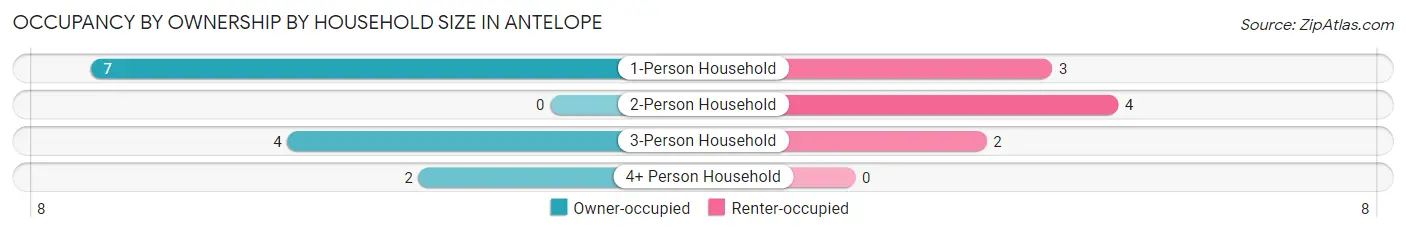
| Household Size | Owner-occupied | Renter-occupied |
| 1-Person Household | 7 (70.0%) | 3 (30.0%) |
| 2-Person Household | 0 (0.0%) | 4 (100.0%) |
| 3-Person Household | 4 (66.7%) | 2 (33.3%) |
| 4+ Person Household | 2 (100.0%) | 0 (0.0%) |
| Total Housing Units | 13 (59.1%) | 9 (40.9%) |
Occupancy by Educational Attainment in Antelope
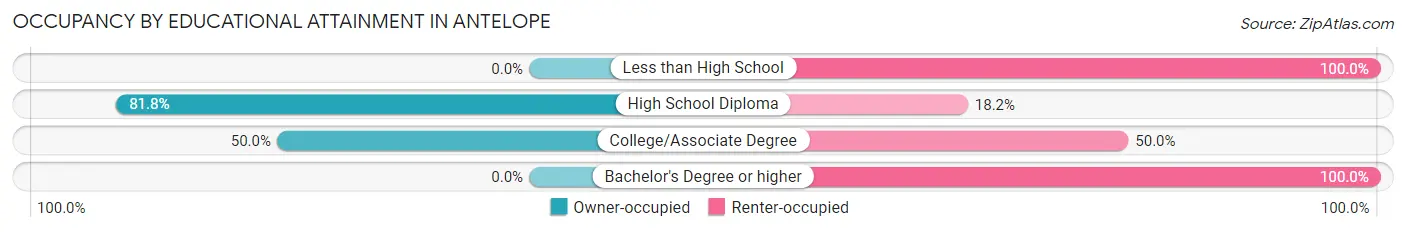
| Household Size | Owner-occupied | Renter-occupied |
| Less than High School | 0 (0.0%) | 1 (100.0%) |
| High School Diploma | 9 (81.8%) | 2 (18.2%) |
| College/Associate Degree | 4 (50.0%) | 4 (50.0%) |
| Bachelor's Degree or higher | 0 (0.0%) | 2 (100.0%) |
Occupancy by Age of Householder in Antelope
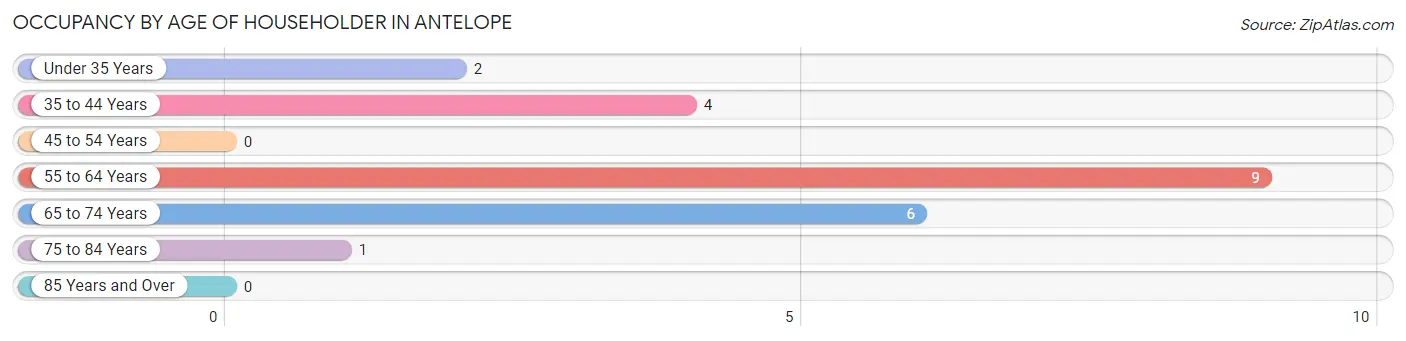
| Age Bracket | # Households | % Households |
| Under 35 Years | 2 | 9.1% |
| 35 to 44 Years | 4 | 18.2% |
| 45 to 54 Years | 0 | 0.0% |
| 55 to 64 Years | 9 | 40.9% |
| 65 to 74 Years | 6 | 27.3% |
| 75 to 84 Years | 1 | 4.5% |
| 85 Years and Over | 0 | 0.0% |
| Total | 22 | 100.0% |
Housing Finances in Antelope
Median Income by Occupancy in Antelope
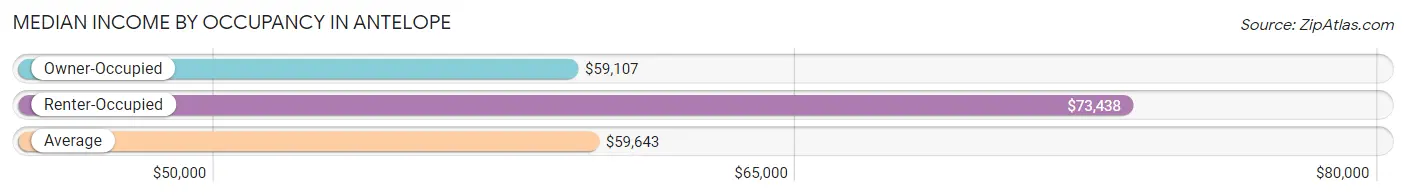
| Occupancy Type | # Households | Median Income |
| Owner-Occupied | 13 (59.1%) | $59,107 |
| Renter-Occupied | 9 (40.9%) | $73,438 |
| Average | 22 (100.0%) | $59,643 |
Occupancy by Householder Income Bracket in Antelope
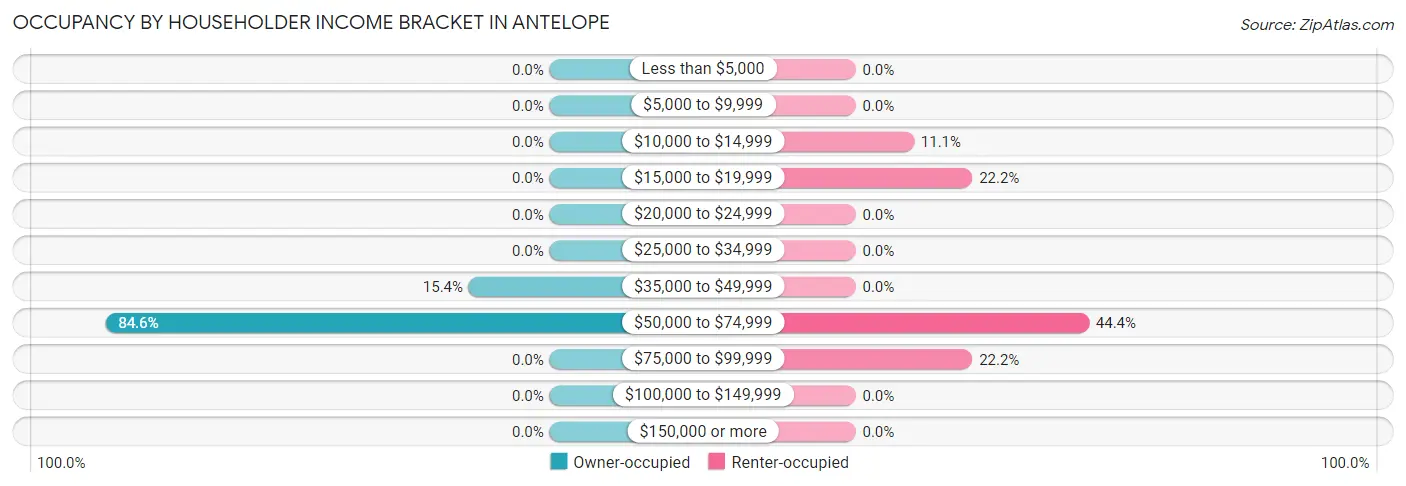
| Income Bracket | Owner-occupied | Renter-occupied |
| Less than $5,000 | 0 (0.0%) | 0 (0.0%) |
| $5,000 to $9,999 | 0 (0.0%) | 0 (0.0%) |
| $10,000 to $14,999 | 0 (0.0%) | 1 (11.1%) |
| $15,000 to $19,999 | 0 (0.0%) | 2 (22.2%) |
| $20,000 to $24,999 | 0 (0.0%) | 0 (0.0%) |
| $25,000 to $34,999 | 0 (0.0%) | 0 (0.0%) |
| $35,000 to $49,999 | 2 (15.4%) | 0 (0.0%) |
| $50,000 to $74,999 | 11 (84.6%) | 4 (44.4%) |
| $75,000 to $99,999 | 0 (0.0%) | 2 (22.2%) |
| $100,000 to $149,999 | 0 (0.0%) | 0 (0.0%) |
| $150,000 or more | 0 (0.0%) | 0 (0.0%) |
| Total | 13 (100.0%) | 9 (100.0%) |
Monthly Housing Cost Tiers in Antelope
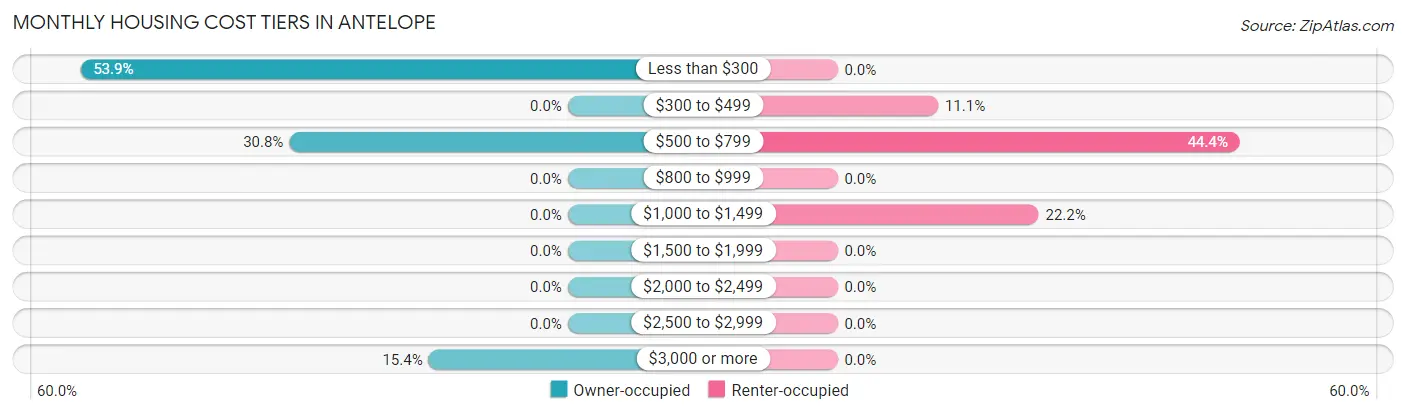
| Monthly Cost | Owner-occupied | Renter-occupied |
| Less than $300 | 7 (53.8%) | 0 (0.0%) |
| $300 to $499 | 0 (0.0%) | 1 (11.1%) |
| $500 to $799 | 4 (30.8%) | 4 (44.4%) |
| $800 to $999 | 0 (0.0%) | 0 (0.0%) |
| $1,000 to $1,499 | 0 (0.0%) | 2 (22.2%) |
| $1,500 to $1,999 | 0 (0.0%) | 0 (0.0%) |
| $2,000 to $2,499 | 0 (0.0%) | 0 (0.0%) |
| $2,500 to $2,999 | 0 (0.0%) | 0 (0.0%) |
| $3,000 or more | 2 (15.4%) | 0 (0.0%) |
| Total | 13 (100.0%) | 9 (100.0%) |
Physical Housing Characteristics in Antelope
Housing Structures in Antelope
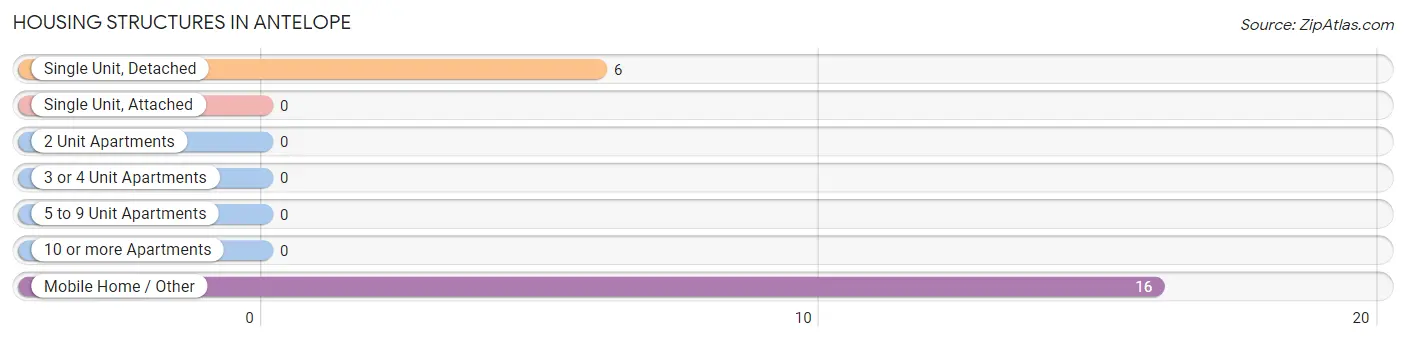
| Structure Type | # Housing Units | % Housing Units |
| Single Unit, Detached | 6 | 27.3% |
| Single Unit, Attached | 0 | 0.0% |
| 2 Unit Apartments | 0 | 0.0% |
| 3 or 4 Unit Apartments | 0 | 0.0% |
| 5 to 9 Unit Apartments | 0 | 0.0% |
| 10 or more Apartments | 0 | 0.0% |
| Mobile Home / Other | 16 | 72.7% |
| Total | 22 | 100.0% |
Housing Structures by Occupancy in Antelope
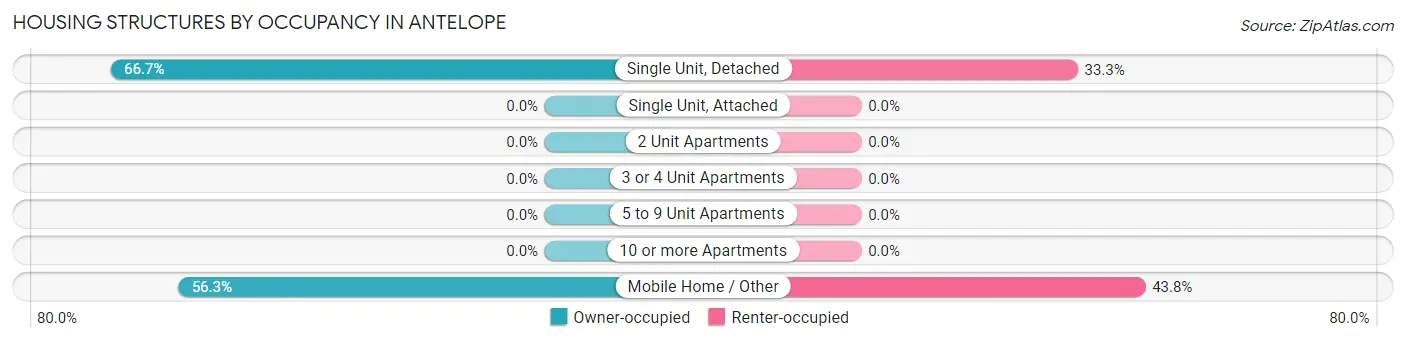
| Structure Type | Owner-occupied | Renter-occupied |
| Single Unit, Detached | 4 (66.7%) | 2 (33.3%) |
| Single Unit, Attached | 0 (0.0%) | 0 (0.0%) |
| 2 Unit Apartments | 0 (0.0%) | 0 (0.0%) |
| 3 or 4 Unit Apartments | 0 (0.0%) | 0 (0.0%) |
| 5 to 9 Unit Apartments | 0 (0.0%) | 0 (0.0%) |
| 10 or more Apartments | 0 (0.0%) | 0 (0.0%) |
| Mobile Home / Other | 9 (56.2%) | 7 (43.8%) |
| Total | 13 (59.1%) | 9 (40.9%) |
Housing Structures by Number of Rooms in Antelope
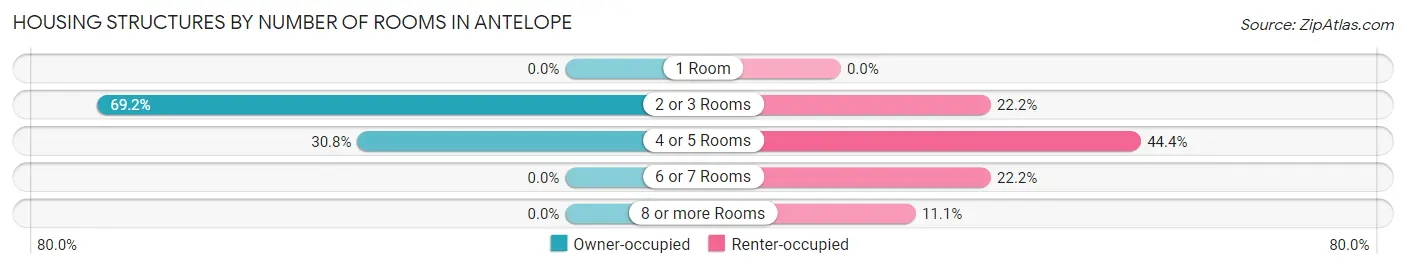
| Number of Rooms | Owner-occupied | Renter-occupied |
| 1 Room | 0 (0.0%) | 0 (0.0%) |
| 2 or 3 Rooms | 9 (69.2%) | 2 (22.2%) |
| 4 or 5 Rooms | 4 (30.8%) | 4 (44.4%) |
| 6 or 7 Rooms | 0 (0.0%) | 2 (22.2%) |
| 8 or more Rooms | 0 (0.0%) | 1 (11.1%) |
| Total | 13 (100.0%) | 9 (100.0%) |
Housing Structure by Heating Type in Antelope
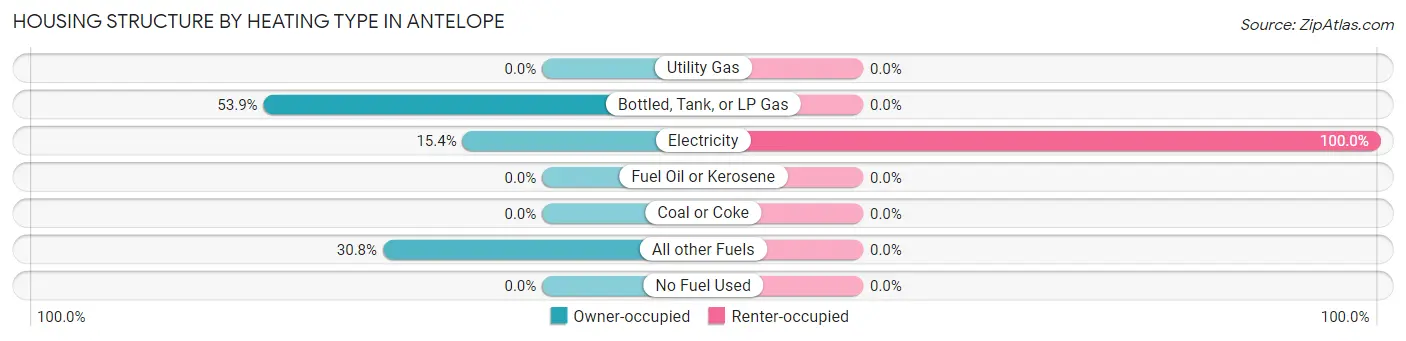
| Heating Type | Owner-occupied | Renter-occupied |
| Utility Gas | 0 (0.0%) | 0 (0.0%) |
| Bottled, Tank, or LP Gas | 7 (53.8%) | 0 (0.0%) |
| Electricity | 2 (15.4%) | 9 (100.0%) |
| Fuel Oil or Kerosene | 0 (0.0%) | 0 (0.0%) |
| Coal or Coke | 0 (0.0%) | 0 (0.0%) |
| All other Fuels | 4 (30.8%) | 0 (0.0%) |
| No Fuel Used | 0 (0.0%) | 0 (0.0%) |
| Total | 13 (100.0%) | 9 (100.0%) |
Household Vehicle Usage in Antelope
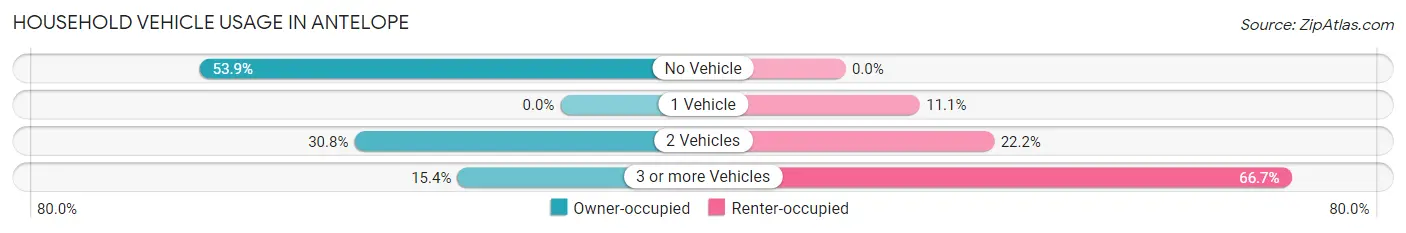
| Vehicles per Household | Owner-occupied | Renter-occupied |
| No Vehicle | 7 (53.8%) | 0 (0.0%) |
| 1 Vehicle | 0 (0.0%) | 1 (11.1%) |
| 2 Vehicles | 4 (30.8%) | 2 (22.2%) |
| 3 or more Vehicles | 2 (15.4%) | 6 (66.7%) |
| Total | 13 (100.0%) | 9 (100.0%) |
Real Estate & Mortgages in Antelope
Real Estate and Mortgage Overview in Antelope
| Characteristic | Without Mortgage | With Mortgage |
| Housing Units | 7 | 6 |
| Median Property Value | - | - |
| Median Household Income | - | - |
| Monthly Housing Costs | - | - |
| Real Estate Taxes | - | - |
Property Value by Mortgage Status in Antelope
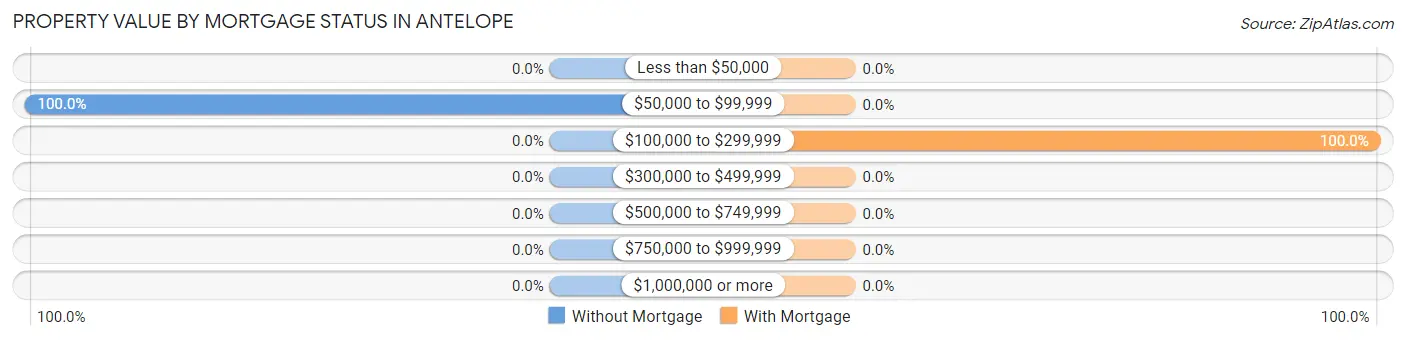
| Property Value | Without Mortgage | With Mortgage |
| Less than $50,000 | 0 (0.0%) | 0 (0.0%) |
| $50,000 to $99,999 | 7 (100.0%) | 0 (0.0%) |
| $100,000 to $299,999 | 0 (0.0%) | 6 (100.0%) |
| $300,000 to $499,999 | 0 (0.0%) | 0 (0.0%) |
| $500,000 to $749,999 | 0 (0.0%) | 0 (0.0%) |
| $750,000 to $999,999 | 0 (0.0%) | 0 (0.0%) |
| $1,000,000 or more | 0 (0.0%) | 0 (0.0%) |
| Total | 7 (100.0%) | 6 (100.0%) |
Household Income by Mortgage Status in Antelope
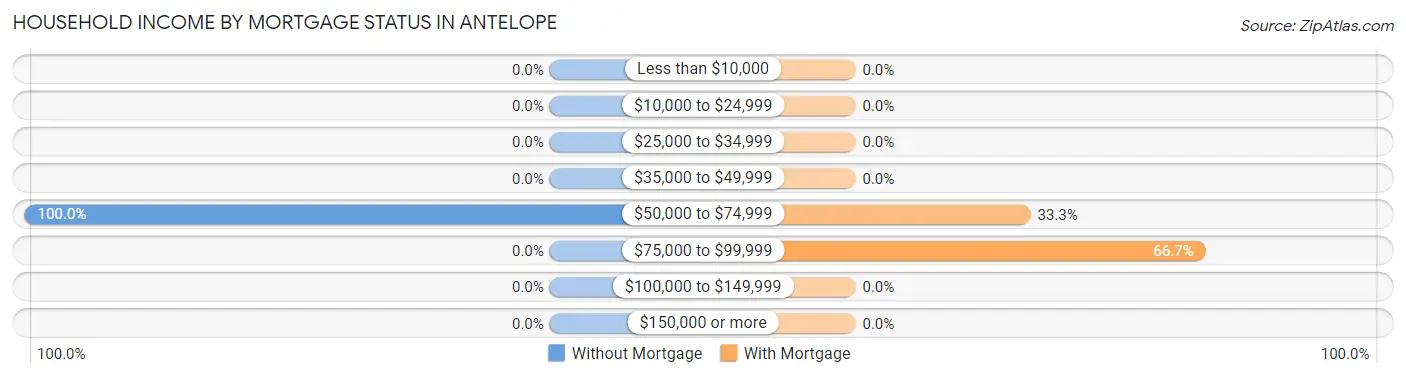
| Household Income | Without Mortgage | With Mortgage |
| Less than $10,000 | 0 (0.0%) | 0 (0.0%) |
| $10,000 to $24,999 | 0 (0.0%) | 0 (0.0%) |
| $25,000 to $34,999 | 0 (0.0%) | 0 (0.0%) |
| $35,000 to $49,999 | 0 (0.0%) | 0 (0.0%) |
| $50,000 to $74,999 | 7 (100.0%) | 2 (33.3%) |
| $75,000 to $99,999 | 0 (0.0%) | 4 (66.7%) |
| $100,000 to $149,999 | 0 (0.0%) | 0 (0.0%) |
| $150,000 or more | 0 (0.0%) | 0 (0.0%) |
| Total | 7 (100.0%) | 6 (100.0%) |
Property Value to Household Income Ratio in Antelope
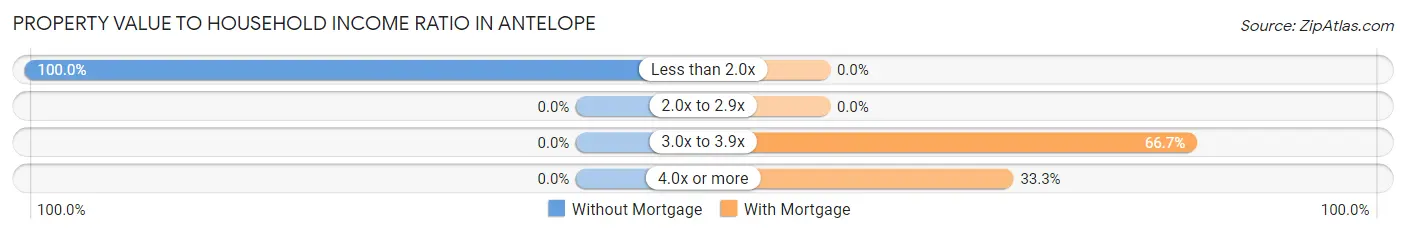
| Value-to-Income Ratio | Without Mortgage | With Mortgage |
| Less than 2.0x | 7 (100.0%) | 0 (0.0%) |
| 2.0x to 2.9x | 0 (0.0%) | 0 (0.0%) |
| 3.0x to 3.9x | 0 (0.0%) | 4 (66.7%) |
| 4.0x or more | 0 (0.0%) | 2 (33.3%) |
| Total | 7 (100.0%) | 6 (100.0%) |
Real Estate Taxes by Mortgage Status in Antelope
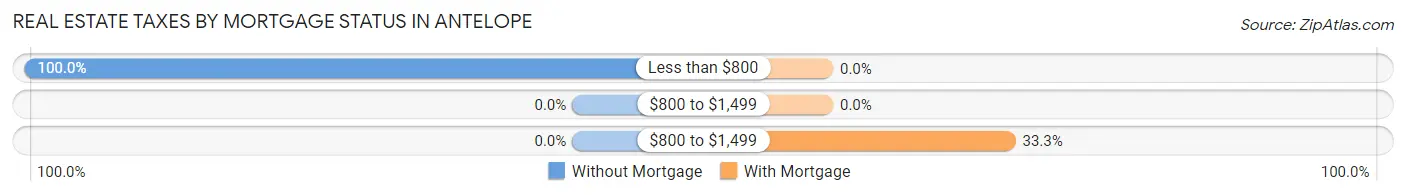
| Property Taxes | Without Mortgage | With Mortgage |
| Less than $800 | 7 (100.0%) | 0 (0.0%) |
| $800 to $1,499 | 0 (0.0%) | 0 (0.0%) |
| $800 to $1,499 | 0 (0.0%) | 2 (33.3%) |
| Total | 7 (100.0%) | 6 (100.0%) |
Health & Disability in Antelope
Health Insurance Coverage by Age in Antelope
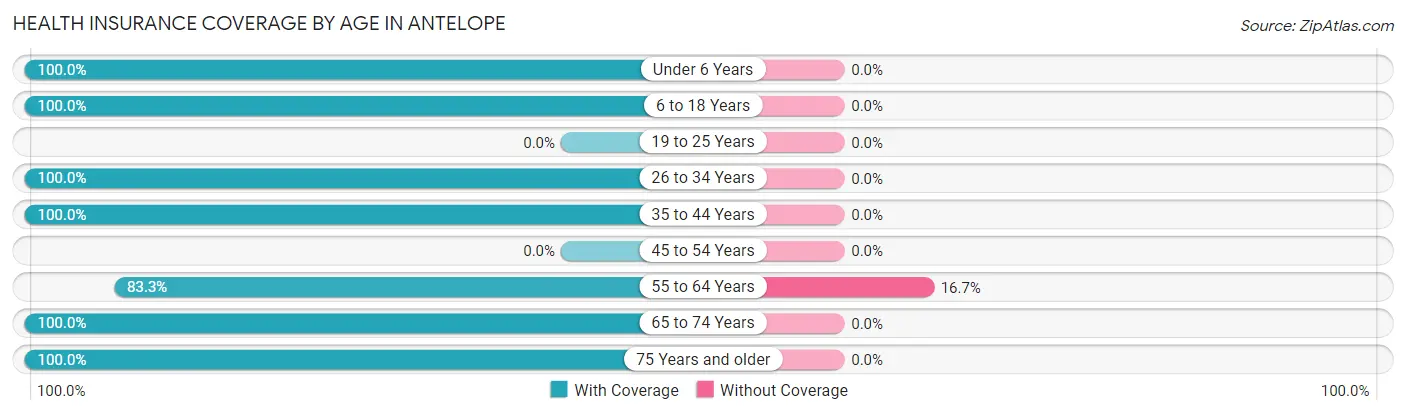
| Age Bracket | With Coverage | Without Coverage |
| Under 6 Years | 2 (100.0%) | 0 (0.0%) |
| 6 to 18 Years | 2 (100.0%) | 0 (0.0%) |
| 19 to 25 Years | 0 (0.0%) | 0 (0.0%) |
| 26 to 34 Years | 39 (100.0%) | 0 (0.0%) |
| 35 to 44 Years | 4 (100.0%) | 0 (0.0%) |
| 45 to 54 Years | 0 (0.0%) | 0 (0.0%) |
| 55 to 64 Years | 10 (83.3%) | 2 (16.7%) |
| 65 to 74 Years | 11 (100.0%) | 0 (0.0%) |
| 75 Years and older | 1 (100.0%) | 0 (0.0%) |
| Total | 69 (97.2%) | 2 (2.8%) |
Health Insurance Coverage by Citizenship Status in Antelope
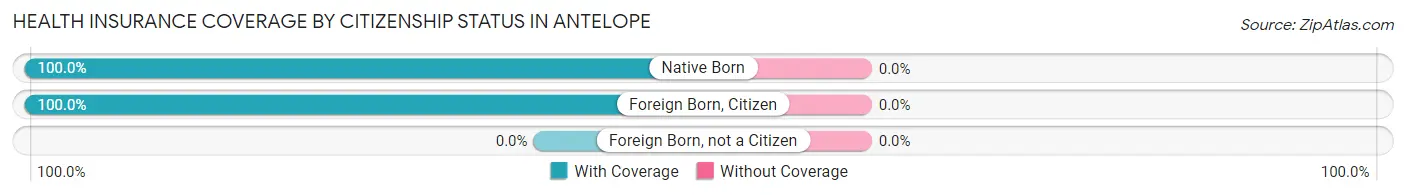
| Citizenship Status | With Coverage | Without Coverage |
| Native Born | 2 (100.0%) | 0 (0.0%) |
| Foreign Born, Citizen | 2 (100.0%) | 0 (0.0%) |
| Foreign Born, not a Citizen | 0 (0.0%) | 0 (0.0%) |
Health Insurance Coverage by Household Income in Antelope
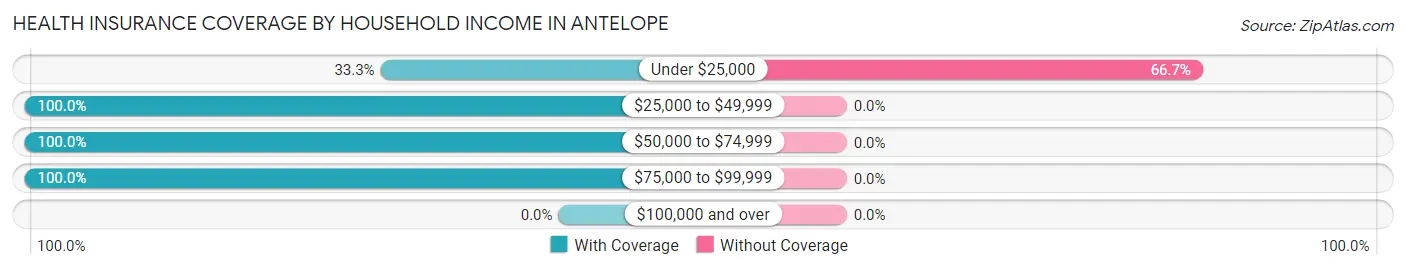
| Household Income | With Coverage | Without Coverage |
| Under $25,000 | 1 (33.3%) | 2 (66.7%) |
| $25,000 to $49,999 | 9 (100.0%) | 0 (0.0%) |
| $50,000 to $74,999 | 52 (100.0%) | 0 (0.0%) |
| $75,000 to $99,999 | 7 (100.0%) | 0 (0.0%) |
| $100,000 and over | 0 (0.0%) | 0 (0.0%) |
Public vs Private Health Insurance Coverage by Age in Antelope
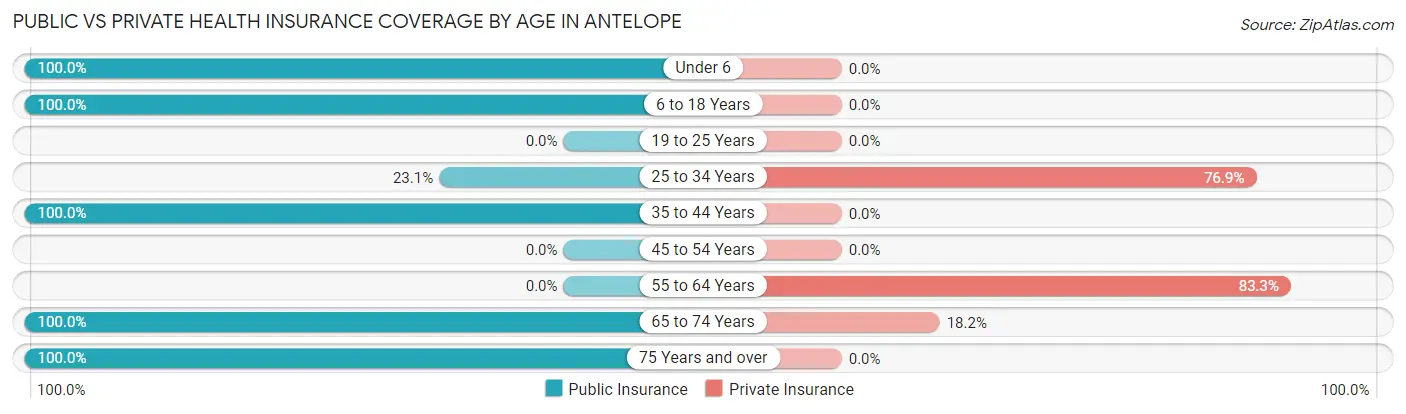
| Age Bracket | Public Insurance | Private Insurance |
| Under 6 | 2 (100.0%) | 0 (0.0%) |
| 6 to 18 Years | 2 (100.0%) | 0 (0.0%) |
| 19 to 25 Years | 0 (0.0%) | 0 (0.0%) |
| 25 to 34 Years | 9 (23.1%) | 30 (76.9%) |
| 35 to 44 Years | 4 (100.0%) | 0 (0.0%) |
| 45 to 54 Years | 0 (0.0%) | 0 (0.0%) |
| 55 to 64 Years | 0 (0.0%) | 10 (83.3%) |
| 65 to 74 Years | 11 (100.0%) | 2 (18.2%) |
| 75 Years and over | 1 (100.0%) | 0 (0.0%) |
| Total | 29 (40.8%) | 42 (59.2%) |
Disability Status by Sex by Age in Antelope
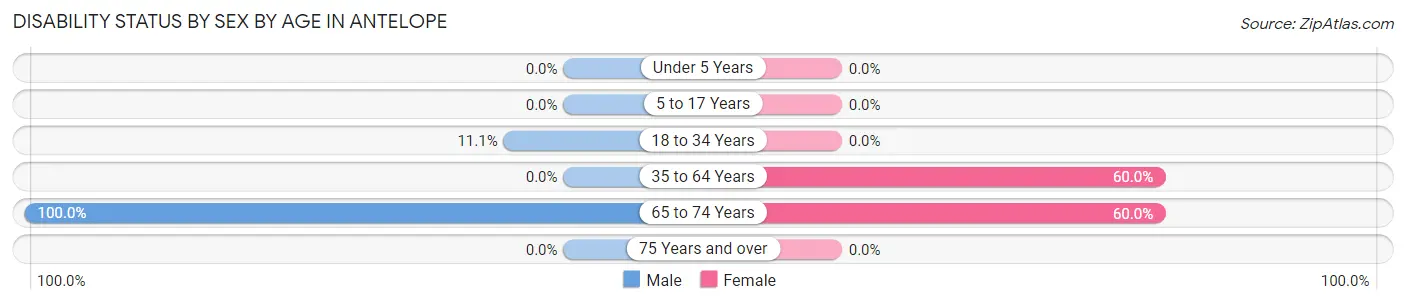
| Age Bracket | Male | Female |
| Under 5 Years | 0 (0.0%) | 0 (0.0%) |
| 5 to 17 Years | 0 (0.0%) | 0 (0.0%) |
| 18 to 34 Years | 4 (11.1%) | 0 (0.0%) |
| 35 to 64 Years | 0 (0.0%) | 3 (60.0%) |
| 65 to 74 Years | 6 (100.0%) | 3 (60.0%) |
| 75 Years and over | 0 (0.0%) | 0 (0.0%) |
Disability Class by Sex by Age in Antelope
Disability Class: Hearing Difficulty
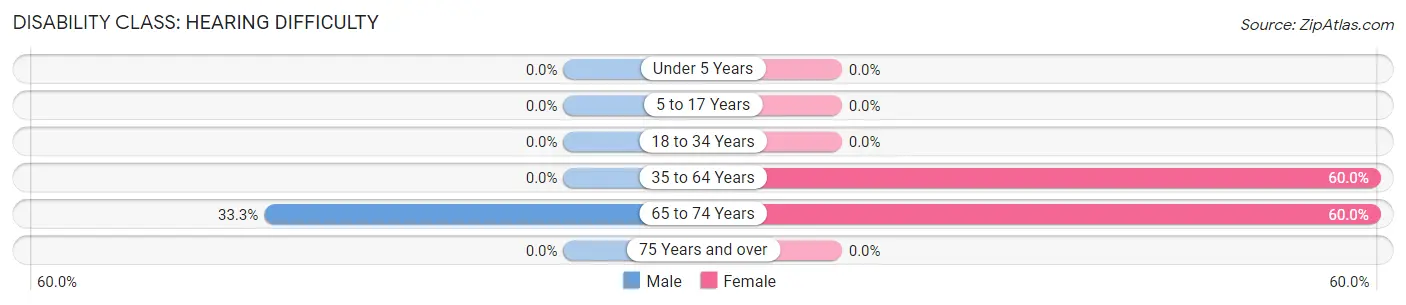
| Age Bracket | Male | Female |
| Under 5 Years | 0 (0.0%) | 0 (0.0%) |
| 5 to 17 Years | 0 (0.0%) | 0 (0.0%) |
| 18 to 34 Years | 0 (0.0%) | 0 (0.0%) |
| 35 to 64 Years | 0 (0.0%) | 3 (60.0%) |
| 65 to 74 Years | 2 (33.3%) | 3 (60.0%) |
| 75 Years and over | 0 (0.0%) | 0 (0.0%) |
Disability Class: Vision Difficulty
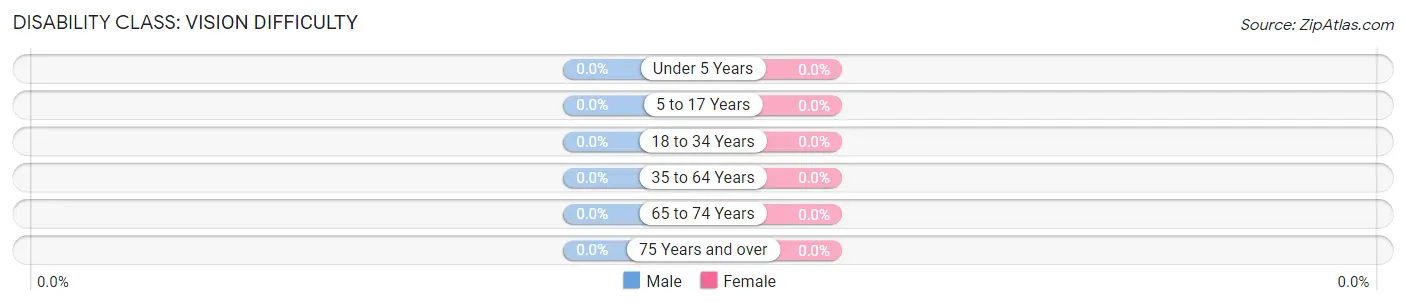
| Age Bracket | Male | Female |
| Under 5 Years | 0 (0.0%) | 0 (0.0%) |
| 5 to 17 Years | 0 (0.0%) | 0 (0.0%) |
| 18 to 34 Years | 0 (0.0%) | 0 (0.0%) |
| 35 to 64 Years | 0 (0.0%) | 0 (0.0%) |
| 65 to 74 Years | 0 (0.0%) | 0 (0.0%) |
| 75 Years and over | 0 (0.0%) | 0 (0.0%) |
Disability Class: Cognitive Difficulty
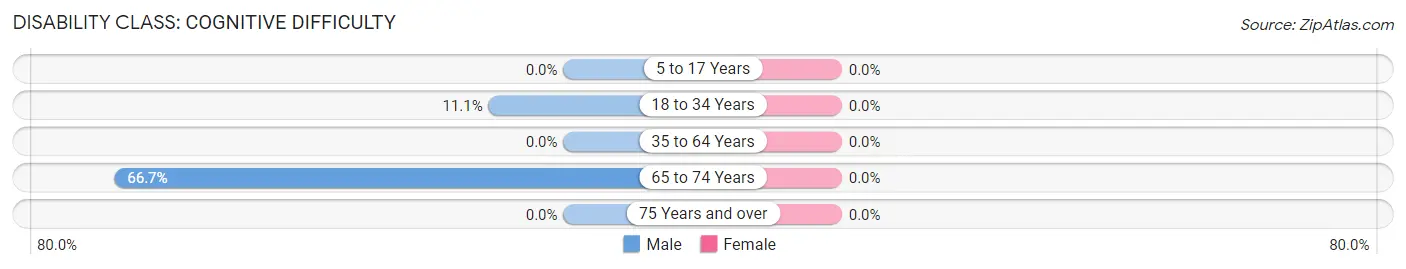
| Age Bracket | Male | Female |
| 5 to 17 Years | 0 (0.0%) | 0 (0.0%) |
| 18 to 34 Years | 4 (11.1%) | 0 (0.0%) |
| 35 to 64 Years | 0 (0.0%) | 0 (0.0%) |
| 65 to 74 Years | 4 (66.7%) | 0 (0.0%) |
| 75 Years and over | 0 (0.0%) | 0 (0.0%) |
Disability Class: Ambulatory Difficulty
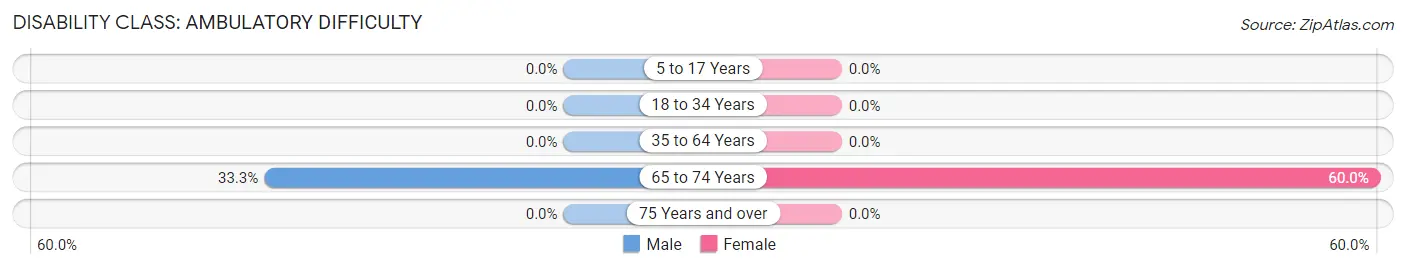
| Age Bracket | Male | Female |
| 5 to 17 Years | 0 (0.0%) | 0 (0.0%) |
| 18 to 34 Years | 0 (0.0%) | 0 (0.0%) |
| 35 to 64 Years | 0 (0.0%) | 0 (0.0%) |
| 65 to 74 Years | 2 (33.3%) | 3 (60.0%) |
| 75 Years and over | 0 (0.0%) | 0 (0.0%) |
Disability Class: Self-Care Difficulty
| Age Bracket | Male | Female |
| 5 to 17 Years | 0 (0.0%) | 0 (0.0%) |
| 18 to 34 Years | 0 (0.0%) | 0 (0.0%) |
| 35 to 64 Years | 0 (0.0%) | 0 (0.0%) |
| 65 to 74 Years | 0 (0.0%) | 0 (0.0%) |
| 75 Years and over | 0 (0.0%) | 0 (0.0%) |
Technology Access in Antelope
Computing Device Access in Antelope
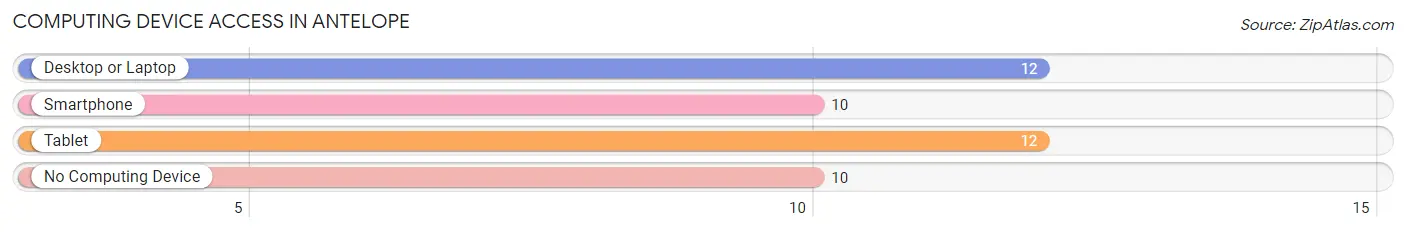
| Device Type | # Households | % Households |
| Desktop or Laptop | 12 | 54.5% |
| Smartphone | 10 | 45.5% |
| Tablet | 12 | 54.5% |
| No Computing Device | 10 | 45.5% |
| Total | 22 | 100.0% |
Internet Access in Antelope
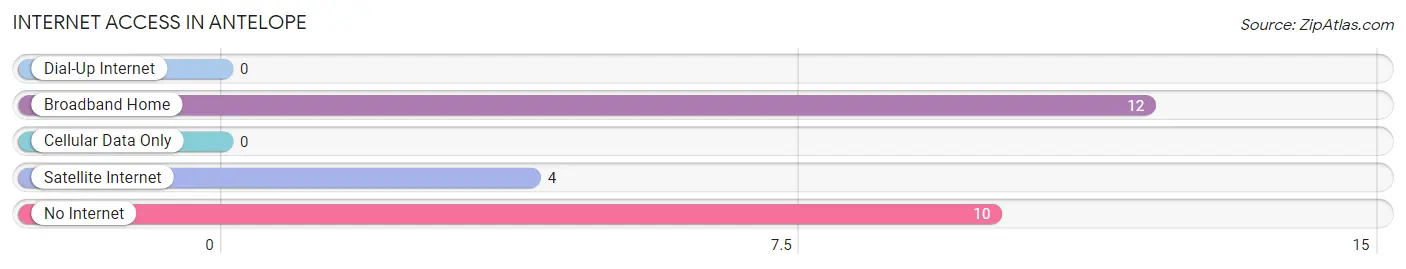
| Internet Type | # Households | % Households |
| Dial-Up Internet | 0 | 0.0% |
| Broadband Home | 12 | 54.5% |
| Cellular Data Only | 0 | 0.0% |
| Satellite Internet | 4 | 18.2% |
| No Internet | 10 | 45.5% |
| Total | 22 | 100.0% |
Antelope Summary
Antelope, Oregon is a small unincorporated community located in Wasco County in the state of Oregon. It is situated in the foothills of the Cascade Mountains, approximately 20 miles east of The Dalles. The population of Antelope was estimated to be around 200 people in 2020.
History
Antelope was founded in 1871 by a group of settlers from the nearby town of The Dalles. The settlers were looking for a place to settle and raise their families. The town was named after the nearby Antelope Creek, which was named by the Native Americans who lived in the area. The first settlers were mostly farmers and ranchers, and the town quickly grew to include a post office, a school, a church, and a general store.
In the late 1800s, Antelope was a bustling community with a population of over 500 people. The town was home to several businesses, including a blacksmith, a livery stable, a hotel, and a saloon. The town also had a newspaper, the Antelope Herald, which was published from 1887 to 1895.
In the early 1900s, the population of Antelope began to decline as many of the settlers moved away to find work in larger cities. By the 1950s, the population had dropped to around 200 people.
Geography
Antelope is located in the foothills of the Cascade Mountains in Wasco County, Oregon. The town is situated at an elevation of 1,890 feet and is surrounded by rolling hills and grasslands. The nearby Antelope Creek flows through the town and is a popular spot for fishing and swimming.
The climate in Antelope is semi-arid, with hot summers and cold winters. The average annual temperature is around 50 degrees Fahrenheit, and the average annual precipitation is around 12 inches.
Economy
The economy of Antelope is largely based on agriculture and ranching. The town is home to several farms and ranches, which produce a variety of crops and livestock. The town also has a few small businesses, including a general store, a cafe, and a gas station.
Demographics
As of 2020, the population of Antelope was estimated to be around 200 people. The town is predominantly white, with a small Hispanic population. The median household income is around $35,000, and the median home value is around $150,000.
Antelope is a small, rural community with a rich history and a strong sense of community. The town is a popular destination for outdoor enthusiasts, and it is home to several parks and trails. The town is also home to a variety of wildlife, including deer, elk, and antelope.
Common Questions
What is Per Capita Income in Antelope?
Per Capita income in Antelope is $30,449.
What is the Median Household income in Antelope?
Median Household Income in Antelope is $59,643.
What is Inequality or Gini Index in Antelope?
Inequality or Gini Index in Antelope is 0.17.
What is the Total Population of Antelope?
Total Population of Antelope is 71.
What is the Total Male Population of Antelope?
Total Male Population of Antelope is 55.
What is the Total Female Population of Antelope?
Total Female Population of Antelope is 16.
What is the Ratio of Males per 100 Females in Antelope?
There are 343.75 Males per 100 Females in Antelope.
What is the Ratio of Females per 100 Males in Antelope?
There are 29.09 Females per 100 Males in Antelope.
What is the Median Population Age in Antelope?
Median Population Age in Antelope is 31.8 Years.
What is the Average Family Size in Antelope
Average Family Size in Antelope is 3.3 People.
What is the Average Household Size in Antelope
Average Household Size in Antelope is 3.2 People.
How Large is the Labor Force in Antelope?
There are 50 People in the Labor Forcein in Antelope.
What is the Percentage of People in the Labor Force in Antelope?
74.6% of People are in the Labor Force in Antelope.