Zip Codes with the Highest Poverty Level Among Children Under the Age of 5 in Oregon
RELATED REPORTS & OPTIONS
Highest Poverty | Child 0-5
Oregon
Compare Zip Codes
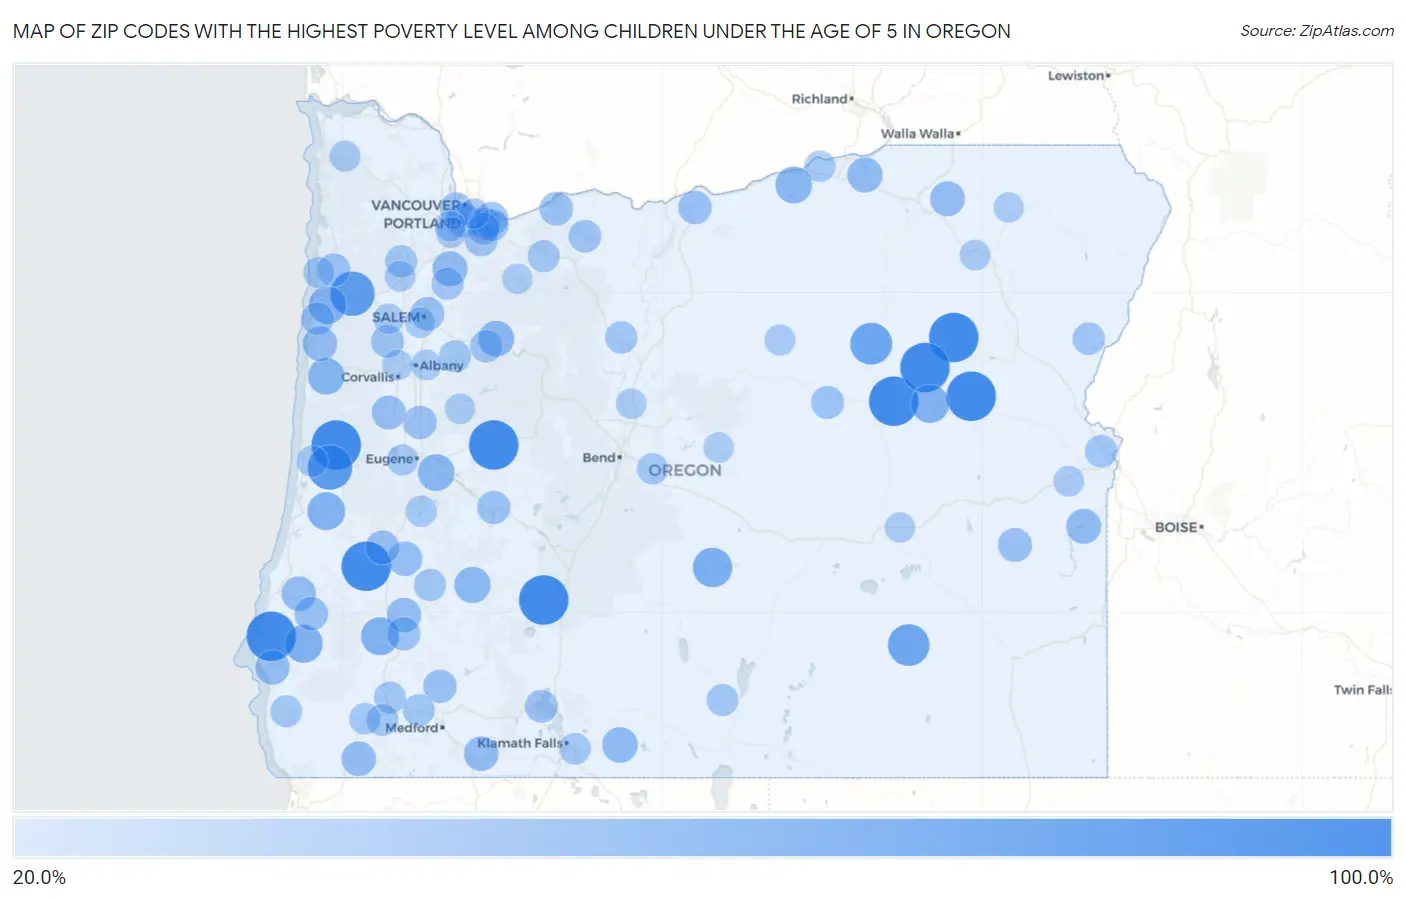
Map of Zip Codes with the Highest Poverty Level Among Children Under the Age of 5 in Oregon
20.0%
100.0%
Zip Codes with the Highest Poverty Level Among Children Under the Age of 5 in Oregon
| Zip Code | Child Poverty | vs State | vs National | |
| 1. | 97845 | 100.0% | 14.6%(+85.4)#1 | 18.1%(+81.9)#17 |
| 2. | 97488 | 100.0% | 14.6%(+85.4)#2 | 18.1%(+81.9)#102 |
| 3. | 97450 | 100.0% | 14.6%(+85.4)#3 | 18.1%(+81.9)#140 |
| 4. | 97486 | 100.0% | 14.6%(+85.4)#4 | 18.1%(+81.9)#162 |
| 5. | 97480 | 100.0% | 14.6%(+85.4)#5 | 18.1%(+81.9)#320 |
| 6. | 97877 | 100.0% | 14.6%(+85.4)#6 | 18.1%(+81.9)#324 |
| 7. | 97731 | 100.0% | 14.6%(+85.4)#7 | 18.1%(+81.9)#355 |
| 8. | 97884 | 100.0% | 14.6%(+85.4)#8 | 18.1%(+81.9)#490 |
| 9. | 97817 | 100.0% | 14.6%(+85.4)#9 | 18.1%(+81.9)#554 |
| 10. | 97453 | 78.8% | 14.6%(+64.2)#10 | 18.1%(+60.7)#848 |
| 11. | 97347 | 78.3% | 14.6%(+63.7)#11 | 18.1%(+60.2)#862 |
| 12. | 97856 | 67.9% | 14.6%(+53.4)#12 | 18.1%(+49.9)#1,230 |
| 13. | 97721 | 66.7% | 14.6%(+52.1)#13 | 18.1%(+48.6)#1,308 |
| 14. | 97641 | 57.6% | 14.6%(+43.0)#14 | 18.1%(+39.5)#1,858 |
| 15. | 97869 | 52.9% | 14.6%(+38.4)#15 | 18.1%(+34.9)#2,251 |
| 16. | 97469 | 51.5% | 14.6%(+36.9)#16 | 18.1%(+33.4)#2,386 |
| 17. | 97466 | 51.4% | 14.6%(+36.9)#17 | 18.1%(+33.4)#2,393 |
| 18. | 97467 | 50.7% | 14.6%(+36.2)#18 | 18.1%(+32.7)#2,451 |
| 19. | 97368 | 50.0% | 14.6%(+35.4)#19 | 18.1%(+31.9)#2,525 |
| 20. | 97818 | 46.6% | 14.6%(+32.0)#20 | 18.1%(+28.5)#2,970 |
| 21. | 97455 | 46.3% | 14.6%(+31.7)#21 | 18.1%(+28.3)#3,000 |
| 22. | 97391 | 45.5% | 14.6%(+30.9)#22 | 18.1%(+27.4)#3,105 |
| 23. | 97447 | 44.4% | 14.6%(+29.9)#23 | 18.1%(+26.4)#3,266 |
| 24. | 97358 | 43.0% | 14.6%(+28.5)#24 | 18.1%(+25.0)#3,473 |
| 25. | 97623 | 41.7% | 14.6%(+27.1)#25 | 18.1%(+23.6)#3,710 |
| 26. | 97875 | 39.8% | 14.6%(+25.2)#26 | 18.1%(+21.7)#4,071 |
| 27. | 97002 | 39.5% | 14.6%(+24.9)#27 | 18.1%(+21.4)#4,125 |
| 28. | 97913 | 39.3% | 14.6%(+24.8)#28 | 18.1%(+21.3)#4,145 |
| 29. | 97810 | 38.5% | 14.6%(+23.9)#29 | 18.1%(+20.4)#4,313 |
| 30. | 97209 | 37.7% | 14.6%(+23.1)#30 | 18.1%(+19.6)#4,457 |
| 31. | 97457 | 37.5% | 14.6%(+22.9)#31 | 18.1%(+19.4)#4,508 |
| 32. | 97520 | 37.3% | 14.6%(+22.8)#32 | 18.1%(+19.3)#4,528 |
| 33. | 97423 | 37.2% | 14.6%(+22.6)#33 | 18.1%(+19.1)#4,559 |
| 34. | 97380 | 37.1% | 14.6%(+22.5)#34 | 18.1%(+19.0)#4,572 |
| 35. | 97523 | 37.1% | 14.6%(+22.5)#35 | 18.1%(+19.0)#4,574 |
| 36. | 97479 | 36.8% | 14.6%(+22.2)#36 | 18.1%(+18.7)#4,641 |
| 37. | 97465 | 36.7% | 14.6%(+22.2)#37 | 18.1%(+18.7)#4,651 |
| 38. | 97906 | 35.3% | 14.6%(+20.7)#38 | 18.1%(+17.2)#5,008 |
| 39. | 97456 | 34.9% | 14.6%(+20.3)#39 | 18.1%(+16.8)#5,092 |
| 40. | 97462 | 34.8% | 14.6%(+20.2)#40 | 18.1%(+16.7)#5,113 |
| 41. | 97024 | 34.0% | 14.6%(+19.4)#41 | 18.1%(+15.9)#5,310 |
| 42. | 97301 | 33.7% | 14.6%(+19.1)#42 | 18.1%(+15.6)#5,378 |
| 43. | 97458 | 33.5% | 14.6%(+18.9)#43 | 18.1%(+15.4)#5,415 |
| 44. | 97014 | 33.3% | 14.6%(+18.8)#44 | 18.1%(+15.3)#5,462 |
| 45. | 97065 | 33.3% | 14.6%(+18.8)#45 | 18.1%(+15.3)#5,487 |
| 46. | 97503 | 32.7% | 14.6%(+18.2)#46 | 18.1%(+14.7)#5,655 |
| 47. | 97446 | 32.6% | 14.6%(+18.1)#47 | 18.1%(+14.6)#5,691 |
| 48. | 97417 | 31.9% | 14.6%(+17.4)#48 | 18.1%(+13.9)#5,851 |
| 49. | 97463 | 31.8% | 14.6%(+17.2)#49 | 18.1%(+13.8)#5,876 |
| 50. | 97112 | 31.3% | 14.6%(+16.7)#50 | 18.1%(+13.3)#5,996 |
| 51. | 97825 | 30.8% | 14.6%(+16.2)#51 | 18.1%(+12.7)#6,156 |
| 52. | 97361 | 30.3% | 14.6%(+15.8)#52 | 18.1%(+12.3)#6,256 |
| 53. | 97601 | 30.2% | 14.6%(+15.6)#53 | 18.1%(+12.1)#6,292 |
| 54. | 97015 | 30.0% | 14.6%(+15.4)#54 | 18.1%(+11.9)#6,369 |
| 55. | 97203 | 29.8% | 14.6%(+15.2)#55 | 18.1%(+11.7)#6,427 |
| 56. | 97367 | 29.4% | 14.6%(+14.8)#56 | 18.1%(+11.3)#6,523 |
| 57. | 97041 | 29.3% | 14.6%(+14.7)#57 | 18.1%(+11.2)#6,570 |
| 58. | 97914 | 28.7% | 14.6%(+14.1)#58 | 18.1%(+10.6)#6,753 |
| 59. | 97870 | 28.6% | 14.6%(+14.0)#59 | 18.1%(+10.5)#6,794 |
| 60. | 97761 | 28.5% | 14.6%(+13.9)#60 | 18.1%(+10.4)#6,819 |
| 61. | 97360 | 28.5% | 14.6%(+13.9)#61 | 18.1%(+10.4)#6,836 |
| 62. | 97233 | 28.4% | 14.6%(+13.8)#62 | 18.1%(+10.3)#6,854 |
| 63. | 97443 | 27.7% | 14.6%(+13.1)#63 | 18.1%(+9.62)#7,063 |
| 64. | 97030 | 27.4% | 14.6%(+12.9)#64 | 18.1%(+9.38)#7,149 |
| 65. | 97071 | 27.4% | 14.6%(+12.8)#65 | 18.1%(+9.30)#7,180 |
| 66. | 97111 | 27.3% | 14.6%(+12.7)#66 | 18.1%(+9.26)#7,202 |
| 67. | 97236 | 27.3% | 14.6%(+12.7)#67 | 18.1%(+9.24)#7,205 |
| 68. | 97374 | 27.2% | 14.6%(+12.6)#68 | 18.1%(+9.10)#7,259 |
| 69. | 97067 | 27.1% | 14.6%(+12.6)#69 | 18.1%(+9.08)#7,261 |
| 70. | 97630 | 26.4% | 14.6%(+11.9)#70 | 18.1%(+8.36)#7,506 |
| 71. | 97526 | 26.3% | 14.6%(+11.7)#71 | 18.1%(+8.26)#7,534 |
| 72. | 97525 | 26.3% | 14.6%(+11.7)#72 | 18.1%(+8.21)#7,555 |
| 73. | 97444 | 26.2% | 14.6%(+11.6)#73 | 18.1%(+8.09)#7,597 |
| 74. | 97527 | 26.0% | 14.6%(+11.4)#74 | 18.1%(+7.91)#7,648 |
| 75. | 97543 | 25.6% | 14.6%(+11.0)#75 | 18.1%(+7.52)#7,784 |
| 76. | 97603 | 25.6% | 14.6%(+11.0)#76 | 18.1%(+7.50)#7,793 |
| 77. | 97701 | 24.4% | 14.6%(+9.86)#77 | 18.1%(+6.37)#8,199 |
| 78. | 97135 | 24.0% | 14.6%(+9.43)#78 | 18.1%(+5.94)#8,349 |
| 79. | 97424 | 23.8% | 14.6%(+9.26)#79 | 18.1%(+5.77)#8,419 |
| 80. | 97844 | 23.4% | 14.6%(+8.82)#80 | 18.1%(+5.32)#8,615 |
| 81. | 97402 | 23.2% | 14.6%(+8.67)#81 | 18.1%(+5.18)#8,667 |
| 82. | 97439 | 23.1% | 14.6%(+8.55)#82 | 18.1%(+5.06)#8,722 |
| 83. | 97138 | 22.7% | 14.6%(+8.10)#83 | 18.1%(+4.61)#8,891 |
| 84. | 97874 | 22.5% | 14.6%(+7.93)#84 | 18.1%(+4.44)#8,963 |
| 85. | 97128 | 22.1% | 14.6%(+7.50)#85 | 18.1%(+4.00)#9,168 |
| 86. | 97918 | 21.8% | 14.6%(+7.20)#86 | 18.1%(+3.71)#9,276 |
| 87. | 97008 | 21.7% | 14.6%(+7.12)#87 | 18.1%(+3.63)#9,317 |
| 88. | 97850 | 21.7% | 14.6%(+7.08)#88 | 18.1%(+3.59)#9,334 |
| 89. | 97322 | 21.4% | 14.6%(+6.85)#89 | 18.1%(+3.36)#9,432 |
| 90. | 97760 | 21.4% | 14.6%(+6.78)#90 | 18.1%(+3.29)#9,454 |
| 91. | 97218 | 21.3% | 14.6%(+6.75)#91 | 18.1%(+3.26)#9,477 |
| 92. | 97005 | 21.2% | 14.6%(+6.67)#92 | 18.1%(+3.18)#9,512 |
| 93. | 97720 | 21.1% | 14.6%(+6.56)#93 | 18.1%(+3.06)#9,545 |
| 94. | 97330 | 21.1% | 14.6%(+6.49)#94 | 18.1%(+3.00)#9,562 |
| 95. | 97338 | 21.1% | 14.6%(+6.49)#95 | 18.1%(+2.99)#9,563 |
| 96. | 97386 | 20.8% | 14.6%(+6.20)#96 | 18.1%(+2.71)#9,697 |
| 97. | 97754 | 20.7% | 14.6%(+6.16)#97 | 18.1%(+2.67)#9,712 |
| 98. | 97023 | 20.6% | 14.6%(+6.03)#98 | 18.1%(+2.54)#9,761 |
| 99. | 97302 | 20.6% | 14.6%(+6.02)#99 | 18.1%(+2.53)#9,764 |
| 100. | 97827 | 20.4% | 14.6%(+5.78)#100 | 18.1%(+2.29)#9,864 |
Common Questions
What are the Top 10 Zip Codes with the Highest Poverty Level Among Children Under the Age of 5 in Oregon?
Top 10 Zip Codes with the Highest Poverty Level Among Children Under the Age of 5 in Oregon are:
What zip code has the Highest Poverty Level Among Children Under the Age of 5 in Oregon?
97845 has the Highest Poverty Level Among Children Under the Age of 5 in Oregon with 100.0%.
What is the Poverty Level Among Children Under the Age of 5 in the State of Oregon?
Poverty Level Among Children Under the Age of 5 in Oregon is 14.6%.
What is the Poverty Level Among Children Under the Age of 5 in the United States?
Poverty Level Among Children Under the Age of 5 in the United States is 18.1%.