Zip Codes with the Highest Percentage of Population with a Degree in Social Sciences in Charlotte, NC

RELATED REPORTS & OPTIONS

Social Sciences
Population
Families and Households
Female Fertility
Female Fertility (Unmarried)
Race (Community Size)
Race (Percentage)
Ancestry (Community Size)
AfghanAfricanAlbanianAlsatianAmericanApacheArabArgentineanArmenianAustralianAustrianBahamianBangladeshiBarbadianBelgianBelizeanBhutaneseBlackfeetBolivianBrazilianBritishBritish West IndianBulgarianBurmeseCajunCambodianCanadianCape VerdeanCelticCentral AmericanCentral American IndianCherokeeChickasawChileanChippewaChoctawColombianCosta RicanCreekCroatianCubanCzechCzechoslovakianDanishDominicanDutchEastern EuropeanEcuadorianEgyptianEnglishEthiopianEuropeanFilipinoFinnishFrenchFrench American IndianFrench CanadianGermanGhanaianGreekGuamanian / ChamorroGuatemalanGuyaneseHaitianHonduranHoumaHungarianIcelanderIndian (Asian)IndonesianIranianIraqiIrishIroquoisIsraeliItalianJamaicanJapaneseJordanianKenyanKiowaKoreanLaotianLatvianLebaneseLiberianLithuanianLumbeeMacedonianMalaysianMalteseMexicanMexican American IndianMoroccanNative HawaiianNavajoNew ZealanderNicaraguanNigerianNorthern EuropeanNorwegianOsagePakistaniPalestinianPanamanianParaguayanPennsylvania GermanPeruvianPolishPortuguesePuerto RicanRomanianRussianSalvadoranSamoanScandinavianScotch-IrishScottishSeminoleSenegaleseSerbianSierra LeoneanSiouxSlavicSlovakSloveneSomaliSouth AfricanSouth AmericanSouth American IndianSpaniardSpanishSri LankanSubsaharan AfricanSudaneseSwedishSwissSyrianTaiwaneseThaiTonganTrinidadian and TobagonianTurkishU.S. Virgin IslanderUkrainianUruguayanVenezuelanVietnameseWelshWest IndianYugoslavianZimbabwean
Ancestry (Percentage)
AfghanAfricanAlbanianAlsatianAmericanApacheArabArgentineanArmenianAustralianAustrianBahamianBangladeshiBarbadianBelgianBelizeanBhutaneseBlackfeetBolivianBrazilianBritishBritish West IndianBulgarianBurmeseCajunCambodianCanadianCape VerdeanCelticCentral AmericanCentral American IndianCherokeeChickasawChileanChippewaChoctawColombianCosta RicanCreekCroatianCubanCzechCzechoslovakianDanishDominicanDutchEastern EuropeanEcuadorianEgyptianEnglishEthiopianEuropeanFilipinoFinnishFrenchFrench American IndianFrench CanadianGermanGhanaianGreekGuamanian / ChamorroGuatemalanGuyaneseHaitianHonduranHoumaHungarianIcelanderIndian (Asian)IndonesianIranianIraqiIrishIroquoisIsraeliItalianJamaicanJapaneseJordanianKenyanKiowaKoreanLaotianLatvianLebaneseLiberianLithuanianLumbeeMacedonianMalaysianMalteseMexicanMexican American IndianMoroccanNative HawaiianNavajoNew ZealanderNicaraguanNigerianNorthern EuropeanNorwegianOsagePakistaniPalestinianPanamanianParaguayanPennsylvania GermanPeruvianPolishPortuguesePuerto RicanRomanianRussianSalvadoranSamoanScandinavianScotch-IrishScottishSeminoleSenegaleseSerbianSierra LeoneanSiouxSlavicSlovakSloveneSomaliSouth AfricanSouth AmericanSouth American IndianSpaniardSpanishSri LankanSubsaharan AfricanSudaneseSwedishSwissSyrianTaiwaneseThaiTonganTrinidadian and TobagonianTurkishU.S. Virgin IslanderUkrainianUruguayanVenezuelanVietnameseWelshWest IndianYugoslavianZimbabwean
Immigrant Origin (Total)
AfghanistanAfricaAlbaniaArgentinaAsiaAustraliaAustriaBahamasBangladeshBarbadosBelarusBelgiumBelizeBoliviaBosnia and HerzegovinaBrazilBulgariaBurma / MyanmarCabo VerdeCambodiaCameroonCanadaCaribbeanCentral AmericaChileChinaColombiaCongoCosta RicaCroatiaCubaCzechoslovakiaDenmarkDominican RepublicEastern AfricaEastern AsiaEastern EuropeEcuadorEgyptEl SalvadorEnglandEritreaEthiopiaEuropeFranceGermanyGhanaGreeceGrenadaGuatemalaGuyanaHaitiHondurasHong KongHungaryIndiaIndonesiaIranIraqIrelandIsraelItalyJamaicaJapanJordanKazakhstanKenyaKoreaKuwaitLaosLatin AmericaLatviaLebanonLiberiaLithuaniaMalaysiaMexicoMiddle AfricaMoldovaMoroccoNepalNetherlandsNicaraguaNigeriaNorthern AfricaNorthern EuropeNorwayOceaniaPakistanPanamaPeruPhilippinesPolandPortugalRomaniaRussiaSaudi ArabiaScotlandSenegalSerbiaSierra LeoneSingaporeSomaliaSouth AfricaSouth AmericaSouth Central AsiaSouth Eastern AsiaSouthern EuropeSpainSri LankaSudanSwedenSwitzerlandSyriaTaiwanThailandTrinidad and TobagoTurkeyUkraineUruguayUzbekistanVenezuelaVietnamWest IndiesWestern AfricaWestern AsiaWestern EuropeZaireZimbabwe
Immigrant Origin (Percentage)
AfghanistanAfricaAlbaniaArgentinaAsiaAustraliaAustriaBahamasBangladeshBarbadosBelarusBelgiumBelizeBoliviaBosnia and HerzegovinaBrazilBulgariaBurma / MyanmarCabo VerdeCambodiaCameroonCanadaCaribbeanCentral AmericaChileChinaColombiaCongoCosta RicaCroatiaCubaCzechoslovakiaDenmarkDominican RepublicEastern AfricaEastern AsiaEastern EuropeEcuadorEgyptEl SalvadorEnglandEritreaEthiopiaEuropeFranceGermanyGhanaGreeceGrenadaGuatemalaGuyanaHaitiHondurasHong KongHungaryIndiaIndonesiaIranIraqIrelandIsraelItalyJamaicaJapanJordanKazakhstanKenyaKoreaKuwaitLaosLatin AmericaLatviaLebanonLiberiaLithuaniaMalaysiaMexicoMiddle AfricaMoldovaMoroccoNepalNetherlandsNicaraguaNigeriaNorthern AfricaNorthern EuropeNorwayOceaniaPakistanPanamaPeruPhilippinesPolandPortugalRomaniaRussiaSaudi ArabiaScotlandSenegalSerbiaSierra LeoneSingaporeSomaliaSouth AfricaSouth AmericaSouth Central AsiaSouth Eastern AsiaSouthern EuropeSpainSri LankaSudanSwedenSwitzerlandSyriaTaiwanThailandTrinidad and TobagoTurkeyUkraineUruguayUzbekistanVenezuelaVietnamWest IndiesWestern AfricaWestern AsiaWestern EuropeZaireZimbabwe
Income
Income (Families)
Income (Households)
Poverty
Poverty (Families)
Unemployment
Employment Occupations
Employment Industries
Employer Class
Commute Time
Commute Means
School Enrollment
Education by Degree Field
Occupancy
Finances
Physical Characteristics
Charlotte
Compare Zip Codes
Comparison Subject

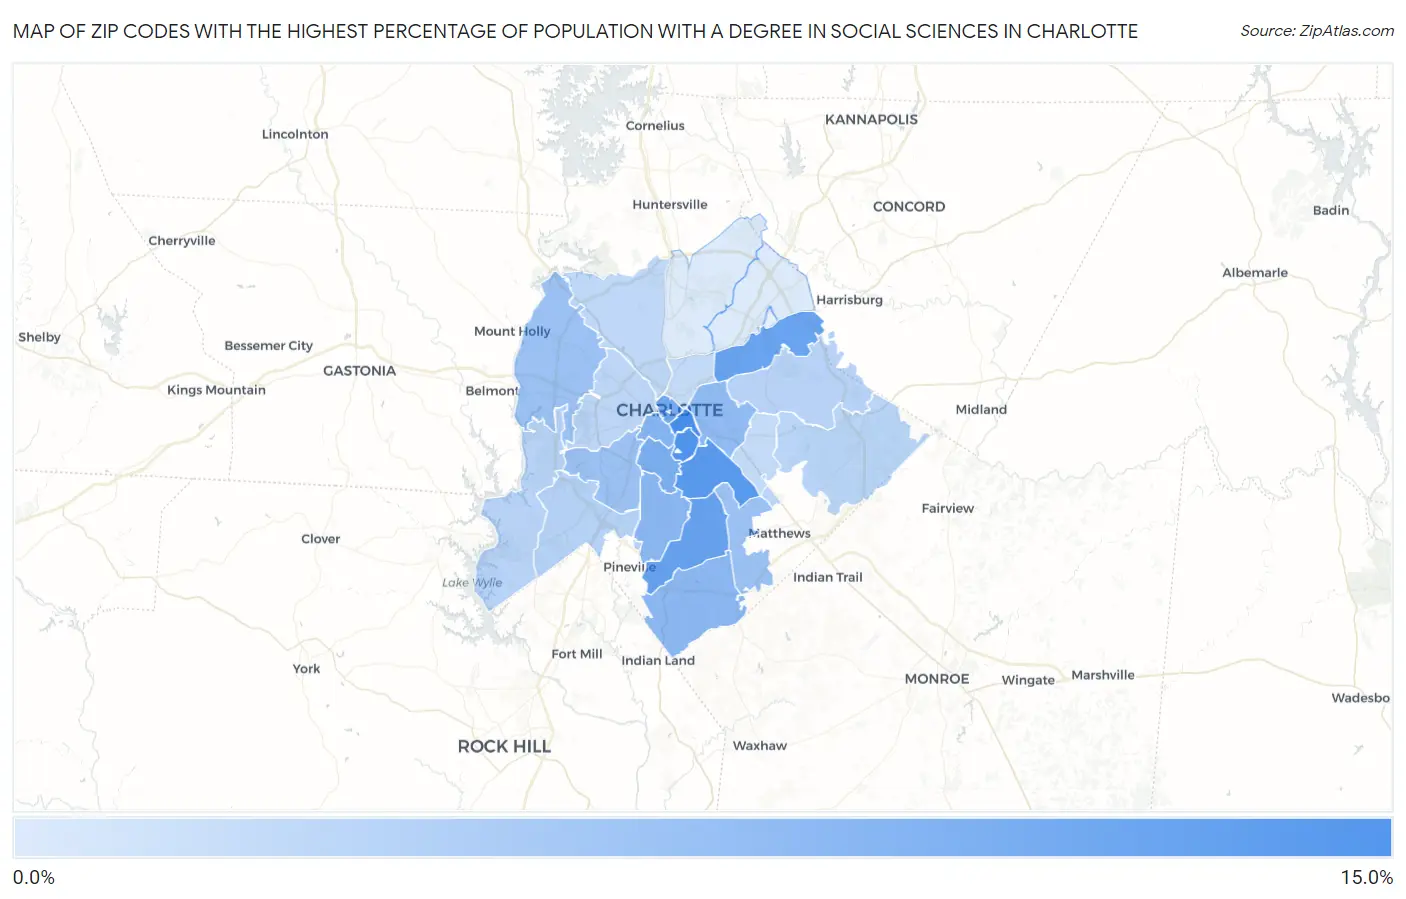
Map of Zip Codes with the Highest Percentage of Population with a Degree in Social Sciences in Charlotte

0.0%
15.0%
Zip Codes with the Highest Percentage of Population with a Degree in Social Sciences in Charlotte Map

Zip Codes with the Highest Percentage of Population with a Degree in Social Sciences in Charlotte, NC

Zip Code % Graduates vs State vs National
1.2820414.2%7.6%(+6.64)#448.1%(+6.11)#2,272
2.2820713.4%7.6%(+5.88)#568.1%(+5.36)#2,625
3.2821113.2%7.6%(+5.64)#598.1%(+5.11)#2,735
4.2822612.1%7.6%(+4.59)#788.1%(+4.07)#3,400
5.2821311.9%7.6%(+4.39)#858.1%(+3.87)#3,540
6.2820211.3%7.6%(+3.76)#1018.1%(+3.24)#4,076
7.2820910.7%7.6%(+3.17)#1188.1%(+2.65)#4,661
8.2820310.2%7.6%(+2.67)#1348.1%(+2.15)#5,277
9.282109.9%7.6%(+2.35)#1418.1%(+1.83)#5,684
10.282779.8%7.6%(+2.24)#1488.1%(+1.72)#5,831
11.282059.6%7.6%(+2.01)#1618.1%(+1.49)#6,130
12.282148.9%7.6%(+1.32)#1928.1%(+0.795)#7,175
13.282708.8%7.6%(+1.25)#1958.1%(+0.730)#7,270
14.282178.8%7.6%(+1.23)#1988.1%(+0.708)#7,307
15.282737.3%7.6%(-0.279)#2948.1%(-0.799)#10,280
16.282157.0%7.6%(-0.509)#3188.1%(-1.03)#10,818
17.282787.0%7.6%(-0.515)#3198.1%(-1.04)#10,834
18.282276.9%7.6%(-0.673)#3358.1%(-1.19)#11,221
19.282086.8%7.6%(-0.702)#3368.1%(-1.22)#11,281
20.282166.6%7.6%(-0.910)#3528.1%(-1.43)#11,757
21.282126.4%7.6%(-1.19)#3748.1%(-1.71)#12,479
22.282066.4%7.6%(-1.19)#3758.1%(-1.71)#12,492
23.282694.9%7.6%(-2.68)#4928.1%(-3.20)#16,140
24.282624.9%7.6%(-2.69)#4938.1%(-3.21)#16,145

Common Questions

What are the Top 10 Zip Codes with the Highest Percentage of Population with a Degree in Social Sciences in Charlotte, NC?
Top 10 Zip Codes with the Highest Percentage of Population with a Degree in Social Sciences in Charlotte, NC are:
#1
14.2%
#2
13.4%
#3
13.2%
#4
12.1%
#5
11.9%
#6
11.3%
#7
10.7%
#8
10.2%
#9
9.9%
#10
9.8%
What zip code has the Highest Percentage of Population with a Degree in Social Sciences in Charlotte, NC?
28204 has the Highest Percentage of Population with a Degree in Social Sciences in Charlotte, NC with 14.2%.
What is the Percentage of Population with a Degree in Social Sciences in Charlotte, NC?
Percentage of Population with a Degree in Social Sciences in Charlotte is 9.1%.
What is the Percentage of Population with a Degree in Social Sciences in North Carolina?
Percentage of Population with a Degree in Social Sciences in North Carolina is 7.6%.
What is the Percentage of Population with a Degree in Social Sciences in the United States?
Percentage of Population with a Degree in Social Sciences in the United States is 8.1%.