Zip Codes with the Highest Percentage of Population Employed in Architecture & Engineering in Gulfport, MS
RELATED REPORTS & OPTIONS
Architecture & Engineering
Gulfport
Compare Zip Codes
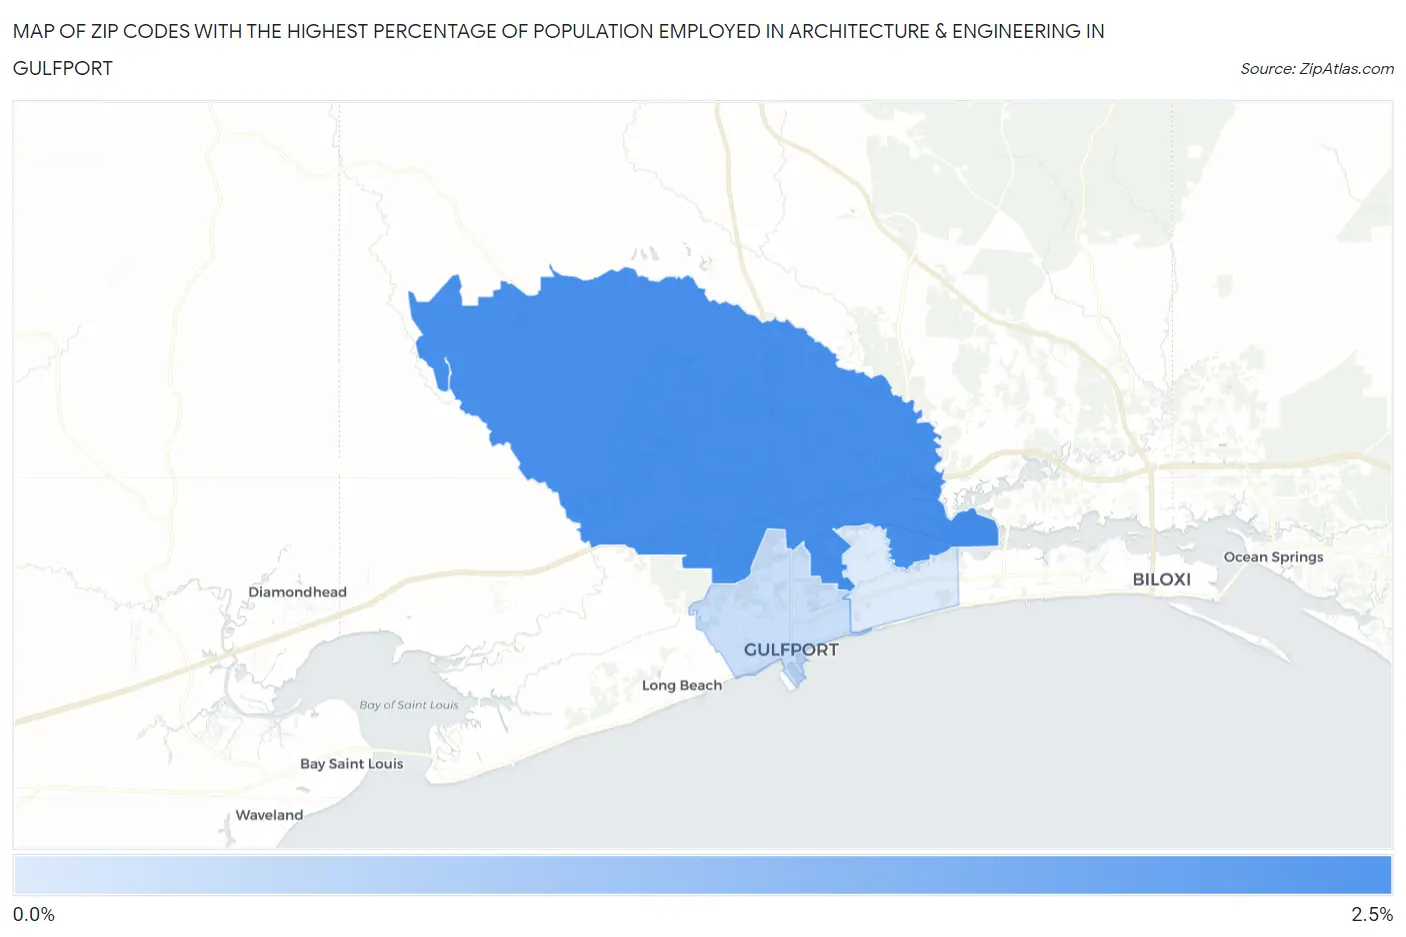
Map of Zip Codes with the Highest Percentage of Population Employed in Architecture & Engineering in Gulfport
0.075%
2.1%
Zip Codes with the Highest Percentage of Population Employed in Architecture & Engineering in Gulfport, MS
| Zip Code | % Employed | vs State | vs National | |
| 1. | 39503 | 2.1% | 1.5%(+0.627)#67 | 2.1%(-0.035)#8,956 |
| 2. | 39501 | 0.35% | 1.5%(-1.14)#219 | 2.1%(-1.80)#21,304 |
| 3. | 39507 | 0.075% | 1.5%(-1.41)#237 | 2.1%(-2.07)#22,422 |
1
Common Questions
What are the Top Zip Codes with the Highest Percentage of Population Employed in Architecture & Engineering in Gulfport, MS?
Top Zip Codes with the Highest Percentage of Population Employed in Architecture & Engineering in Gulfport, MS are:
What zip code has the Highest Percentage of Population Employed in Architecture & Engineering in Gulfport, MS?
39503 has the Highest Percentage of Population Employed in Architecture & Engineering in Gulfport, MS with 2.1%.
What is the Percentage of Population Employed in Architecture & Engineering in Gulfport, MS?
Percentage of Population Employed in Architecture & Engineering in Gulfport is 1.3%.
What is the Percentage of Population Employed in Architecture & Engineering in Mississippi?
Percentage of Population Employed in Architecture & Engineering in Mississippi is 1.5%.
What is the Percentage of Population Employed in Architecture & Engineering in the United States?
Percentage of Population Employed in Architecture & Engineering in the United States is 2.1%.