Zip Codes with the Highest Percentage of Population Employed in Architecture & Engineering in Southaven, MS
RELATED REPORTS & OPTIONS
Architecture & Engineering
Southaven
Compare Zip Codes
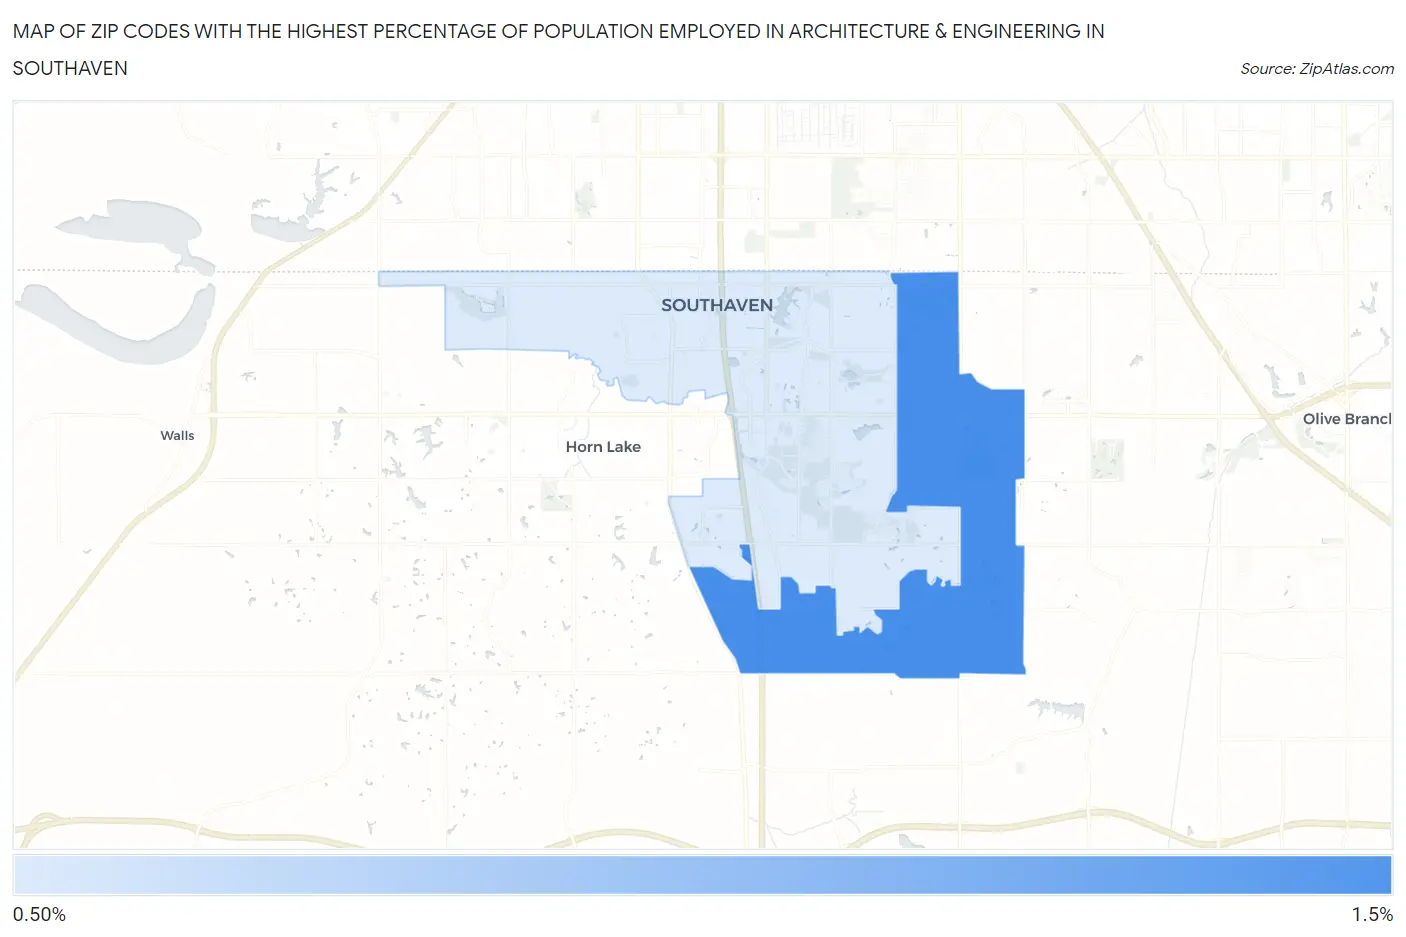
Map of Zip Codes with the Highest Percentage of Population Employed in Architecture & Engineering in Southaven
0.86%
1.4%
Zip Codes with the Highest Percentage of Population Employed in Architecture & Engineering in Southaven, MS
| Zip Code | % Employed | vs State | vs National | |
| 1. | 38672 | 1.4% | 1.5%(-0.068)#121 | 2.1%(-0.729)#13,443 |
| 2. | 38671 | 0.86% | 1.5%(-0.625)#162 | 2.1%(-1.29)#17,661 |
1
Common Questions
What are the Top Zip Codes with the Highest Percentage of Population Employed in Architecture & Engineering in Southaven, MS?
Top Zip Codes with the Highest Percentage of Population Employed in Architecture & Engineering in Southaven, MS are:
What zip code has the Highest Percentage of Population Employed in Architecture & Engineering in Southaven, MS?
38672 has the Highest Percentage of Population Employed in Architecture & Engineering in Southaven, MS with 1.4%.
What is the Percentage of Population Employed in Architecture & Engineering in Southaven, MS?
Percentage of Population Employed in Architecture & Engineering in Southaven is 1.2%.
What is the Percentage of Population Employed in Architecture & Engineering in Mississippi?
Percentage of Population Employed in Architecture & Engineering in Mississippi is 1.5%.
What is the Percentage of Population Employed in Architecture & Engineering in the United States?
Percentage of Population Employed in Architecture & Engineering in the United States is 2.1%.