Richland, MS Map & Demographics
Richland Map
Richland Overview
$28,672
PER CAPITA INCOME
$65,279
AVG FAMILY INCOME
$54,753
AVG HOUSEHOLD INCOME
35.6%
WAGE / INCOME GAP [ % ]
64.4¢/ $1
WAGE / INCOME GAP [ $ ]
0.49
INEQUALITY / GINI INDEX
7,208
TOTAL POPULATION
3,769
MALE POPULATION
3,439
FEMALE POPULATION
109.60
MALES / 100 FEMALES
91.24
FEMALES / 100 MALES
37.1
MEDIAN AGE
2.9
AVG FAMILY SIZE
2.4
AVG HOUSEHOLD SIZE
3,656
LABOR FORCE [ PEOPLE ]
61.7%
PERCENT IN LABOR FORCE
4.2%
UNEMPLOYMENT RATE
Richland Zip Codes
Richland Area Codes
Income in Richland
Income Overview in Richland
Per Capita Income in Richland is $28,672, while median incomes of families and households are $65,279 and $54,753 respectively.
| Characteristic | Number | Measure |
| Per Capita Income | 7,208 | $28,672 |
| Median Family Income | 1,939 | $65,279 |
| Mean Family Income | 1,939 | $87,172 |
| Median Household Income | 3,004 | $54,753 |
| Mean Household Income | 3,004 | $70,354 |
| Income Deficit | 1,939 | $0 |
| Wage / Income Gap (%) | 7,208 | 35.57% |
| Wage / Income Gap ($) | 7,208 | 64.43¢ per $1 |
| Gini / Inequality Index | 7,208 | 0.49 |
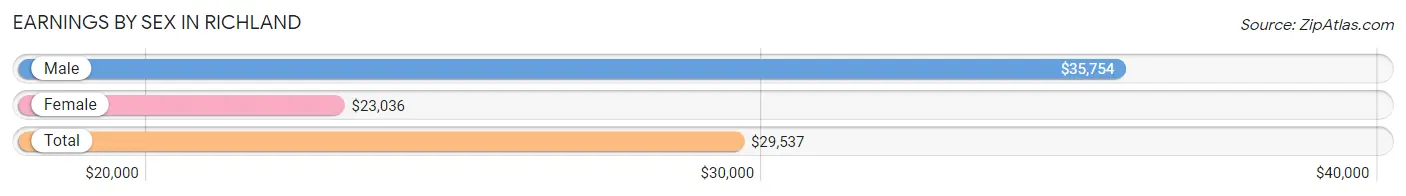
Earnings by Sex in Richland
Average Earnings in Richland are $29,537, $35,754 for men and $23,036 for women, a difference of 35.6%.
| Sex | Number | Average Earnings |
| Male | 1,969 (52.8%) | $35,754 |
| Female | 1,759 (47.2%) | $23,036 |
| Total | 3,728 (100.0%) | $29,537 |
Earnings by Sex by Income Bracket in Richland
The most common earnings brackets in Richland are $50,000 to $54,999 for men (239 | 12.1%) and $10,000 to $12,499 for women (241 | 13.7%).
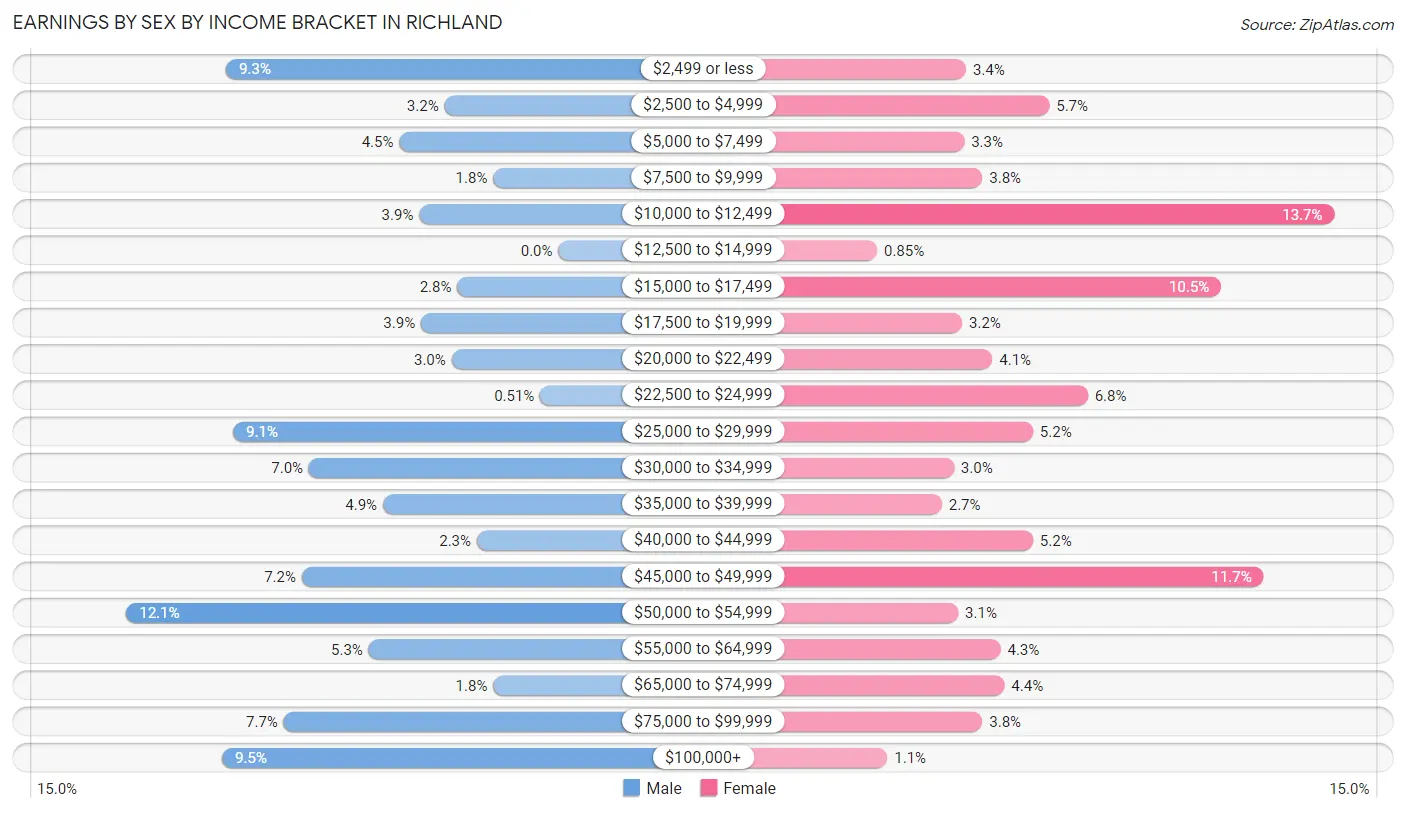
| Income | Male | Female |
| $2,499 or less | 184 (9.3%) | 59 (3.4%) |
| $2,500 to $4,999 | 63 (3.2%) | 100 (5.7%) |
| $5,000 to $7,499 | 88 (4.5%) | 58 (3.3%) |
| $7,500 to $9,999 | 36 (1.8%) | 67 (3.8%) |
| $10,000 to $12,499 | 77 (3.9%) | 241 (13.7%) |
| $12,500 to $14,999 | 0 (0.0%) | 15 (0.9%) |
| $15,000 to $17,499 | 56 (2.8%) | 185 (10.5%) |
| $17,500 to $19,999 | 76 (3.9%) | 57 (3.2%) |
| $20,000 to $22,499 | 59 (3.0%) | 72 (4.1%) |
| $22,500 to $24,999 | 10 (0.5%) | 119 (6.8%) |
| $25,000 to $29,999 | 180 (9.1%) | 92 (5.2%) |
| $30,000 to $34,999 | 138 (7.0%) | 53 (3.0%) |
| $35,000 to $39,999 | 97 (4.9%) | 47 (2.7%) |
| $40,000 to $44,999 | 45 (2.3%) | 92 (5.2%) |
| $45,000 to $49,999 | 142 (7.2%) | 206 (11.7%) |
| $50,000 to $54,999 | 239 (12.1%) | 55 (3.1%) |
| $55,000 to $64,999 | 105 (5.3%) | 76 (4.3%) |
| $65,000 to $74,999 | 36 (1.8%) | 78 (4.4%) |
| $75,000 to $99,999 | 152 (7.7%) | 67 (3.8%) |
| $100,000+ | 186 (9.5%) | 20 (1.1%) |
| Total | 1,969 (100.0%) | 1,759 (100.0%) |
Earnings by Sex by Educational Attainment in Richland
Average earnings in Richland are $45,544 for men and $26,215 for women, a difference of 42.4%. Men with an educational attainment of college or associate's degree enjoy the highest average annual earnings of $51,234, while those with less than high school education earn the least with $29,276. Women with an educational attainment of graduate degree earn the most with the average annual earnings of $46,711, while those with high school diploma education have the smallest earnings of $11,762.
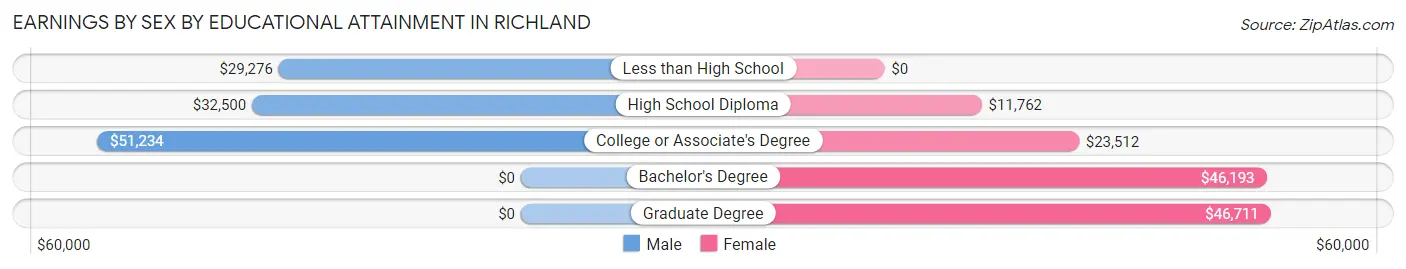
| Educational Attainment | Male Income | Female Income |
| Less than High School | $29,276 | $0 |
| High School Diploma | $32,500 | $11,762 |
| College or Associate's Degree | $51,234 | $23,512 |
| Bachelor's Degree | - | - |
| Graduate Degree | - | - |
| Total | $45,544 | $26,215 |
Family Income in Richland
Family Income Brackets in Richland
According to the Richland family income data, there are 481 families falling into the $50,000 to $74,999 income range, which is the most common income bracket and makes up 24.8% of all families. Conversely, the less than $10,000 income bracket is the least frequent group with only 6 families (0.3%) belonging to this category.
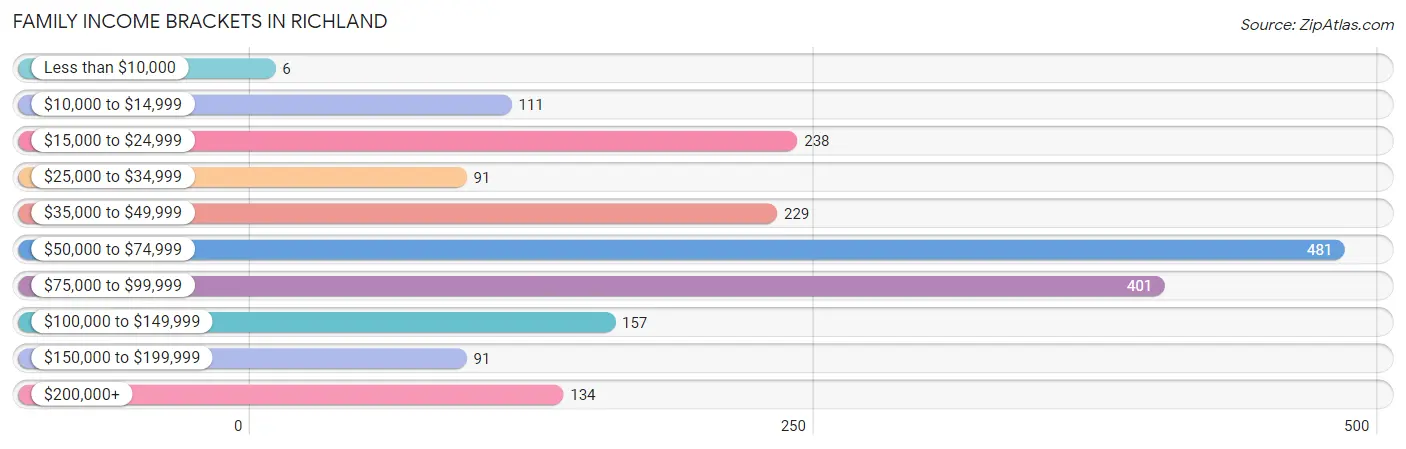
| Income Bracket | # Families | % Families |
| Less than $10,000 | 6 | 0.3% |
| $10,000 to $14,999 | 111 | 5.7% |
| $15,000 to $24,999 | 238 | 12.3% |
| $25,000 to $34,999 | 91 | 4.7% |
| $35,000 to $49,999 | 229 | 11.8% |
| $50,000 to $74,999 | 481 | 24.8% |
| $75,000 to $99,999 | 401 | 20.7% |
| $100,000 to $149,999 | 157 | 8.1% |
| $150,000 to $199,999 | 91 | 4.7% |
| $200,000+ | 134 | 6.9% |
Family Income by Famaliy Size in Richland
5-person families (144 | 7.4%) account for the highest median family income in Richland with $82,602 per family, while 2-person families (847 | 43.7%) have the highest median income of $30,449 per family member.
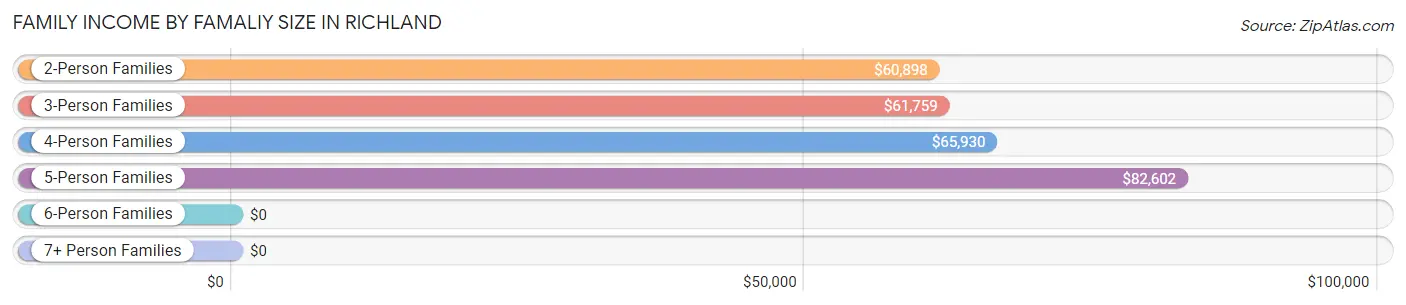
| Income Bracket | # Families | Median Income |
| 2-Person Families | 847 (43.7%) | $60,898 |
| 3-Person Families | 542 (28.0%) | $61,759 |
| 4-Person Families | 358 (18.5%) | $65,930 |
| 5-Person Families | 144 (7.4%) | $82,602 |
| 6-Person Families | 39 (2.0%) | $0 |
| 7+ Person Families | 9 (0.5%) | $0 |
| Total | 1,939 (100.0%) | $65,279 |
Family Income by Number of Earners in Richland
The median family income in Richland is $65,279, with families comprising 3+ earners (215) having the highest median family income of $91,641, while families with no earners (312) have the lowest median family income of $21,913, accounting for 11.1% and 16.1% of families, respectively.
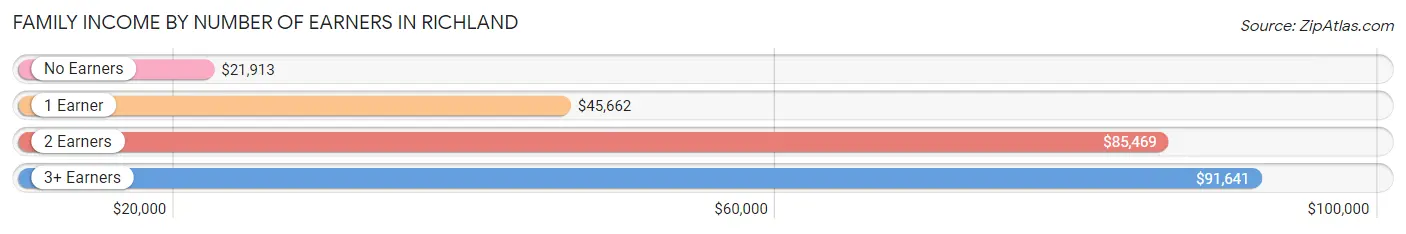
| Number of Earners | # Families | Median Income |
| No Earners | 312 (16.1%) | $21,913 |
| 1 Earner | 654 (33.7%) | $45,662 |
| 2 Earners | 758 (39.1%) | $85,469 |
| 3+ Earners | 215 (11.1%) | $91,641 |
| Total | 1,939 (100.0%) | $65,279 |
Household Income in Richland
Household Income Brackets in Richland
With 655 households falling in the category, the $50,000 to $74,999 income range is the most frequent in Richland, accounting for 21.8% of all households. In contrast, only 105 households (3.5%) fall into the $150,000 to $199,999 income bracket, making it the least populous group.
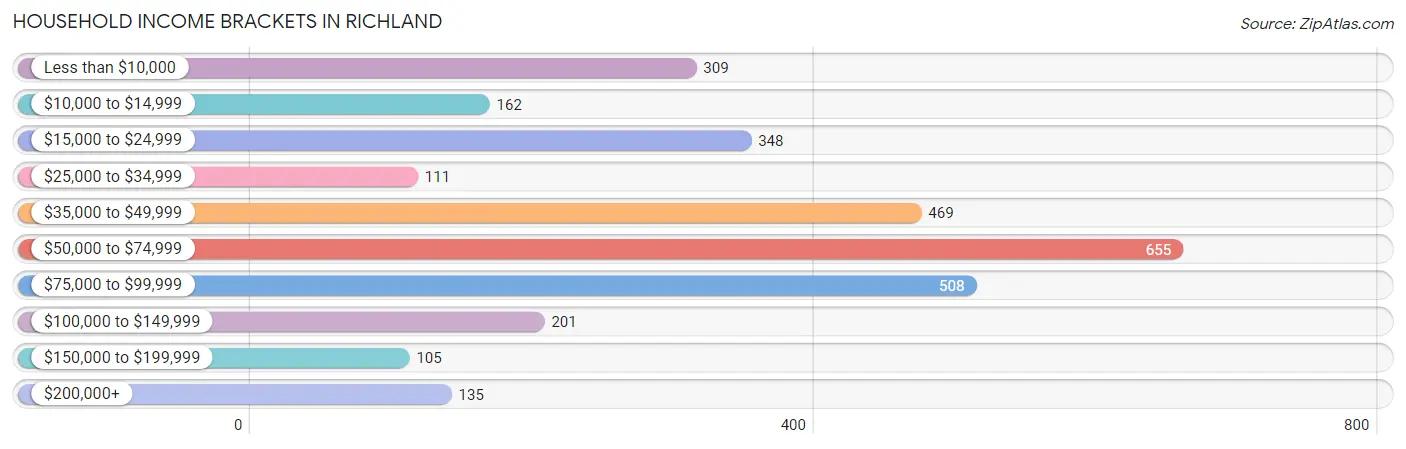
| Income Bracket | # Households | % Households |
| Less than $10,000 | 309 | 10.3% |
| $10,000 to $14,999 | 162 | 5.4% |
| $15,000 to $24,999 | 348 | 11.6% |
| $25,000 to $34,999 | 111 | 3.7% |
| $35,000 to $49,999 | 469 | 15.6% |
| $50,000 to $74,999 | 655 | 21.8% |
| $75,000 to $99,999 | 508 | 16.9% |
| $100,000 to $149,999 | 201 | 6.7% |
| $150,000 to $199,999 | 105 | 3.5% |
| $200,000+ | 135 | 4.5% |
Household Income by Householder Age in Richland
The median household income in Richland is $54,753, with the highest median household income of $83,724 found in the 15 to 24 years age bracket for the primary householder. A total of 124 households (4.1%) fall into this category. Meanwhile, the 65+ years age bracket for the primary householder has the lowest median household income of $53,088, with 722 households (24.0%) in this group.
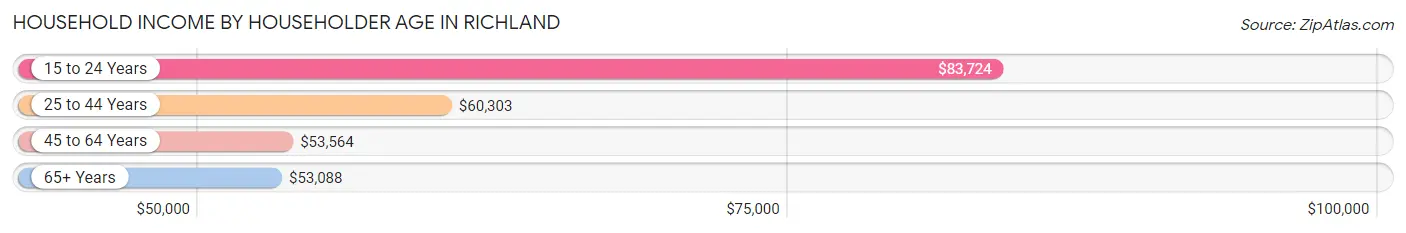
| Income Bracket | # Households | Median Income |
| 15 to 24 Years | 124 (4.1%) | $83,724 |
| 25 to 44 Years | 968 (32.2%) | $60,303 |
| 45 to 64 Years | 1,190 (39.6%) | $53,564 |
| 65+ Years | 722 (24.0%) | $53,088 |
| Total | 3,004 (100.0%) | $54,753 |
Poverty in Richland
Income Below Poverty by Sex and Age in Richland
With 19.3% poverty level for males and 16.3% for females among the residents of Richland, 18 to 24 year old males and under 5 year old females are the most vulnerable to poverty, with 126 males (42.3%) and 151 females (66.8%) in their respective age groups living below the poverty level.
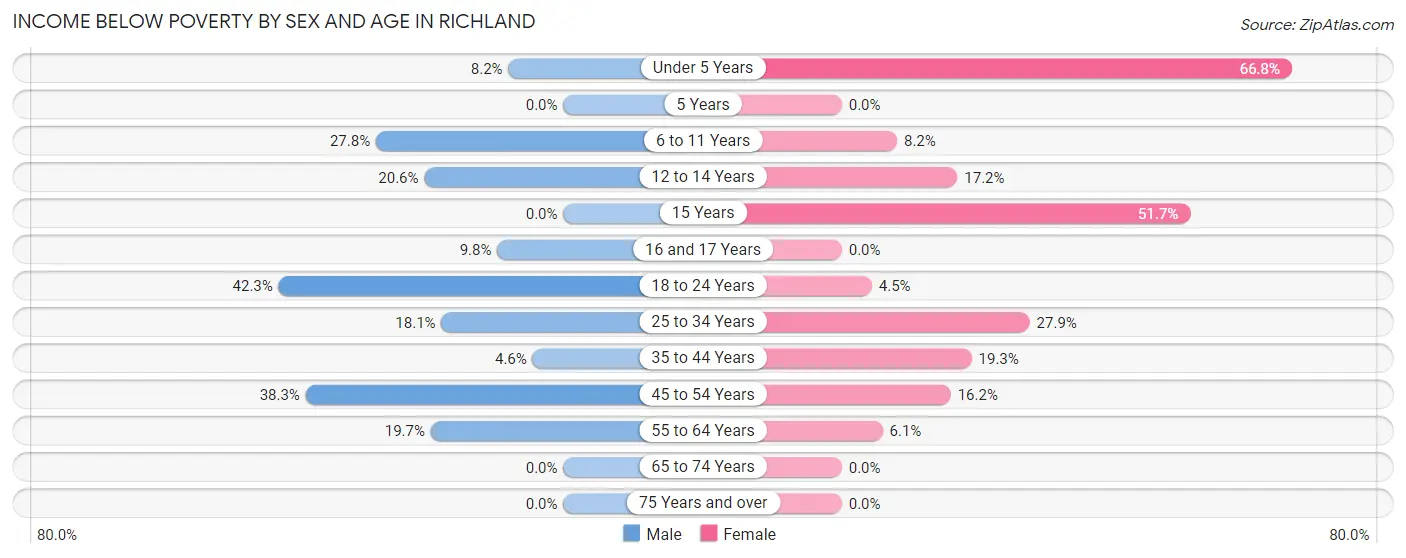
| Age Bracket | Male | Female |
| Under 5 Years | 12 (8.2%) | 151 (66.8%) |
| 5 Years | 0 (0.0%) | 0 (0.0%) |
| 6 to 11 Years | 79 (27.8%) | 10 (8.2%) |
| 12 to 14 Years | 45 (20.6%) | 23 (17.2%) |
| 15 Years | 0 (0.0%) | 15 (51.7%) |
| 16 and 17 Years | 21 (9.8%) | 0 (0.0%) |
| 18 to 24 Years | 126 (42.3%) | 15 (4.5%) |
| 25 to 34 Years | 111 (18.1%) | 154 (27.9%) |
| 35 to 44 Years | 14 (4.6%) | 91 (19.3%) |
| 45 to 54 Years | 259 (38.3%) | 72 (16.2%) |
| 55 to 64 Years | 61 (19.7%) | 22 (6.1%) |
| 65 to 74 Years | 0 (0.0%) | 0 (0.0%) |
| 75 Years and over | 0 (0.0%) | 0 (0.0%) |
| Total | 728 (19.3%) | 553 (16.3%) |
Income Above Poverty by Sex and Age in Richland
According to the poverty statistics in Richland, males aged 5 years and females aged 5 years are the age groups that are most secure financially, with 100.0% of males and 100.0% of females in these age groups living above the poverty line.
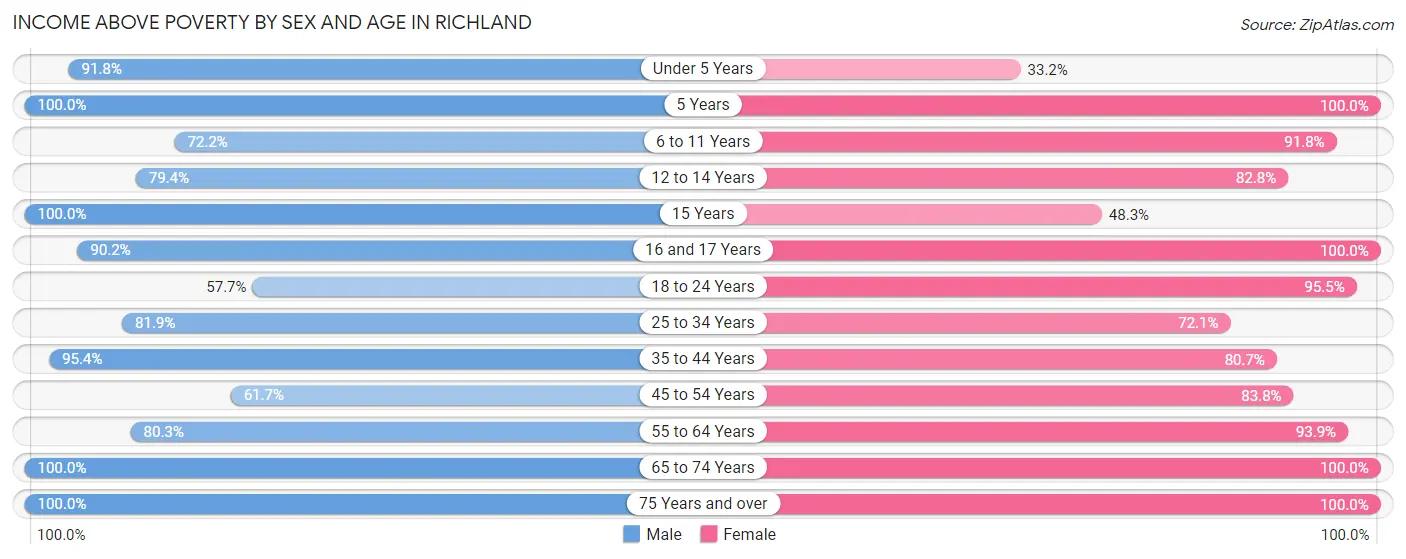
| Age Bracket | Male | Female |
| Under 5 Years | 135 (91.8%) | 75 (33.2%) |
| 5 Years | 11 (100.0%) | 29 (100.0%) |
| 6 to 11 Years | 205 (72.2%) | 112 (91.8%) |
| 12 to 14 Years | 173 (79.4%) | 111 (82.8%) |
| 15 Years | 38 (100.0%) | 14 (48.3%) |
| 16 and 17 Years | 193 (90.2%) | 170 (100.0%) |
| 18 to 24 Years | 172 (57.7%) | 321 (95.5%) |
| 25 to 34 Years | 502 (81.9%) | 398 (72.1%) |
| 35 to 44 Years | 293 (95.4%) | 381 (80.7%) |
| 45 to 54 Years | 418 (61.7%) | 373 (83.8%) |
| 55 to 64 Years | 249 (80.3%) | 341 (93.9%) |
| 65 to 74 Years | 364 (100.0%) | 415 (100.0%) |
| 75 Years and over | 288 (100.0%) | 102 (100.0%) |
| Total | 3,041 (80.7%) | 2,842 (83.7%) |
Income Below Poverty Among Married-Couple Families in Richland
The poverty statistics for married-couple families in Richland show that 7.7% or 104 of the total 1,354 families live below the poverty line. Families with 3 or 4 children have the highest poverty rate of 35.6%, comprising of 21 families. On the other hand, families with 5 or more children have the lowest poverty rate of 0.0%, which includes 0 families.
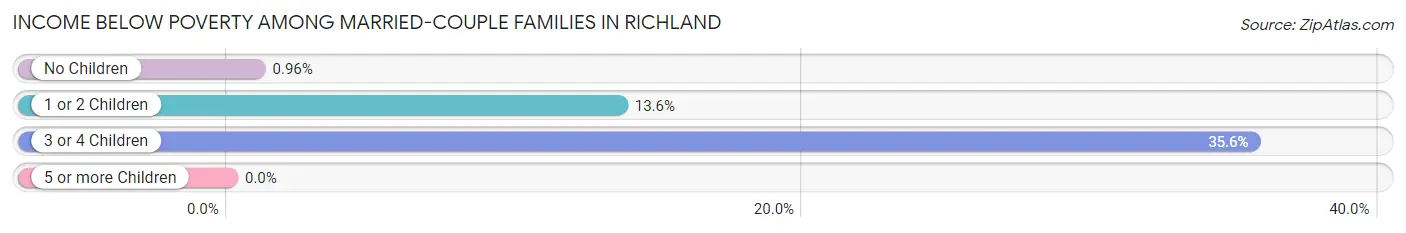
| Children | Above Poverty | Below Poverty |
| No Children | 719 (99.0%) | 7 (1.0%) |
| 1 or 2 Children | 484 (86.4%) | 76 (13.6%) |
| 3 or 4 Children | 38 (64.4%) | 21 (35.6%) |
| 5 or more Children | 9 (100.0%) | 0 (0.0%) |
| Total | 1,250 (92.3%) | 104 (7.7%) |
Income Below Poverty Among Single-Parent Households in Richland
According to the poverty data in Richland, 17.5% or 52 single-father households and 22.9% or 66 single-mother households are living below the poverty line. Among single-father households, those with no children have the highest poverty rate, with 52 households (32.9%) experiencing poverty. Likewise, among single-mother households, those with 3 or 4 children have the highest poverty rate, with 25 households (59.5%) falling below the poverty line.
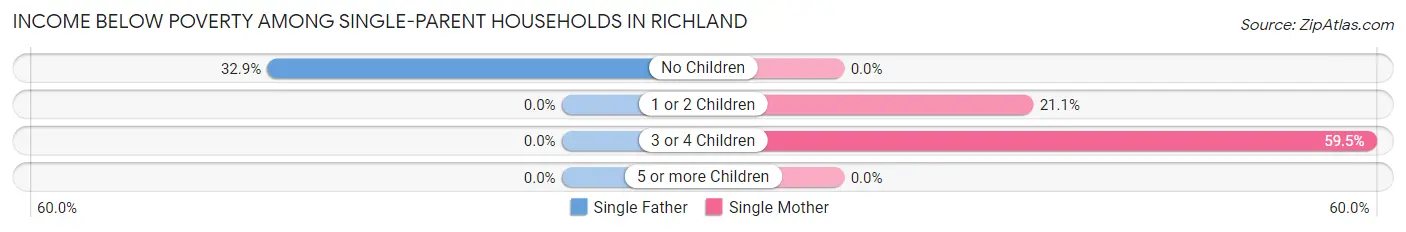
| Children | Single Father | Single Mother |
| No Children | 52 (32.9%) | 0 (0.0%) |
| 1 or 2 Children | 0 (0.0%) | 41 (21.1%) |
| 3 or 4 Children | 0 (0.0%) | 25 (59.5%) |
| 5 or more Children | 0 (0.0%) | 0 (0.0%) |
| Total | 52 (17.5%) | 66 (22.9%) |
Income Below Poverty Among Married-Couple vs Single-Parent Households in Richland
The poverty data for Richland shows that 104 of the married-couple family households (7.7%) and 118 of the single-parent households (20.2%) are living below the poverty level. Within the married-couple family households, those with 3 or 4 children have the highest poverty rate, with 21 households (35.6%) falling below the poverty line. Among the single-parent households, those with 3 or 4 children have the highest poverty rate, with 25 household (32.1%) living below poverty.
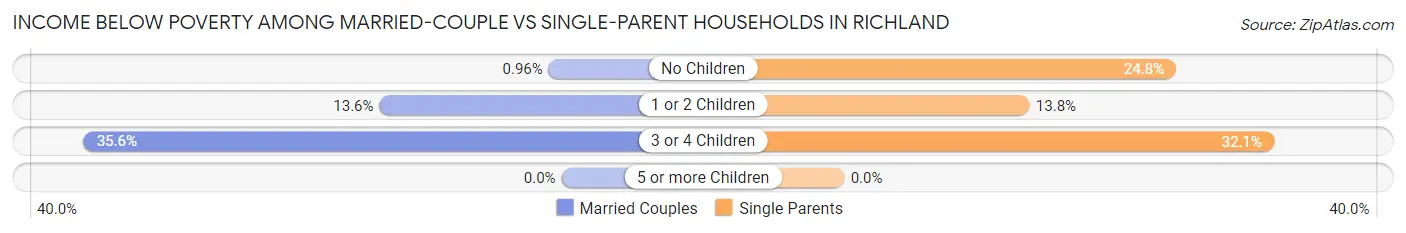
| Children | Married-Couple Families | Single-Parent Households |
| No Children | 7 (1.0%) | 52 (24.8%) |
| 1 or 2 Children | 76 (13.6%) | 41 (13.8%) |
| 3 or 4 Children | 21 (35.6%) | 25 (32.1%) |
| 5 or more Children | 0 (0.0%) | 0 (0.0%) |
| Total | 104 (7.7%) | 118 (20.2%) |
Race in Richland
The most populous races in Richland are White / Caucasian (5,234 | 72.6%), Black / African American (1,370 | 19.0%), and Some other Race (298 | 4.1%).
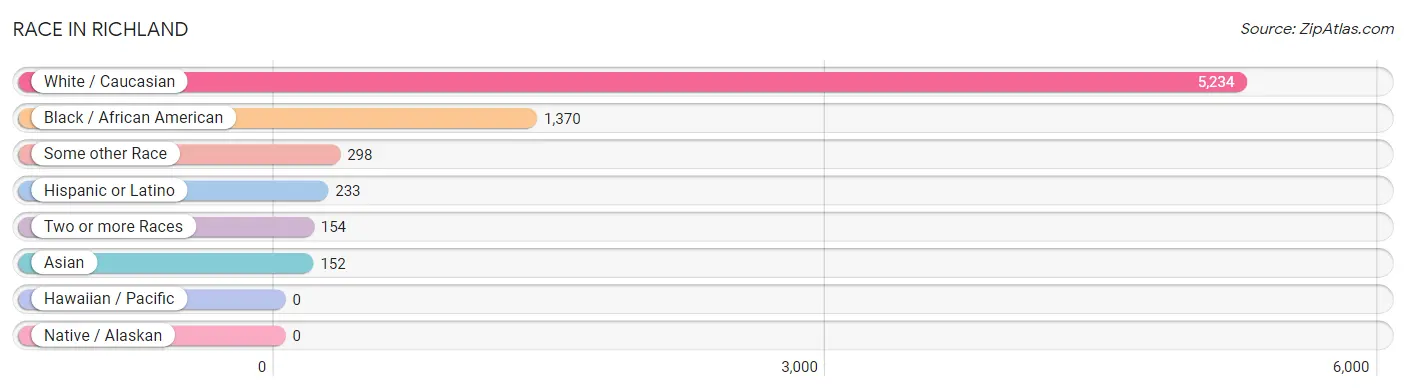
| Race | # Population | % Population |
| Asian | 152 | 2.1% |
| Black / African American | 1,370 | 19.0% |
| Hawaiian / Pacific | 0 | 0.0% |
| Hispanic or Latino | 233 | 3.2% |
| Native / Alaskan | 0 | 0.0% |
| White / Caucasian | 5,234 | 72.6% |
| Two or more Races | 154 | 2.1% |
| Some other Race | 298 | 4.1% |
| Total | 7,208 | 100.0% |
Ancestry in Richland
The most populous ancestries reported in Richland are English (917 | 12.7%), Irish (811 | 11.3%), American (763 | 10.6%), German (449 | 6.2%), and European (232 | 3.2%), together accounting for 44.0% of all Richland residents.
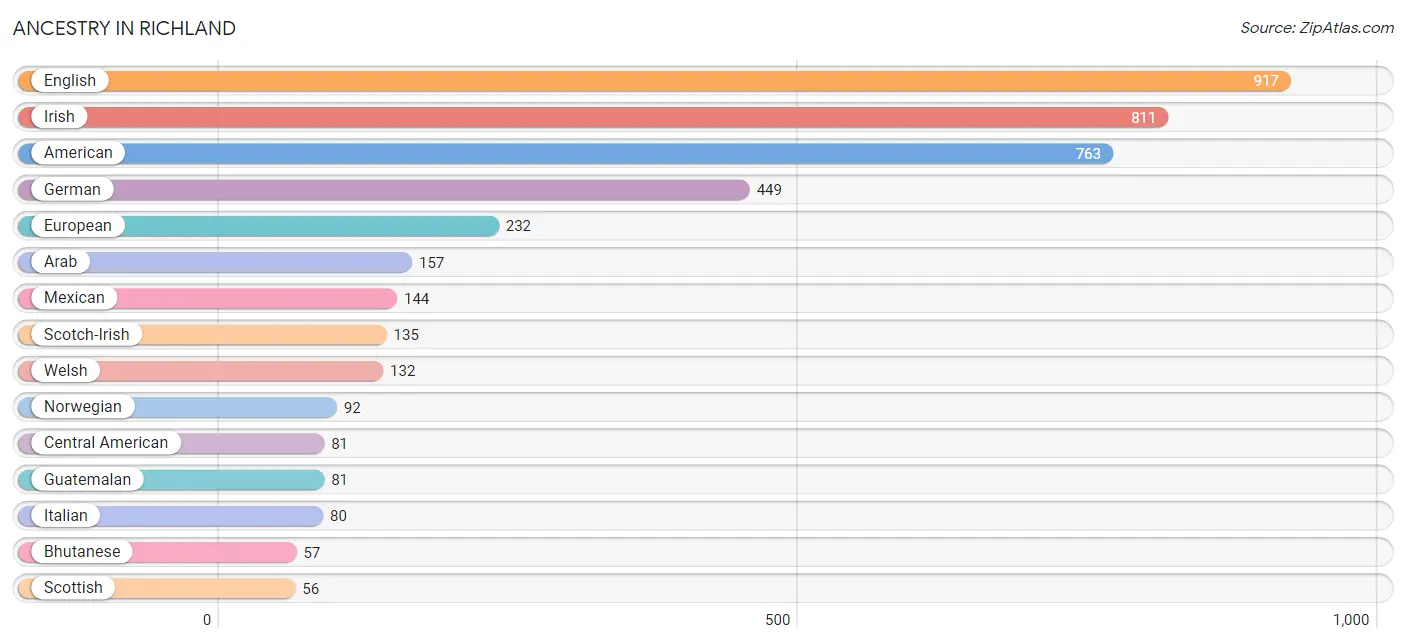
| Ancestry | # Population | % Population |
| American | 763 | 10.6% |
| Arab | 157 | 2.2% |
| Bhutanese | 57 | 0.8% |
| Blackfeet | 11 | 0.2% |
| British | 33 | 0.5% |
| Central American | 81 | 1.1% |
| Dutch | 27 | 0.4% |
| Eastern European | 39 | 0.5% |
| English | 917 | 12.7% |
| European | 232 | 3.2% |
| French | 21 | 0.3% |
| German | 449 | 6.2% |
| Guatemalan | 81 | 1.1% |
| Irish | 811 | 11.3% |
| Italian | 80 | 1.1% |
| Korean | 5 | 0.1% |
| Mexican | 144 | 2.0% |
| Norwegian | 92 | 1.3% |
| Polish | 14 | 0.2% |
| Puget Sound Salish | 4 | 0.1% |
| Scandinavian | 21 | 0.3% |
| Scotch-Irish | 135 | 1.9% |
| Scottish | 56 | 0.8% |
| Slovak | 35 | 0.5% |
| Sri Lankan | 51 | 0.7% |
| Swedish | 34 | 0.5% |
| Thai | 41 | 0.6% |
| Welsh | 132 | 1.8% |
| Yugoslavian | 13 | 0.2% | View All 29 Rows |
Immigrants in Richland
The most numerous immigrant groups reported in Richland came from Africa (81 | 1.1%), Egypt (81 | 1.1%), Northern Africa (81 | 1.1%), Central America (74 | 1.0%), and Latin America (74 | 1.0%), together accounting for 5.4% of all Richland residents.
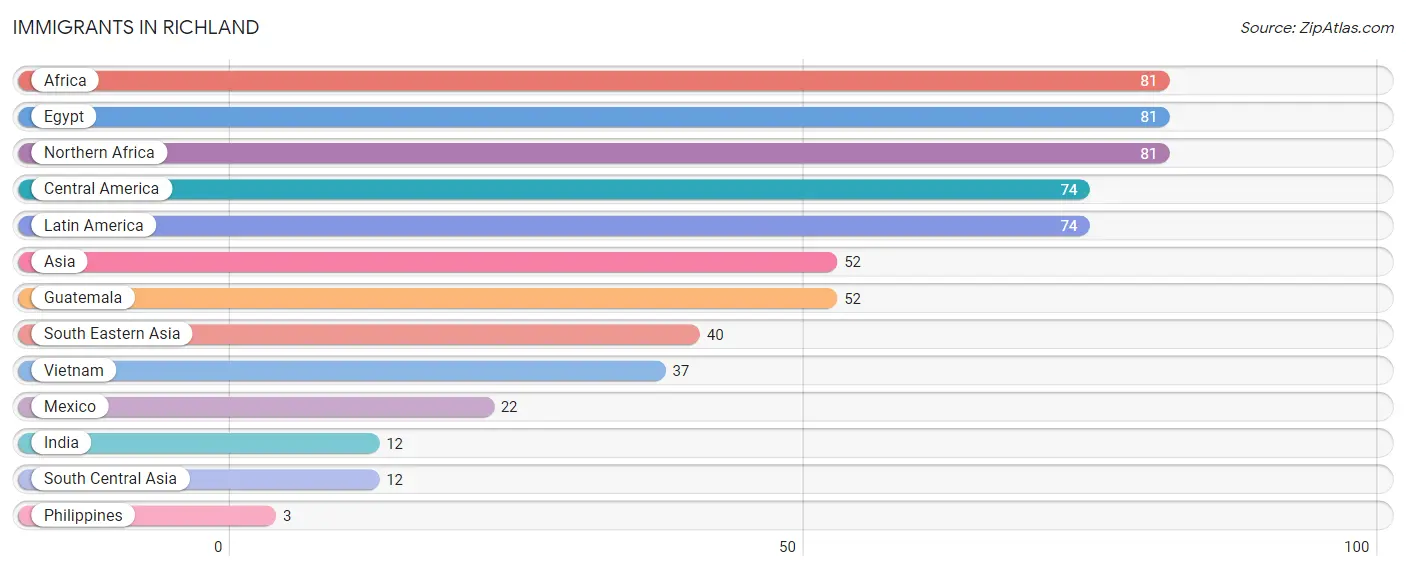
| Immigration Origin | # Population | % Population |
| Africa | 81 | 1.1% |
| Asia | 52 | 0.7% |
| Central America | 74 | 1.0% |
| Egypt | 81 | 1.1% |
| Guatemala | 52 | 0.7% |
| India | 12 | 0.2% |
| Latin America | 74 | 1.0% |
| Mexico | 22 | 0.3% |
| Northern Africa | 81 | 1.1% |
| Philippines | 3 | 0.0% |
| South Central Asia | 12 | 0.2% |
| South Eastern Asia | 40 | 0.5% |
| Vietnam | 37 | 0.5% | View All 13 Rows |
Sex and Age in Richland
Sex and Age in Richland
The most populous age groups in Richland are 45 to 49 Years (422 | 11.2%) for men and 50 to 54 Years (364 | 10.6%) for women.
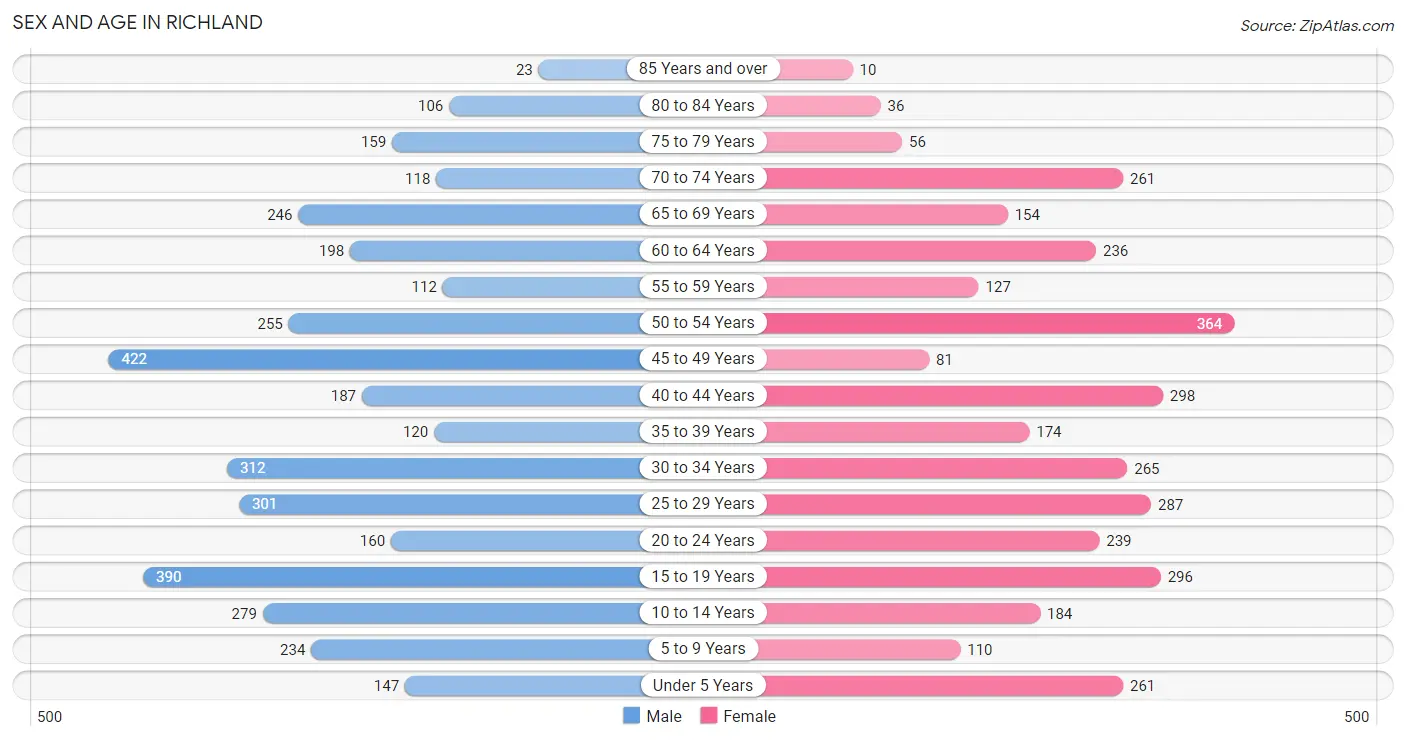
| Age Bracket | Male | Female |
| Under 5 Years | 147 (3.9%) | 261 (7.6%) |
| 5 to 9 Years | 234 (6.2%) | 110 (3.2%) |
| 10 to 14 Years | 279 (7.4%) | 184 (5.3%) |
| 15 to 19 Years | 390 (10.3%) | 296 (8.6%) |
| 20 to 24 Years | 160 (4.3%) | 239 (7.0%) |
| 25 to 29 Years | 301 (8.0%) | 287 (8.4%) |
| 30 to 34 Years | 312 (8.3%) | 265 (7.7%) |
| 35 to 39 Years | 120 (3.2%) | 174 (5.1%) |
| 40 to 44 Years | 187 (5.0%) | 298 (8.7%) |
| 45 to 49 Years | 422 (11.2%) | 81 (2.4%) |
| 50 to 54 Years | 255 (6.8%) | 364 (10.6%) |
| 55 to 59 Years | 112 (3.0%) | 127 (3.7%) |
| 60 to 64 Years | 198 (5.2%) | 236 (6.9%) |
| 65 to 69 Years | 246 (6.5%) | 154 (4.5%) |
| 70 to 74 Years | 118 (3.1%) | 261 (7.6%) |
| 75 to 79 Years | 159 (4.2%) | 56 (1.6%) |
| 80 to 84 Years | 106 (2.8%) | 36 (1.1%) |
| 85 Years and over | 23 (0.6%) | 10 (0.3%) |
| Total | 3,769 (100.0%) | 3,439 (100.0%) |
Families and Households in Richland
Median Family Size in Richland
The median family size in Richland is 2.91 persons per family, with married-couple families (1,354 | 69.8%) accounting for the largest median family size of 2.98 persons per family. On the other hand, single female/mother families (288 | 14.8%) represent the smallest median family size with 2.66 persons per family.
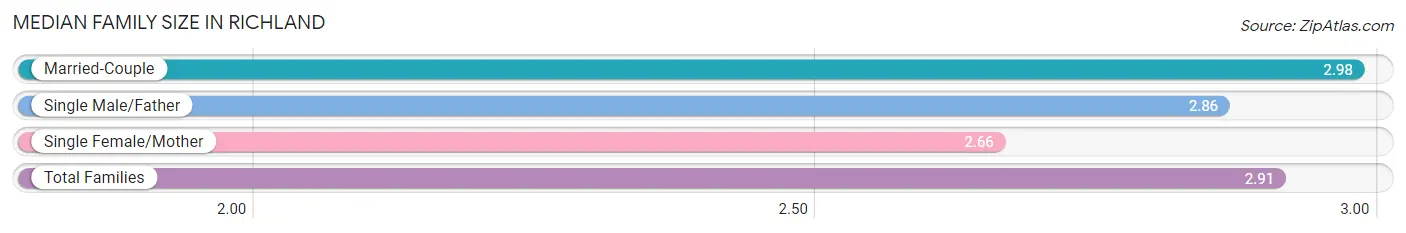
| Family Type | # Families | Family Size |
| Married-Couple | 1,354 (69.8%) | 2.98 |
| Single Male/Father | 297 (15.3%) | 2.86 |
| Single Female/Mother | 288 (14.8%) | 2.66 |
| Total Families | 1,939 (100.0%) | 2.91 |
Median Household Size in Richland
The median household size in Richland is 2.40 persons per household, with single male/father households (297 | 9.9%) accounting for the largest median household size of 3.41 persons per household. non-family households (1,065 | 35.4%) represent the smallest median household size with 1.27 persons per household.
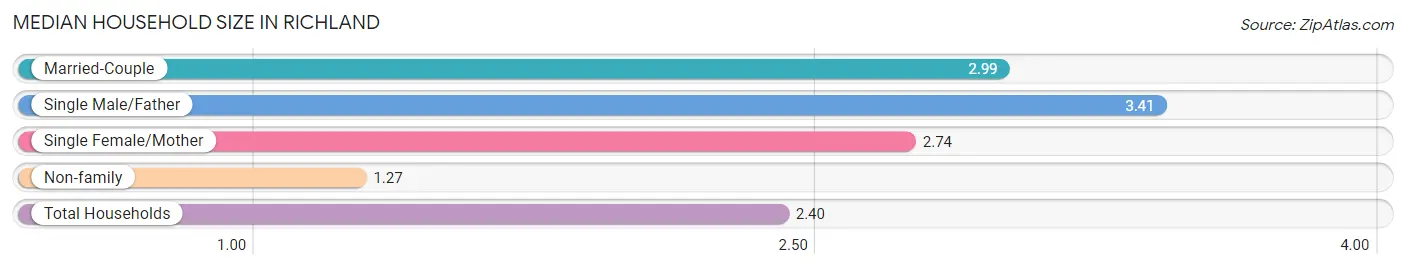
| Household Type | # Households | Household Size |
| Married-Couple | 1,354 (45.1%) | 2.99 |
| Single Male/Father | 297 (9.9%) | 3.41 |
| Single Female/Mother | 288 (9.6%) | 2.74 |
| Non-family | 1,065 (35.4%) | 1.27 |
| Total Households | 3,004 (100.0%) | 2.40 |
Household Size by Marriage Status in Richland
Out of a total of 3,004 households in Richland, 1,939 (64.5%) are family households, while 1,065 (35.4%) are nonfamily households. The most numerous type of family households are 2-person households, comprising 771, and the most common type of nonfamily households are 1-person households, comprising 822.
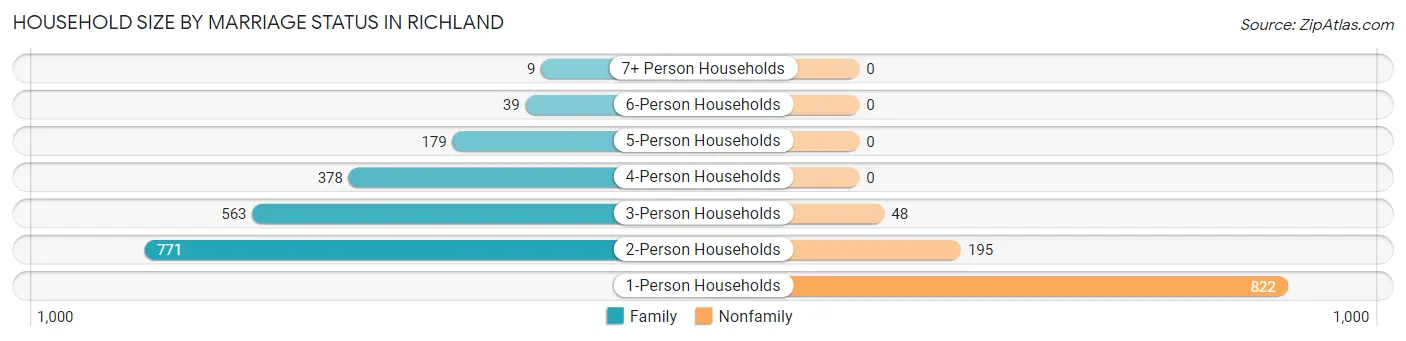
| Household Size | Family Households | Nonfamily Households |
| 1-Person Households | - | 822 (27.4%) |
| 2-Person Households | 771 (25.7%) | 195 (6.5%) |
| 3-Person Households | 563 (18.7%) | 48 (1.6%) |
| 4-Person Households | 378 (12.6%) | 0 (0.0%) |
| 5-Person Households | 179 (6.0%) | 0 (0.0%) |
| 6-Person Households | 39 (1.3%) | 0 (0.0%) |
| 7+ Person Households | 9 (0.3%) | 0 (0.0%) |
| Total | 1,939 (64.5%) | 1,065 (35.4%) |
Female Fertility in Richland
Fertility by Age in Richland
Average fertility rate in Richland is 21.0 births per 1,000 women. Women in the age bracket of 20 to 34 years have the highest fertility rate with 44.0 births per 1,000 women. Women in the age bracket of 20 to 34 years acount for 100.0% of all women with births.
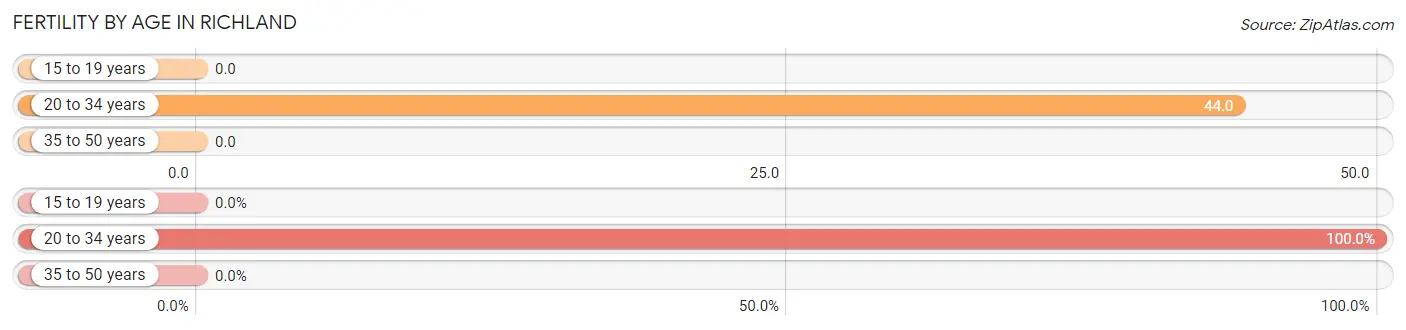
| Age Bracket | Women with Births | Births / 1,000 Women |
| 15 to 19 years | 0 (0.0%) | 0.0 |
| 20 to 34 years | 35 (100.0%) | 44.0 |
| 35 to 50 years | 0 (0.0%) | 0.0 |
| Total | 35 (100.0%) | 21.0 |
Fertility by Age by Marriage Status in Richland
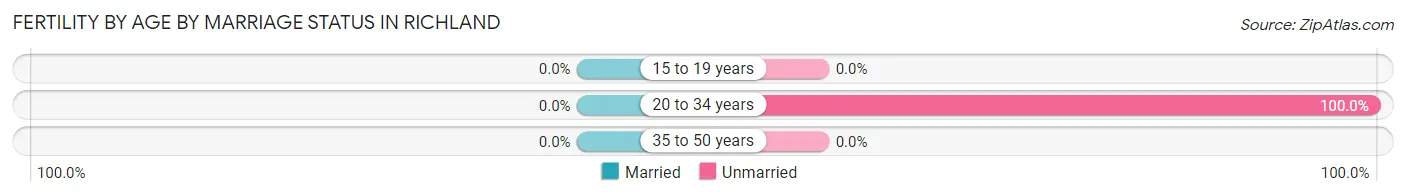
| Age Bracket | Married | Unmarried |
| 15 to 19 years | 0 (0.0%) | 0 (0.0%) |
| 20 to 34 years | 0 (0.0%) | 35 (100.0%) |
| 35 to 50 years | 0 (0.0%) | 0 (0.0%) |
| Total | 0 (0.0%) | 35 (100.0%) |
Fertility by Education in Richland
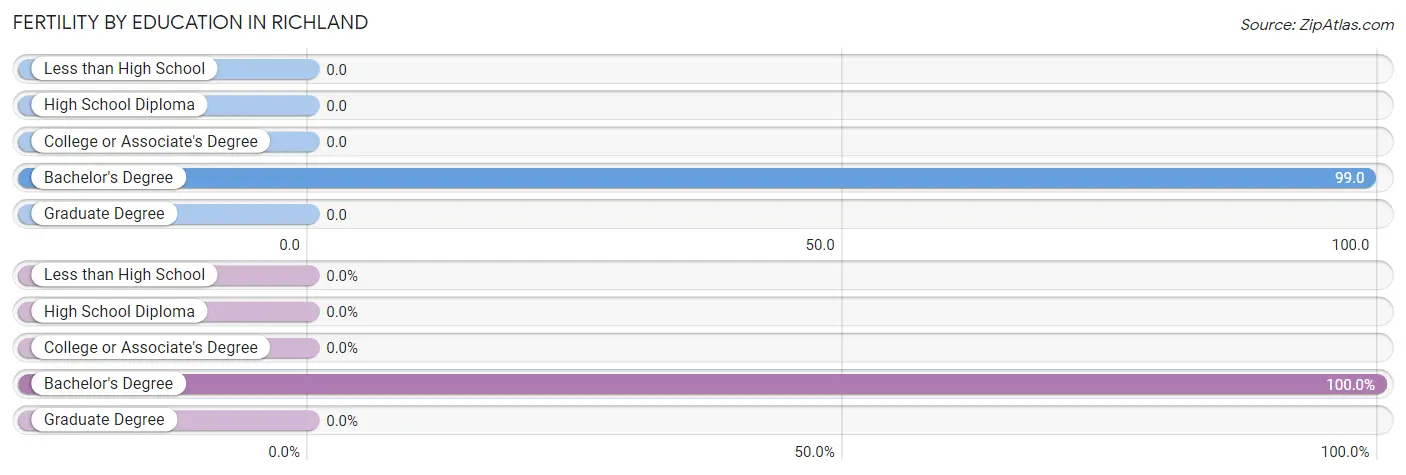
| Educational Attainment | Women with Births | Births / 1,000 Women |
| Less than High School | 0 (0.0%) | 0.0 |
| High School Diploma | 0 (0.0%) | 0.0 |
| College or Associate's Degree | 0 (0.0%) | 0.0 |
| Bachelor's Degree | 35 (100.0%) | 99.0 |
| Graduate Degree | 0 (0.0%) | 0.0 |
| Total | 35 (100.0%) | 21.0 |
Fertility by Education by Marriage Status in Richland
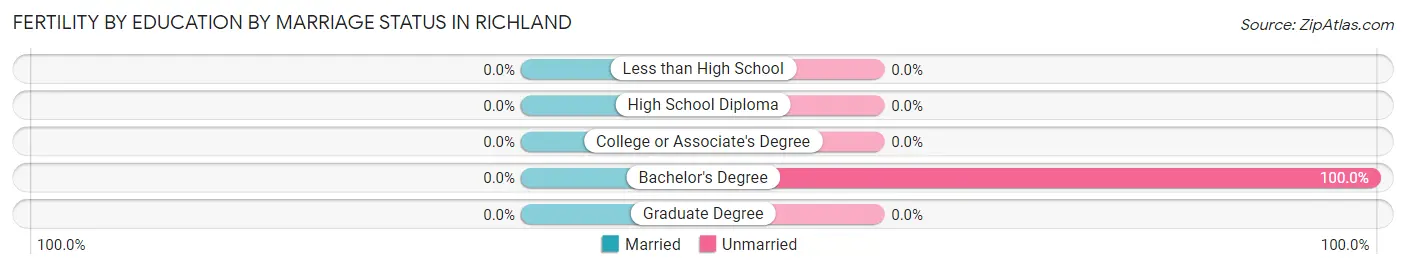
| Educational Attainment | Married | Unmarried |
| Less than High School | 0 (0.0%) | 0 (0.0%) |
| High School Diploma | 0 (0.0%) | 0 (0.0%) |
| College or Associate's Degree | 0 (0.0%) | 0 (0.0%) |
| Bachelor's Degree | 0 (0.0%) | 35 (100.0%) |
| Graduate Degree | 0 (0.0%) | 0 (0.0%) |
| Total | 0 (0.0%) | 35 (100.0%) |
Employment Characteristics in Richland
Employment by Class of Employer in Richland
Among the 3,480 employed individuals in Richland, private company employees (2,365 | 68.0%), state government employees (501 | 14.4%), and self-employed (not incorporated) (195 | 5.6%) make up the most common classes of employment.
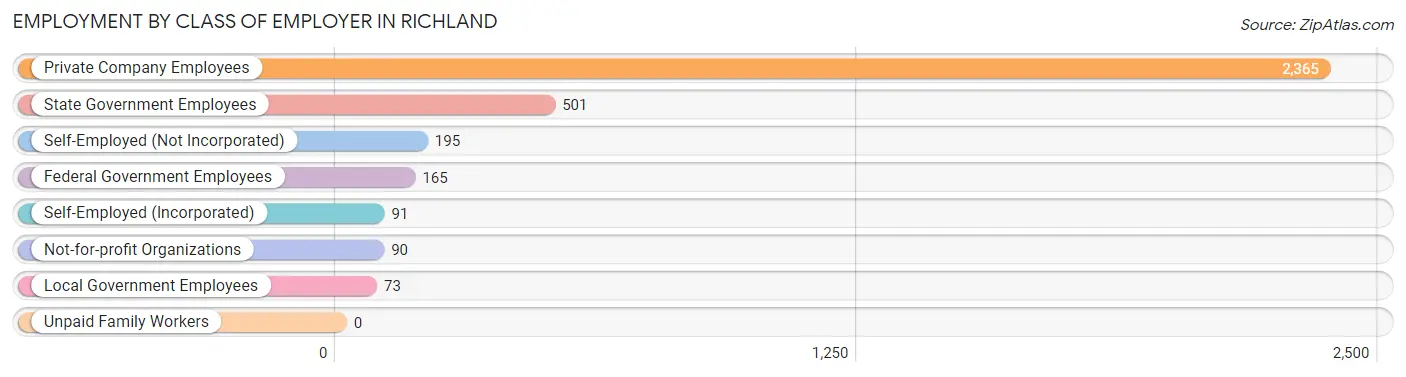
| Employer Class | # Employees | % Employees |
| Private Company Employees | 2,365 | 68.0% |
| Self-Employed (Incorporated) | 91 | 2.6% |
| Self-Employed (Not Incorporated) | 195 | 5.6% |
| Not-for-profit Organizations | 90 | 2.6% |
| Local Government Employees | 73 | 2.1% |
| State Government Employees | 501 | 14.4% |
| Federal Government Employees | 165 | 4.7% |
| Unpaid Family Workers | 0 | 0.0% |
| Total | 3,480 | 100.0% |
Employment Status by Age in Richland
According to the labor force statistics for Richland, out of the total population over 16 years of age (5,926), 61.7% or 3,656 individuals are in the labor force, with 4.2% or 154 of them unemployed. The age group with the highest labor force participation rate is 20 to 24 years, with 95.7% or 382 individuals in the labor force. Within the labor force, the 16 to 19 years age range has the highest percentage of unemployed individuals, with 33.2% or 83 of them being unemployed.
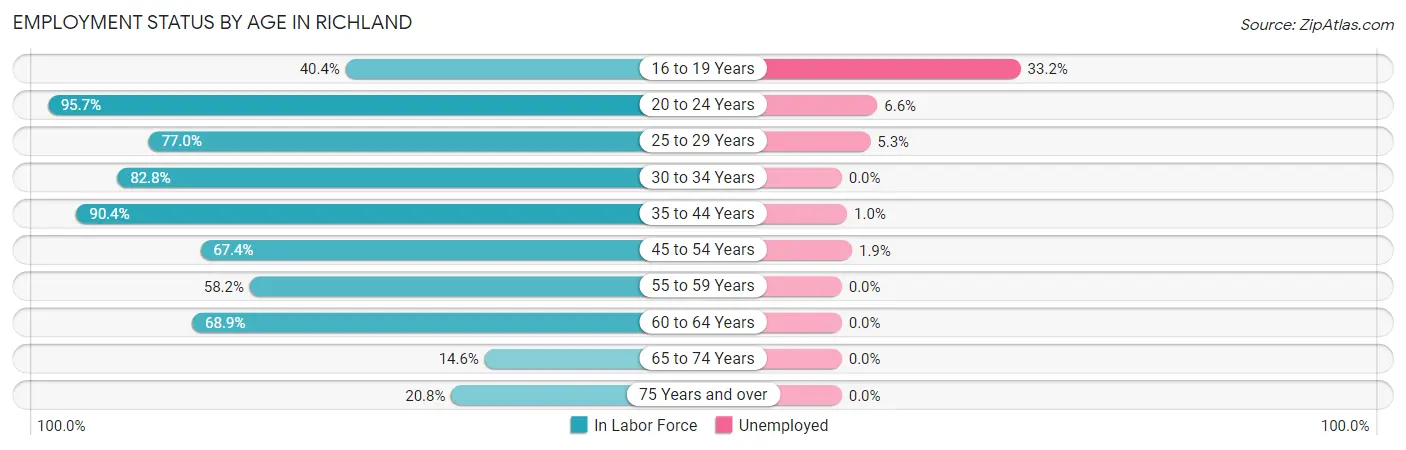
| Age Bracket | In Labor Force | Unemployed |
| 16 to 19 Years | 250 (40.4%) | 83 (33.2%) |
| 20 to 24 Years | 382 (95.7%) | 25 (6.6%) |
| 25 to 29 Years | 453 (77.0%) | 24 (5.3%) |
| 30 to 34 Years | 478 (82.8%) | 0 (0.0%) |
| 35 to 44 Years | 704 (90.4%) | 7 (1.0%) |
| 45 to 54 Years | 756 (67.4%) | 14 (1.9%) |
| 55 to 59 Years | 139 (58.2%) | 0 (0.0%) |
| 60 to 64 Years | 299 (68.9%) | 0 (0.0%) |
| 65 to 74 Years | 114 (14.6%) | 0 (0.0%) |
| 75 Years and over | 81 (20.8%) | 0 (0.0%) |
| Total | 3,656 (61.7%) | 154 (4.2%) |
Employment Status by Educational Attainment in Richland
According to labor force statistics for Richland, 75.7% of individuals (2,830) out of the total population between 25 and 64 years of age (3,739) are in the labor force, with 1.6% or 45 of them being unemployed. The group with the highest labor force participation rate are those with the educational attainment of bachelor's degree or higher, with 83.7% or 745 individuals in the labor force. Within the labor force, individuals with less than high school education have the highest percentage of unemployment, with 13.6% or 21 of them being unemployed.
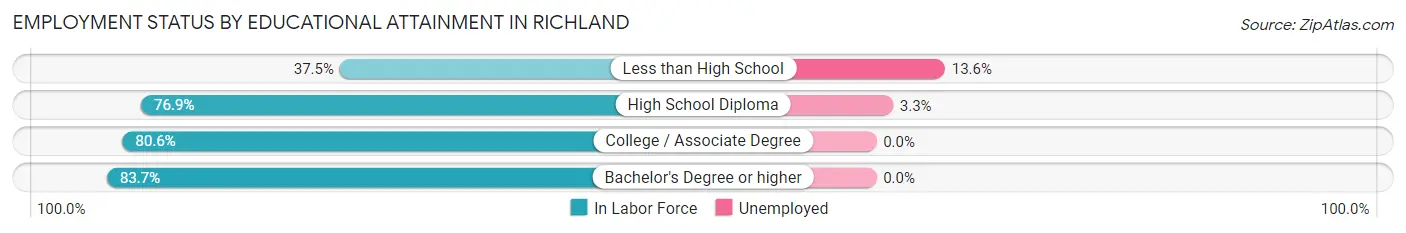
| Educational Attainment | In Labor Force | Unemployed |
| Less than High School | 154 (37.5%) | 56 (13.6%) |
| High School Diploma | 727 (76.9%) | 31 (3.3%) |
| College / Associate Degree | 1,203 (80.6%) | 0 (0.0%) |
| Bachelor's Degree or higher | 745 (83.7%) | 0 (0.0%) |
| Total | 2,830 (75.7%) | 60 (1.6%) |
Employment Occupations by Sex in Richland
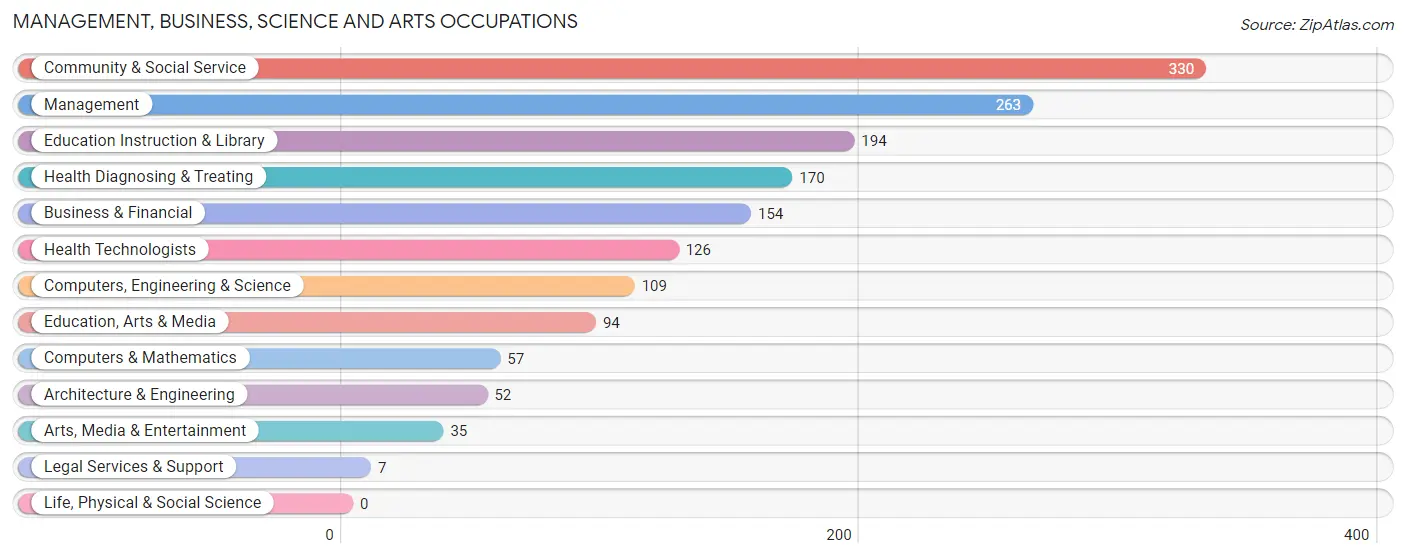
Management, Business, Science and Arts Occupations
The most common Management, Business, Science and Arts occupations in Richland are Community & Social Service (330 | 9.6%), Management (263 | 7.6%), Education Instruction & Library (194 | 5.6%), Health Diagnosing & Treating (170 | 4.9%), and Business & Financial (154 | 4.4%).
Management, Business, Science and Arts Occupations by Sex
Within the Management, Business, Science and Arts occupations in Richland, the most male-oriented occupations are Computers, Engineering & Science (100.0%), Computers & Mathematics (100.0%), and Architecture & Engineering (100.0%), while the most female-oriented occupations are Legal Services & Support (100.0%), Education Instruction & Library (100.0%), and Health Technologists (100.0%).
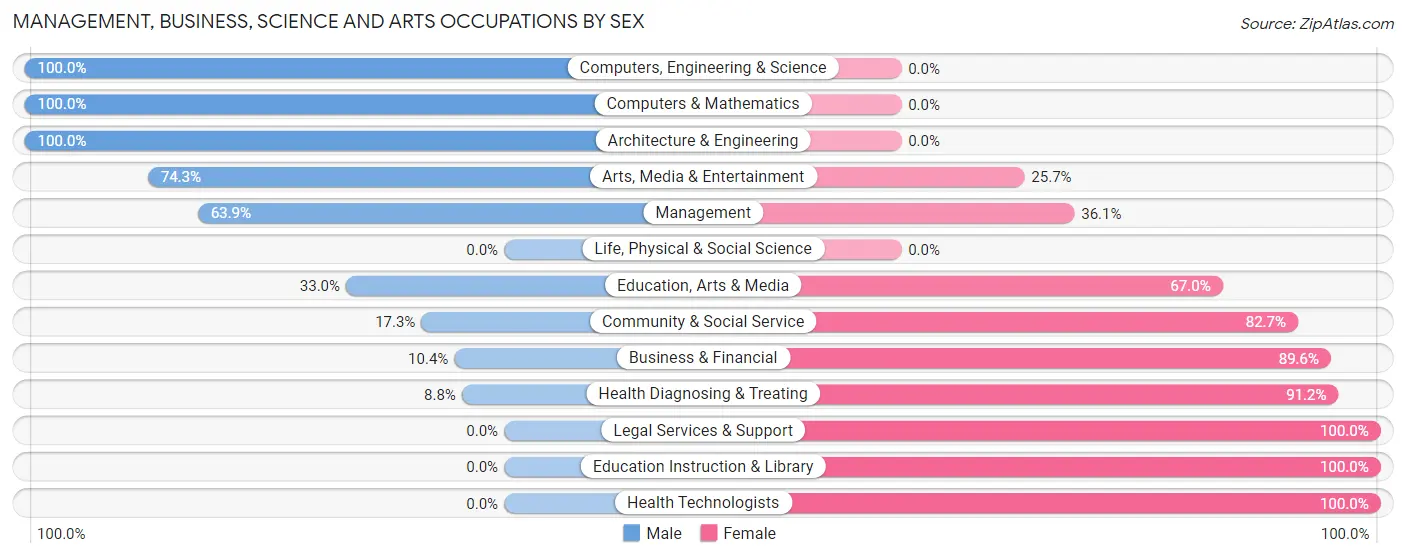
| Occupation | Male | Female |
| Management | 168 (63.9%) | 95 (36.1%) |
| Business & Financial | 16 (10.4%) | 138 (89.6%) |
| Computers, Engineering & Science | 109 (100.0%) | 0 (0.0%) |
| Computers & Mathematics | 57 (100.0%) | 0 (0.0%) |
| Architecture & Engineering | 52 (100.0%) | 0 (0.0%) |
| Life, Physical & Social Science | 0 (0.0%) | 0 (0.0%) |
| Community & Social Service | 57 (17.3%) | 273 (82.7%) |
| Education, Arts & Media | 31 (33.0%) | 63 (67.0%) |
| Legal Services & Support | 0 (0.0%) | 7 (100.0%) |
| Education Instruction & Library | 0 (0.0%) | 194 (100.0%) |
| Arts, Media & Entertainment | 26 (74.3%) | 9 (25.7%) |
| Health Diagnosing & Treating | 15 (8.8%) | 155 (91.2%) |
| Health Technologists | 0 (0.0%) | 126 (100.0%) |
| Total (Category) | 365 (35.6%) | 661 (64.4%) |
| Total (Overall) | 1,826 (52.8%) | 1,631 (47.2%) |
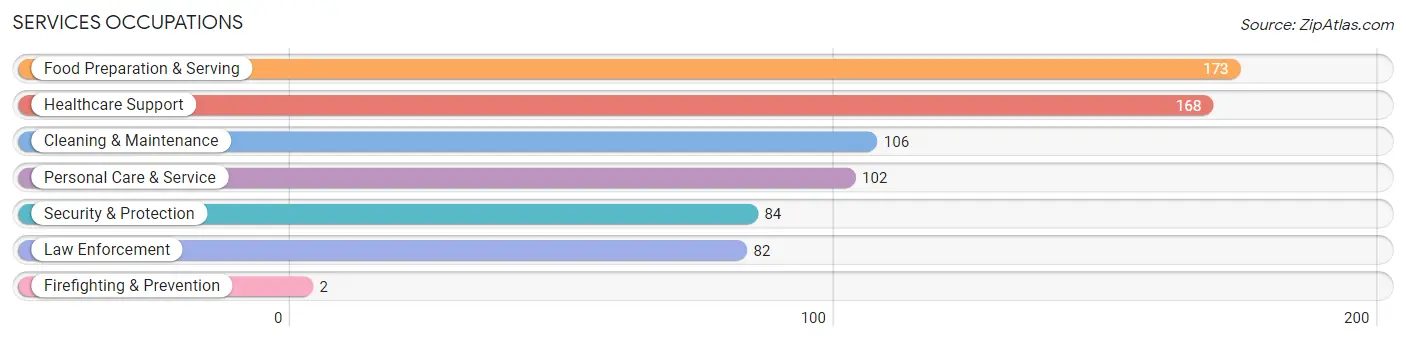
Services Occupations
The most common Services occupations in Richland are Food Preparation & Serving (173 | 5.0%), Healthcare Support (168 | 4.9%), Cleaning & Maintenance (106 | 3.1%), Personal Care & Service (102 | 2.9%), and Security & Protection (84 | 2.4%).
Services Occupations by Sex
Within the Services occupations in Richland, the most male-oriented occupations are Security & Protection (100.0%), Firefighting & Prevention (100.0%), and Law Enforcement (100.0%), while the most female-oriented occupations are Healthcare Support (100.0%), Personal Care & Service (91.2%), and Cleaning & Maintenance (63.2%).
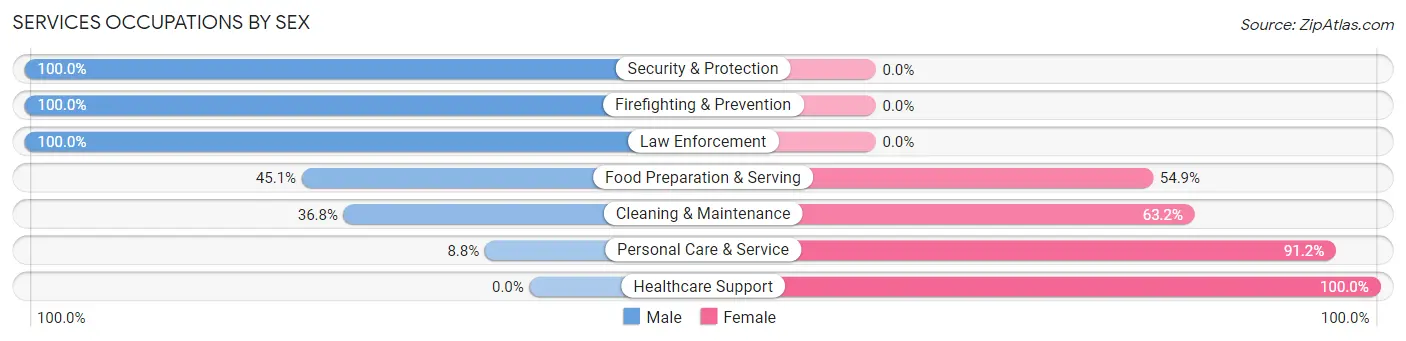
| Occupation | Male | Female |
| Healthcare Support | 0 (0.0%) | 168 (100.0%) |
| Security & Protection | 84 (100.0%) | 0 (0.0%) |
| Firefighting & Prevention | 2 (100.0%) | 0 (0.0%) |
| Law Enforcement | 82 (100.0%) | 0 (0.0%) |
| Food Preparation & Serving | 78 (45.1%) | 95 (54.9%) |
| Cleaning & Maintenance | 39 (36.8%) | 67 (63.2%) |
| Personal Care & Service | 9 (8.8%) | 93 (91.2%) |
| Total (Category) | 210 (33.2%) | 423 (66.8%) |
| Total (Overall) | 1,826 (52.8%) | 1,631 (47.2%) |
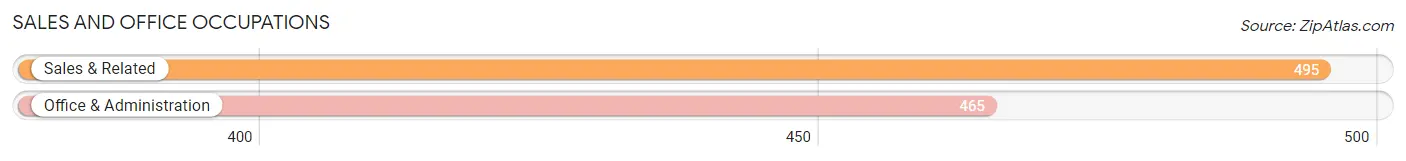
Sales and Office Occupations
The most common Sales and Office occupations in Richland are Sales & Related (495 | 14.3%), and Office & Administration (465 | 13.5%).
Sales and Office Occupations by Sex
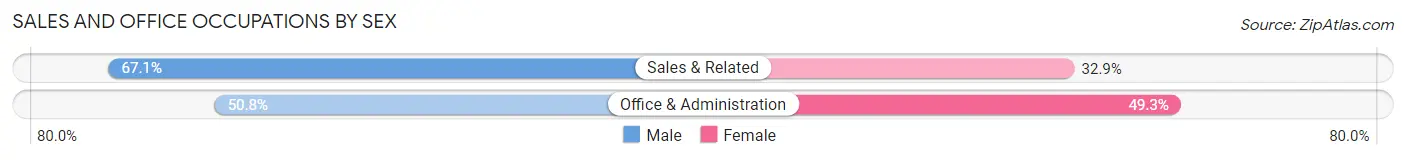
| Occupation | Male | Female |
| Sales & Related | 332 (67.1%) | 163 (32.9%) |
| Office & Administration | 236 (50.7%) | 229 (49.2%) |
| Total (Category) | 568 (59.2%) | 392 (40.8%) |
| Total (Overall) | 1,826 (52.8%) | 1,631 (47.2%) |
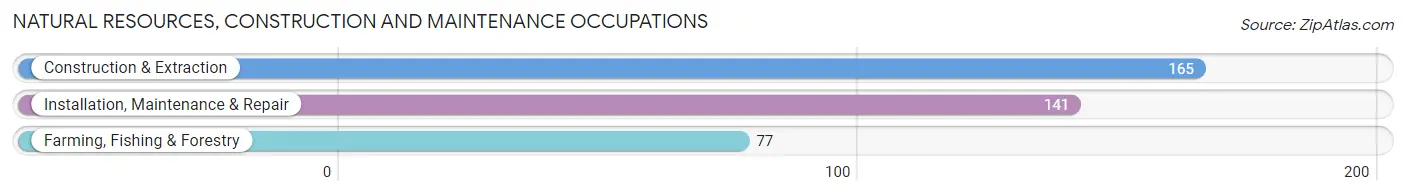
Natural Resources, Construction and Maintenance Occupations
The most common Natural Resources, Construction and Maintenance occupations in Richland are Construction & Extraction (165 | 4.8%), Installation, Maintenance & Repair (141 | 4.1%), and Farming, Fishing & Forestry (77 | 2.2%).
Natural Resources, Construction and Maintenance Occupations by Sex
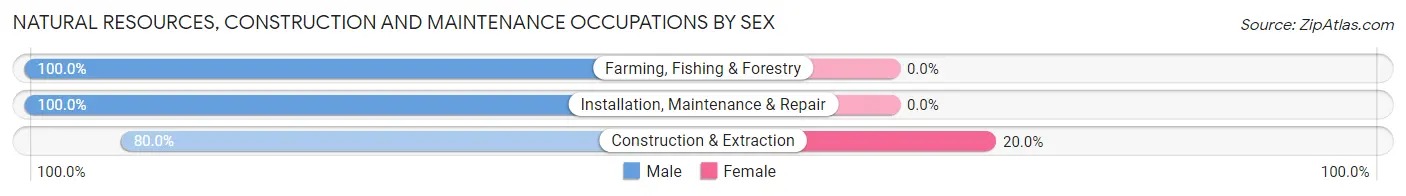
| Occupation | Male | Female |
| Farming, Fishing & Forestry | 77 (100.0%) | 0 (0.0%) |
| Construction & Extraction | 132 (80.0%) | 33 (20.0%) |
| Installation, Maintenance & Repair | 141 (100.0%) | 0 (0.0%) |
| Total (Category) | 350 (91.4%) | 33 (8.6%) |
| Total (Overall) | 1,826 (52.8%) | 1,631 (47.2%) |
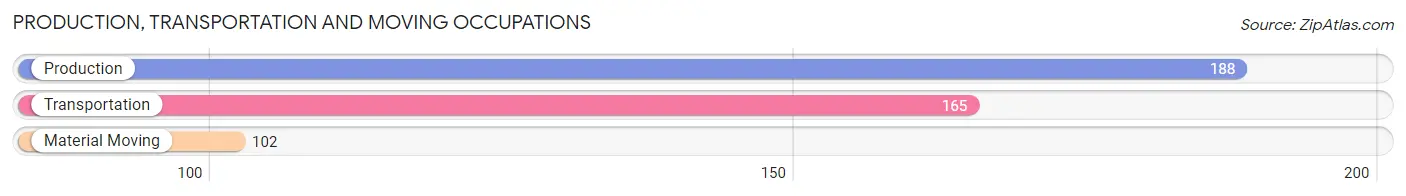
Production, Transportation and Moving Occupations
The most common Production, Transportation and Moving occupations in Richland are Production (188 | 5.4%), Transportation (165 | 4.8%), and Material Moving (102 | 2.9%).
Production, Transportation and Moving Occupations by Sex
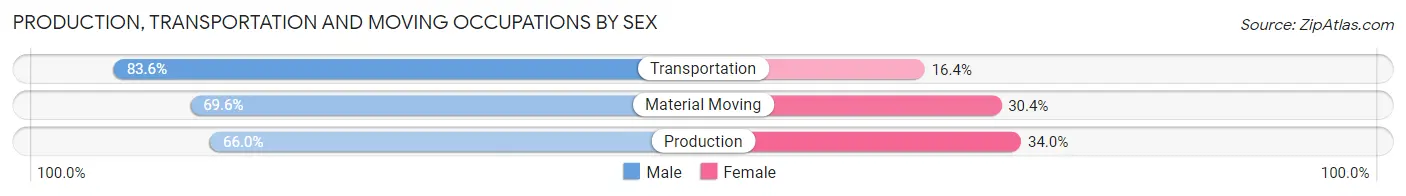
| Occupation | Male | Female |
| Production | 124 (66.0%) | 64 (34.0%) |
| Transportation | 138 (83.6%) | 27 (16.4%) |
| Material Moving | 71 (69.6%) | 31 (30.4%) |
| Total (Category) | 333 (73.2%) | 122 (26.8%) |
| Total (Overall) | 1,826 (52.8%) | 1,631 (47.2%) |
Employment Industries by Sex in Richland
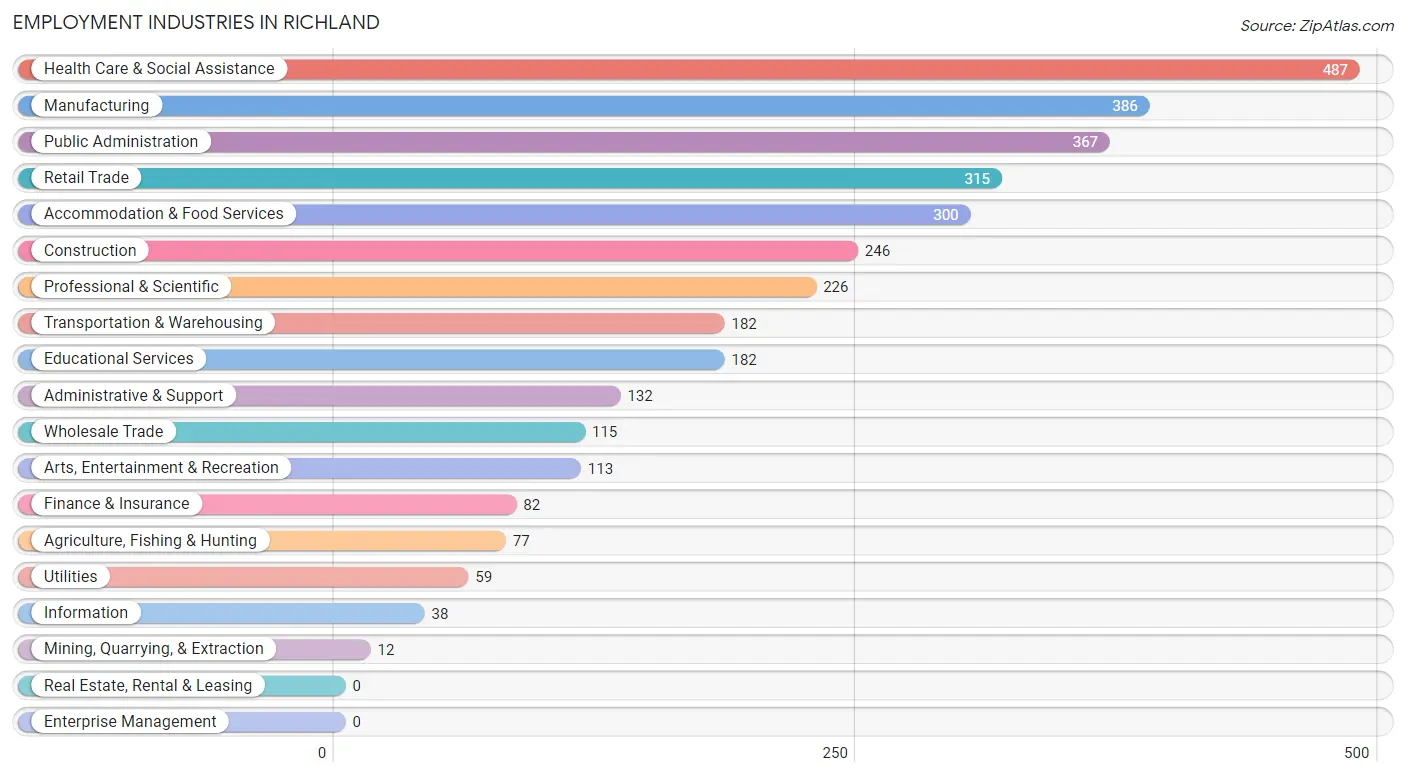
Employment Industries in Richland
The major employment industries in Richland include Health Care & Social Assistance (487 | 14.1%), Manufacturing (386 | 11.2%), Public Administration (367 | 10.6%), Retail Trade (315 | 9.1%), and Accommodation & Food Services (300 | 8.7%).
Employment Industries by Sex in Richland
The Richland industries that see more men than women are Agriculture, Fishing & Hunting (100.0%), Mining, Quarrying, & Extraction (100.0%), and Utilities (100.0%), whereas the industries that tend to have a higher number of women are Educational Services (100.0%), Health Care & Social Assistance (90.8%), and Administrative & Support (74.2%).
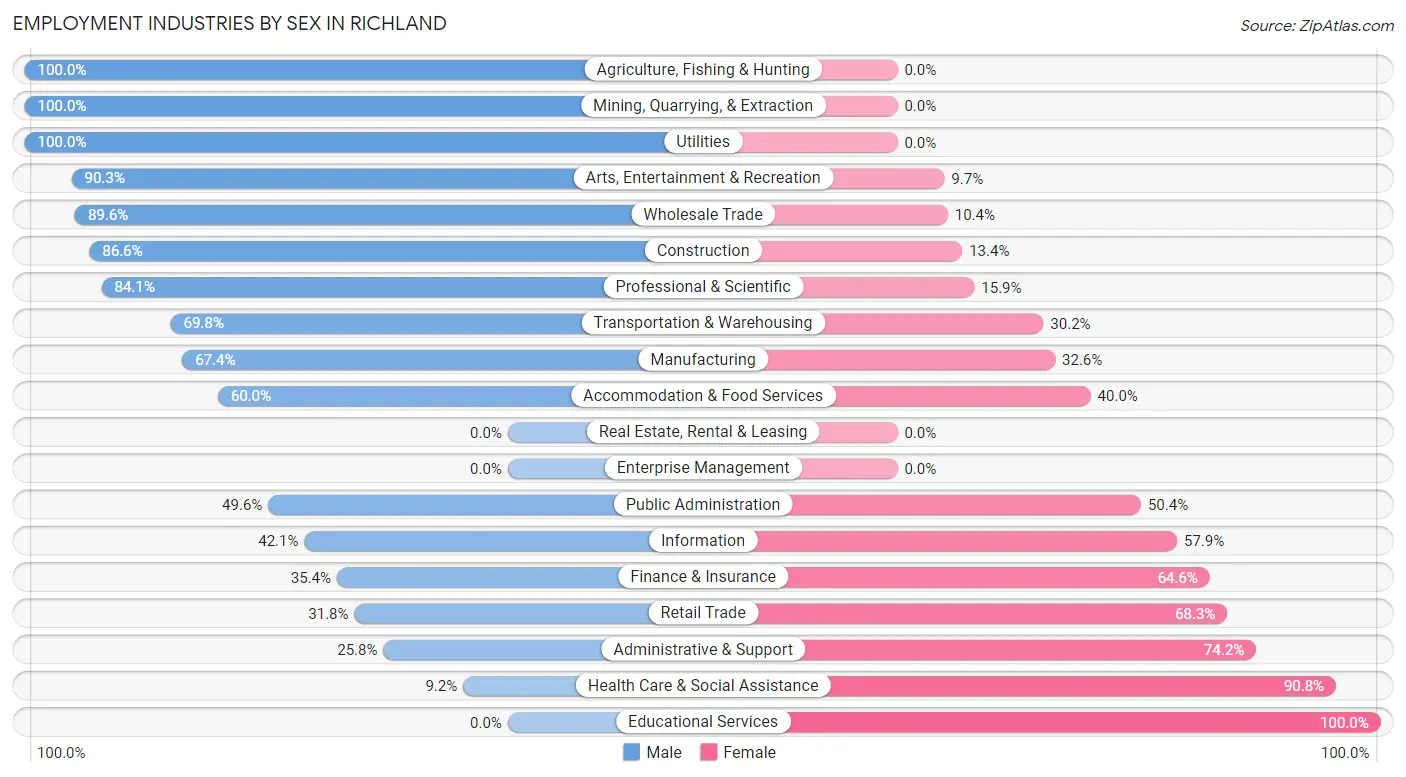
| Industry | Male | Female |
| Agriculture, Fishing & Hunting | 77 (100.0%) | 0 (0.0%) |
| Mining, Quarrying, & Extraction | 12 (100.0%) | 0 (0.0%) |
| Construction | 213 (86.6%) | 33 (13.4%) |
| Manufacturing | 260 (67.4%) | 126 (32.6%) |
| Wholesale Trade | 103 (89.6%) | 12 (10.4%) |
| Retail Trade | 100 (31.8%) | 215 (68.2%) |
| Transportation & Warehousing | 127 (69.8%) | 55 (30.2%) |
| Utilities | 59 (100.0%) | 0 (0.0%) |
| Information | 16 (42.1%) | 22 (57.9%) |
| Finance & Insurance | 29 (35.4%) | 53 (64.6%) |
| Real Estate, Rental & Leasing | 0 (0.0%) | 0 (0.0%) |
| Professional & Scientific | 190 (84.1%) | 36 (15.9%) |
| Enterprise Management | 0 (0.0%) | 0 (0.0%) |
| Administrative & Support | 34 (25.8%) | 98 (74.2%) |
| Educational Services | 0 (0.0%) | 182 (100.0%) |
| Health Care & Social Assistance | 45 (9.2%) | 442 (90.8%) |
| Arts, Entertainment & Recreation | 102 (90.3%) | 11 (9.7%) |
| Accommodation & Food Services | 180 (60.0%) | 120 (40.0%) |
| Public Administration | 182 (49.6%) | 185 (50.4%) |
| Total | 1,826 (52.8%) | 1,631 (47.2%) |
Education in Richland
School Enrollment in Richland
The most common levels of schooling among the 1,700 students in Richland are high school (581 | 34.2%), middle school (403 | 23.7%), and college / undergraduate (290 | 17.1%).
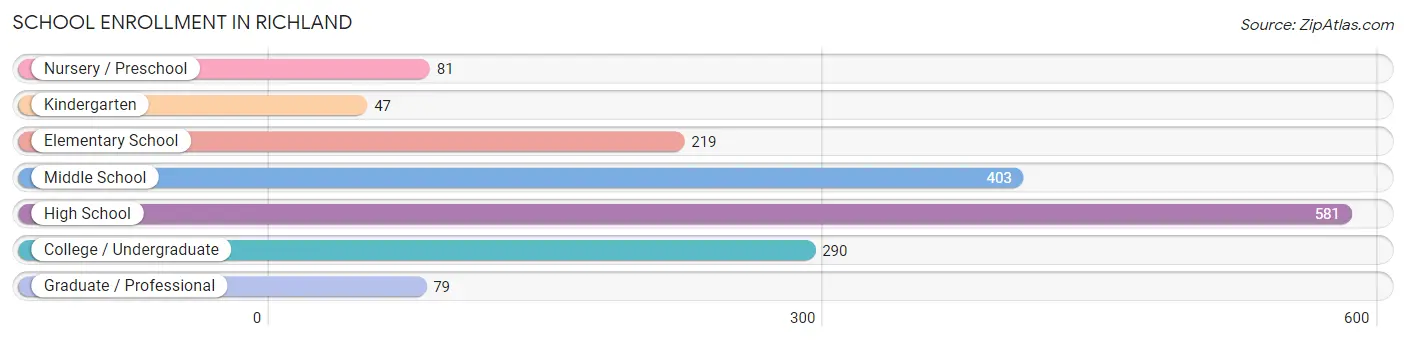
| School Level | # Students | % Students |
| Nursery / Preschool | 81 | 4.8% |
| Kindergarten | 47 | 2.8% |
| Elementary School | 219 | 12.9% |
| Middle School | 403 | 23.7% |
| High School | 581 | 34.2% |
| College / Undergraduate | 290 | 17.1% |
| Graduate / Professional | 79 | 4.6% |
| Total | 1,700 | 100.0% |
School Enrollment by Age by Funding Source in Richland
Out of a total of 1,700 students who are enrolled in schools in Richland, 121 (7.1%) attend a private institution, while the remaining 1,579 (92.9%) are enrolled in public schools. The age group of 20 to 24 year olds has the highest likelihood of being enrolled in private schools, with 22 (23.4% in the age bracket) enrolled. Conversely, the age group of 3 to 4 year olds has the lowest likelihood of being enrolled in a private school, with 70 (100.0% in the age bracket) attending a public institution.
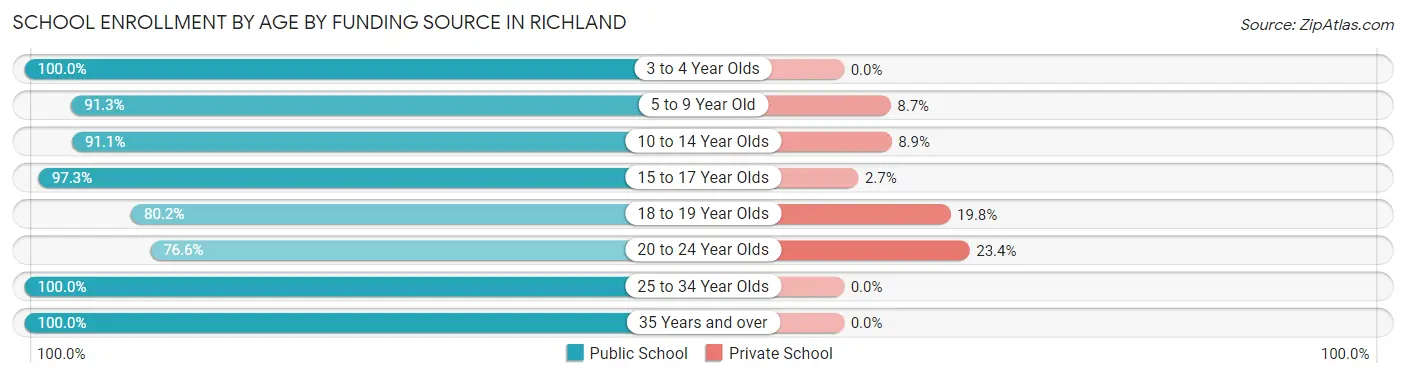
| Age Bracket | Public School | Private School |
| 3 to 4 Year Olds | 70 (100.0%) | 0 (0.0%) |
| 5 to 9 Year Old | 231 (91.3%) | 22 (8.7%) |
| 10 to 14 Year Olds | 422 (91.1%) | 41 (8.9%) |
| 15 to 17 Year Olds | 439 (97.3%) | 12 (2.7%) |
| 18 to 19 Year Olds | 97 (80.2%) | 24 (19.8%) |
| 20 to 24 Year Olds | 72 (76.6%) | 22 (23.4%) |
| 25 to 34 Year Olds | 57 (100.0%) | 0 (0.0%) |
| 35 Years and over | 191 (100.0%) | 0 (0.0%) |
| Total | 1,579 (92.9%) | 121 (7.1%) |
Educational Attainment by Field of Study in Richland
Education (443 | 36.0%), bio, nature & agricultural (176 | 14.3%), business (110 | 8.9%), science & technology (105 | 8.5%), and arts & humanities (94 | 7.6%) are the most common fields of study among 1,230 individuals in Richland who have obtained a bachelor's degree or higher.
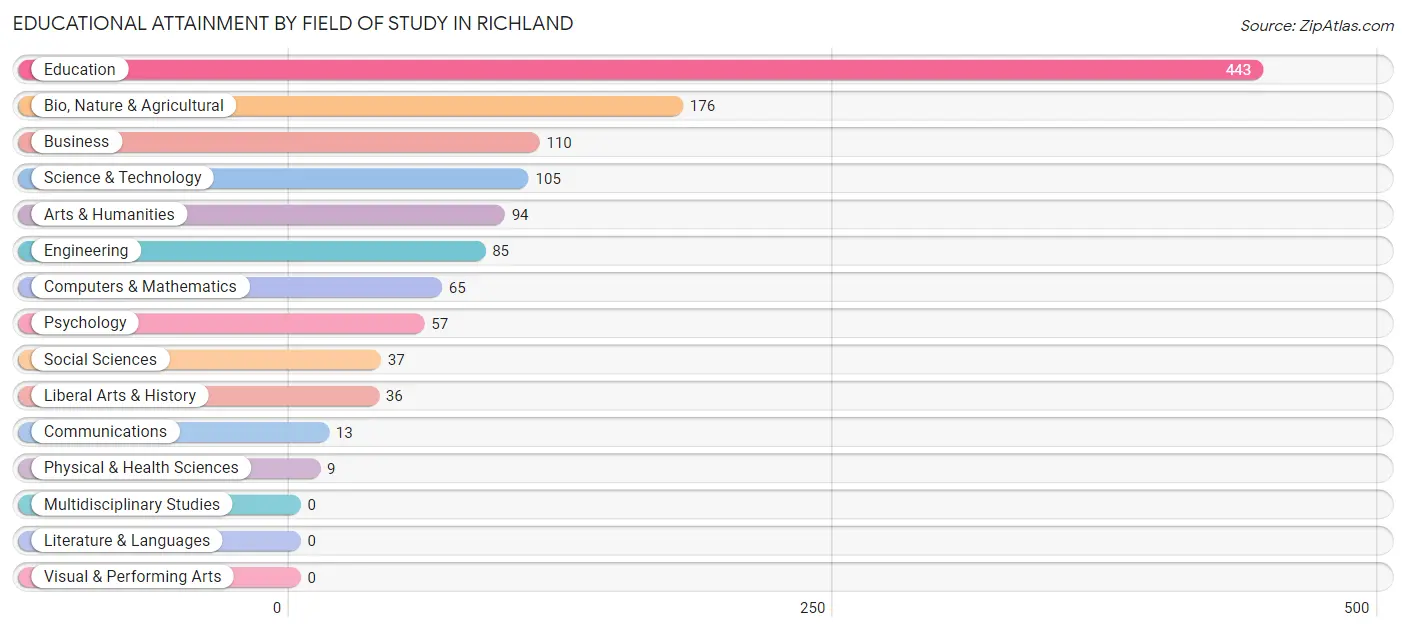
| Field of Study | # Graduates | % Graduates |
| Computers & Mathematics | 65 | 5.3% |
| Bio, Nature & Agricultural | 176 | 14.3% |
| Physical & Health Sciences | 9 | 0.7% |
| Psychology | 57 | 4.6% |
| Social Sciences | 37 | 3.0% |
| Engineering | 85 | 6.9% |
| Multidisciplinary Studies | 0 | 0.0% |
| Science & Technology | 105 | 8.5% |
| Business | 110 | 8.9% |
| Education | 443 | 36.0% |
| Literature & Languages | 0 | 0.0% |
| Liberal Arts & History | 36 | 2.9% |
| Visual & Performing Arts | 0 | 0.0% |
| Communications | 13 | 1.1% |
| Arts & Humanities | 94 | 7.6% |
| Total | 1,230 | 100.0% |
Transportation & Commute in Richland
Vehicle Availability by Sex in Richland
The most prevalent vehicle ownership categories in Richland are males with 3 vehicles (707, accounting for 37.7%) and females with 3 vehicles (562, making up 44.1%).
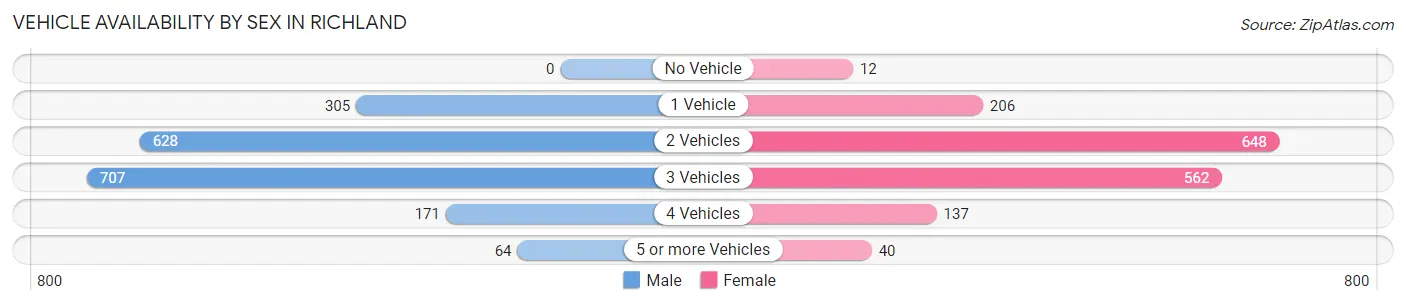
| Vehicles Available | Male | Female |
| No Vehicle | 0 (0.0%) | 12 (0.7%) |
| 1 Vehicle | 305 (16.3%) | 206 (12.8%) |
| 2 Vehicles | 628 (33.5%) | 648 (40.4%) |
| 3 Vehicles | 707 (37.7%) | 562 (35.0%) |
| 4 Vehicles | 171 (9.1%) | 137 (8.5%) |
| 5 or more Vehicles | 64 (3.4%) | 40 (2.5%) |
| Total | 1,875 (100.0%) | 1,605 (100.0%) |
Commute Time in Richland
The most frequently occuring commute durations in Richland are 30 to 34 minutes (716 commuters, 20.9%), 20 to 24 minutes (698 commuters, 20.3%), and 15 to 19 minutes (671 commuters, 19.6%).
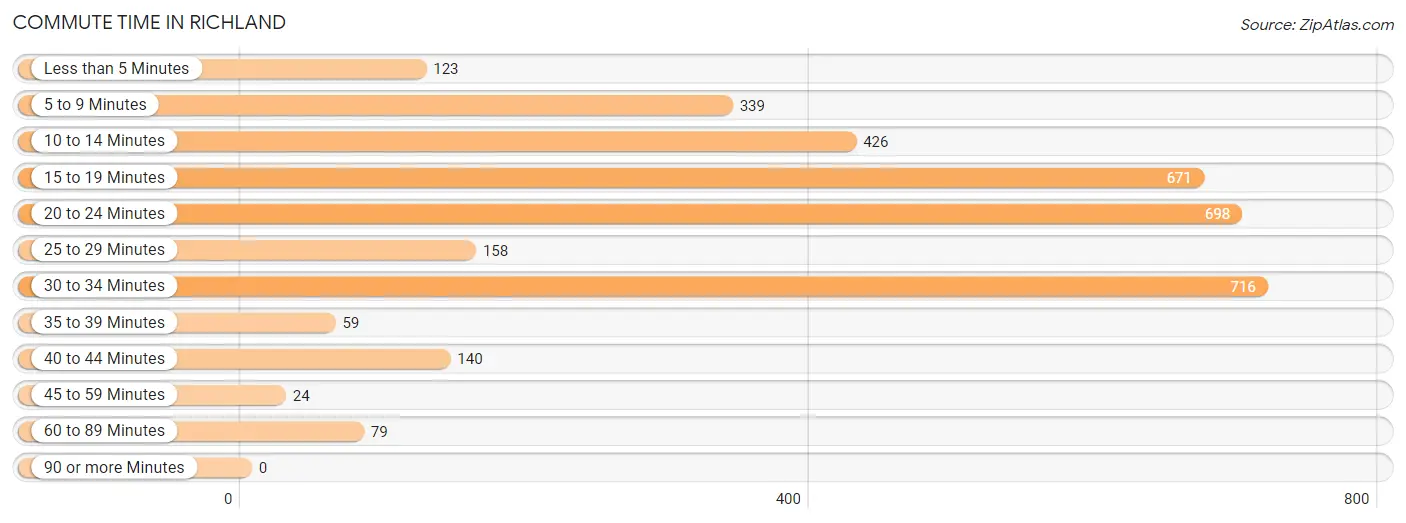
| Commute Time | # Commuters | % Commuters |
| Less than 5 Minutes | 123 | 3.6% |
| 5 to 9 Minutes | 339 | 9.9% |
| 10 to 14 Minutes | 426 | 12.4% |
| 15 to 19 Minutes | 671 | 19.6% |
| 20 to 24 Minutes | 698 | 20.3% |
| 25 to 29 Minutes | 158 | 4.6% |
| 30 to 34 Minutes | 716 | 20.9% |
| 35 to 39 Minutes | 59 | 1.7% |
| 40 to 44 Minutes | 140 | 4.1% |
| 45 to 59 Minutes | 24 | 0.7% |
| 60 to 89 Minutes | 79 | 2.3% |
| 90 or more Minutes | 0 | 0.0% |
Commute Time by Sex in Richland
The most common commute times in Richland are 15 to 19 minutes (543 commuters, 29.2%) for males and 20 to 24 minutes (402 commuters, 25.6%) for females.
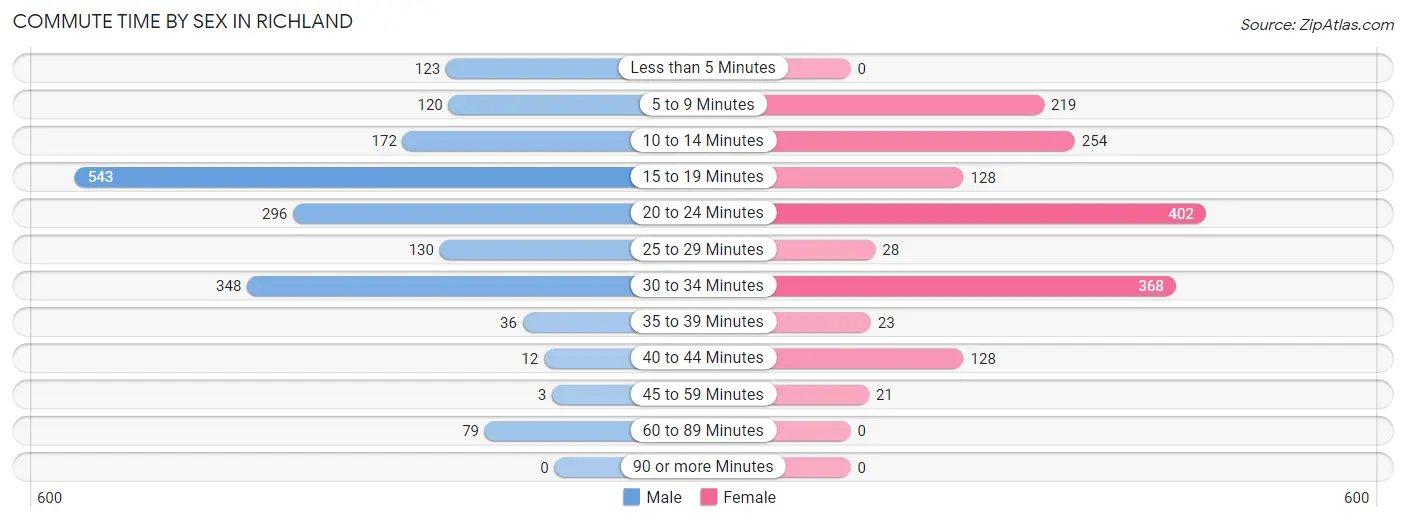
| Commute Time | Male | Female |
| Less than 5 Minutes | 123 (6.6%) | 0 (0.0%) |
| 5 to 9 Minutes | 120 (6.4%) | 219 (13.9%) |
| 10 to 14 Minutes | 172 (9.2%) | 254 (16.2%) |
| 15 to 19 Minutes | 543 (29.2%) | 128 (8.2%) |
| 20 to 24 Minutes | 296 (15.9%) | 402 (25.6%) |
| 25 to 29 Minutes | 130 (7.0%) | 28 (1.8%) |
| 30 to 34 Minutes | 348 (18.7%) | 368 (23.4%) |
| 35 to 39 Minutes | 36 (1.9%) | 23 (1.5%) |
| 40 to 44 Minutes | 12 (0.6%) | 128 (8.2%) |
| 45 to 59 Minutes | 3 (0.2%) | 21 (1.3%) |
| 60 to 89 Minutes | 79 (4.2%) | 0 (0.0%) |
| 90 or more Minutes | 0 (0.0%) | 0 (0.0%) |
Time of Departure to Work by Sex in Richland
The most frequent times of departure to work in Richland are 8:00 AM to 8:29 AM (364, 19.6%) for males and 6:30 AM to 6:59 AM (365, 23.2%) for females.
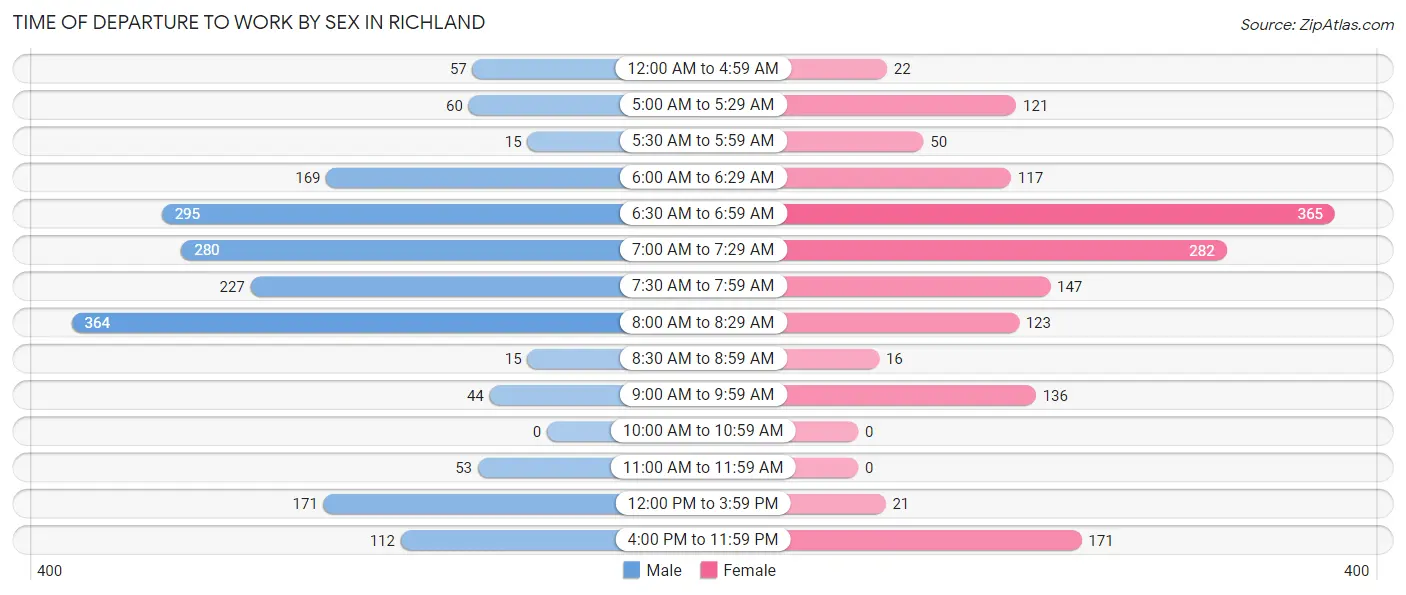
| Time of Departure | Male | Female |
| 12:00 AM to 4:59 AM | 57 (3.1%) | 22 (1.4%) |
| 5:00 AM to 5:29 AM | 60 (3.2%) | 121 (7.7%) |
| 5:30 AM to 5:59 AM | 15 (0.8%) | 50 (3.2%) |
| 6:00 AM to 6:29 AM | 169 (9.1%) | 117 (7.4%) |
| 6:30 AM to 6:59 AM | 295 (15.8%) | 365 (23.2%) |
| 7:00 AM to 7:29 AM | 280 (15.0%) | 282 (17.9%) |
| 7:30 AM to 7:59 AM | 227 (12.2%) | 147 (9.4%) |
| 8:00 AM to 8:29 AM | 364 (19.6%) | 123 (7.8%) |
| 8:30 AM to 8:59 AM | 15 (0.8%) | 16 (1.0%) |
| 9:00 AM to 9:59 AM | 44 (2.4%) | 136 (8.7%) |
| 10:00 AM to 10:59 AM | 0 (0.0%) | 0 (0.0%) |
| 11:00 AM to 11:59 AM | 53 (2.9%) | 0 (0.0%) |
| 12:00 PM to 3:59 PM | 171 (9.2%) | 21 (1.3%) |
| 4:00 PM to 11:59 PM | 112 (6.0%) | 171 (10.9%) |
| Total | 1,862 (100.0%) | 1,571 (100.0%) |
Housing Occupancy in Richland
Occupancy by Ownership in Richland
Of the total 3,004 dwellings in Richland, owner-occupied units account for 2,044 (68.0%), while renter-occupied units make up 960 (32.0%).
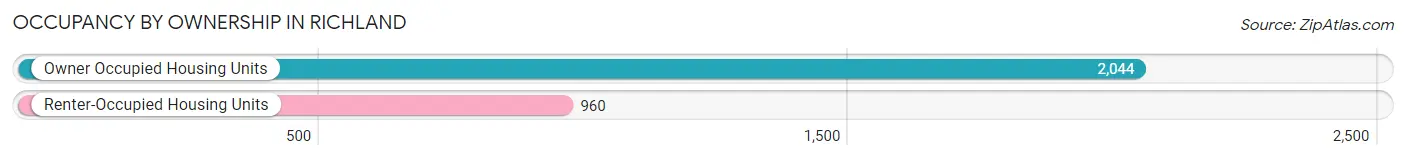
| Occupancy | # Housing Units | % Housing Units |
| Owner Occupied Housing Units | 2,044 | 68.0% |
| Renter-Occupied Housing Units | 960 | 32.0% |
| Total Occupied Housing Units | 3,004 | 100.0% |
Occupancy by Household Size in Richland
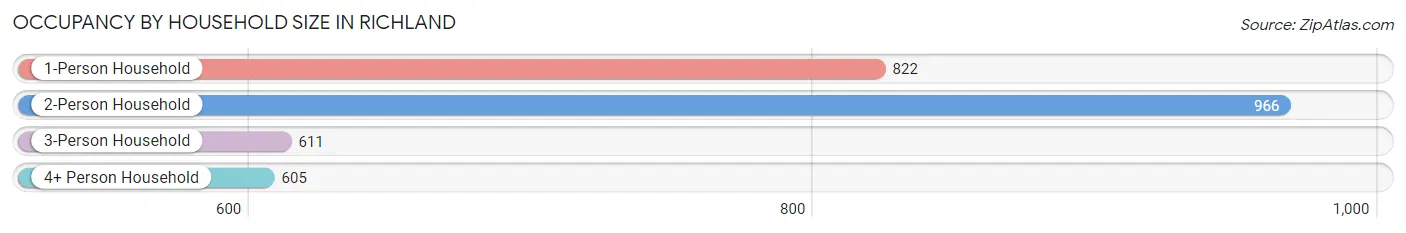
| Household Size | # Housing Units | % Housing Units |
| 1-Person Household | 822 | 27.4% |
| 2-Person Household | 966 | 32.2% |
| 3-Person Household | 611 | 20.3% |
| 4+ Person Household | 605 | 20.1% |
| Total Housing Units | 3,004 | 100.0% |
Occupancy by Ownership by Household Size in Richland
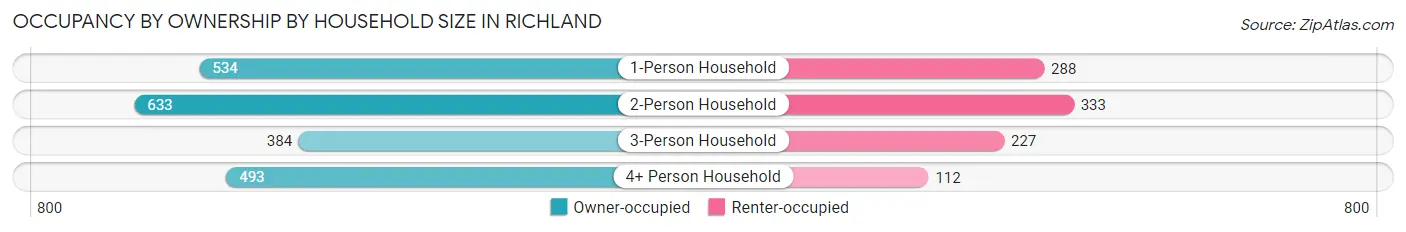
| Household Size | Owner-occupied | Renter-occupied |
| 1-Person Household | 534 (65.0%) | 288 (35.0%) |
| 2-Person Household | 633 (65.5%) | 333 (34.5%) |
| 3-Person Household | 384 (62.8%) | 227 (37.1%) |
| 4+ Person Household | 493 (81.5%) | 112 (18.5%) |
| Total Housing Units | 2,044 (68.0%) | 960 (32.0%) |
Occupancy by Educational Attainment in Richland
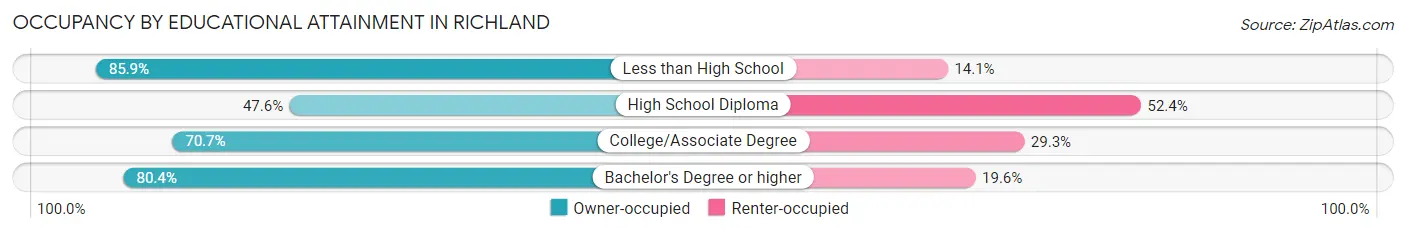
| Household Size | Owner-occupied | Renter-occupied |
| Less than High School | 243 (85.9%) | 40 (14.1%) |
| High School Diploma | 412 (47.6%) | 454 (52.4%) |
| College/Associate Degree | 746 (70.7%) | 309 (29.3%) |
| Bachelor's Degree or higher | 643 (80.4%) | 157 (19.6%) |
Occupancy by Age of Householder in Richland
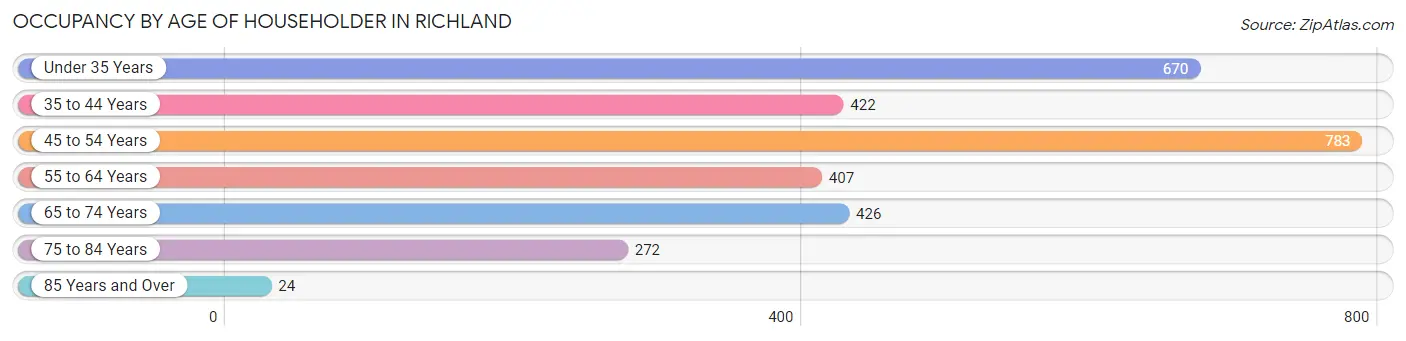
| Age Bracket | # Households | % Households |
| Under 35 Years | 670 | 22.3% |
| 35 to 44 Years | 422 | 14.1% |
| 45 to 54 Years | 783 | 26.1% |
| 55 to 64 Years | 407 | 13.6% |
| 65 to 74 Years | 426 | 14.2% |
| 75 to 84 Years | 272 | 9.0% |
| 85 Years and Over | 24 | 0.8% |
| Total | 3,004 | 100.0% |
Housing Finances in Richland
Median Income by Occupancy in Richland
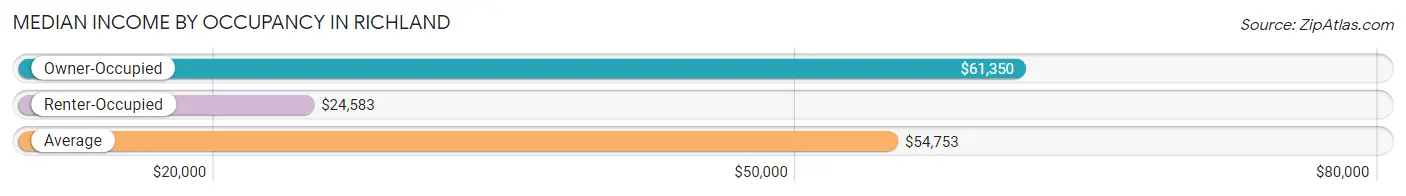
| Occupancy Type | # Households | Median Income |
| Owner-Occupied | 2,044 (68.0%) | $61,350 |
| Renter-Occupied | 960 (32.0%) | $24,583 |
| Average | 3,004 (100.0%) | $54,753 |
Occupancy by Householder Income Bracket in Richland
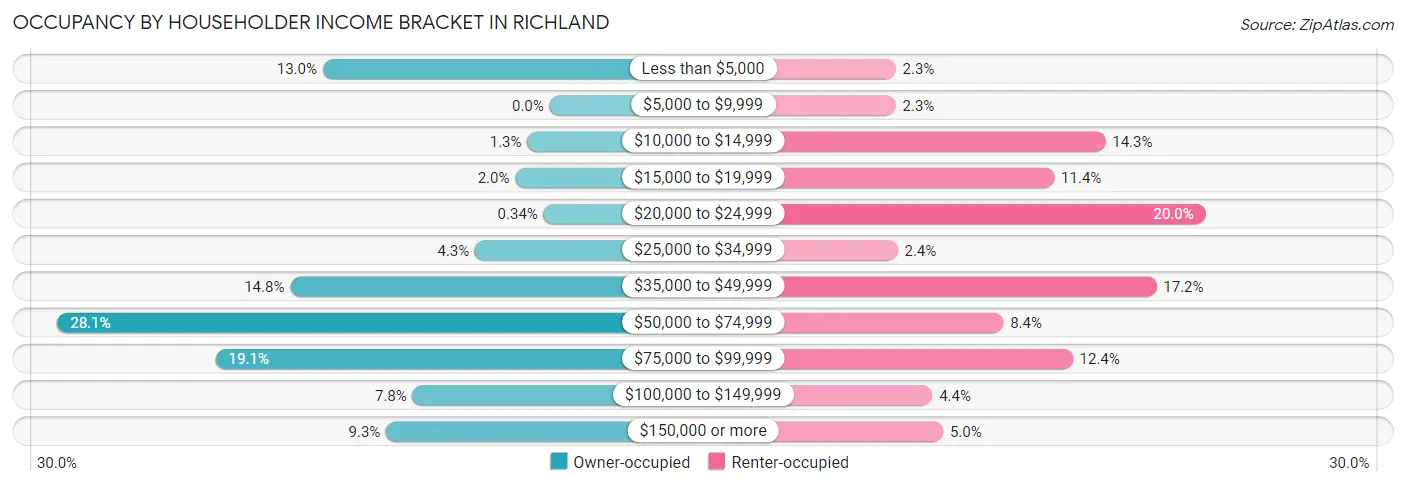
| Income Bracket | Owner-occupied | Renter-occupied |
| Less than $5,000 | 265 (13.0%) | 22 (2.3%) |
| $5,000 to $9,999 | 0 (0.0%) | 22 (2.3%) |
| $10,000 to $14,999 | 26 (1.3%) | 137 (14.3%) |
| $15,000 to $19,999 | 40 (2.0%) | 109 (11.4%) |
| $20,000 to $24,999 | 7 (0.3%) | 192 (20.0%) |
| $25,000 to $34,999 | 87 (4.3%) | 23 (2.4%) |
| $35,000 to $49,999 | 303 (14.8%) | 165 (17.2%) |
| $50,000 to $74,999 | 575 (28.1%) | 81 (8.4%) |
| $75,000 to $99,999 | 390 (19.1%) | 119 (12.4%) |
| $100,000 to $149,999 | 160 (7.8%) | 42 (4.4%) |
| $150,000 or more | 191 (9.3%) | 48 (5.0%) |
| Total | 2,044 (100.0%) | 960 (100.0%) |
Monthly Housing Cost Tiers in Richland
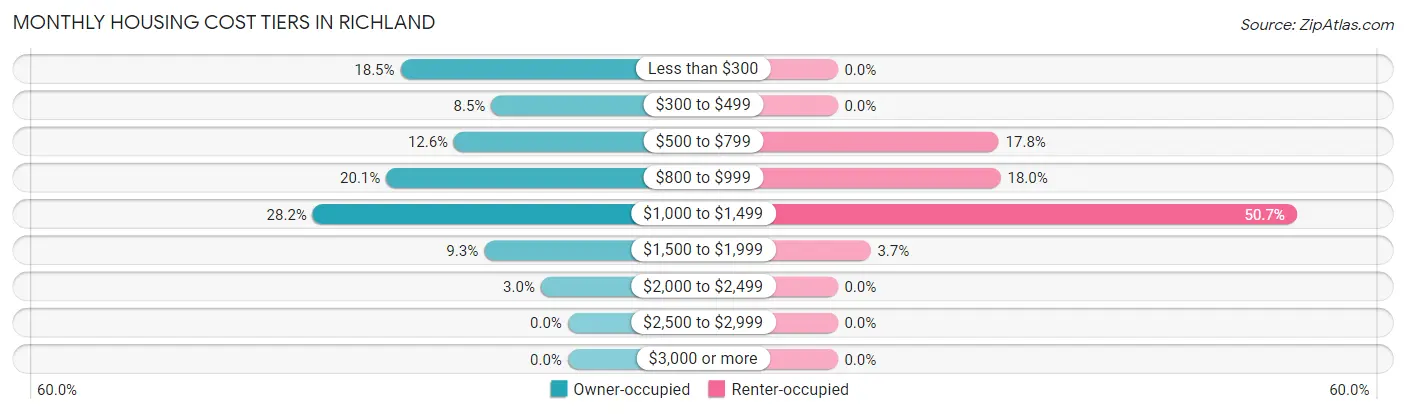
| Monthly Cost | Owner-occupied | Renter-occupied |
| Less than $300 | 378 (18.5%) | 0 (0.0%) |
| $300 to $499 | 173 (8.5%) | 0 (0.0%) |
| $500 to $799 | 257 (12.6%) | 171 (17.8%) |
| $800 to $999 | 410 (20.1%) | 173 (18.0%) |
| $1,000 to $1,499 | 576 (28.2%) | 487 (50.7%) |
| $1,500 to $1,999 | 189 (9.2%) | 35 (3.6%) |
| $2,000 to $2,499 | 61 (3.0%) | 0 (0.0%) |
| $2,500 to $2,999 | 0 (0.0%) | 0 (0.0%) |
| $3,000 or more | 0 (0.0%) | 0 (0.0%) |
| Total | 2,044 (100.0%) | 960 (100.0%) |
Physical Housing Characteristics in Richland
Housing Structures in Richland
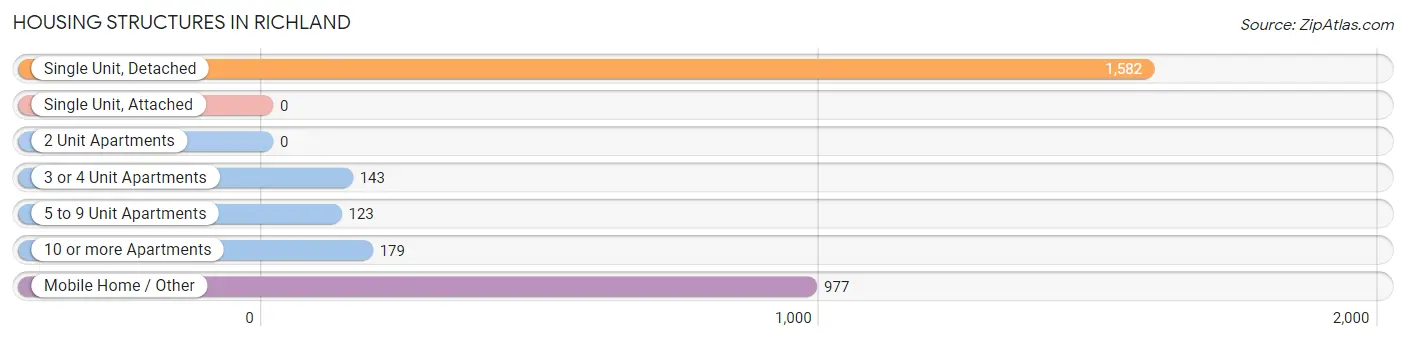
| Structure Type | # Housing Units | % Housing Units |
| Single Unit, Detached | 1,582 | 52.7% |
| Single Unit, Attached | 0 | 0.0% |
| 2 Unit Apartments | 0 | 0.0% |
| 3 or 4 Unit Apartments | 143 | 4.8% |
| 5 to 9 Unit Apartments | 123 | 4.1% |
| 10 or more Apartments | 179 | 6.0% |
| Mobile Home / Other | 977 | 32.5% |
| Total | 3,004 | 100.0% |
Housing Structures by Occupancy in Richland
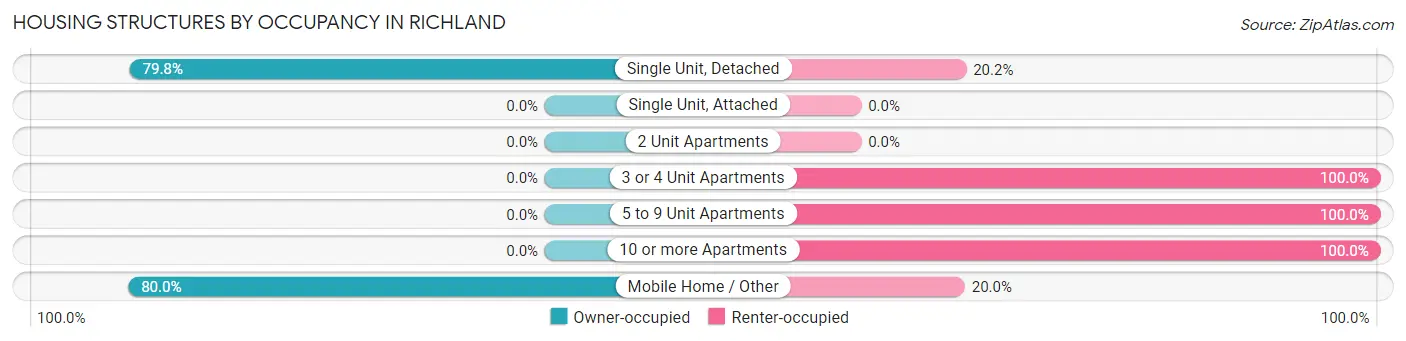
| Structure Type | Owner-occupied | Renter-occupied |
| Single Unit, Detached | 1,262 (79.8%) | 320 (20.2%) |
| Single Unit, Attached | 0 (0.0%) | 0 (0.0%) |
| 2 Unit Apartments | 0 (0.0%) | 0 (0.0%) |
| 3 or 4 Unit Apartments | 0 (0.0%) | 143 (100.0%) |
| 5 to 9 Unit Apartments | 0 (0.0%) | 123 (100.0%) |
| 10 or more Apartments | 0 (0.0%) | 179 (100.0%) |
| Mobile Home / Other | 782 (80.0%) | 195 (20.0%) |
| Total | 2,044 (68.0%) | 960 (32.0%) |
Housing Structures by Number of Rooms in Richland
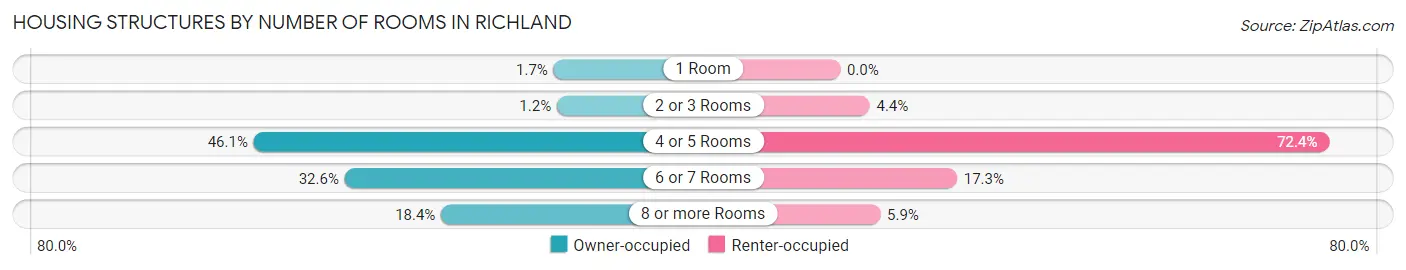
| Number of Rooms | Owner-occupied | Renter-occupied |
| 1 Room | 35 (1.7%) | 0 (0.0%) |
| 2 or 3 Rooms | 25 (1.2%) | 42 (4.4%) |
| 4 or 5 Rooms | 942 (46.1%) | 695 (72.4%) |
| 6 or 7 Rooms | 667 (32.6%) | 166 (17.3%) |
| 8 or more Rooms | 375 (18.3%) | 57 (5.9%) |
| Total | 2,044 (100.0%) | 960 (100.0%) |
Housing Structure by Heating Type in Richland
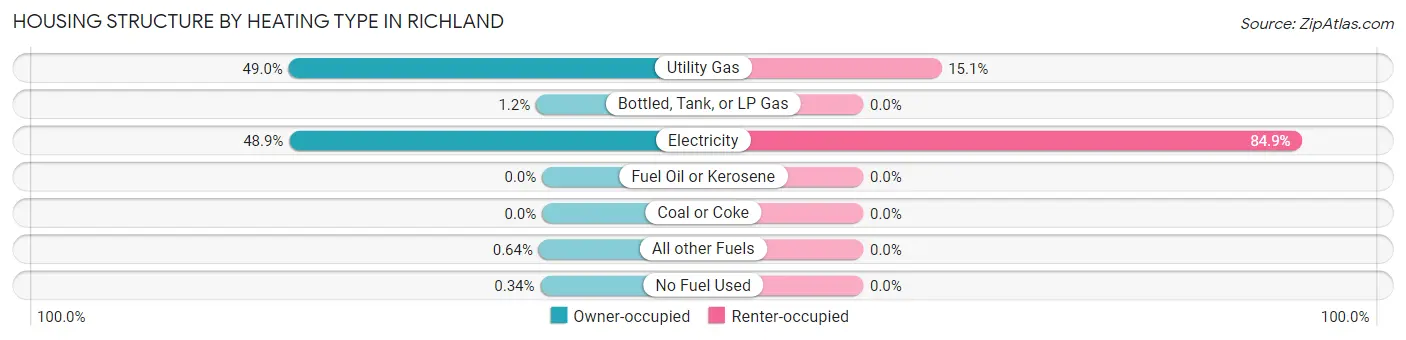
| Heating Type | Owner-occupied | Renter-occupied |
| Utility Gas | 1,001 (49.0%) | 145 (15.1%) |
| Bottled, Tank, or LP Gas | 24 (1.2%) | 0 (0.0%) |
| Electricity | 999 (48.9%) | 815 (84.9%) |
| Fuel Oil or Kerosene | 0 (0.0%) | 0 (0.0%) |
| Coal or Coke | 0 (0.0%) | 0 (0.0%) |
| All other Fuels | 13 (0.6%) | 0 (0.0%) |
| No Fuel Used | 7 (0.3%) | 0 (0.0%) |
| Total | 2,044 (100.0%) | 960 (100.0%) |
Household Vehicle Usage in Richland
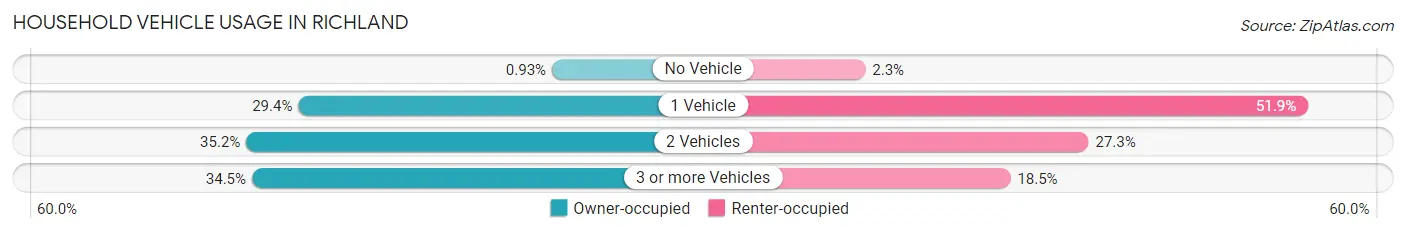
| Vehicles per Household | Owner-occupied | Renter-occupied |
| No Vehicle | 19 (0.9%) | 22 (2.3%) |
| 1 Vehicle | 600 (29.3%) | 498 (51.9%) |
| 2 Vehicles | 719 (35.2%) | 262 (27.3%) |
| 3 or more Vehicles | 706 (34.5%) | 178 (18.5%) |
| Total | 2,044 (100.0%) | 960 (100.0%) |
Real Estate & Mortgages in Richland
Real Estate and Mortgage Overview in Richland
| Characteristic | Without Mortgage | With Mortgage |
| Housing Units | 781 | 1,263 |
| Median Property Value | $35,200 | $163,700 |
| Median Household Income | $53,977 | $130 |
| Monthly Housing Costs | $326 | $0 |
| Real Estate Taxes | $351 | $94 |
Property Value by Mortgage Status in Richland
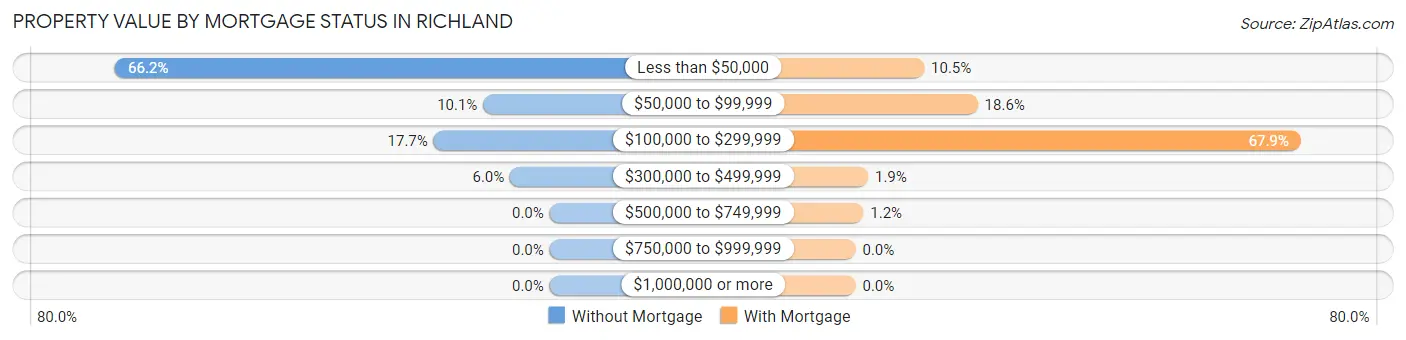
| Property Value | Without Mortgage | With Mortgage |
| Less than $50,000 | 517 (66.2%) | 132 (10.4%) |
| $50,000 to $99,999 | 79 (10.1%) | 235 (18.6%) |
| $100,000 to $299,999 | 138 (17.7%) | 857 (67.8%) |
| $300,000 to $499,999 | 47 (6.0%) | 24 (1.9%) |
| $500,000 to $749,999 | 0 (0.0%) | 15 (1.2%) |
| $750,000 to $999,999 | 0 (0.0%) | 0 (0.0%) |
| $1,000,000 or more | 0 (0.0%) | 0 (0.0%) |
| Total | 781 (100.0%) | 1,263 (100.0%) |
Household Income by Mortgage Status in Richland
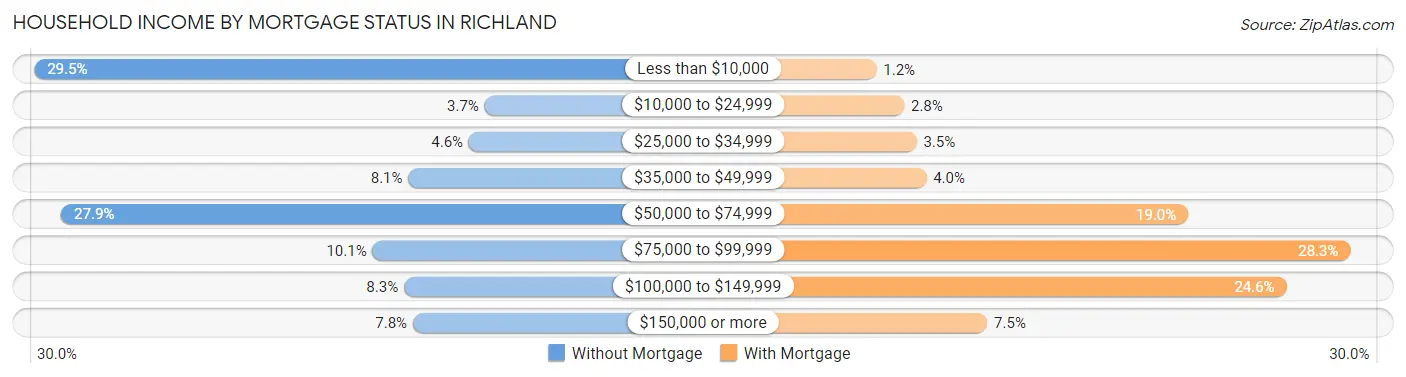
| Household Income | Without Mortgage | With Mortgage |
| Less than $10,000 | 230 (29.4%) | 15 (1.2%) |
| $10,000 to $24,999 | 29 (3.7%) | 35 (2.8%) |
| $25,000 to $34,999 | 36 (4.6%) | 44 (3.5%) |
| $35,000 to $49,999 | 63 (8.1%) | 51 (4.0%) |
| $50,000 to $74,999 | 218 (27.9%) | 240 (19.0%) |
| $75,000 to $99,999 | 79 (10.1%) | 357 (28.3%) |
| $100,000 to $149,999 | 65 (8.3%) | 311 (24.6%) |
| $150,000 or more | 61 (7.8%) | 95 (7.5%) |
| Total | 781 (100.0%) | 1,263 (100.0%) |
Property Value to Household Income Ratio in Richland
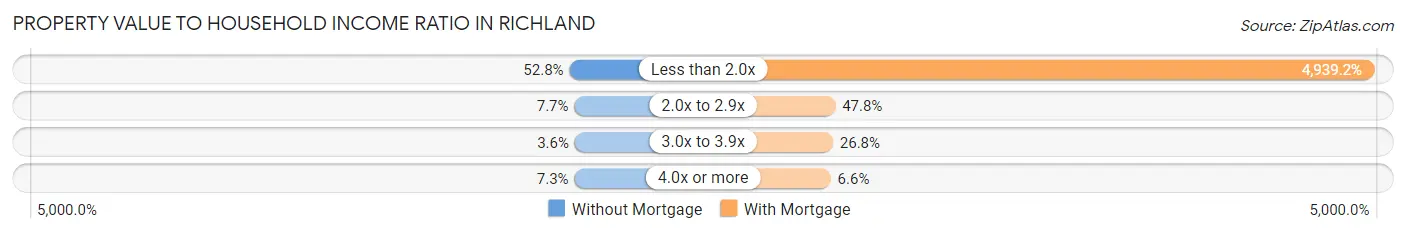
| Value-to-Income Ratio | Without Mortgage | With Mortgage |
| Less than 2.0x | 412 (52.7%) | 62,382 (4,939.2%) |
| 2.0x to 2.9x | 60 (7.7%) | 604 (47.8%) |
| 3.0x to 3.9x | 28 (3.6%) | 338 (26.8%) |
| 4.0x or more | 57 (7.3%) | 83 (6.6%) |
| Total | 781 (100.0%) | 1,263 (100.0%) |
Real Estate Taxes by Mortgage Status in Richland
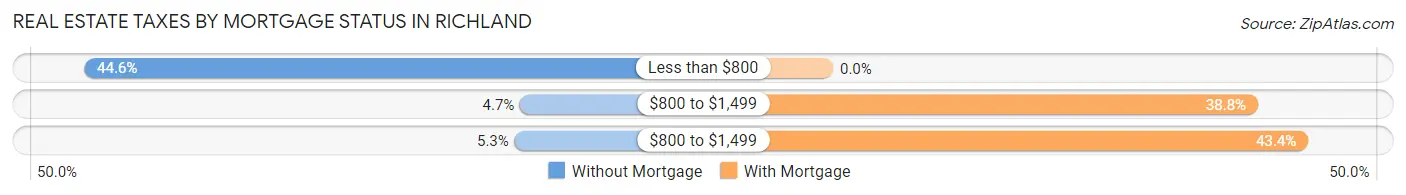
| Property Taxes | Without Mortgage | With Mortgage |
| Less than $800 | 348 (44.6%) | 0 (0.0%) |
| $800 to $1,499 | 37 (4.7%) | 490 (38.8%) |
| $800 to $1,499 | 41 (5.2%) | 548 (43.4%) |
| Total | 781 (100.0%) | 1,263 (100.0%) |
Health & Disability in Richland
Health Insurance Coverage by Age in Richland
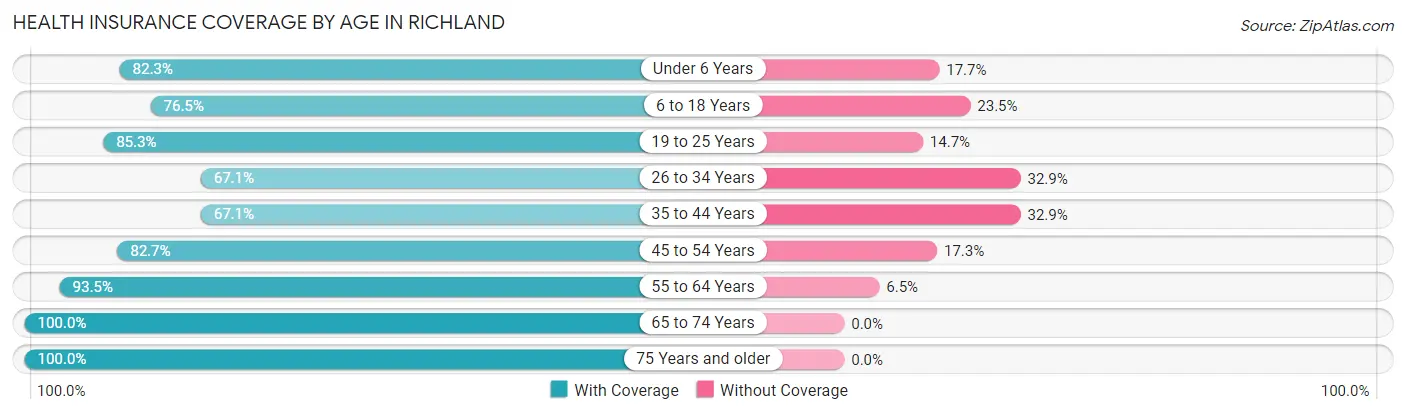
| Age Bracket | With Coverage | Without Coverage |
| Under 6 Years | 376 (82.3%) | 81 (17.7%) |
| 6 to 18 Years | 1,041 (76.5%) | 320 (23.5%) |
| 19 to 25 Years | 460 (85.3%) | 79 (14.7%) |
| 26 to 34 Years | 711 (67.1%) | 348 (32.9%) |
| 35 to 44 Years | 523 (67.1%) | 256 (32.9%) |
| 45 to 54 Years | 928 (82.7%) | 194 (17.3%) |
| 55 to 64 Years | 629 (93.5%) | 44 (6.5%) |
| 65 to 74 Years | 779 (100.0%) | 0 (0.0%) |
| 75 Years and older | 390 (100.0%) | 0 (0.0%) |
| Total | 5,837 (81.5%) | 1,322 (18.5%) |
Health Insurance Coverage by Citizenship Status in Richland
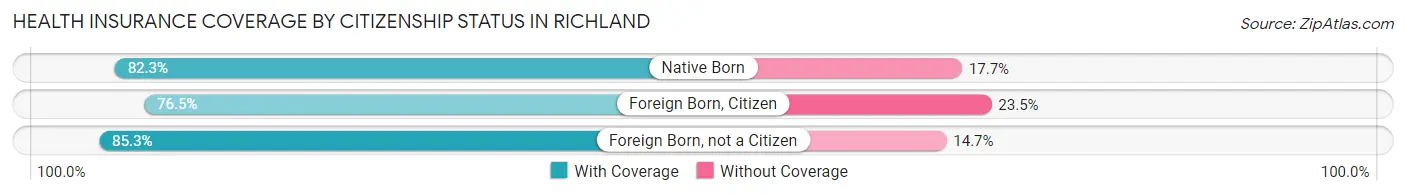
| Citizenship Status | With Coverage | Without Coverage |
| Native Born | 376 (82.3%) | 81 (17.7%) |
| Foreign Born, Citizen | 1,041 (76.5%) | 320 (23.5%) |
| Foreign Born, not a Citizen | 460 (85.3%) | 79 (14.7%) |
Health Insurance Coverage by Household Income in Richland
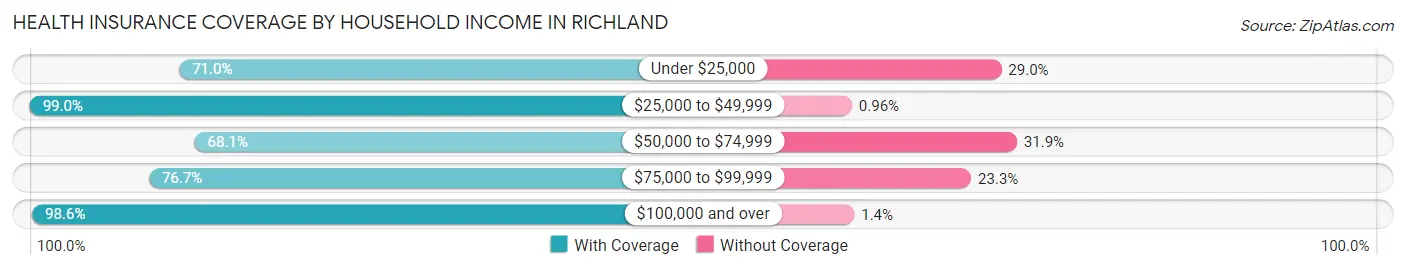
| Household Income | With Coverage | Without Coverage |
| Under $25,000 | 1,052 (71.0%) | 429 (29.0%) |
| $25,000 to $49,999 | 1,346 (99.0%) | 13 (1.0%) |
| $50,000 to $74,999 | 1,118 (68.1%) | 523 (31.9%) |
| $75,000 to $99,999 | 1,119 (76.7%) | 340 (23.3%) |
| $100,000 and over | 1,198 (98.6%) | 17 (1.4%) |
Public vs Private Health Insurance Coverage by Age in Richland
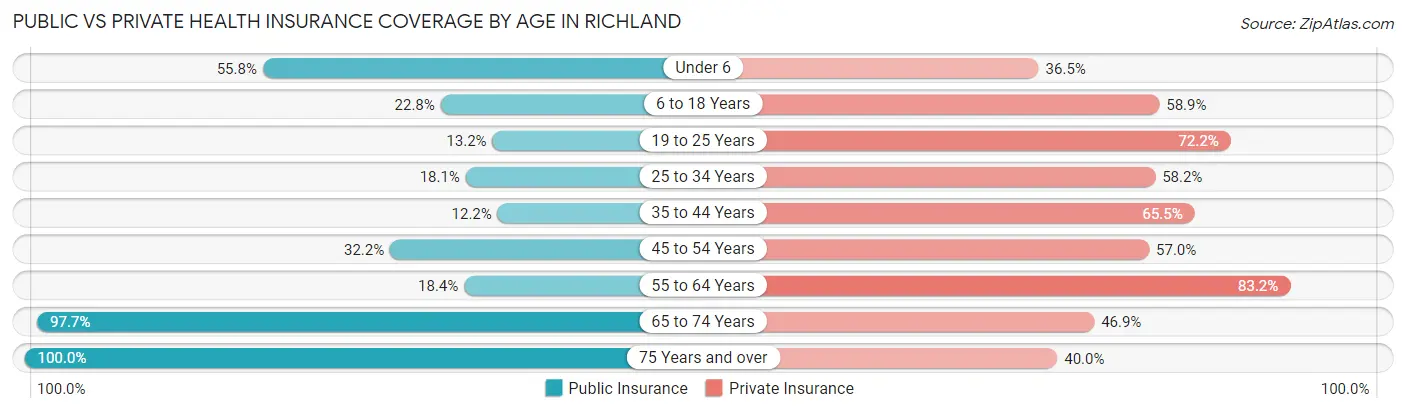
| Age Bracket | Public Insurance | Private Insurance |
| Under 6 | 255 (55.8%) | 167 (36.5%) |
| 6 to 18 Years | 310 (22.8%) | 802 (58.9%) |
| 19 to 25 Years | 71 (13.2%) | 389 (72.2%) |
| 25 to 34 Years | 192 (18.1%) | 616 (58.2%) |
| 35 to 44 Years | 95 (12.2%) | 510 (65.5%) |
| 45 to 54 Years | 361 (32.2%) | 640 (57.0%) |
| 55 to 64 Years | 124 (18.4%) | 560 (83.2%) |
| 65 to 74 Years | 761 (97.7%) | 365 (46.9%) |
| 75 Years and over | 390 (100.0%) | 156 (40.0%) |
| Total | 2,559 (35.7%) | 4,205 (58.7%) |
Disability Status by Sex by Age in Richland
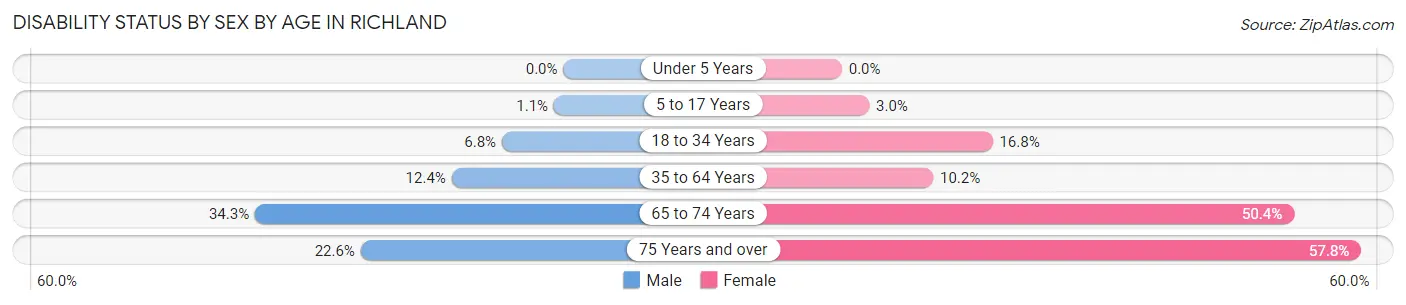
| Age Bracket | Male | Female |
| Under 5 Years | 0 (0.0%) | 0 (0.0%) |
| 5 to 17 Years | 8 (1.1%) | 15 (3.0%) |
| 18 to 34 Years | 59 (6.8%) | 149 (16.8%) |
| 35 to 64 Years | 161 (12.4%) | 130 (10.2%) |
| 65 to 74 Years | 125 (34.3%) | 209 (50.4%) |
| 75 Years and over | 65 (22.6%) | 59 (57.8%) |
Disability Class by Sex by Age in Richland
Disability Class: Hearing Difficulty
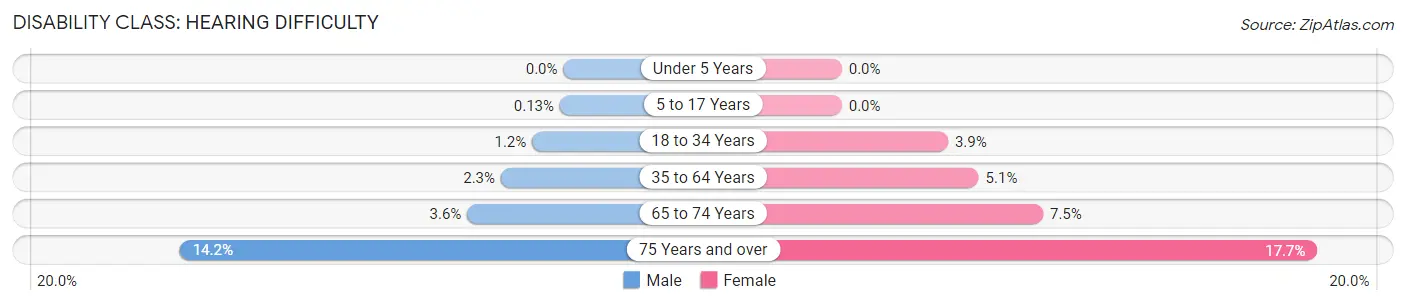
| Age Bracket | Male | Female |
| Under 5 Years | 0 (0.0%) | 0 (0.0%) |
| 5 to 17 Years | 1 (0.1%) | 0 (0.0%) |
| 18 to 34 Years | 10 (1.2%) | 35 (3.9%) |
| 35 to 64 Years | 30 (2.3%) | 65 (5.1%) |
| 65 to 74 Years | 13 (3.6%) | 31 (7.5%) |
| 75 Years and over | 41 (14.2%) | 18 (17.6%) |
Disability Class: Vision Difficulty
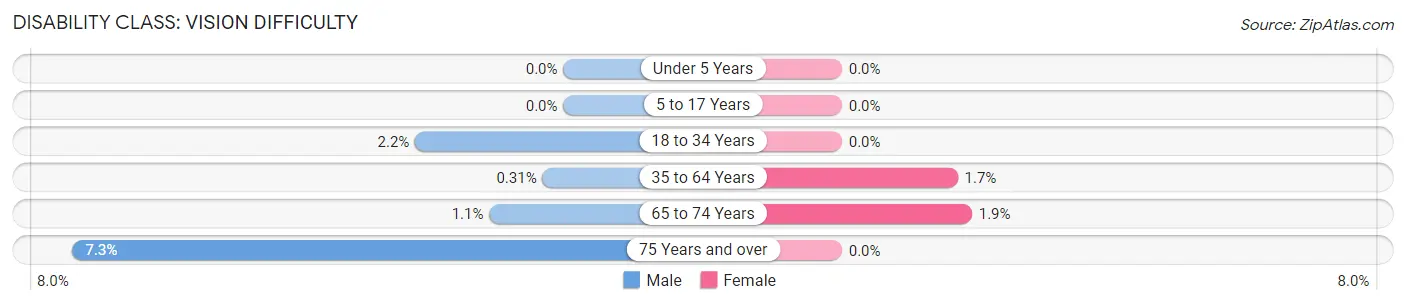
| Age Bracket | Male | Female |
| Under 5 Years | 0 (0.0%) | 0 (0.0%) |
| 5 to 17 Years | 0 (0.0%) | 0 (0.0%) |
| 18 to 34 Years | 19 (2.2%) | 0 (0.0%) |
| 35 to 64 Years | 4 (0.3%) | 22 (1.7%) |
| 65 to 74 Years | 4 (1.1%) | 8 (1.9%) |
| 75 Years and over | 21 (7.3%) | 0 (0.0%) |
Disability Class: Cognitive Difficulty
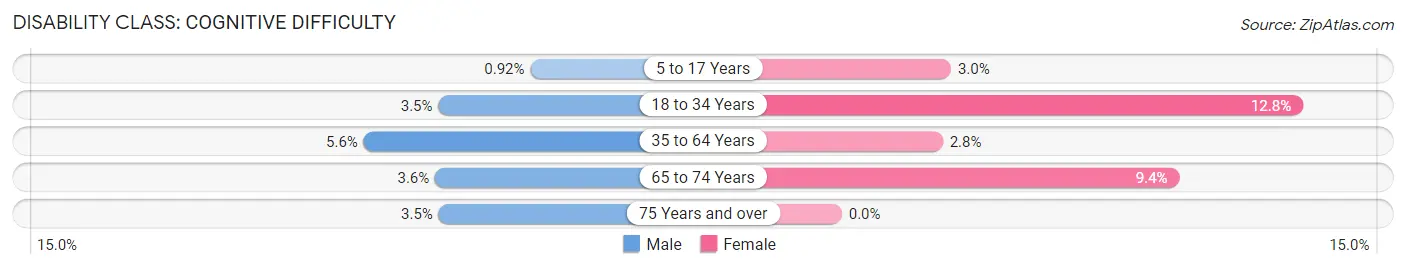
| Age Bracket | Male | Female |
| 5 to 17 Years | 7 (0.9%) | 15 (3.0%) |
| 18 to 34 Years | 30 (3.5%) | 114 (12.8%) |
| 35 to 64 Years | 72 (5.6%) | 36 (2.8%) |
| 65 to 74 Years | 13 (3.6%) | 39 (9.4%) |
| 75 Years and over | 10 (3.5%) | 0 (0.0%) |
Disability Class: Ambulatory Difficulty
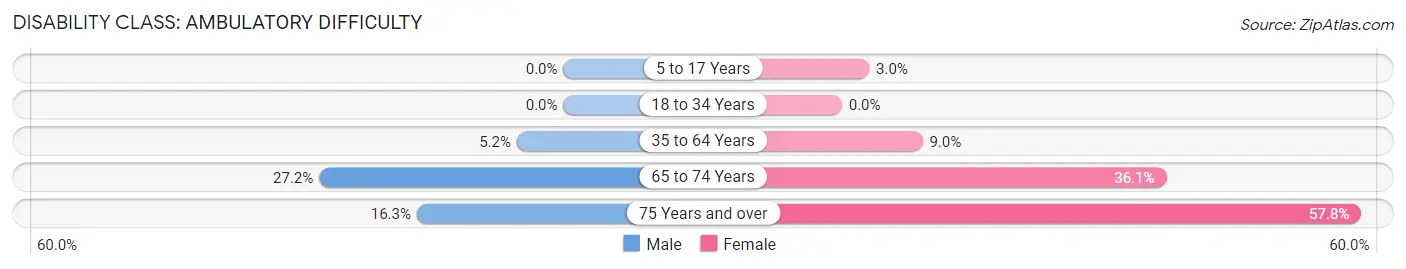
| Age Bracket | Male | Female |
| 5 to 17 Years | 0 (0.0%) | 15 (3.0%) |
| 18 to 34 Years | 0 (0.0%) | 0 (0.0%) |
| 35 to 64 Years | 67 (5.2%) | 115 (9.0%) |
| 65 to 74 Years | 99 (27.2%) | 150 (36.1%) |
| 75 Years and over | 47 (16.3%) | 59 (57.8%) |
Disability Class: Self-Care Difficulty
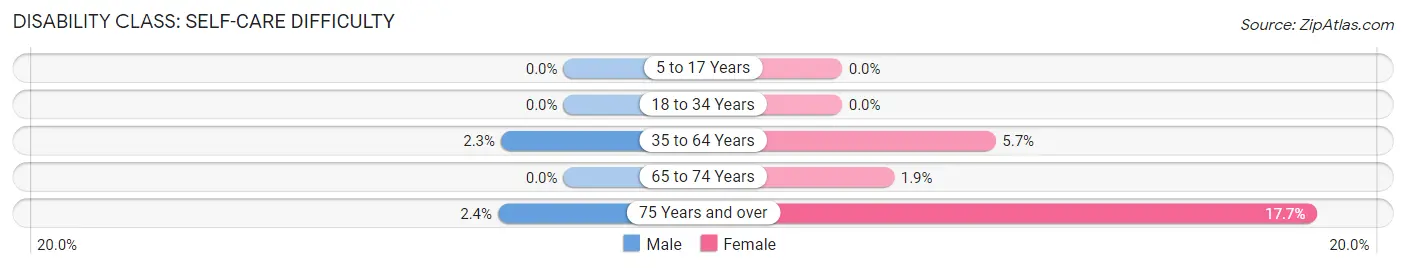
| Age Bracket | Male | Female |
| 5 to 17 Years | 0 (0.0%) | 0 (0.0%) |
| 18 to 34 Years | 0 (0.0%) | 0 (0.0%) |
| 35 to 64 Years | 30 (2.3%) | 73 (5.7%) |
| 65 to 74 Years | 0 (0.0%) | 8 (1.9%) |
| 75 Years and over | 7 (2.4%) | 18 (17.6%) |
Technology Access in Richland
Computing Device Access in Richland
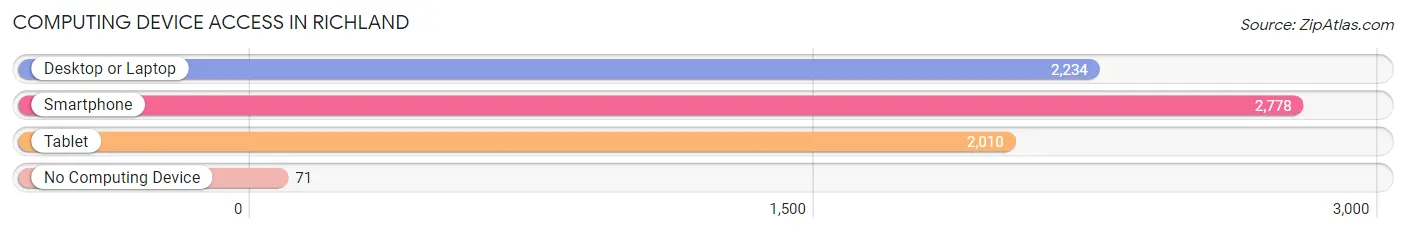
| Device Type | # Households | % Households |
| Desktop or Laptop | 2,234 | 74.4% |
| Smartphone | 2,778 | 92.5% |
| Tablet | 2,010 | 66.9% |
| No Computing Device | 71 | 2.4% |
| Total | 3,004 | 100.0% |
Internet Access in Richland
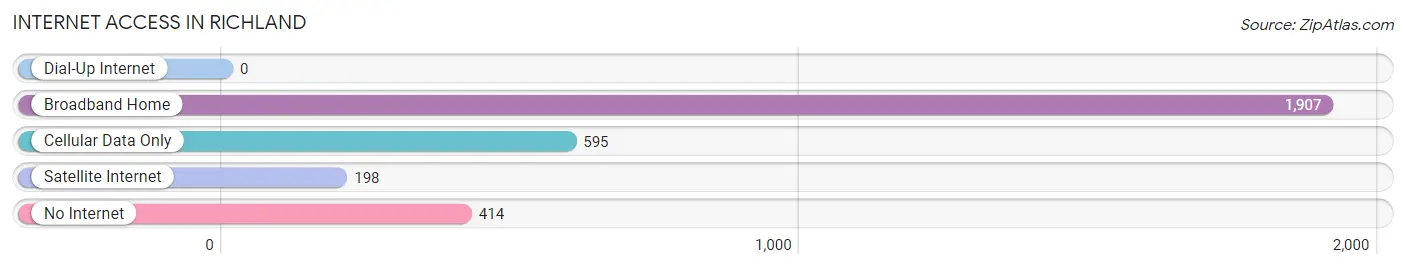
| Internet Type | # Households | % Households |
| Dial-Up Internet | 0 | 0.0% |
| Broadband Home | 1,907 | 63.5% |
| Cellular Data Only | 595 | 19.8% |
| Satellite Internet | 198 | 6.6% |
| No Internet | 414 | 13.8% |
| Total | 3,004 | 100.0% |
Richland Summary
Richland, Mississippi is a small city located in Rankin County, Mississippi. It is part of the Jackson Metropolitan Statistical Area and is located approximately 20 miles east of the state capital, Jackson. The city has a population of approximately 8,000 people and is known for its small-town charm and friendly atmosphere.
History
Richland was founded in 1837 by a group of settlers from Georgia and Alabama. The town was originally known as “Richland Station” and was a stop on the Mississippi Central Railroad. The town was officially incorporated in 1858 and was named after the rich soil in the area.
In the late 19th century, Richland was a thriving agricultural community. The town was home to several cotton plantations and was a major producer of cotton and other agricultural products. The town also had several stores, churches, and other businesses.
In the early 20th century, Richland began to experience a decline in population as many of its residents moved away to larger cities. The town was also affected by the Great Depression and World War II. After the war, the town began to experience a resurgence in population and economic activity.
Geography
Richland is located in Rankin County, Mississippi. The city is situated on the banks of the Pearl River and is surrounded by rolling hills and forests. The city has a total area of 4.2 square miles and is located approximately 20 miles east of the state capital, Jackson.
The climate in Richland is humid subtropical, with hot, humid summers and mild winters. The average annual temperature is around 70 degrees Fahrenheit. The average annual precipitation is around 50 inches.
Economy
Richland’s economy is largely based on agriculture and manufacturing. The city is home to several large agricultural operations, including cotton, soybeans, and corn. The city is also home to several manufacturing companies, including furniture, textiles, and automotive parts.
The city is also home to several retail stores, restaurants, and other businesses. The city is served by the Rankin County School District and is home to several schools, including Richland High School.
Demographics
As of the 2010 census, Richland had a population of 8,000 people. The racial makeup of the city was 79.3% White, 17.7% African American, 0.3% Native American, 0.7% Asian, 0.1% Pacific Islander, and 1.8% from other races. Hispanic or Latino of any race were 2.2% of the population.
The median income for a household in Richland was $37,500, and the median income for a family was $45,000. The per capita income for the city was $19,000. About 17.7% of families and 20.3% of the population were below the poverty line, including 28.3% of those under age 18 and 11.7% of those age 65 or over.
Richland is a small city with a rich history and a friendly atmosphere. The city is home to several businesses and is a major producer of agricultural products. The city is served by the Rankin County School District and is home to several schools. The city has a diverse population and a median income that is slightly below the national average.
Common Questions
What is Per Capita Income in Richland?
Per Capita income in Richland is $28,672.
What is the Median Family Income in Richland?
Median Family Income in Richland is $65,279.
What is the Median Household income in Richland?
Median Household Income in Richland is $54,753.
What is Income or Wage Gap in Richland?
Income or Wage Gap in Richland is 35.6%.
Women in Richland earn 64.4 cents for every dollar earned by a man.
What is Inequality or Gini Index in Richland?
Inequality or Gini Index in Richland is 0.49.
What is the Total Population of Richland?
Total Population of Richland is 7,208.
What is the Total Male Population of Richland?
Total Male Population of Richland is 3,769.
What is the Total Female Population of Richland?
Total Female Population of Richland is 3,439.
What is the Ratio of Males per 100 Females in Richland?
There are 109.60 Males per 100 Females in Richland.
What is the Ratio of Females per 100 Males in Richland?
There are 91.24 Females per 100 Males in Richland.
What is the Median Population Age in Richland?
Median Population Age in Richland is 37.1 Years.
What is the Average Family Size in Richland
Average Family Size in Richland is 2.9 People.
What is the Average Household Size in Richland
Average Household Size in Richland is 2.4 People.
How Large is the Labor Force in Richland?
There are 3,656 People in the Labor Forcein in Richland.
What is the Percentage of People in the Labor Force in Richland?
61.7% of People are in the Labor Force in Richland.
What is the Unemployment Rate in Richland?
Unemployment Rate in Richland is 4.2%.