Zip Codes with the Highest Percentage of Population Employed in Architecture & Engineering in Pascagoula, MS
RELATED REPORTS & OPTIONS
Architecture & Engineering
Pascagoula
Compare Zip Codes
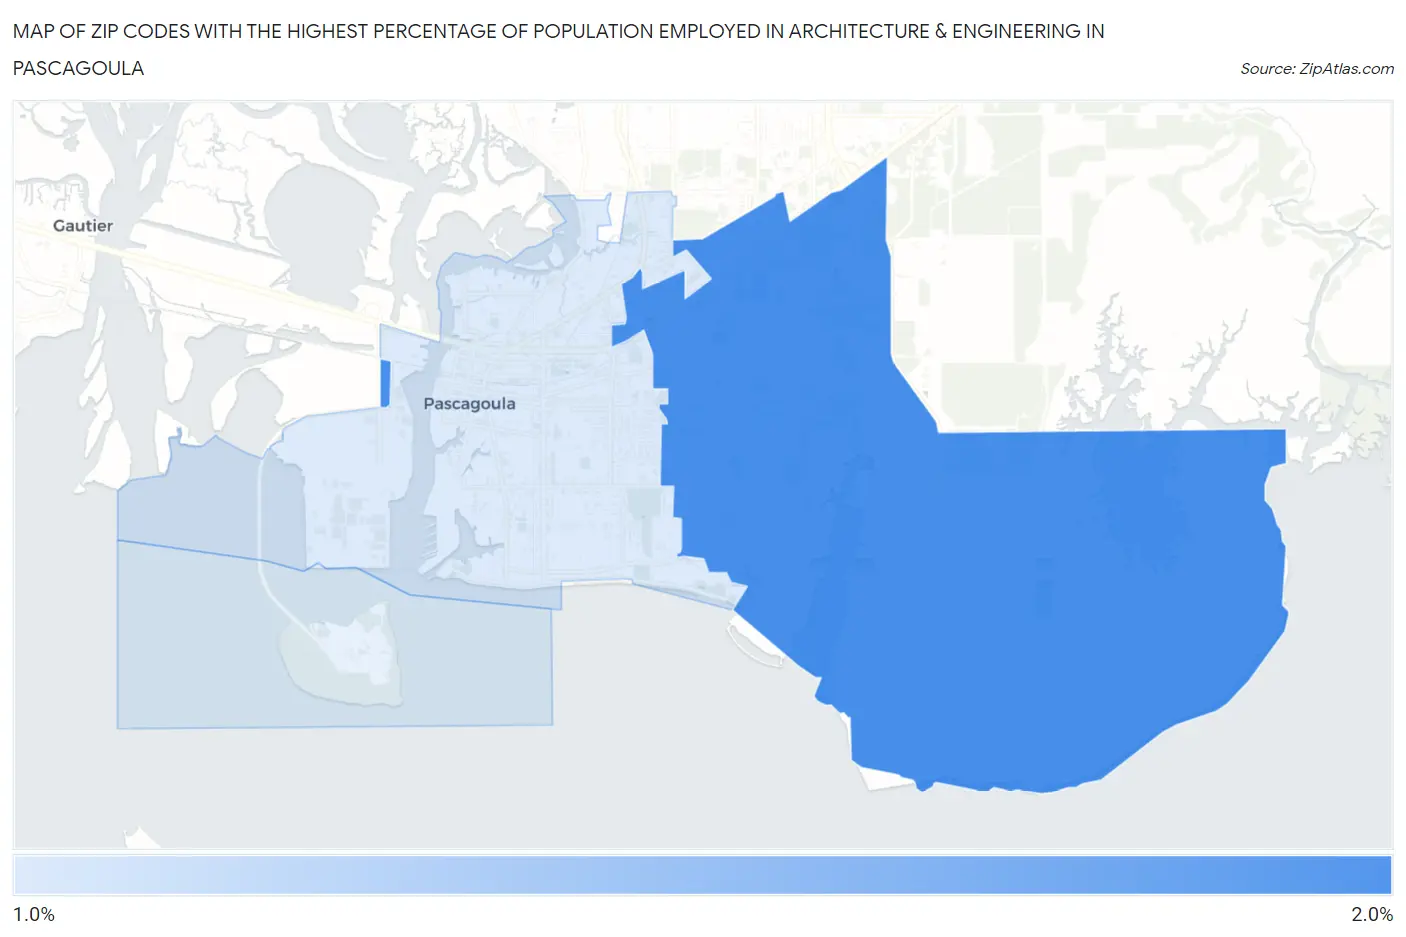
Map of Zip Codes with the Highest Percentage of Population Employed in Architecture & Engineering in Pascagoula
1.7%
1.7%
Zip Codes with the Highest Percentage of Population Employed in Architecture & Engineering in Pascagoula, MS
| Zip Code | % Employed | vs State | vs National | |
| 1. | 39581 | 1.7% | 1.5%(+0.177)#92 | 2.1%(-0.484)#11,736 |
| 2. | 39567 | 1.7% | 1.5%(+0.171)#93 | 2.1%(-0.491)#11,777 |
1
Common Questions
What are the Top Zip Codes with the Highest Percentage of Population Employed in Architecture & Engineering in Pascagoula, MS?
Top Zip Codes with the Highest Percentage of Population Employed in Architecture & Engineering in Pascagoula, MS are:
What zip code has the Highest Percentage of Population Employed in Architecture & Engineering in Pascagoula, MS?
39581 has the Highest Percentage of Population Employed in Architecture & Engineering in Pascagoula, MS with 1.7%.
What is the Percentage of Population Employed in Architecture & Engineering in Pascagoula, MS?
Percentage of Population Employed in Architecture & Engineering in Pascagoula is 1.8%.
What is the Percentage of Population Employed in Architecture & Engineering in Mississippi?
Percentage of Population Employed in Architecture & Engineering in Mississippi is 1.5%.
What is the Percentage of Population Employed in Architecture & Engineering in the United States?
Percentage of Population Employed in Architecture & Engineering in the United States is 2.1%.