Zip Codes with the Highest Percentage of Population Employed in Architecture & Engineering in Columbus, MS
RELATED REPORTS & OPTIONS
Architecture & Engineering
Columbus
Compare Zip Codes
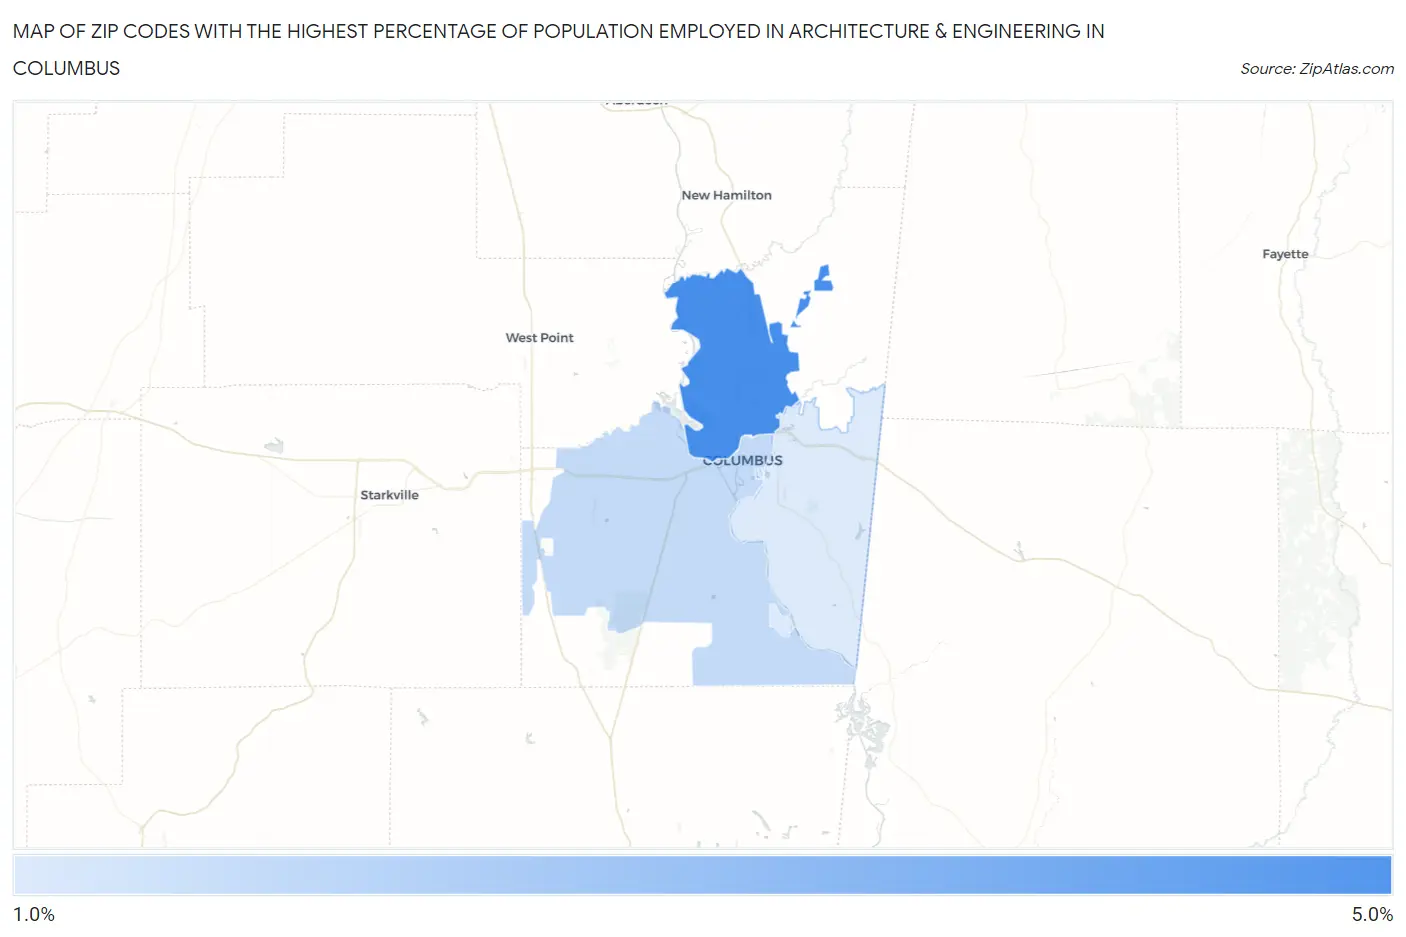
Map of Zip Codes with the Highest Percentage of Population Employed in Architecture & Engineering in Columbus
1.6%
5.0%
Zip Codes with the Highest Percentage of Population Employed in Architecture & Engineering in Columbus, MS
| Zip Code | % Employed | vs State | vs National | |
| 1. | 39705 | 5.0% | 1.5%(+3.51)#19 | 2.1%(+2.85)#1,662 |
| 2. | 39701 | 2.2% | 1.5%(+0.728)#59 | 2.1%(+0.066)#8,403 |
| 3. | 39702 | 1.6% | 1.5%(+0.147)#96 | 2.1%(-0.515)#11,947 |
1
Common Questions
What are the Top Zip Codes with the Highest Percentage of Population Employed in Architecture & Engineering in Columbus, MS?
Top Zip Codes with the Highest Percentage of Population Employed in Architecture & Engineering in Columbus, MS are:
What zip code has the Highest Percentage of Population Employed in Architecture & Engineering in Columbus, MS?
39705 has the Highest Percentage of Population Employed in Architecture & Engineering in Columbus, MS with 5.0%.
What is the Percentage of Population Employed in Architecture & Engineering in Columbus, MS?
Percentage of Population Employed in Architecture & Engineering in Columbus is 0.71%.
What is the Percentage of Population Employed in Architecture & Engineering in Mississippi?
Percentage of Population Employed in Architecture & Engineering in Mississippi is 1.5%.
What is the Percentage of Population Employed in Architecture & Engineering in the United States?
Percentage of Population Employed in Architecture & Engineering in the United States is 2.1%.