Strafford, MO Map & Demographics
Strafford Map
Strafford Overview
$25,455
PER CAPITA INCOME
$72,477
AVG FAMILY INCOME
$57,266
AVG HOUSEHOLD INCOME
19.2%
WAGE / INCOME GAP [ % ]
80.8¢/ $1
WAGE / INCOME GAP [ $ ]
0.33
INEQUALITY / GINI INDEX
2,570
TOTAL POPULATION
1,237
MALE POPULATION
1,333
FEMALE POPULATION
92.80
MALES / 100 FEMALES
107.76
FEMALES / 100 MALES
35.3
MEDIAN AGE
3.2
AVG FAMILY SIZE
2.5
AVG HOUSEHOLD SIZE
1,199
LABOR FORCE [ PEOPLE ]
65.6%
PERCENT IN LABOR FORCE
2.7%
UNEMPLOYMENT RATE
Strafford Zip Codes
Strafford Area Codes
Income in Strafford
Income Overview in Strafford
Per Capita Income in Strafford is $25,455, while median incomes of families and households are $72,477 and $57,266 respectively.
| Characteristic | Number | Measure |
| Per Capita Income | 2,570 | $25,455 |
| Median Family Income | 643 | $72,477 |
| Mean Family Income | 643 | $77,446 |
| Median Household Income | 1,009 | $57,266 |
| Mean Household Income | 1,009 | $63,534 |
| Income Deficit | 643 | $0 |
| Wage / Income Gap (%) | 2,570 | 19.23% |
| Wage / Income Gap ($) | 2,570 | 80.77¢ per $1 |
| Gini / Inequality Index | 2,570 | 0.33 |
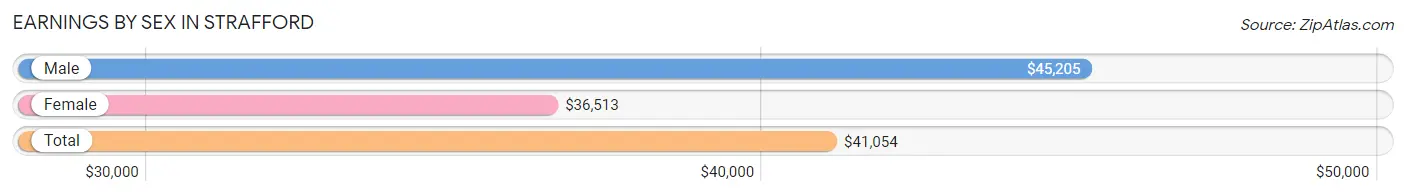
Earnings by Sex in Strafford
Average Earnings in Strafford are $41,054, $45,205 for men and $36,513 for women, a difference of 19.2%.
| Sex | Number | Average Earnings |
| Male | 622 (50.1%) | $45,205 |
| Female | 619 (49.9%) | $36,513 |
| Total | 1,241 (100.0%) | $41,054 |
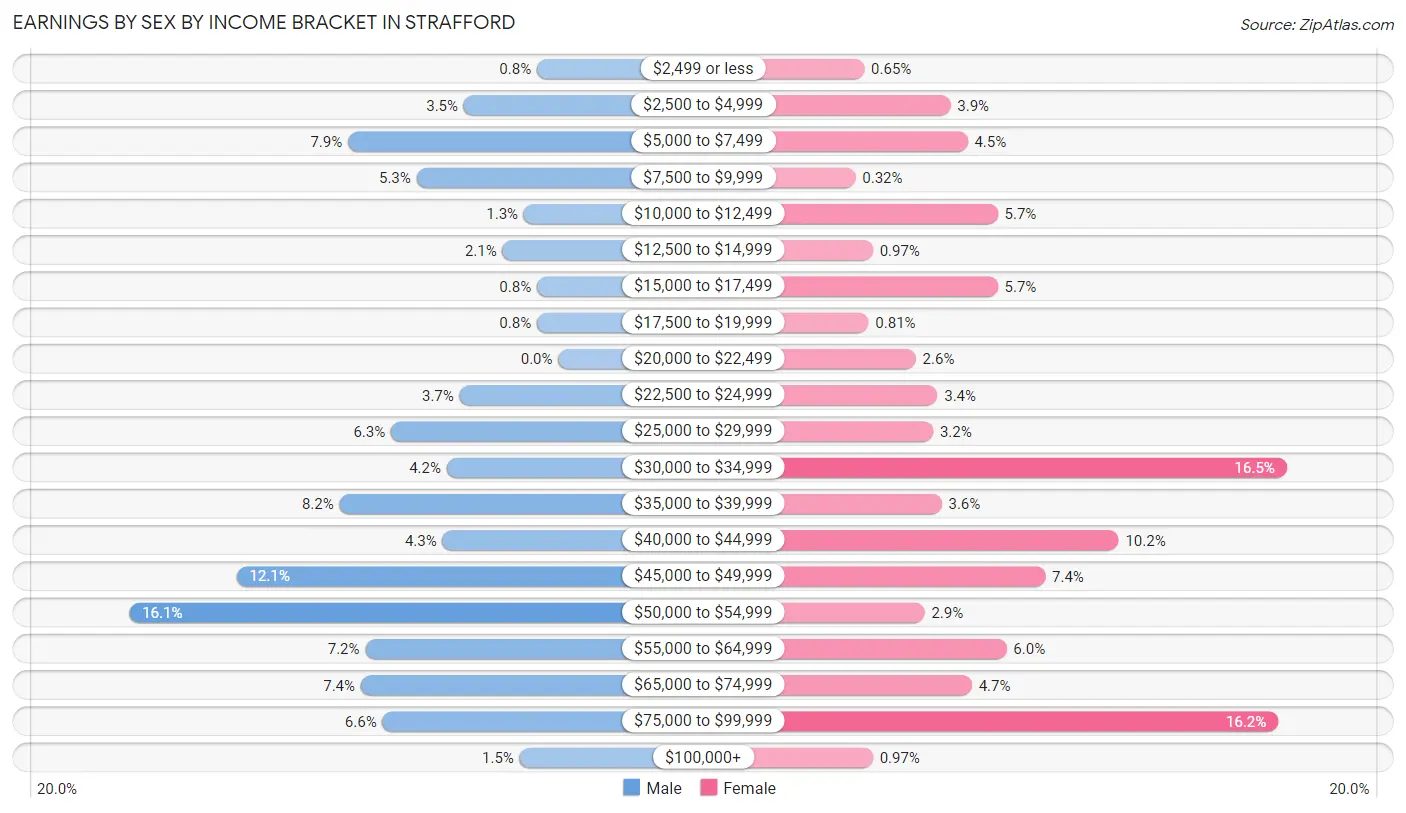
Earnings by Sex by Income Bracket in Strafford
The most common earnings brackets in Strafford are $50,000 to $54,999 for men (100 | 16.1%) and $30,000 to $34,999 for women (102 | 16.5%).
| Income | Male | Female |
| $2,499 or less | 5 (0.8%) | 4 (0.6%) |
| $2,500 to $4,999 | 22 (3.5%) | 24 (3.9%) |
| $5,000 to $7,499 | 49 (7.9%) | 28 (4.5%) |
| $7,500 to $9,999 | 33 (5.3%) | 2 (0.3%) |
| $10,000 to $12,499 | 8 (1.3%) | 35 (5.7%) |
| $12,500 to $14,999 | 13 (2.1%) | 6 (1.0%) |
| $15,000 to $17,499 | 5 (0.8%) | 35 (5.7%) |
| $17,500 to $19,999 | 5 (0.8%) | 5 (0.8%) |
| $20,000 to $22,499 | 0 (0.0%) | 16 (2.6%) |
| $22,500 to $24,999 | 23 (3.7%) | 21 (3.4%) |
| $25,000 to $29,999 | 39 (6.3%) | 20 (3.2%) |
| $30,000 to $34,999 | 26 (4.2%) | 102 (16.5%) |
| $35,000 to $39,999 | 51 (8.2%) | 22 (3.5%) |
| $40,000 to $44,999 | 27 (4.3%) | 63 (10.2%) |
| $45,000 to $49,999 | 75 (12.1%) | 46 (7.4%) |
| $50,000 to $54,999 | 100 (16.1%) | 18 (2.9%) |
| $55,000 to $64,999 | 45 (7.2%) | 37 (6.0%) |
| $65,000 to $74,999 | 46 (7.4%) | 29 (4.7%) |
| $75,000 to $99,999 | 41 (6.6%) | 100 (16.2%) |
| $100,000+ | 9 (1.5%) | 6 (1.0%) |
| Total | 622 (100.0%) | 619 (100.0%) |
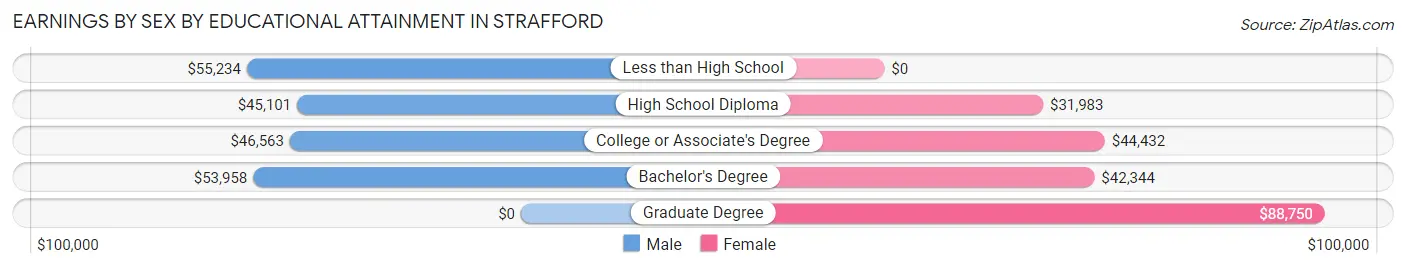
Earnings by Sex by Educational Attainment in Strafford
Average earnings in Strafford are $46,701 for men and $41,326 for women, a difference of 11.5%. Men with an educational attainment of less than high school enjoy the highest average annual earnings of $55,234, while those with high school diploma education earn the least with $45,101. Women with an educational attainment of graduate degree earn the most with the average annual earnings of $88,750, while those with high school diploma education have the smallest earnings of $31,983.
| Educational Attainment | Male Income | Female Income |
| Less than High School | $55,234 | $0 |
| High School Diploma | $45,101 | $31,983 |
| College or Associate's Degree | $46,563 | $44,432 |
| Bachelor's Degree | $53,958 | $42,344 |
| Graduate Degree | - | - |
| Total | $46,701 | $41,326 |
Family Income in Strafford
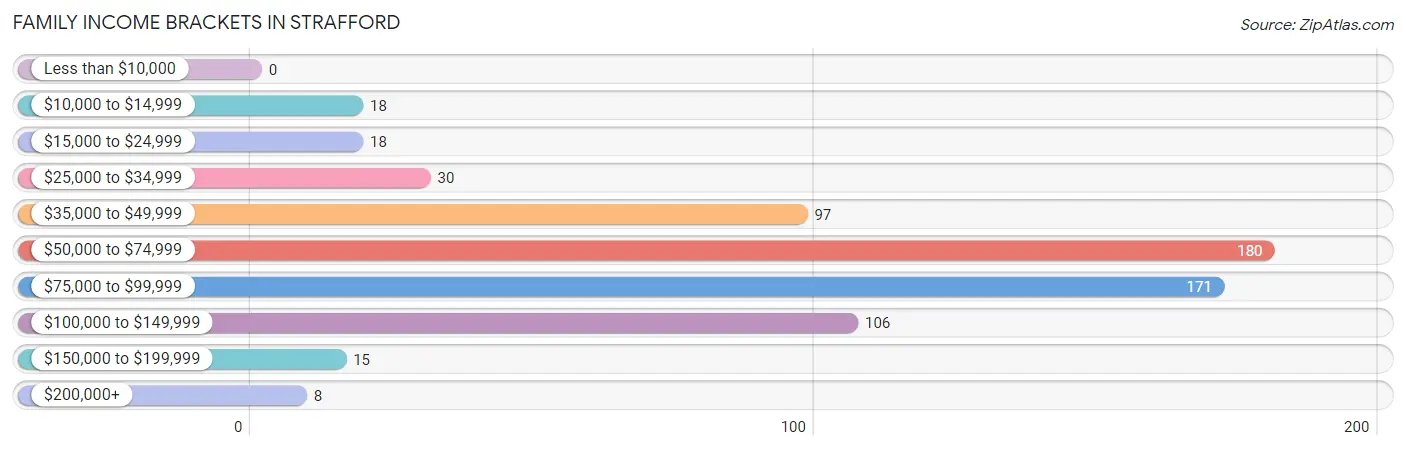
Family Income Brackets in Strafford
According to the Strafford family income data, there are 180 families falling into the $50,000 to $74,999 income range, which is the most common income bracket and makes up 28.0% of all families.
| Income Bracket | # Families | % Families |
| Less than $10,000 | 0 | 0.0% |
| $10,000 to $14,999 | 18 | 2.8% |
| $15,000 to $24,999 | 18 | 2.8% |
| $25,000 to $34,999 | 30 | 4.7% |
| $35,000 to $49,999 | 97 | 15.1% |
| $50,000 to $74,999 | 180 | 28.0% |
| $75,000 to $99,999 | 171 | 26.6% |
| $100,000 to $149,999 | 106 | 16.5% |
| $150,000 to $199,999 | 15 | 2.3% |
| $200,000+ | 8 | 1.2% |
Family Income by Famaliy Size in Strafford
4-person families (96 | 14.9%) account for the highest median family income in Strafford with $79,091 per family, while 2-person families (270 | 42.0%) have the highest median income of $35,970 per family member.

| Income Bracket | # Families | Median Income |
| 2-Person Families | 270 (42.0%) | $71,939 |
| 3-Person Families | 177 (27.5%) | $74,485 |
| 4-Person Families | 96 (14.9%) | $79,091 |
| 5-Person Families | 68 (10.6%) | $54,167 |
| 6-Person Families | 9 (1.4%) | $0 |
| 7+ Person Families | 23 (3.6%) | $0 |
| Total | 643 (100.0%) | $72,477 |
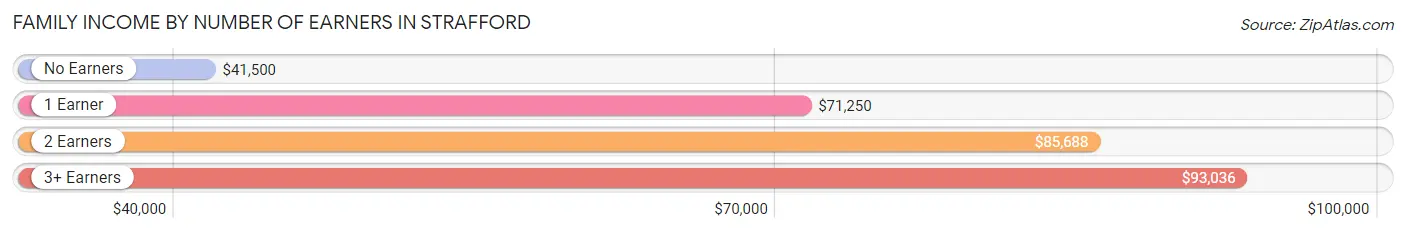
Family Income by Number of Earners in Strafford
The median family income in Strafford is $72,477, with families comprising 3+ earners (99) having the highest median family income of $93,036, while families with no earners (52) have the lowest median family income of $41,500, accounting for 15.4% and 8.1% of families, respectively.
| Number of Earners | # Families | Median Income |
| No Earners | 52 (8.1%) | $41,500 |
| 1 Earner | 277 (43.1%) | $71,250 |
| 2 Earners | 215 (33.4%) | $85,688 |
| 3+ Earners | 99 (15.4%) | $93,036 |
| Total | 643 (100.0%) | $72,477 |
Household Income in Strafford
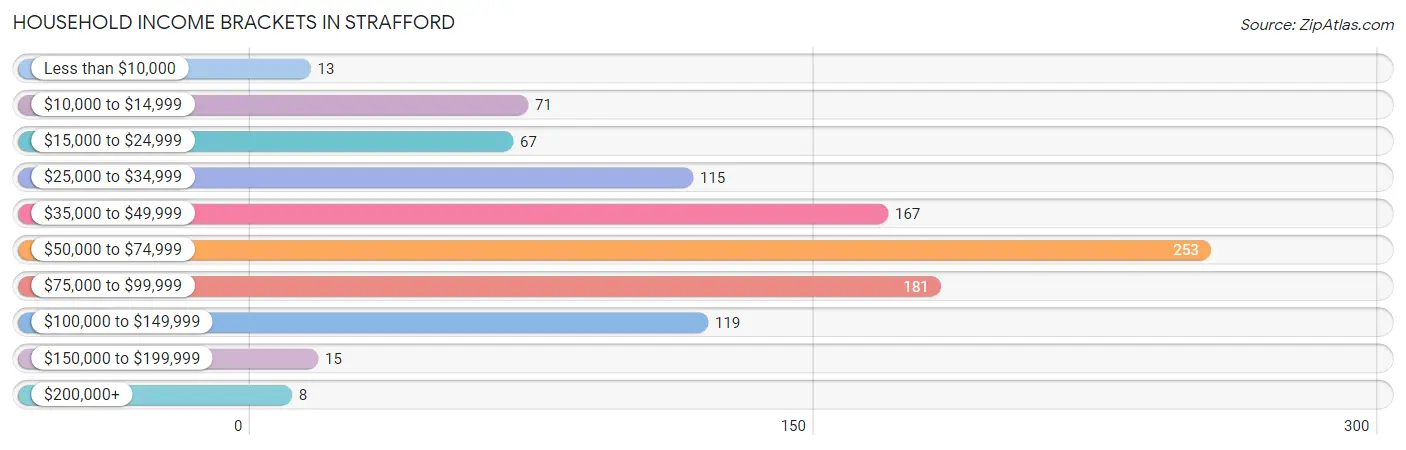
Household Income Brackets in Strafford
With 253 households falling in the category, the $50,000 to $74,999 income range is the most frequent in Strafford, accounting for 25.1% of all households. In contrast, only 8 households (0.8%) fall into the $200,000+ income bracket, making it the least populous group.
| Income Bracket | # Households | % Households |
| Less than $10,000 | 13 | 1.3% |
| $10,000 to $14,999 | 71 | 7.0% |
| $15,000 to $24,999 | 67 | 6.6% |
| $25,000 to $34,999 | 115 | 11.4% |
| $35,000 to $49,999 | 167 | 16.6% |
| $50,000 to $74,999 | 253 | 25.1% |
| $75,000 to $99,999 | 181 | 17.9% |
| $100,000 to $149,999 | 119 | 11.8% |
| $150,000 to $199,999 | 15 | 1.5% |
| $200,000+ | 8 | 0.8% |
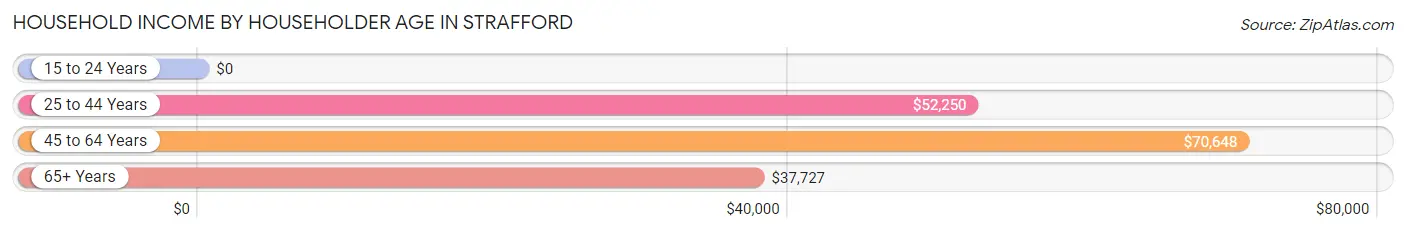
Household Income by Householder Age in Strafford
The median household income in Strafford is $57,266, with the highest median household income of $70,648 found in the 45 to 64 years age bracket for the primary householder. A total of 454 households (45.0%) fall into this category. Meanwhile, the 15 to 24 years age bracket for the primary householder has the lowest median household income of $0, with 5 households (0.5%) in this group.
| Income Bracket | # Households | Median Income |
| 15 to 24 Years | 5 (0.5%) | $0 |
| 25 to 44 Years | 378 (37.5%) | $52,250 |
| 45 to 64 Years | 454 (45.0%) | $70,648 |
| 65+ Years | 172 (17.1%) | $37,727 |
| Total | 1,009 (100.0%) | $57,266 |
Poverty in Strafford
Income Below Poverty by Sex and Age in Strafford
With 18.7% poverty level for males and 14.1% for females among the residents of Strafford, 15 year old males and 16 and 17 year old females are the most vulnerable to poverty, with 22 males (50.0%) and 25 females (41.7%) in their respective age groups living below the poverty level.
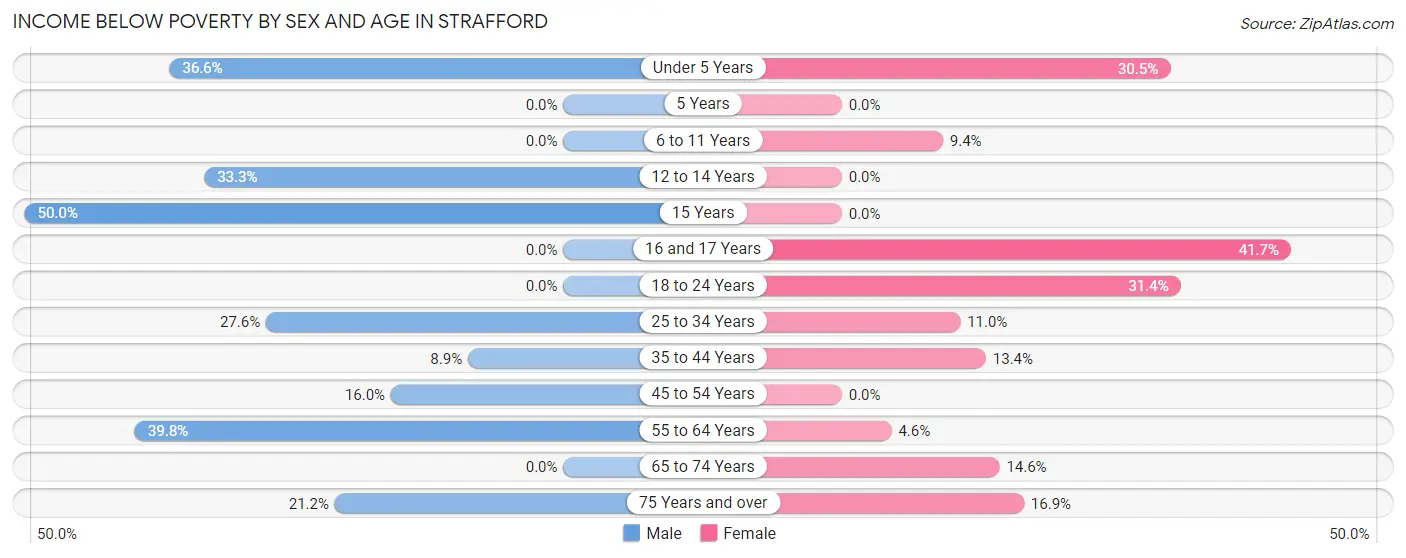
| Age Bracket | Male | Female |
| Under 5 Years | 34 (36.6%) | 60 (30.5%) |
| 5 Years | 0 (0.0%) | 0 (0.0%) |
| 6 to 11 Years | 0 (0.0%) | 9 (9.4%) |
| 12 to 14 Years | 24 (33.3%) | 0 (0.0%) |
| 15 Years | 22 (50.0%) | 0 (0.0%) |
| 16 and 17 Years | 0 (0.0%) | 25 (41.7%) |
| 18 to 24 Years | 0 (0.0%) | 11 (31.4%) |
| 25 to 34 Years | 32 (27.6%) | 20 (11.0%) |
| 35 to 44 Years | 17 (8.8%) | 23 (13.4%) |
| 45 to 54 Years | 24 (16.0%) | 0 (0.0%) |
| 55 to 64 Years | 66 (39.8%) | 7 (4.6%) |
| 65 to 74 Years | 0 (0.0%) | 12 (14.6%) |
| 75 Years and over | 7 (21.2%) | 12 (16.9%) |
| Total | 226 (18.7%) | 179 (14.1%) |
Income Above Poverty by Sex and Age in Strafford
According to the poverty statistics in Strafford, males aged 5 years and females aged 5 years are the age groups that are most secure financially, with 100.0% of males and 100.0% of females in these age groups living above the poverty line.
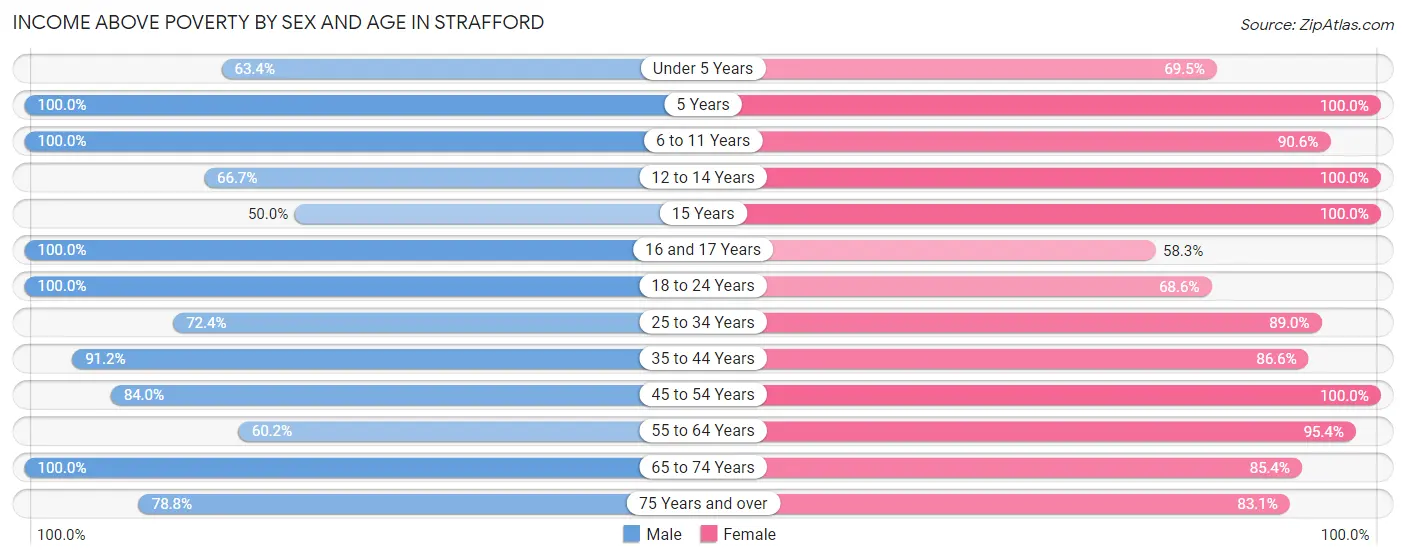
| Age Bracket | Male | Female |
| Under 5 Years | 59 (63.4%) | 137 (69.5%) |
| 5 Years | 45 (100.0%) | 9 (100.0%) |
| 6 to 11 Years | 128 (100.0%) | 87 (90.6%) |
| 12 to 14 Years | 48 (66.7%) | 40 (100.0%) |
| 15 Years | 22 (50.0%) | 8 (100.0%) |
| 16 and 17 Years | 20 (100.0%) | 35 (58.3%) |
| 18 to 24 Years | 100 (100.0%) | 24 (68.6%) |
| 25 to 34 Years | 84 (72.4%) | 162 (89.0%) |
| 35 to 44 Years | 175 (91.1%) | 149 (86.6%) |
| 45 to 54 Years | 126 (84.0%) | 170 (100.0%) |
| 55 to 64 Years | 100 (60.2%) | 145 (95.4%) |
| 65 to 74 Years | 52 (100.0%) | 70 (85.4%) |
| 75 Years and over | 26 (78.8%) | 59 (83.1%) |
| Total | 985 (81.3%) | 1,095 (86.0%) |
Income Below Poverty Among Married-Couple Families in Strafford
The poverty statistics for married-couple families in Strafford show that 12.9% or 52 of the total 402 families live below the poverty line. Families with 5 or more children have the highest poverty rate of 100.0%, comprising of 23 families. On the other hand, families with 1 or 2 children have the lowest poverty rate of 4.5%, which includes 5 families.
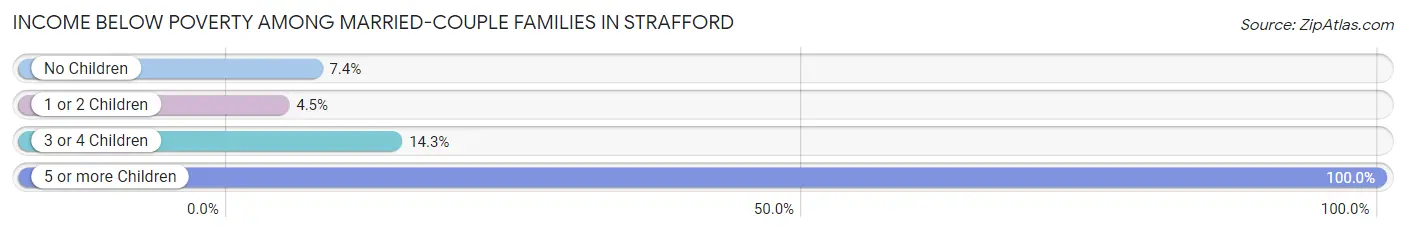
| Children | Above Poverty | Below Poverty |
| No Children | 189 (92.6%) | 15 (7.3%) |
| 1 or 2 Children | 107 (95.5%) | 5 (4.5%) |
| 3 or 4 Children | 54 (85.7%) | 9 (14.3%) |
| 5 or more Children | 0 (0.0%) | 23 (100.0%) |
| Total | 350 (87.1%) | 52 (12.9%) |
Income Below Poverty Among Single-Parent Households in Strafford
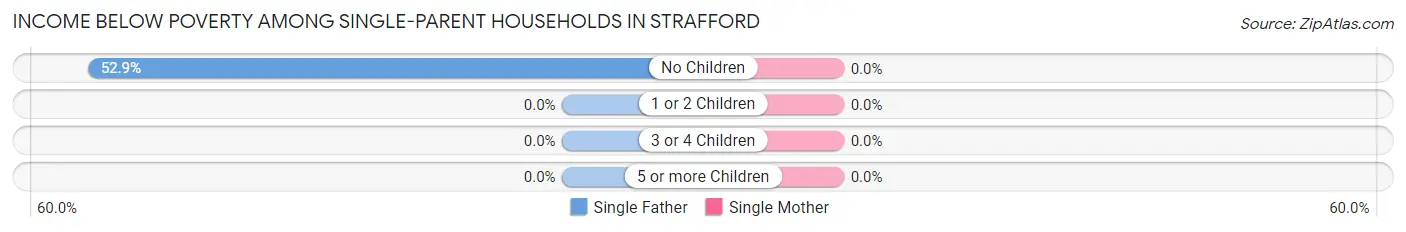
| Children | Single Father | Single Mother |
| No Children | 9 (52.9%) | 0 (0.0%) |
| 1 or 2 Children | 0 (0.0%) | 0 (0.0%) |
| 3 or 4 Children | 0 (0.0%) | 0 (0.0%) |
| 5 or more Children | 0 (0.0%) | 0 (0.0%) |
| Total | 9 (17.0%) | 0 (0.0%) |
Income Below Poverty Among Married-Couple vs Single-Parent Households in Strafford
The poverty data for Strafford shows that 52 of the married-couple family households (12.9%) and 9 of the single-parent households (3.7%) are living below the poverty level. Within the married-couple family households, those with 5 or more children have the highest poverty rate, with 23 households (100.0%) falling below the poverty line. Among the single-parent households, those with no children have the highest poverty rate, with 9 household (11.7%) living below poverty.
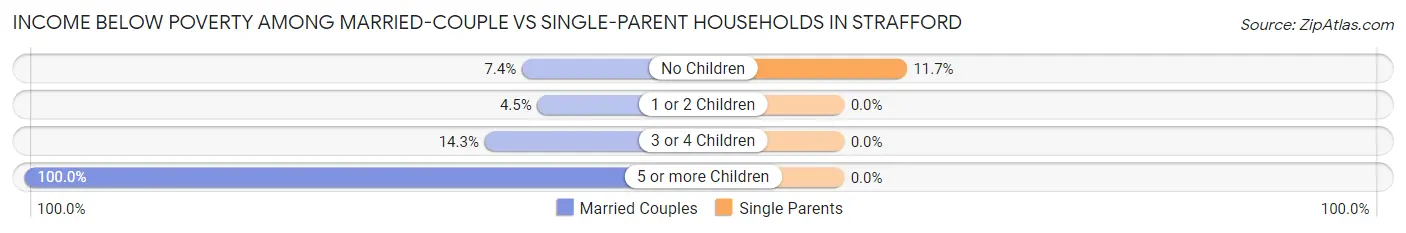
| Children | Married-Couple Families | Single-Parent Households |
| No Children | 15 (7.3%) | 9 (11.7%) |
| 1 or 2 Children | 5 (4.5%) | 0 (0.0%) |
| 3 or 4 Children | 9 (14.3%) | 0 (0.0%) |
| 5 or more Children | 23 (100.0%) | 0 (0.0%) |
| Total | 52 (12.9%) | 9 (3.7%) |
Race in Strafford
The most populous races in Strafford are White / Caucasian (2,373 | 92.3%), Two or more Races (133 | 5.2%), and Hispanic or Latino (105 | 4.1%).
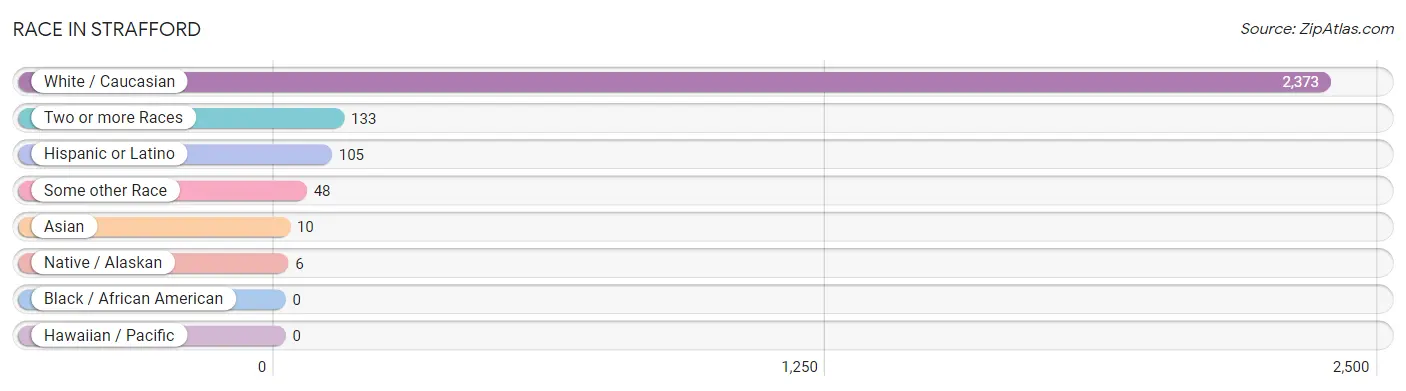
| Race | # Population | % Population |
| Asian | 10 | 0.4% |
| Black / African American | 0 | 0.0% |
| Hawaiian / Pacific | 0 | 0.0% |
| Hispanic or Latino | 105 | 4.1% |
| Native / Alaskan | 6 | 0.2% |
| White / Caucasian | 2,373 | 92.3% |
| Two or more Races | 133 | 5.2% |
| Some other Race | 48 | 1.9% |
| Total | 2,570 | 100.0% |
Ancestry in Strafford
The most populous ancestries reported in Strafford are German (308 | 12.0%), American (191 | 7.4%), English (172 | 6.7%), European (162 | 6.3%), and Irish (155 | 6.0%), together accounting for 38.4% of all Strafford residents.
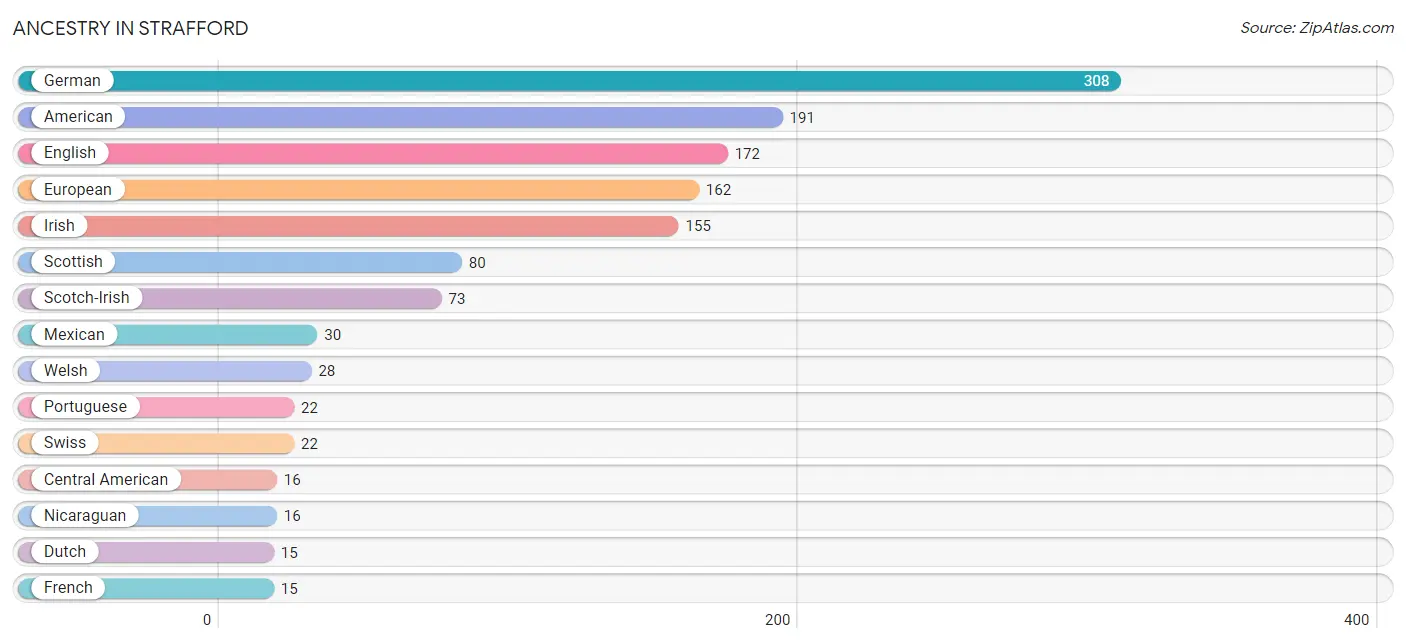
| Ancestry | # Population | % Population |
| American | 191 | 7.4% |
| Argentinean | 6 | 0.2% |
| Bhutanese | 6 | 0.2% |
| Cajun | 8 | 0.3% |
| Canadian | 12 | 0.5% |
| Central American | 16 | 0.6% |
| Dutch | 15 | 0.6% |
| English | 172 | 6.7% |
| European | 162 | 6.3% |
| French | 15 | 0.6% |
| French Canadian | 4 | 0.2% |
| German | 308 | 12.0% |
| Irish | 155 | 6.0% |
| Italian | 6 | 0.2% |
| Korean | 10 | 0.4% |
| Mexican | 30 | 1.2% |
| Nicaraguan | 16 | 0.6% |
| Norwegian | 7 | 0.3% |
| Polish | 4 | 0.2% |
| Portuguese | 22 | 0.9% |
| Scotch-Irish | 73 | 2.8% |
| Scottish | 80 | 3.1% |
| South American | 6 | 0.2% |
| South American Indian | 6 | 0.2% |
| Swiss | 22 | 0.9% |
| Welsh | 28 | 1.1% | View All 26 Rows |
Immigrants in Strafford
The most numerous immigrant groups reported in Strafford came from Latin America (22 | 0.9%), Central America (16 | 0.6%), Nicaragua (16 | 0.6%), Asia (10 | 0.4%), and Philippines (10 | 0.4%), together accounting for 2.9% of all Strafford residents.
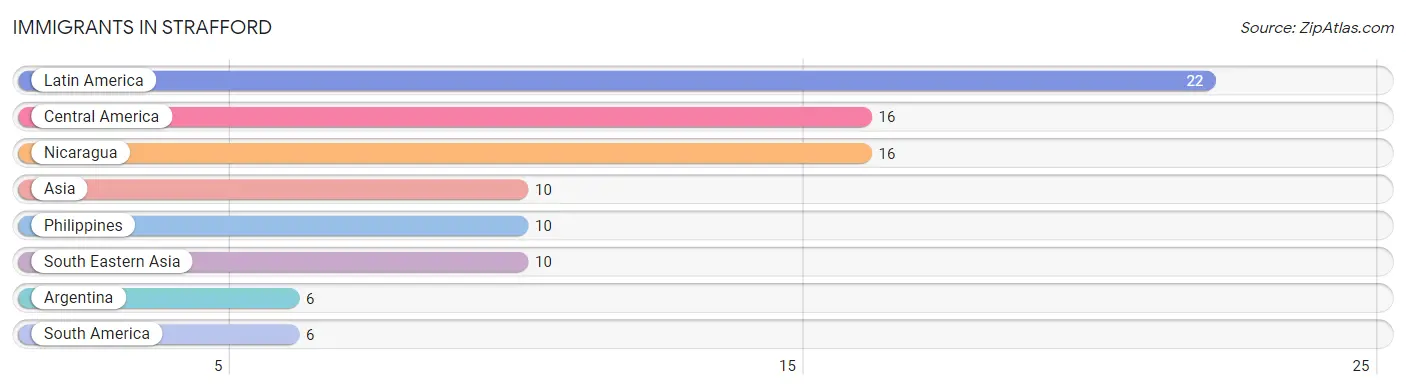
| Immigration Origin | # Population | % Population |
| Argentina | 6 | 0.2% |
| Asia | 10 | 0.4% |
| Central America | 16 | 0.6% |
| Latin America | 22 | 0.9% |
| Nicaragua | 16 | 0.6% |
| Philippines | 10 | 0.4% |
| South America | 6 | 0.2% |
| South Eastern Asia | 10 | 0.4% | View All 8 Rows |
Sex and Age in Strafford
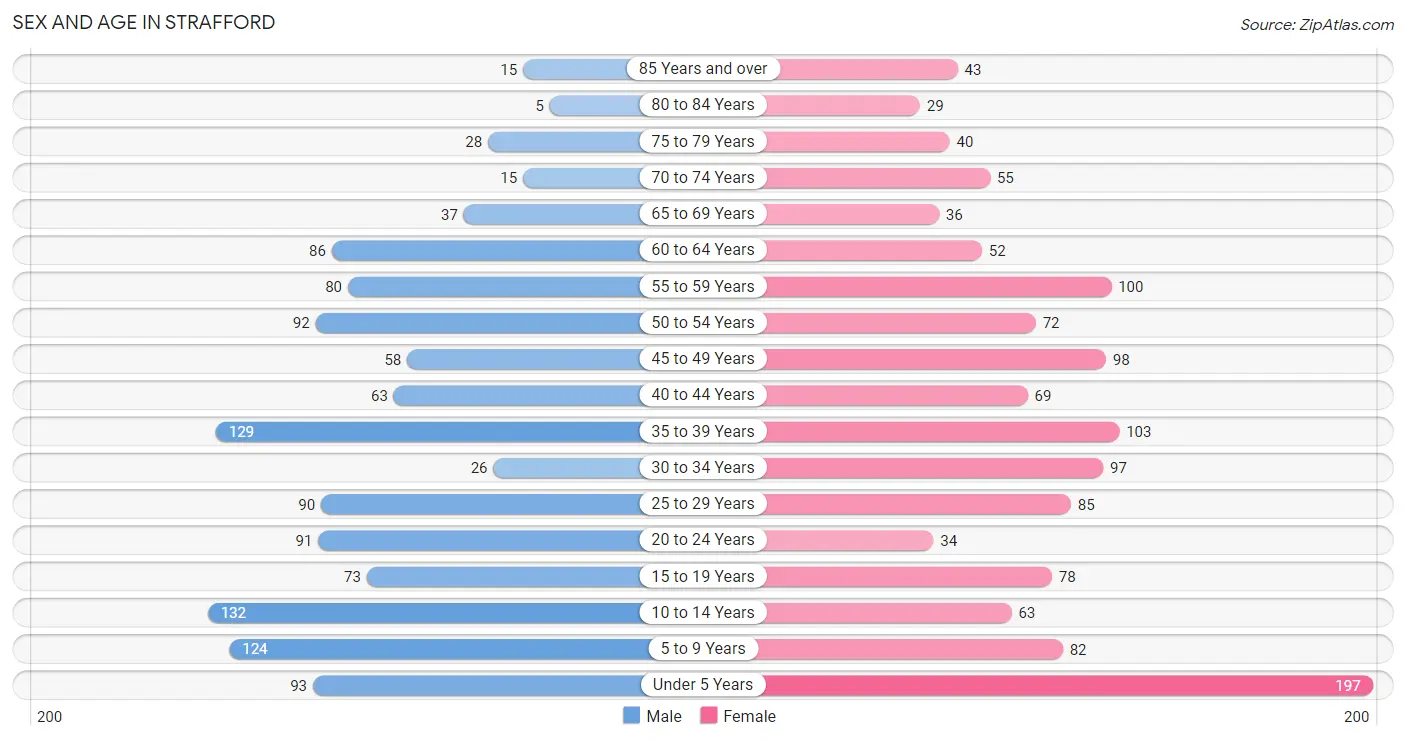
Sex and Age in Strafford
The most populous age groups in Strafford are 10 to 14 Years (132 | 10.7%) for men and Under 5 Years (197 | 14.8%) for women.
| Age Bracket | Male | Female |
| Under 5 Years | 93 (7.5%) | 197 (14.8%) |
| 5 to 9 Years | 124 (10.0%) | 82 (6.1%) |
| 10 to 14 Years | 132 (10.7%) | 63 (4.7%) |
| 15 to 19 Years | 73 (5.9%) | 78 (5.9%) |
| 20 to 24 Years | 91 (7.4%) | 34 (2.5%) |
| 25 to 29 Years | 90 (7.3%) | 85 (6.4%) |
| 30 to 34 Years | 26 (2.1%) | 97 (7.3%) |
| 35 to 39 Years | 129 (10.4%) | 103 (7.7%) |
| 40 to 44 Years | 63 (5.1%) | 69 (5.2%) |
| 45 to 49 Years | 58 (4.7%) | 98 (7.3%) |
| 50 to 54 Years | 92 (7.4%) | 72 (5.4%) |
| 55 to 59 Years | 80 (6.5%) | 100 (7.5%) |
| 60 to 64 Years | 86 (7.0%) | 52 (3.9%) |
| 65 to 69 Years | 37 (3.0%) | 36 (2.7%) |
| 70 to 74 Years | 15 (1.2%) | 55 (4.1%) |
| 75 to 79 Years | 28 (2.3%) | 40 (3.0%) |
| 80 to 84 Years | 5 (0.4%) | 29 (2.2%) |
| 85 Years and over | 15 (1.2%) | 43 (3.2%) |
| Total | 1,237 (100.0%) | 1,333 (100.0%) |
Families and Households in Strafford
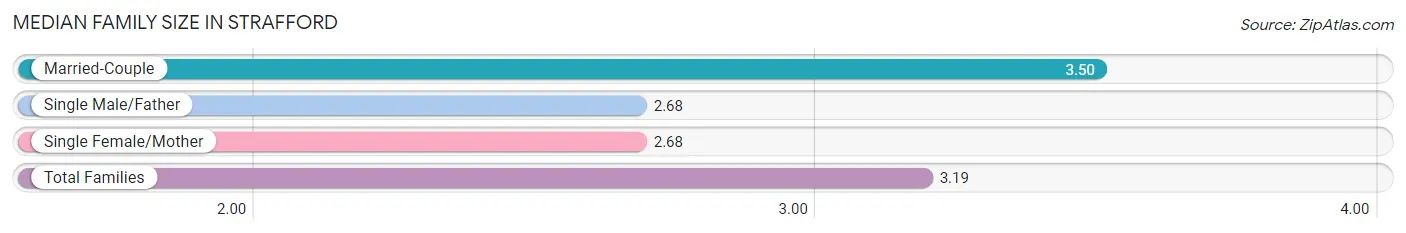
Median Family Size in Strafford
The median family size in Strafford is 3.19 persons per family, with married-couple families (402 | 62.5%) accounting for the largest median family size of 3.5 persons per family. On the other hand, single male/father families (53 | 8.2%) represent the smallest median family size with 2.68 persons per family.
| Family Type | # Families | Family Size |
| Married-Couple | 402 (62.5%) | 3.50 |
| Single Male/Father | 53 (8.2%) | 2.68 |
| Single Female/Mother | 188 (29.2%) | 2.68 |
| Total Families | 643 (100.0%) | 3.19 |
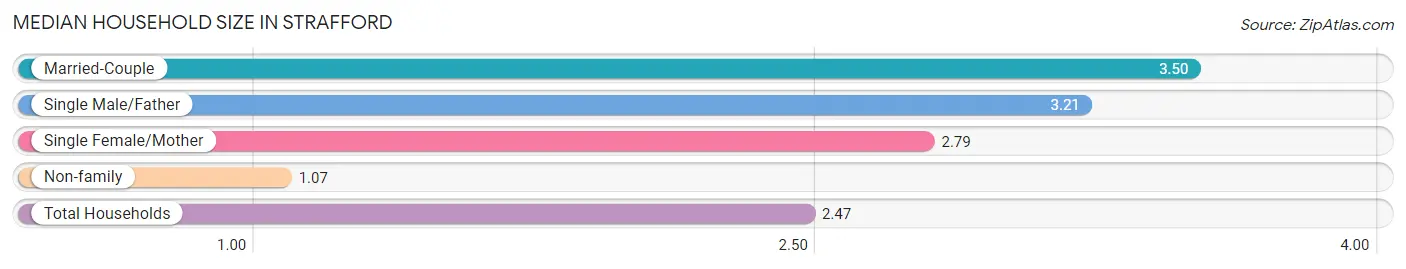
Median Household Size in Strafford
The median household size in Strafford is 2.47 persons per household, with married-couple households (402 | 39.8%) accounting for the largest median household size of 3.5 persons per household. non-family households (366 | 36.3%) represent the smallest median household size with 1.07 persons per household.
| Household Type | # Households | Household Size |
| Married-Couple | 402 (39.8%) | 3.50 |
| Single Male/Father | 53 (5.2%) | 3.21 |
| Single Female/Mother | 188 (18.6%) | 2.79 |
| Non-family | 366 (36.3%) | 1.07 |
| Total Households | 1,009 (100.0%) | 2.47 |
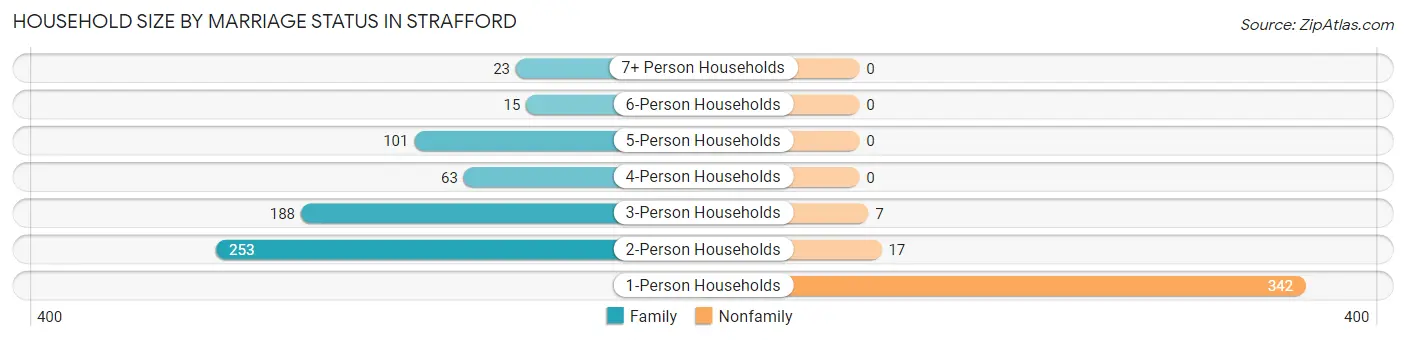
Household Size by Marriage Status in Strafford
Out of a total of 1,009 households in Strafford, 643 (63.7%) are family households, while 366 (36.3%) are nonfamily households. The most numerous type of family households are 2-person households, comprising 253, and the most common type of nonfamily households are 1-person households, comprising 342.
| Household Size | Family Households | Nonfamily Households |
| 1-Person Households | - | 342 (33.9%) |
| 2-Person Households | 253 (25.1%) | 17 (1.7%) |
| 3-Person Households | 188 (18.6%) | 7 (0.7%) |
| 4-Person Households | 63 (6.2%) | 0 (0.0%) |
| 5-Person Households | 101 (10.0%) | 0 (0.0%) |
| 6-Person Households | 15 (1.5%) | 0 (0.0%) |
| 7+ Person Households | 23 (2.3%) | 0 (0.0%) |
| Total | 643 (63.7%) | 366 (36.3%) |
Female Fertility in Strafford
Fertility by Age in Strafford
Average fertility rate in Strafford is 28.0 births per 1,000 women. Women in the age bracket of 20 to 34 years have the highest fertility rate with 69.0 births per 1,000 women. Women in the age bracket of 20 to 34 years acount for 88.2% of all women with births.
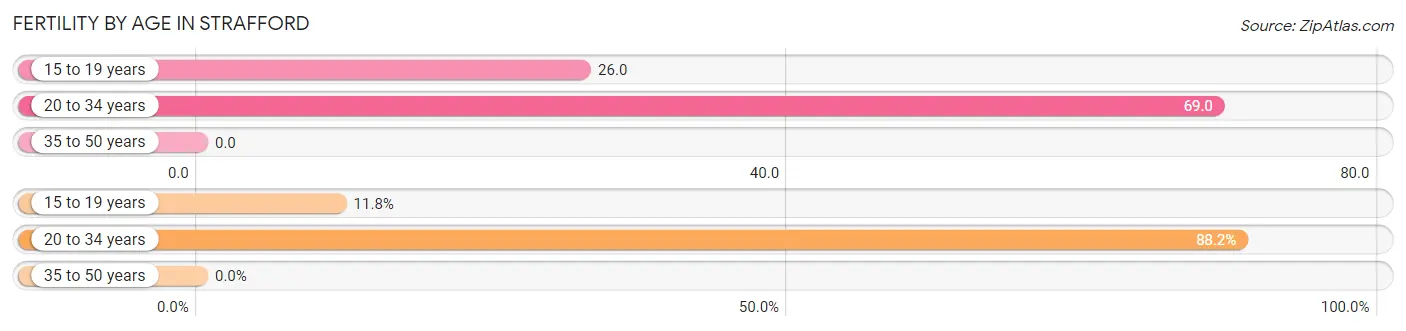
| Age Bracket | Women with Births | Births / 1,000 Women |
| 15 to 19 years | 2 (11.8%) | 26.0 |
| 20 to 34 years | 15 (88.2%) | 69.0 |
| 35 to 50 years | 0 (0.0%) | 0.0 |
| Total | 17 (100.0%) | 28.0 |
Fertility by Age by Marriage Status in Strafford
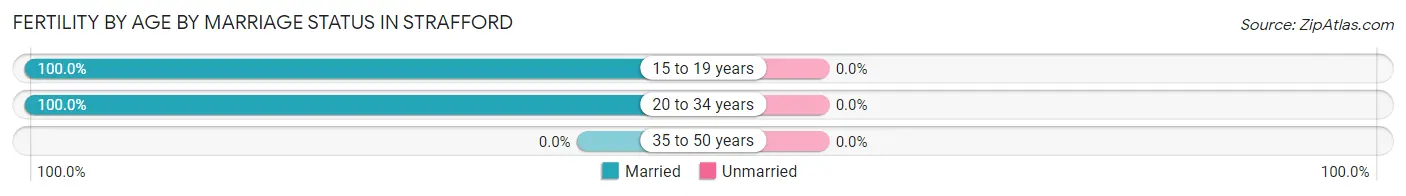
| Age Bracket | Married | Unmarried |
| 15 to 19 years | 2 (100.0%) | 0 (0.0%) |
| 20 to 34 years | 15 (100.0%) | 0 (0.0%) |
| 35 to 50 years | 0 (0.0%) | 0 (0.0%) |
| Total | 17 (100.0%) | 0 (0.0%) |
Fertility by Education in Strafford
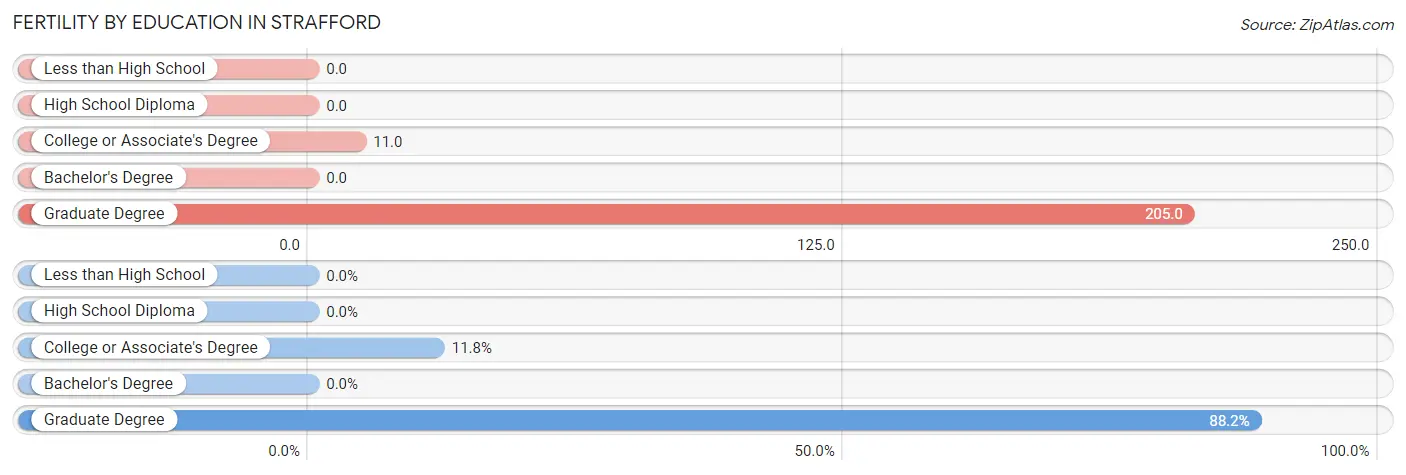
| Educational Attainment | Women with Births | Births / 1,000 Women |
| Less than High School | 0 (0.0%) | 0.0 |
| High School Diploma | 0 (0.0%) | 0.0 |
| College or Associate's Degree | 2 (11.8%) | 11.0 |
| Bachelor's Degree | 0 (0.0%) | 0.0 |
| Graduate Degree | 15 (88.2%) | 205.0 |
| Total | 17 (100.0%) | 28.0 |
Fertility by Education by Marriage Status in Strafford
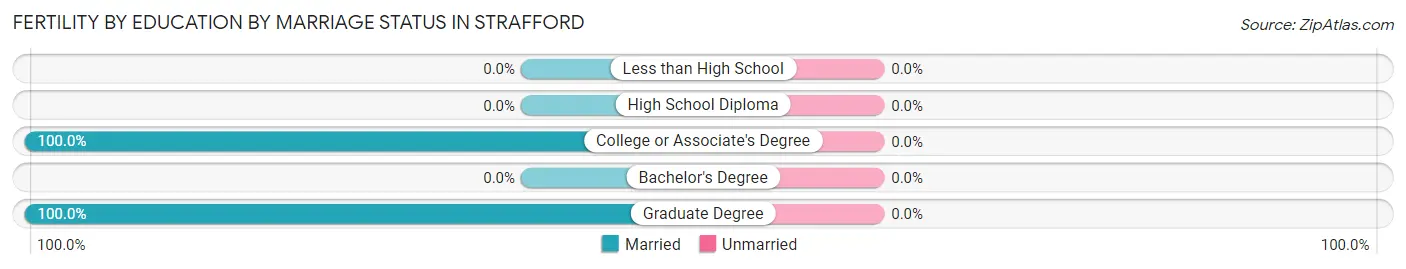
| Educational Attainment | Married | Unmarried |
| Less than High School | 0 (0.0%) | 0 (0.0%) |
| High School Diploma | 0 (0.0%) | 0 (0.0%) |
| College or Associate's Degree | 2 (100.0%) | 0 (0.0%) |
| Bachelor's Degree | 0 (0.0%) | 0 (0.0%) |
| Graduate Degree | 15 (100.0%) | 0 (0.0%) |
| Total | 17 (100.0%) | 0 (0.0%) |
Employment Characteristics in Strafford
Employment by Class of Employer in Strafford
Among the 1,160 employed individuals in Strafford, private company employees (882 | 76.0%), not-for-profit organizations (161 | 13.9%), and state government employees (33 | 2.8%) make up the most common classes of employment.
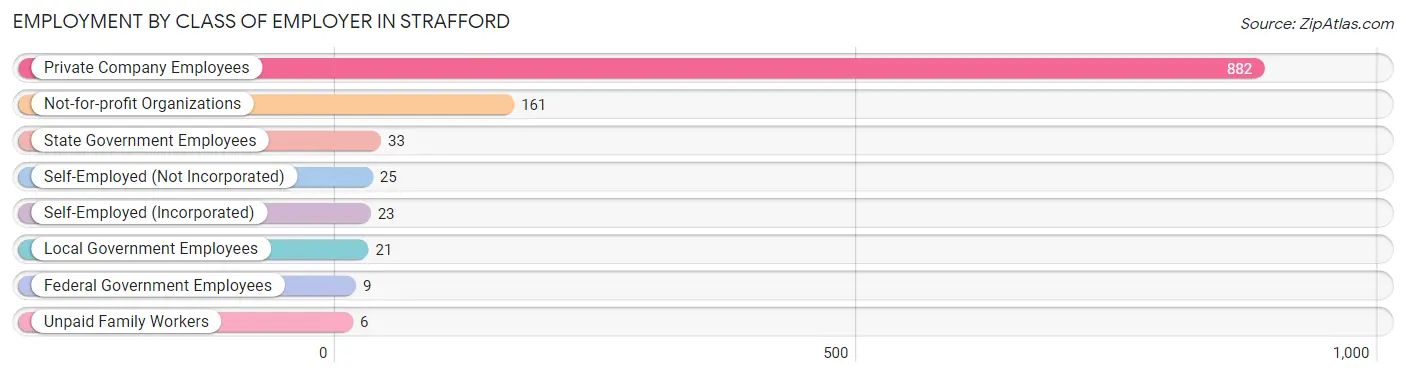
| Employer Class | # Employees | % Employees |
| Private Company Employees | 882 | 76.0% |
| Self-Employed (Incorporated) | 23 | 2.0% |
| Self-Employed (Not Incorporated) | 25 | 2.2% |
| Not-for-profit Organizations | 161 | 13.9% |
| Local Government Employees | 21 | 1.8% |
| State Government Employees | 33 | 2.8% |
| Federal Government Employees | 9 | 0.8% |
| Unpaid Family Workers | 6 | 0.5% |
| Total | 1,160 | 100.0% |
Employment Status by Age in Strafford
According to the labor force statistics for Strafford, out of the total population over 16 years of age (1,827), 65.6% or 1,199 individuals are in the labor force, with 2.7% or 32 of them unemployed. The age group with the highest labor force participation rate is 20 to 24 years, with 88.0% or 110 individuals in the labor force. Within the labor force, the 20 to 24 years age range has the highest percentage of unemployed individuals, with 29.1% or 32 of them being unemployed.
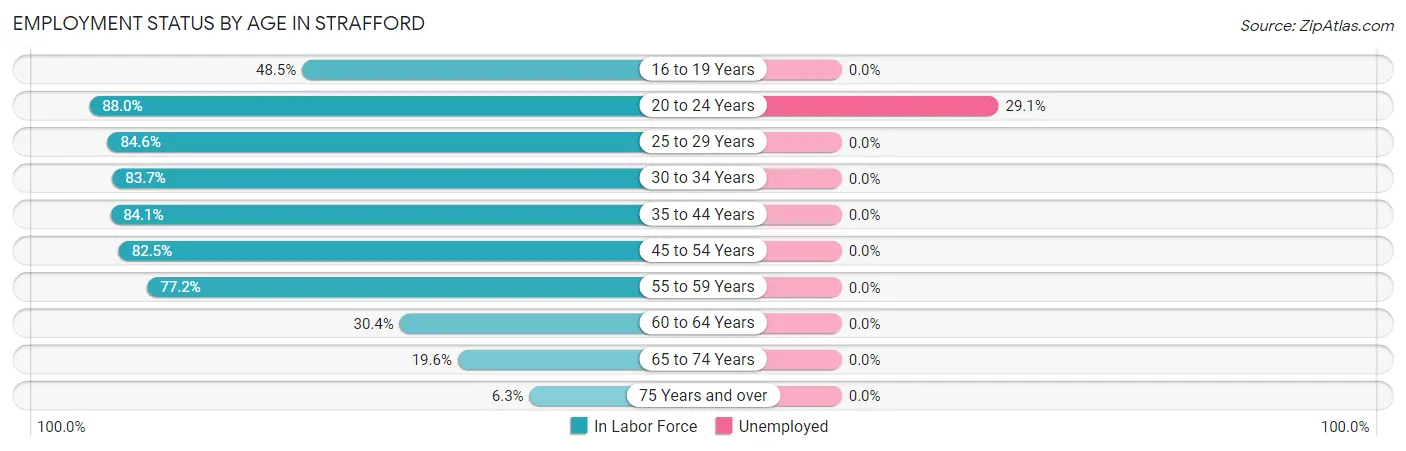
| Age Bracket | In Labor Force | Unemployed |
| 16 to 19 Years | 48 (48.5%) | 0 (0.0%) |
| 20 to 24 Years | 110 (88.0%) | 32 (29.1%) |
| 25 to 29 Years | 148 (84.6%) | 0 (0.0%) |
| 30 to 34 Years | 103 (83.7%) | 0 (0.0%) |
| 35 to 44 Years | 306 (84.1%) | 0 (0.0%) |
| 45 to 54 Years | 264 (82.5%) | 0 (0.0%) |
| 55 to 59 Years | 139 (77.2%) | 0 (0.0%) |
| 60 to 64 Years | 42 (30.4%) | 0 (0.0%) |
| 65 to 74 Years | 28 (19.6%) | 0 (0.0%) |
| 75 Years and over | 10 (6.3%) | 0 (0.0%) |
| Total | 1,199 (65.6%) | 32 (2.7%) |
Employment Status by Educational Attainment in Strafford
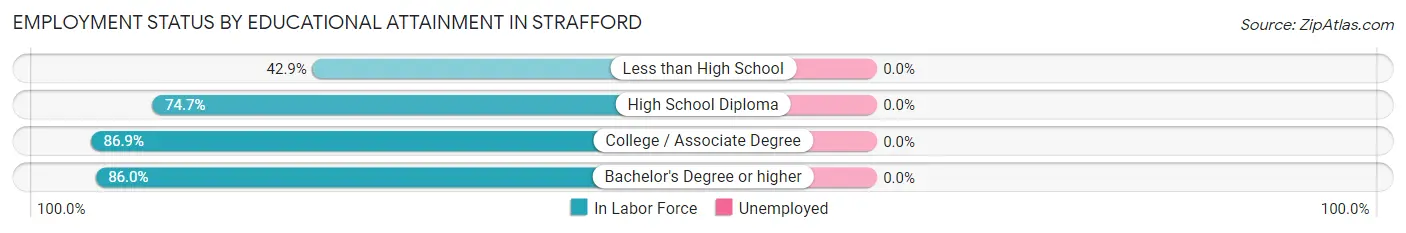
| Educational Attainment | In Labor Force | Unemployed |
| Less than High School | 69 (42.9%) | 0 (0.0%) |
| High School Diploma | 333 (74.7%) | 0 (0.0%) |
| College / Associate Degree | 392 (86.9%) | 0 (0.0%) |
| Bachelor's Degree or higher | 208 (86.0%) | 0 (0.0%) |
| Total | 1,002 (77.1%) | 0 (0.0%) |
Employment Occupations by Sex in Strafford
Management, Business, Science and Arts Occupations
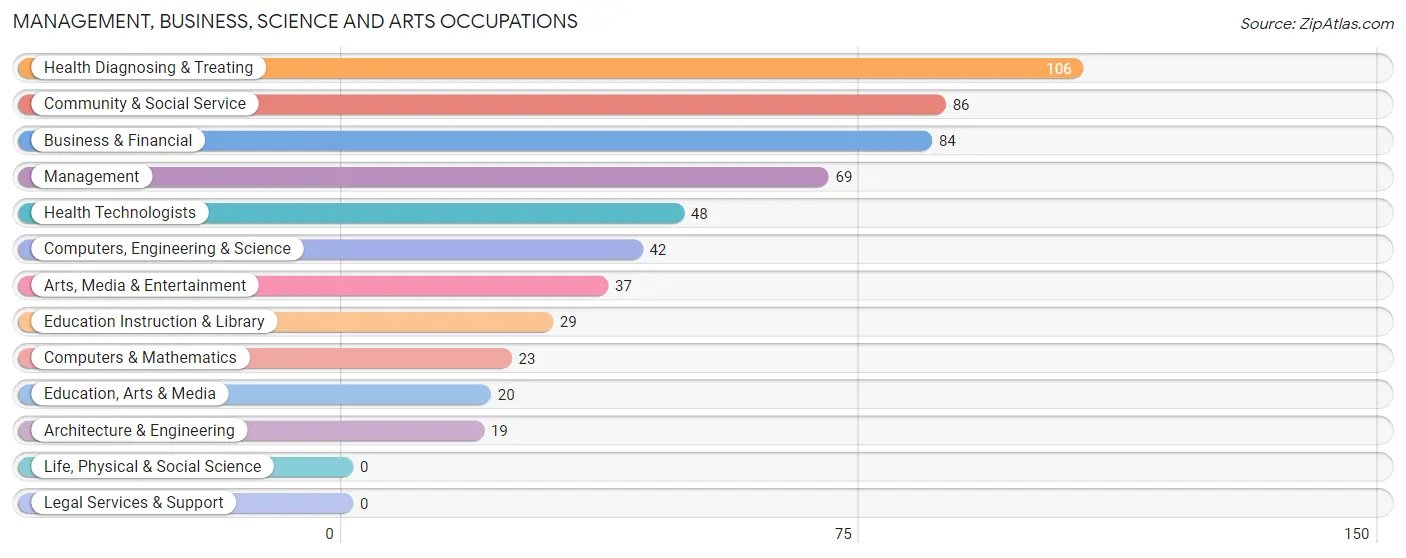
The most common Management, Business, Science and Arts occupations in Strafford are Health Diagnosing & Treating (106 | 9.1%), Community & Social Service (86 | 7.4%), Business & Financial (84 | 7.2%), Management (69 | 5.9%), and Health Technologists (48 | 4.1%).
Management, Business, Science and Arts Occupations by Sex
Within the Management, Business, Science and Arts occupations in Strafford, the most male-oriented occupations are Computers, Engineering & Science (100.0%), Computers & Mathematics (100.0%), and Architecture & Engineering (100.0%), while the most female-oriented occupations are Health Technologists (100.0%), Business & Financial (91.7%), and Education Instruction & Library (89.7%).
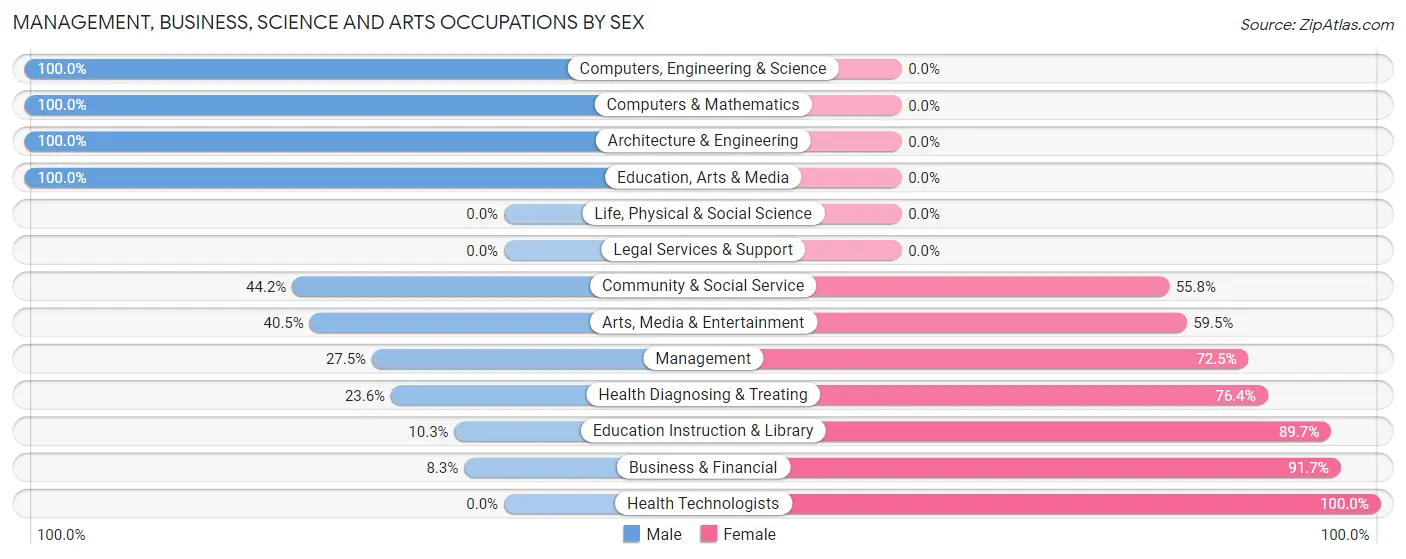
| Occupation | Male | Female |
| Management | 19 (27.5%) | 50 (72.5%) |
| Business & Financial | 7 (8.3%) | 77 (91.7%) |
| Computers, Engineering & Science | 42 (100.0%) | 0 (0.0%) |
| Computers & Mathematics | 23 (100.0%) | 0 (0.0%) |
| Architecture & Engineering | 19 (100.0%) | 0 (0.0%) |
| Life, Physical & Social Science | 0 (0.0%) | 0 (0.0%) |
| Community & Social Service | 38 (44.2%) | 48 (55.8%) |
| Education, Arts & Media | 20 (100.0%) | 0 (0.0%) |
| Legal Services & Support | 0 (0.0%) | 0 (0.0%) |
| Education Instruction & Library | 3 (10.3%) | 26 (89.7%) |
| Arts, Media & Entertainment | 15 (40.5%) | 22 (59.5%) |
| Health Diagnosing & Treating | 25 (23.6%) | 81 (76.4%) |
| Health Technologists | 0 (0.0%) | 48 (100.0%) |
| Total (Category) | 131 (33.9%) | 256 (66.1%) |
| Total (Overall) | 576 (49.4%) | 590 (50.6%) |
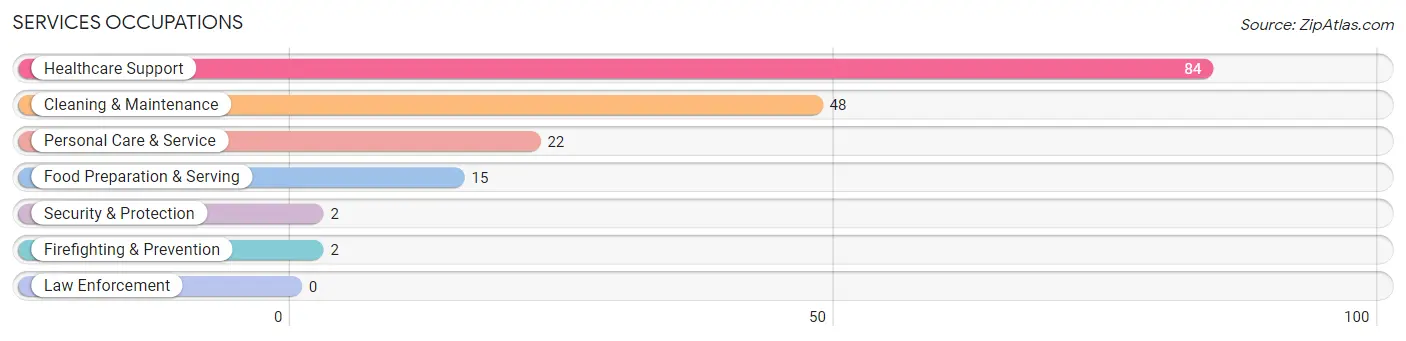
Services Occupations
The most common Services occupations in Strafford are Healthcare Support (84 | 7.2%), Cleaning & Maintenance (48 | 4.1%), Personal Care & Service (22 | 1.9%), Food Preparation & Serving (15 | 1.3%), and Security & Protection (2 | 0.2%).
Services Occupations by Sex
Within the Services occupations in Strafford, the most male-oriented occupations are Security & Protection (100.0%), Firefighting & Prevention (100.0%), and Cleaning & Maintenance (41.7%), while the most female-oriented occupations are Healthcare Support (100.0%), Food Preparation & Serving (100.0%), and Personal Care & Service (100.0%).
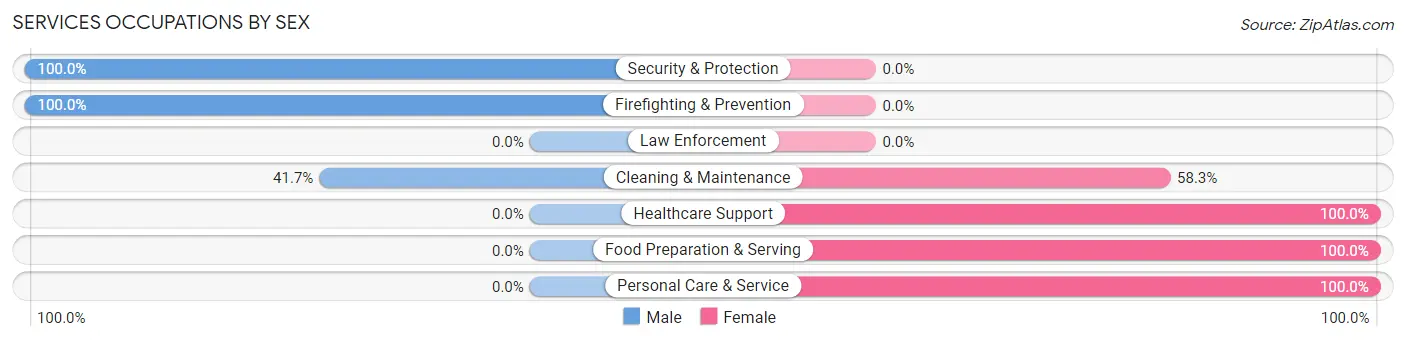
| Occupation | Male | Female |
| Healthcare Support | 0 (0.0%) | 84 (100.0%) |
| Security & Protection | 2 (100.0%) | 0 (0.0%) |
| Firefighting & Prevention | 2 (100.0%) | 0 (0.0%) |
| Law Enforcement | 0 (0.0%) | 0 (0.0%) |
| Food Preparation & Serving | 0 (0.0%) | 15 (100.0%) |
| Cleaning & Maintenance | 20 (41.7%) | 28 (58.3%) |
| Personal Care & Service | 0 (0.0%) | 22 (100.0%) |
| Total (Category) | 22 (12.9%) | 149 (87.1%) |
| Total (Overall) | 576 (49.4%) | 590 (50.6%) |
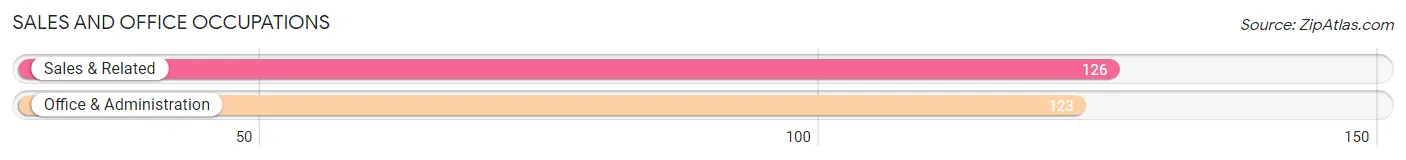
Sales and Office Occupations
The most common Sales and Office occupations in Strafford are Sales & Related (126 | 10.8%), and Office & Administration (123 | 10.5%).
Sales and Office Occupations by Sex
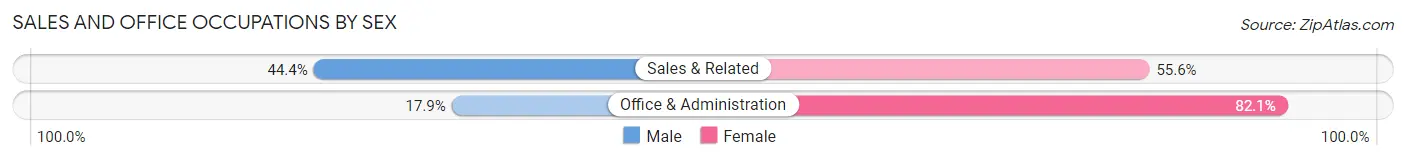
| Occupation | Male | Female |
| Sales & Related | 56 (44.4%) | 70 (55.6%) |
| Office & Administration | 22 (17.9%) | 101 (82.1%) |
| Total (Category) | 78 (31.3%) | 171 (68.7%) |
| Total (Overall) | 576 (49.4%) | 590 (50.6%) |
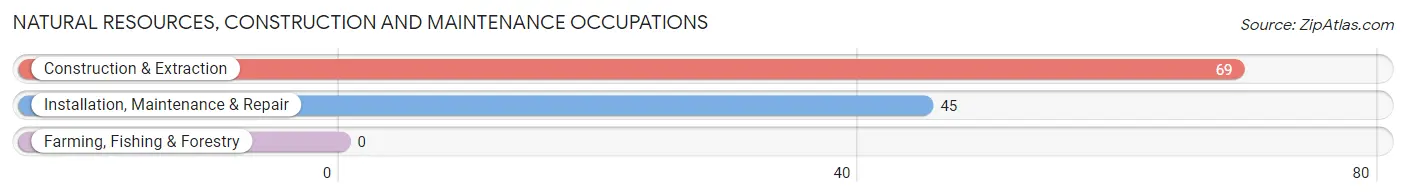
Natural Resources, Construction and Maintenance Occupations
The most common Natural Resources, Construction and Maintenance occupations in Strafford are Construction & Extraction (69 | 5.9%), and Installation, Maintenance & Repair (45 | 3.9%).
Natural Resources, Construction and Maintenance Occupations by Sex
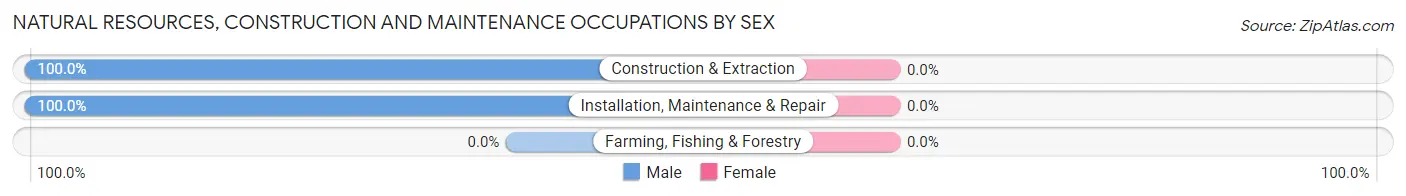
| Occupation | Male | Female |
| Farming, Fishing & Forestry | 0 (0.0%) | 0 (0.0%) |
| Construction & Extraction | 69 (100.0%) | 0 (0.0%) |
| Installation, Maintenance & Repair | 45 (100.0%) | 0 (0.0%) |
| Total (Category) | 114 (100.0%) | 0 (0.0%) |
| Total (Overall) | 576 (49.4%) | 590 (50.6%) |
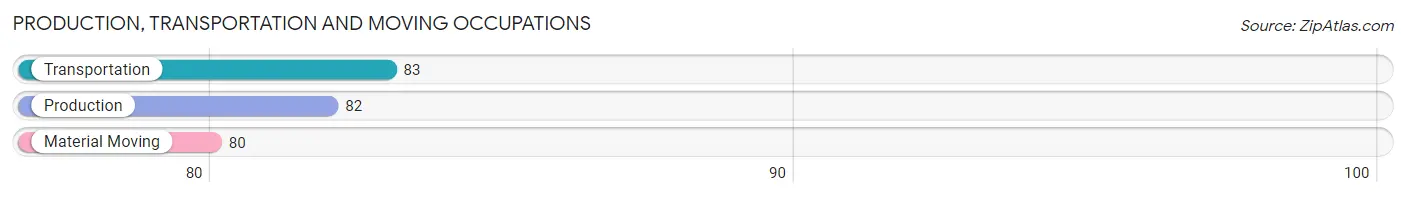
Production, Transportation and Moving Occupations
The most common Production, Transportation and Moving occupations in Strafford are Transportation (83 | 7.1%), Production (82 | 7.0%), and Material Moving (80 | 6.9%).
Production, Transportation and Moving Occupations by Sex
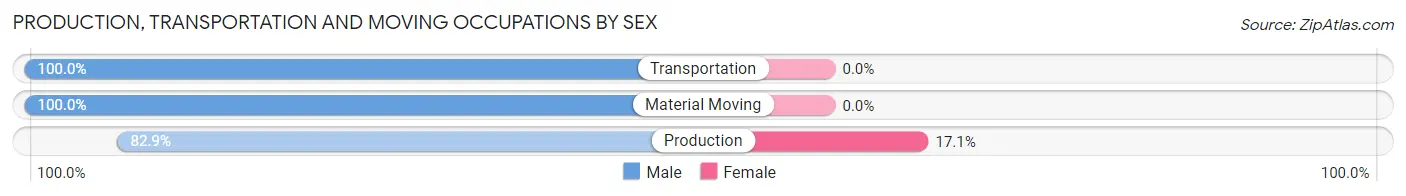
| Occupation | Male | Female |
| Production | 68 (82.9%) | 14 (17.1%) |
| Transportation | 83 (100.0%) | 0 (0.0%) |
| Material Moving | 80 (100.0%) | 0 (0.0%) |
| Total (Category) | 231 (94.3%) | 14 (5.7%) |
| Total (Overall) | 576 (49.4%) | 590 (50.6%) |
Employment Industries by Sex in Strafford
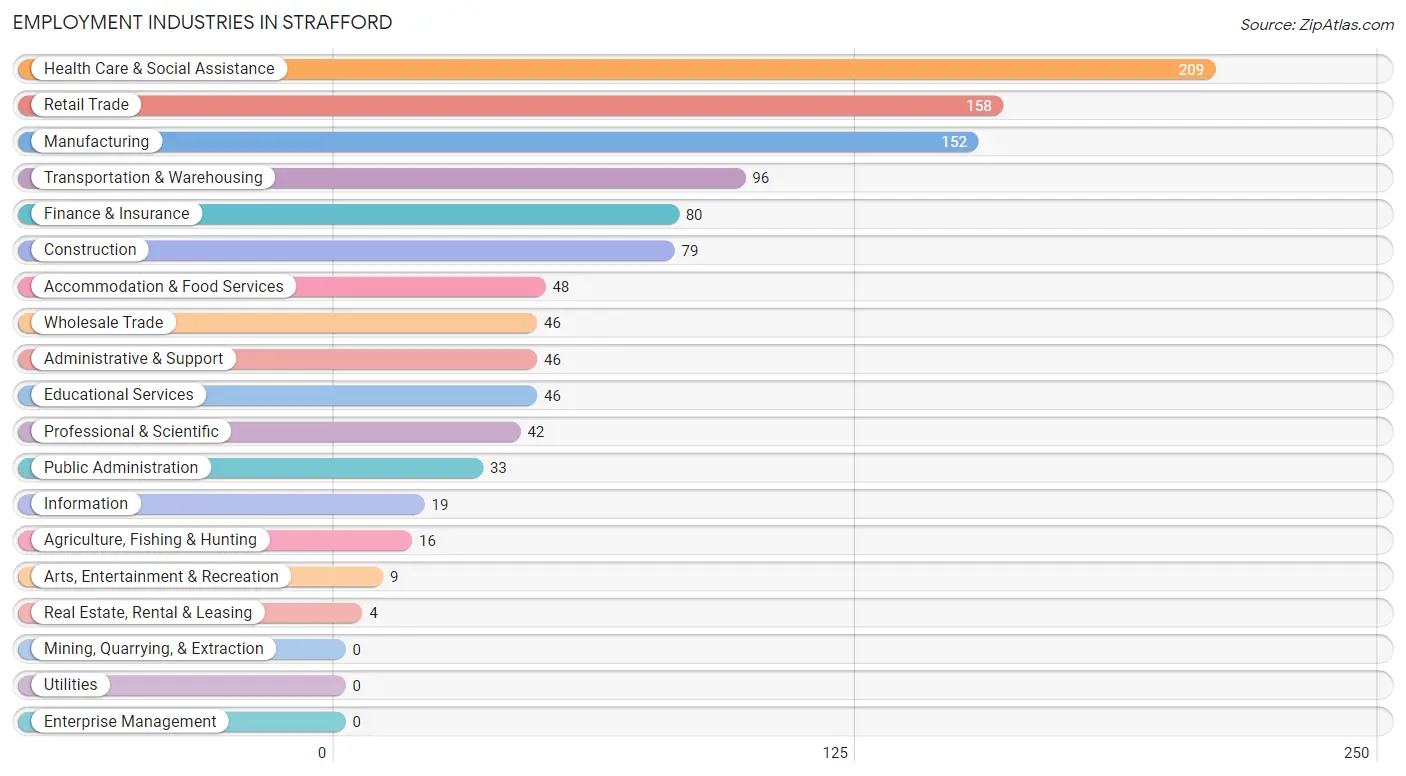
Employment Industries in Strafford
The major employment industries in Strafford include Health Care & Social Assistance (209 | 17.9%), Retail Trade (158 | 13.6%), Manufacturing (152 | 13.0%), Transportation & Warehousing (96 | 8.2%), and Finance & Insurance (80 | 6.9%).
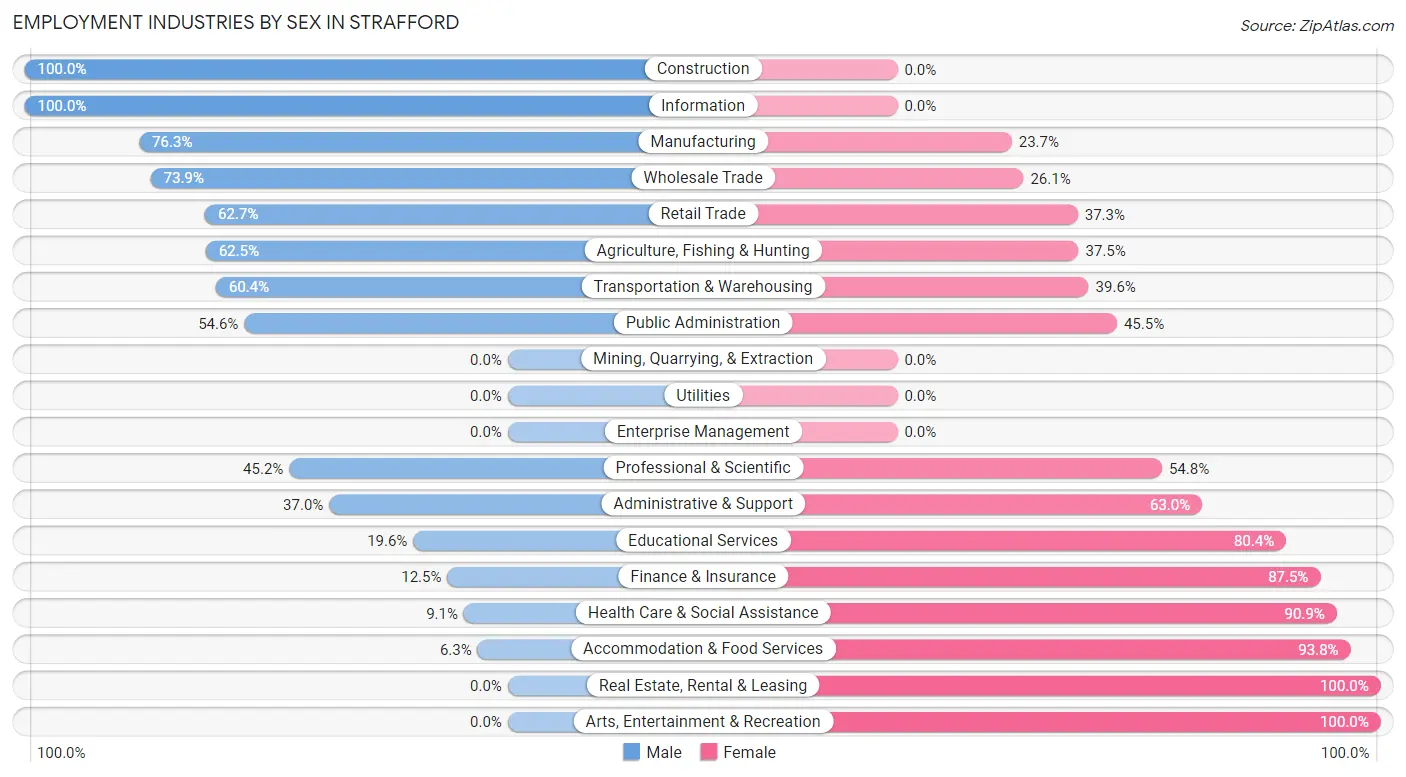
Employment Industries by Sex in Strafford
The Strafford industries that see more men than women are Construction (100.0%), Information (100.0%), and Manufacturing (76.3%), whereas the industries that tend to have a higher number of women are Real Estate, Rental & Leasing (100.0%), Arts, Entertainment & Recreation (100.0%), and Accommodation & Food Services (93.8%).
| Industry | Male | Female |
| Agriculture, Fishing & Hunting | 10 (62.5%) | 6 (37.5%) |
| Mining, Quarrying, & Extraction | 0 (0.0%) | 0 (0.0%) |
| Construction | 79 (100.0%) | 0 (0.0%) |
| Manufacturing | 116 (76.3%) | 36 (23.7%) |
| Wholesale Trade | 34 (73.9%) | 12 (26.1%) |
| Retail Trade | 99 (62.7%) | 59 (37.3%) |
| Transportation & Warehousing | 58 (60.4%) | 38 (39.6%) |
| Utilities | 0 (0.0%) | 0 (0.0%) |
| Information | 19 (100.0%) | 0 (0.0%) |
| Finance & Insurance | 10 (12.5%) | 70 (87.5%) |
| Real Estate, Rental & Leasing | 0 (0.0%) | 4 (100.0%) |
| Professional & Scientific | 19 (45.2%) | 23 (54.8%) |
| Enterprise Management | 0 (0.0%) | 0 (0.0%) |
| Administrative & Support | 17 (37.0%) | 29 (63.0%) |
| Educational Services | 9 (19.6%) | 37 (80.4%) |
| Health Care & Social Assistance | 19 (9.1%) | 190 (90.9%) |
| Arts, Entertainment & Recreation | 0 (0.0%) | 9 (100.0%) |
| Accommodation & Food Services | 3 (6.2%) | 45 (93.8%) |
| Public Administration | 18 (54.5%) | 15 (45.5%) |
| Total | 576 (49.4%) | 590 (50.6%) |
Education in Strafford
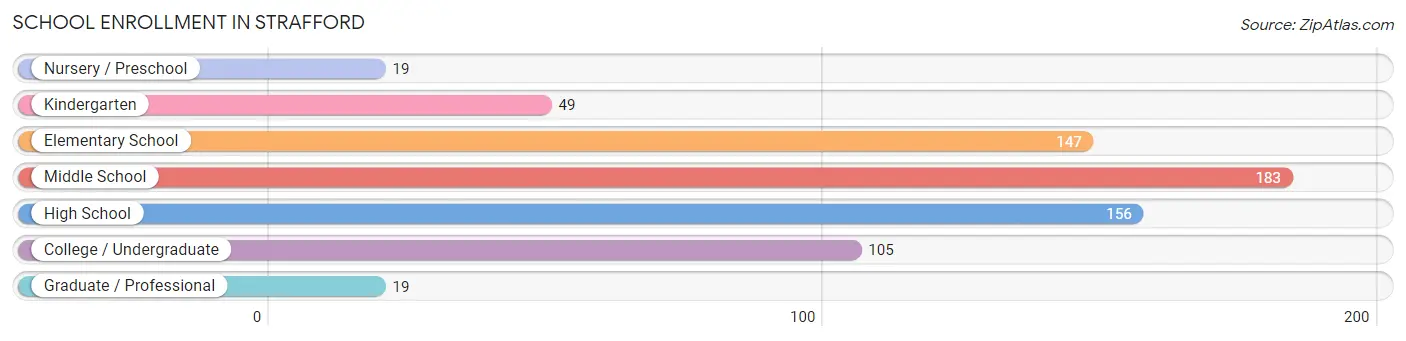
School Enrollment in Strafford
The most common levels of schooling among the 678 students in Strafford are middle school (183 | 27.0%), high school (156 | 23.0%), and elementary school (147 | 21.7%).
| School Level | # Students | % Students |
| Nursery / Preschool | 19 | 2.8% |
| Kindergarten | 49 | 7.2% |
| Elementary School | 147 | 21.7% |
| Middle School | 183 | 27.0% |
| High School | 156 | 23.0% |
| College / Undergraduate | 105 | 15.5% |
| Graduate / Professional | 19 | 2.8% |
| Total | 678 | 100.0% |
School Enrollment by Age by Funding Source in Strafford
Out of a total of 678 students who are enrolled in schools in Strafford, 51 (7.5%) attend a private institution, while the remaining 627 (92.5%) are enrolled in public schools. The age group of 35 years and over has the highest likelihood of being enrolled in private schools, with 7 (31.8% in the age bracket) enrolled. Conversely, the age group of 3 to 4 year olds has the lowest likelihood of being enrolled in a private school, with 8 (100.0% in the age bracket) attending a public institution.
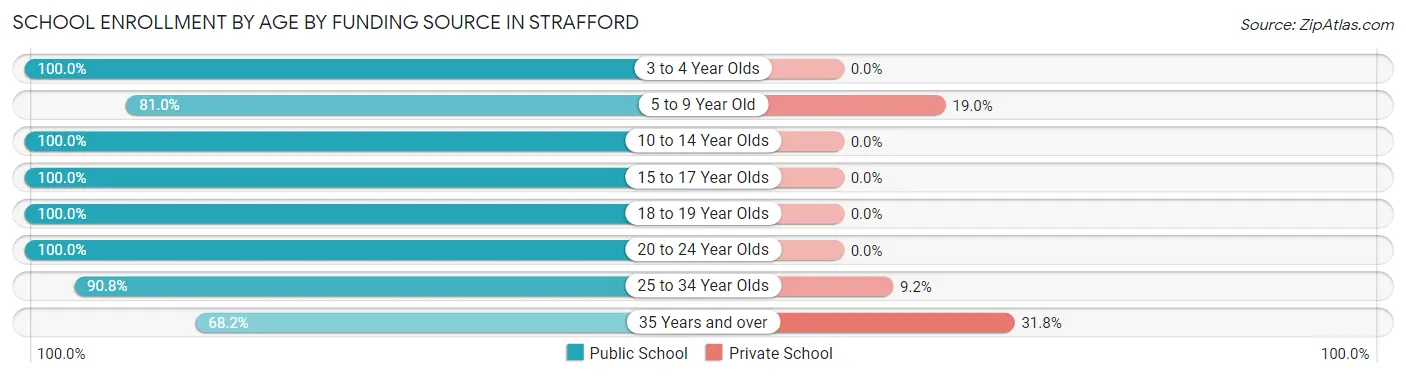
| Age Bracket | Public School | Private School |
| 3 to 4 Year Olds | 8 (100.0%) | 0 (0.0%) |
| 5 to 9 Year Old | 158 (81.0%) | 37 (19.0%) |
| 10 to 14 Year Olds | 195 (100.0%) | 0 (0.0%) |
| 15 to 17 Year Olds | 132 (100.0%) | 0 (0.0%) |
| 18 to 19 Year Olds | 19 (100.0%) | 0 (0.0%) |
| 20 to 24 Year Olds | 31 (100.0%) | 0 (0.0%) |
| 25 to 34 Year Olds | 69 (90.8%) | 7 (9.2%) |
| 35 Years and over | 15 (68.2%) | 7 (31.8%) |
| Total | 627 (92.5%) | 51 (7.5%) |
Educational Attainment by Field of Study in Strafford
Business (82 | 28.5%), education (68 | 23.6%), science & technology (28 | 9.7%), literature & languages (20 | 6.9%), and communications (19 | 6.6%) are the most common fields of study among 288 individuals in Strafford who have obtained a bachelor's degree or higher.
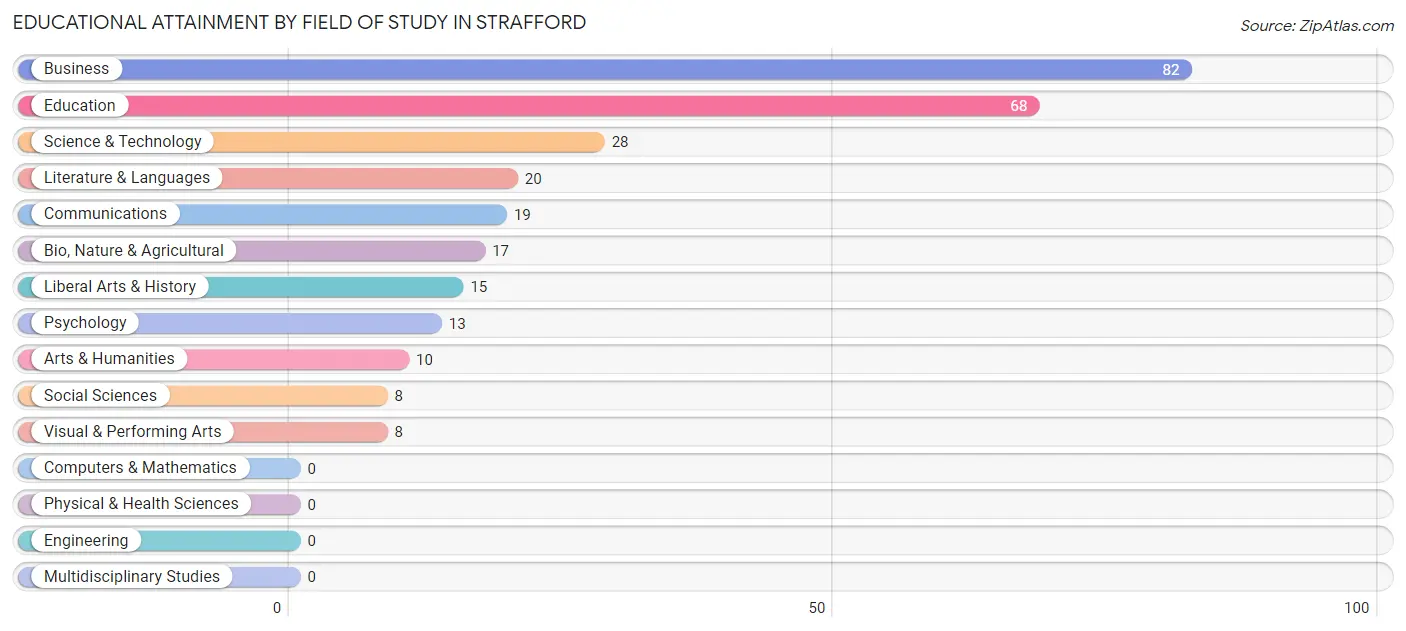
| Field of Study | # Graduates | % Graduates |
| Computers & Mathematics | 0 | 0.0% |
| Bio, Nature & Agricultural | 17 | 5.9% |
| Physical & Health Sciences | 0 | 0.0% |
| Psychology | 13 | 4.5% |
| Social Sciences | 8 | 2.8% |
| Engineering | 0 | 0.0% |
| Multidisciplinary Studies | 0 | 0.0% |
| Science & Technology | 28 | 9.7% |
| Business | 82 | 28.5% |
| Education | 68 | 23.6% |
| Literature & Languages | 20 | 6.9% |
| Liberal Arts & History | 15 | 5.2% |
| Visual & Performing Arts | 8 | 2.8% |
| Communications | 19 | 6.6% |
| Arts & Humanities | 10 | 3.5% |
| Total | 288 | 100.0% |
Transportation & Commute in Strafford
Vehicle Availability by Sex in Strafford
The most prevalent vehicle ownership categories in Strafford are males with 2 vehicles (233, accounting for 40.5%) and females with 2 vehicles (194, making up 39.9%).
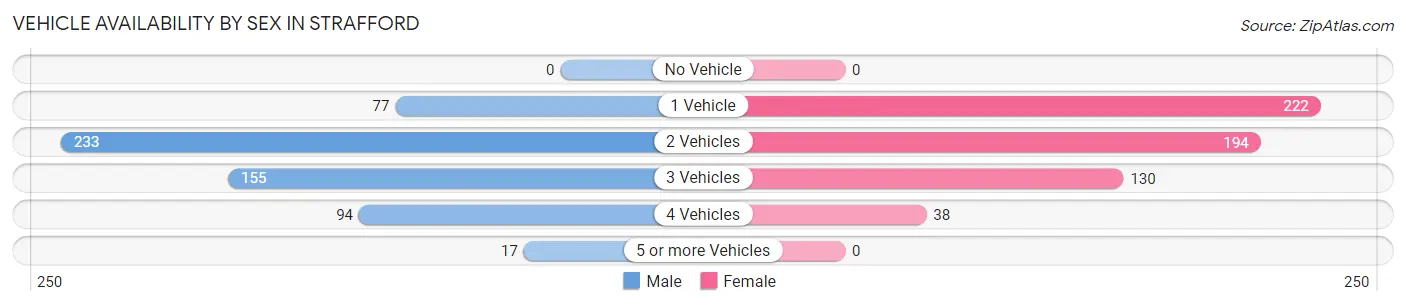
| Vehicles Available | Male | Female |
| No Vehicle | 0 (0.0%) | 0 (0.0%) |
| 1 Vehicle | 77 (13.4%) | 222 (38.0%) |
| 2 Vehicles | 233 (40.5%) | 194 (33.2%) |
| 3 Vehicles | 155 (26.9%) | 130 (22.3%) |
| 4 Vehicles | 94 (16.3%) | 38 (6.5%) |
| 5 or more Vehicles | 17 (2.9%) | 0 (0.0%) |
| Total | 576 (100.0%) | 584 (100.0%) |
Commute Time in Strafford
The most frequently occuring commute durations in Strafford are 20 to 24 minutes (233 commuters, 21.3%), 25 to 29 minutes (208 commuters, 19.1%), and 30 to 34 minutes (187 commuters, 17.1%).
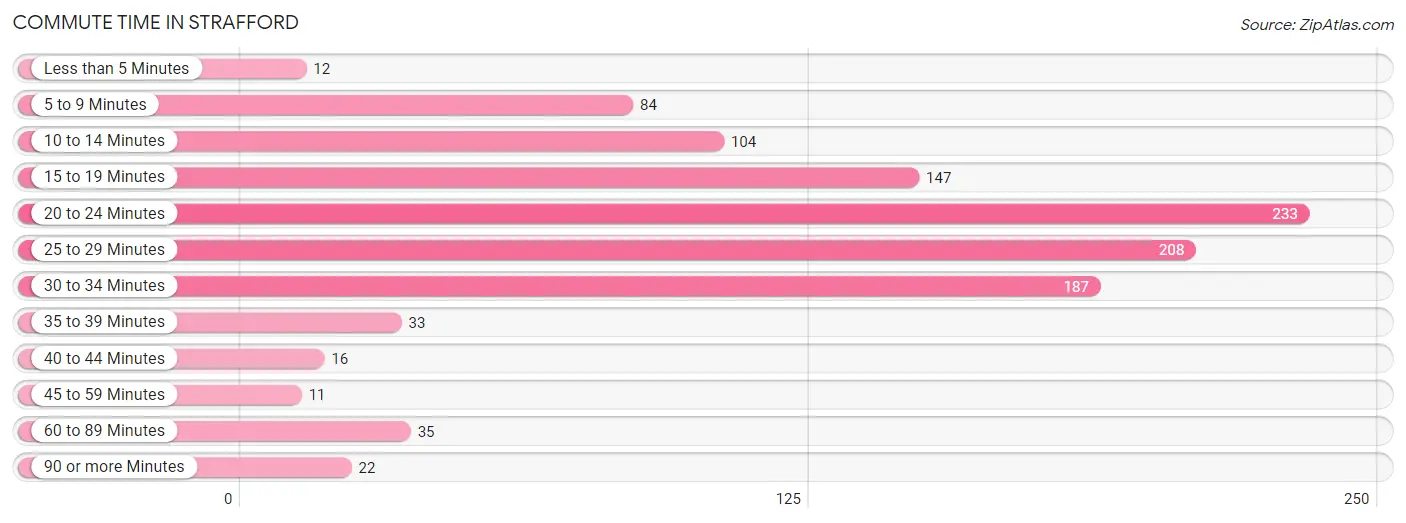
| Commute Time | # Commuters | % Commuters |
| Less than 5 Minutes | 12 | 1.1% |
| 5 to 9 Minutes | 84 | 7.7% |
| 10 to 14 Minutes | 104 | 9.5% |
| 15 to 19 Minutes | 147 | 13.5% |
| 20 to 24 Minutes | 233 | 21.3% |
| 25 to 29 Minutes | 208 | 19.1% |
| 30 to 34 Minutes | 187 | 17.1% |
| 35 to 39 Minutes | 33 | 3.0% |
| 40 to 44 Minutes | 16 | 1.5% |
| 45 to 59 Minutes | 11 | 1.0% |
| 60 to 89 Minutes | 35 | 3.2% |
| 90 or more Minutes | 22 | 2.0% |
Commute Time by Sex in Strafford
The most common commute times in Strafford are 20 to 24 minutes (126 commuters, 22.6%) for males and 25 to 29 minutes (139 commuters, 26.0%) for females.
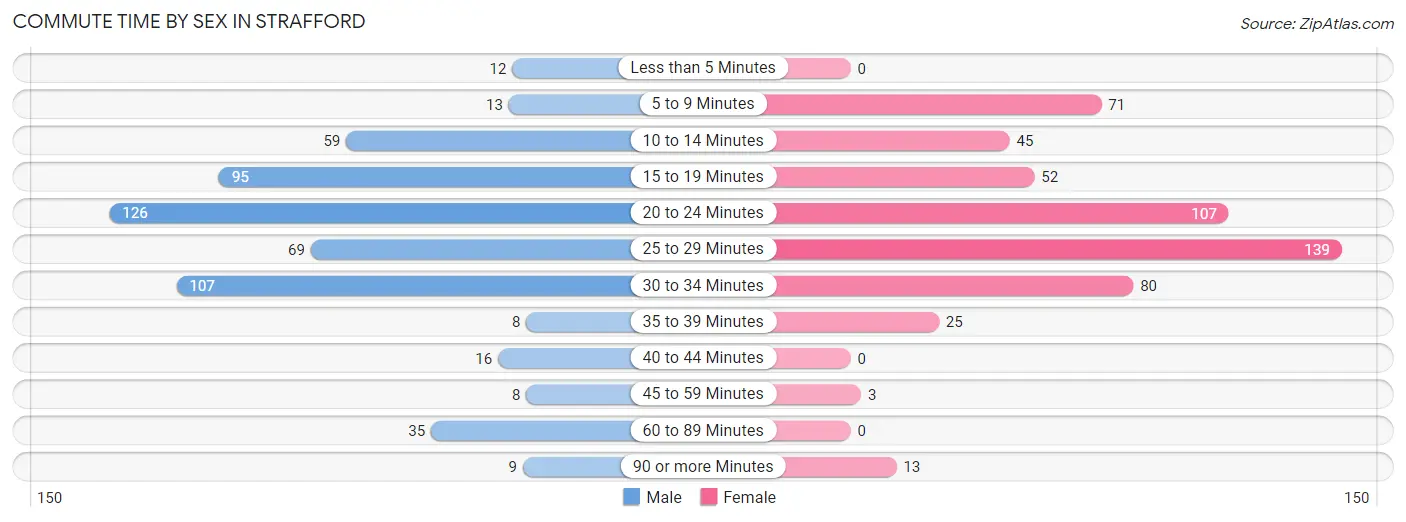
| Commute Time | Male | Female |
| Less than 5 Minutes | 12 (2.1%) | 0 (0.0%) |
| 5 to 9 Minutes | 13 (2.3%) | 71 (13.3%) |
| 10 to 14 Minutes | 59 (10.6%) | 45 (8.4%) |
| 15 to 19 Minutes | 95 (17.1%) | 52 (9.7%) |
| 20 to 24 Minutes | 126 (22.6%) | 107 (20.0%) |
| 25 to 29 Minutes | 69 (12.4%) | 139 (26.0%) |
| 30 to 34 Minutes | 107 (19.2%) | 80 (14.9%) |
| 35 to 39 Minutes | 8 (1.4%) | 25 (4.7%) |
| 40 to 44 Minutes | 16 (2.9%) | 0 (0.0%) |
| 45 to 59 Minutes | 8 (1.4%) | 3 (0.6%) |
| 60 to 89 Minutes | 35 (6.3%) | 0 (0.0%) |
| 90 or more Minutes | 9 (1.6%) | 13 (2.4%) |
Time of Departure to Work by Sex in Strafford
The most frequent times of departure to work in Strafford are 6:30 AM to 6:59 AM (89, 16.0%) for males and 7:30 AM to 7:59 AM (109, 20.4%) for females.
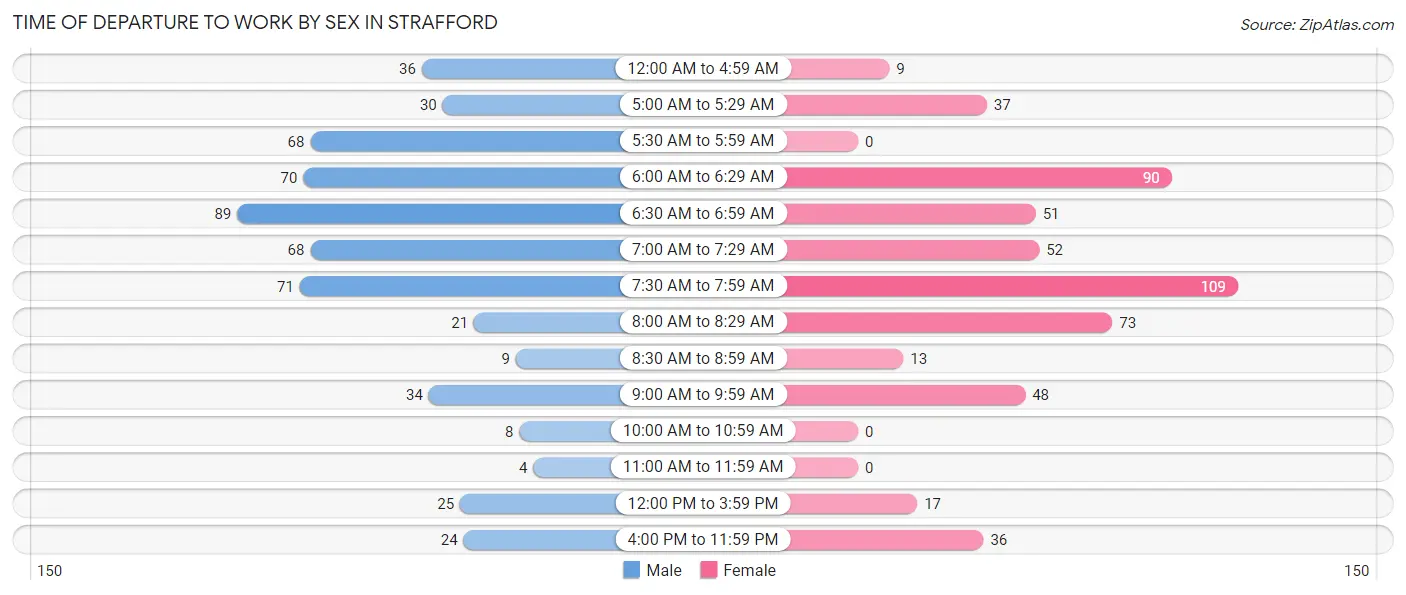
| Time of Departure | Male | Female |
| 12:00 AM to 4:59 AM | 36 (6.5%) | 9 (1.7%) |
| 5:00 AM to 5:29 AM | 30 (5.4%) | 37 (6.9%) |
| 5:30 AM to 5:59 AM | 68 (12.2%) | 0 (0.0%) |
| 6:00 AM to 6:29 AM | 70 (12.6%) | 90 (16.8%) |
| 6:30 AM to 6:59 AM | 89 (16.0%) | 51 (9.5%) |
| 7:00 AM to 7:29 AM | 68 (12.2%) | 52 (9.7%) |
| 7:30 AM to 7:59 AM | 71 (12.8%) | 109 (20.4%) |
| 8:00 AM to 8:29 AM | 21 (3.8%) | 73 (13.6%) |
| 8:30 AM to 8:59 AM | 9 (1.6%) | 13 (2.4%) |
| 9:00 AM to 9:59 AM | 34 (6.1%) | 48 (9.0%) |
| 10:00 AM to 10:59 AM | 8 (1.4%) | 0 (0.0%) |
| 11:00 AM to 11:59 AM | 4 (0.7%) | 0 (0.0%) |
| 12:00 PM to 3:59 PM | 25 (4.5%) | 17 (3.2%) |
| 4:00 PM to 11:59 PM | 24 (4.3%) | 36 (6.7%) |
| Total | 557 (100.0%) | 535 (100.0%) |
Housing Occupancy in Strafford
Occupancy by Ownership in Strafford
Of the total 1,009 dwellings in Strafford, owner-occupied units account for 749 (74.2%), while renter-occupied units make up 260 (25.8%).
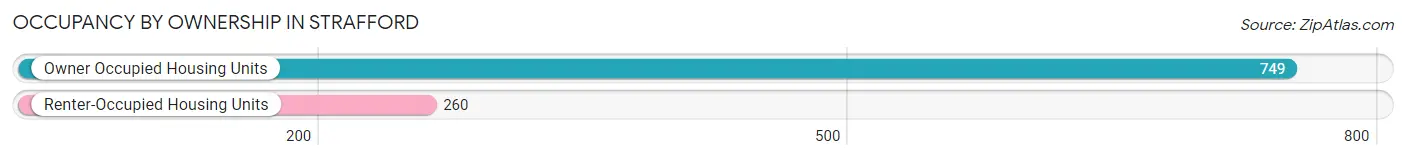
| Occupancy | # Housing Units | % Housing Units |
| Owner Occupied Housing Units | 749 | 74.2% |
| Renter-Occupied Housing Units | 260 | 25.8% |
| Total Occupied Housing Units | 1,009 | 100.0% |
Occupancy by Household Size in Strafford
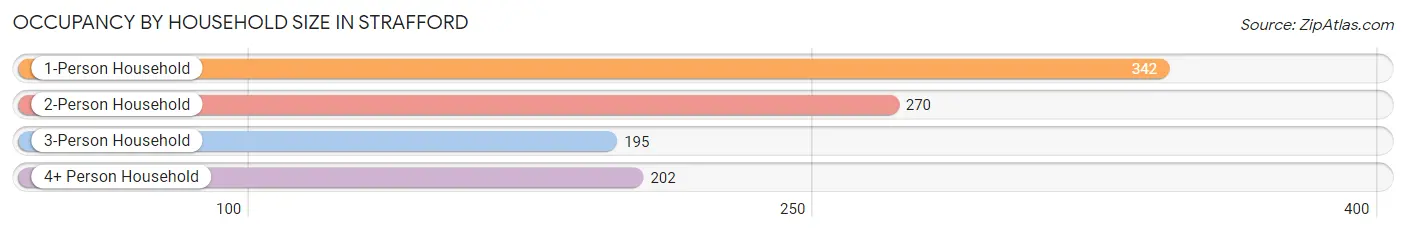
| Household Size | # Housing Units | % Housing Units |
| 1-Person Household | 342 | 33.9% |
| 2-Person Household | 270 | 26.8% |
| 3-Person Household | 195 | 19.3% |
| 4+ Person Household | 202 | 20.0% |
| Total Housing Units | 1,009 | 100.0% |
Occupancy by Ownership by Household Size in Strafford
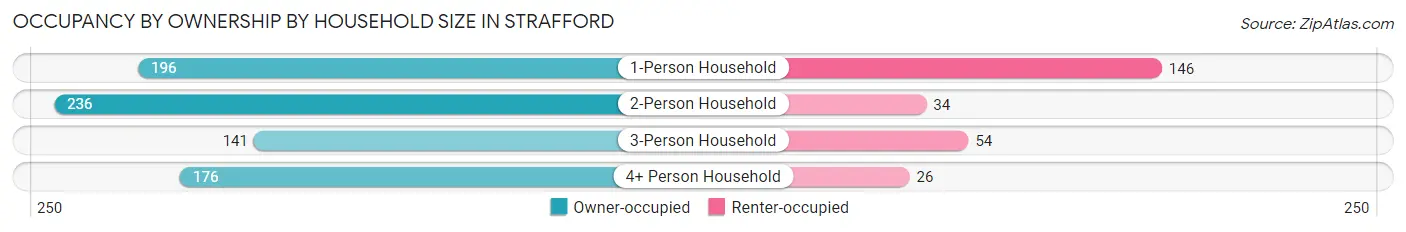
| Household Size | Owner-occupied | Renter-occupied |
| 1-Person Household | 196 (57.3%) | 146 (42.7%) |
| 2-Person Household | 236 (87.4%) | 34 (12.6%) |
| 3-Person Household | 141 (72.3%) | 54 (27.7%) |
| 4+ Person Household | 176 (87.1%) | 26 (12.9%) |
| Total Housing Units | 749 (74.2%) | 260 (25.8%) |
Occupancy by Educational Attainment in Strafford
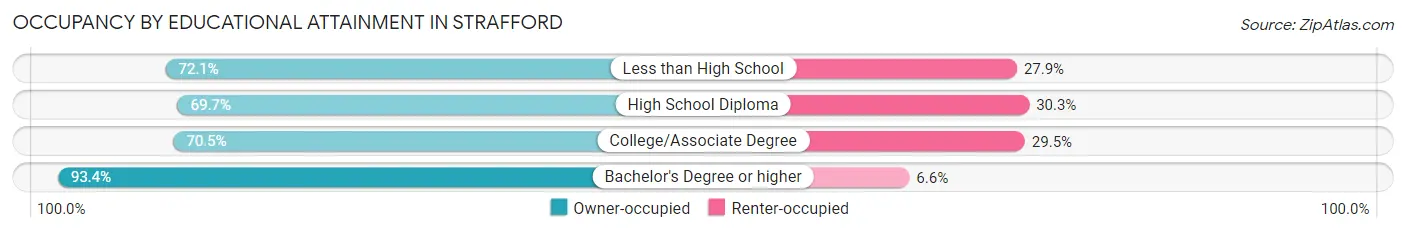
| Household Size | Owner-occupied | Renter-occupied |
| Less than High School | 93 (72.1%) | 36 (27.9%) |
| High School Diploma | 225 (69.7%) | 98 (30.3%) |
| College/Associate Degree | 275 (70.5%) | 115 (29.5%) |
| Bachelor's Degree or higher | 156 (93.4%) | 11 (6.6%) |
Occupancy by Age of Householder in Strafford
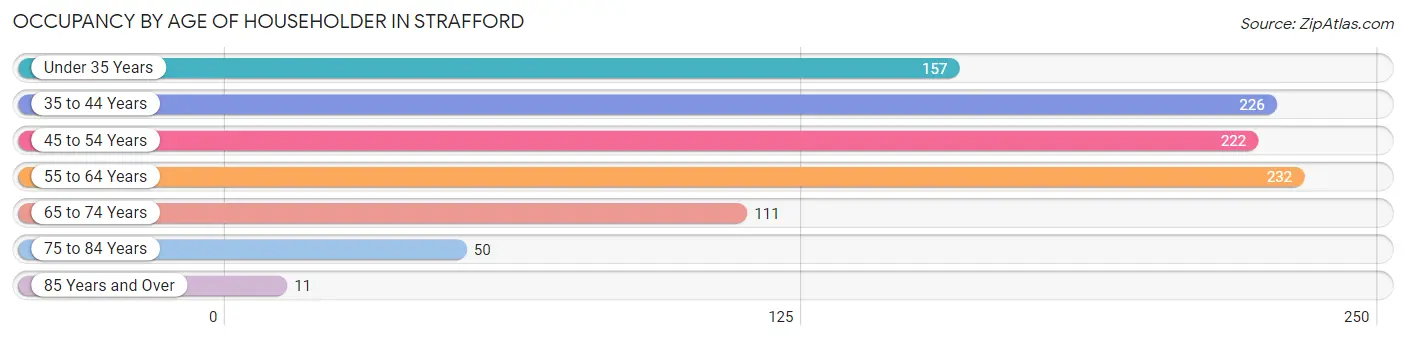
| Age Bracket | # Households | % Households |
| Under 35 Years | 157 | 15.6% |
| 35 to 44 Years | 226 | 22.4% |
| 45 to 54 Years | 222 | 22.0% |
| 55 to 64 Years | 232 | 23.0% |
| 65 to 74 Years | 111 | 11.0% |
| 75 to 84 Years | 50 | 5.0% |
| 85 Years and Over | 11 | 1.1% |
| Total | 1,009 | 100.0% |
Housing Finances in Strafford
Median Income by Occupancy in Strafford
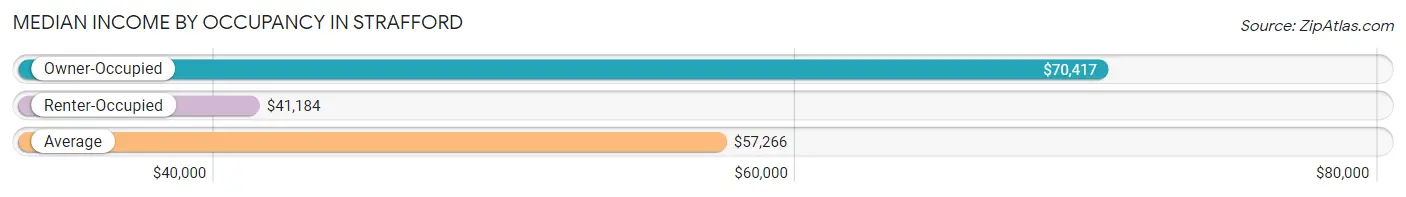
| Occupancy Type | # Households | Median Income |
| Owner-Occupied | 749 (74.2%) | $70,417 |
| Renter-Occupied | 260 (25.8%) | $41,184 |
| Average | 1,009 (100.0%) | $57,266 |
Occupancy by Householder Income Bracket in Strafford
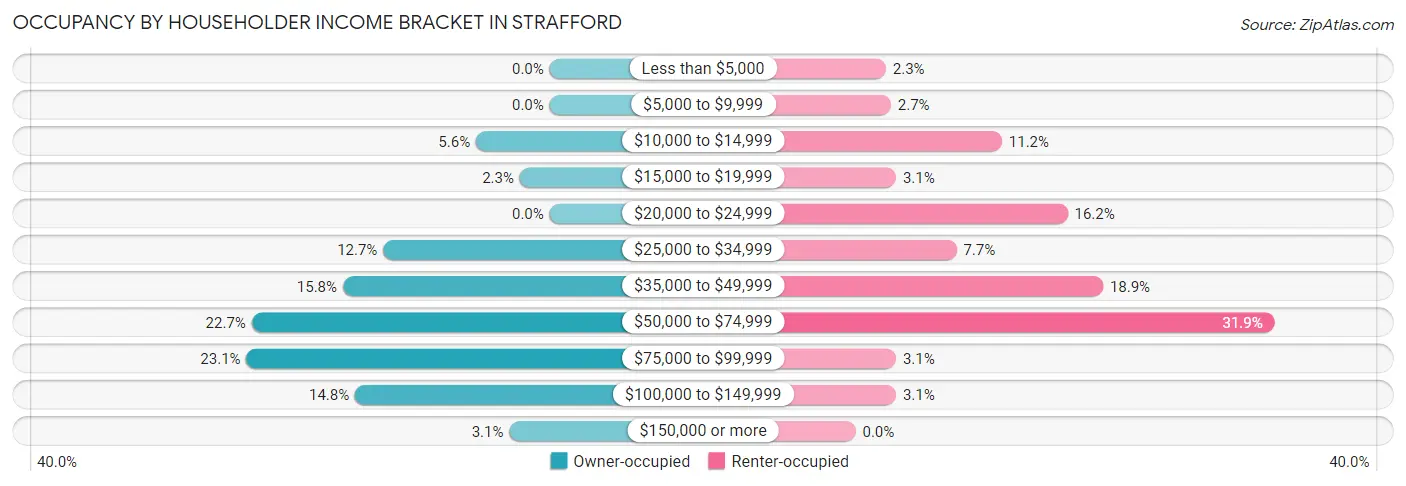
| Income Bracket | Owner-occupied | Renter-occupied |
| Less than $5,000 | 0 (0.0%) | 6 (2.3%) |
| $5,000 to $9,999 | 0 (0.0%) | 7 (2.7%) |
| $10,000 to $14,999 | 42 (5.6%) | 29 (11.2%) |
| $15,000 to $19,999 | 17 (2.3%) | 8 (3.1%) |
| $20,000 to $24,999 | 0 (0.0%) | 42 (16.2%) |
| $25,000 to $34,999 | 95 (12.7%) | 20 (7.7%) |
| $35,000 to $49,999 | 118 (15.8%) | 49 (18.9%) |
| $50,000 to $74,999 | 170 (22.7%) | 83 (31.9%) |
| $75,000 to $99,999 | 173 (23.1%) | 8 (3.1%) |
| $100,000 to $149,999 | 111 (14.8%) | 8 (3.1%) |
| $150,000 or more | 23 (3.1%) | 0 (0.0%) |
| Total | 749 (100.0%) | 260 (100.0%) |
Monthly Housing Cost Tiers in Strafford
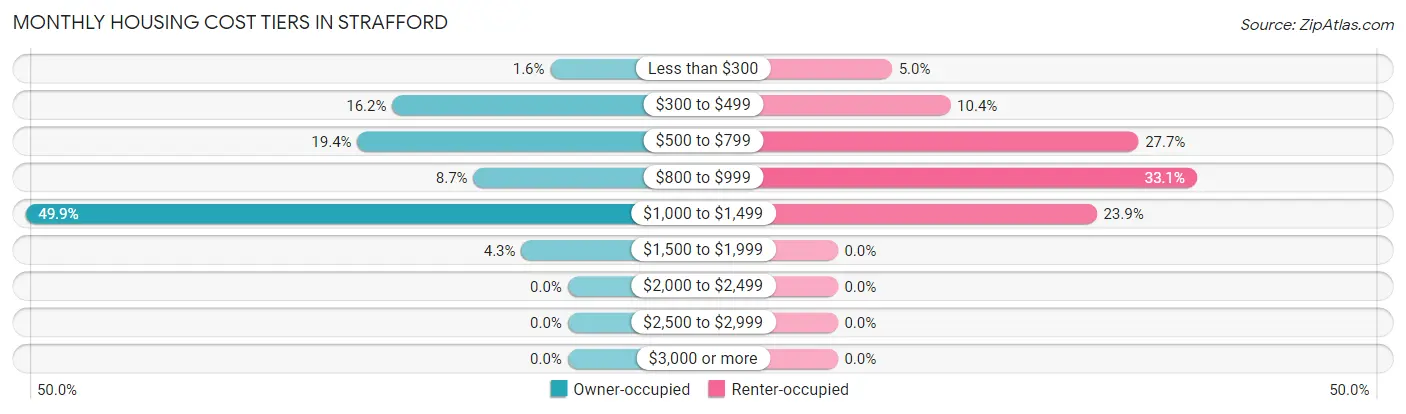
| Monthly Cost | Owner-occupied | Renter-occupied |
| Less than $300 | 12 (1.6%) | 13 (5.0%) |
| $300 to $499 | 121 (16.2%) | 27 (10.4%) |
| $500 to $799 | 145 (19.4%) | 72 (27.7%) |
| $800 to $999 | 65 (8.7%) | 86 (33.1%) |
| $1,000 to $1,499 | 374 (49.9%) | 62 (23.8%) |
| $1,500 to $1,999 | 32 (4.3%) | 0 (0.0%) |
| $2,000 to $2,499 | 0 (0.0%) | 0 (0.0%) |
| $2,500 to $2,999 | 0 (0.0%) | 0 (0.0%) |
| $3,000 or more | 0 (0.0%) | 0 (0.0%) |
| Total | 749 (100.0%) | 260 (100.0%) |
Physical Housing Characteristics in Strafford
Housing Structures in Strafford
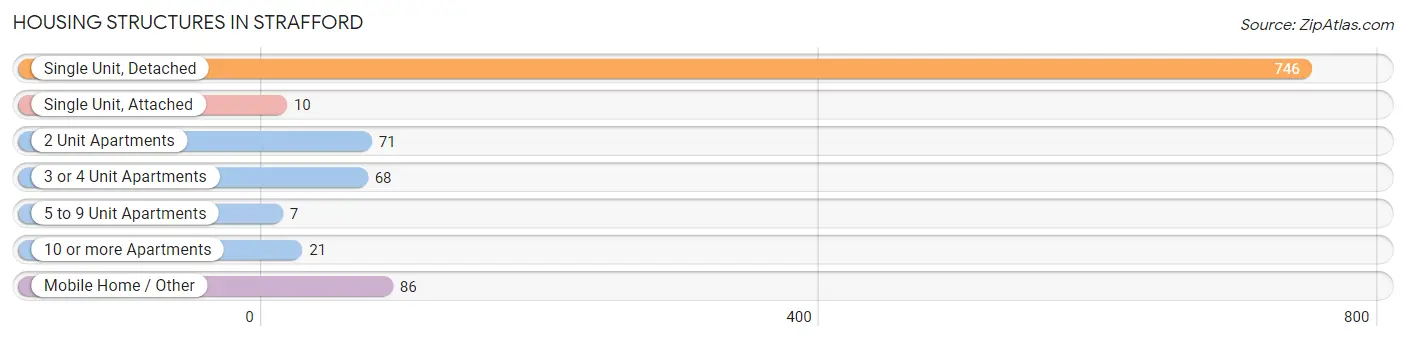
| Structure Type | # Housing Units | % Housing Units |
| Single Unit, Detached | 746 | 73.9% |
| Single Unit, Attached | 10 | 1.0% |
| 2 Unit Apartments | 71 | 7.0% |
| 3 or 4 Unit Apartments | 68 | 6.7% |
| 5 to 9 Unit Apartments | 7 | 0.7% |
| 10 or more Apartments | 21 | 2.1% |
| Mobile Home / Other | 86 | 8.5% |
| Total | 1,009 | 100.0% |
Housing Structures by Occupancy in Strafford
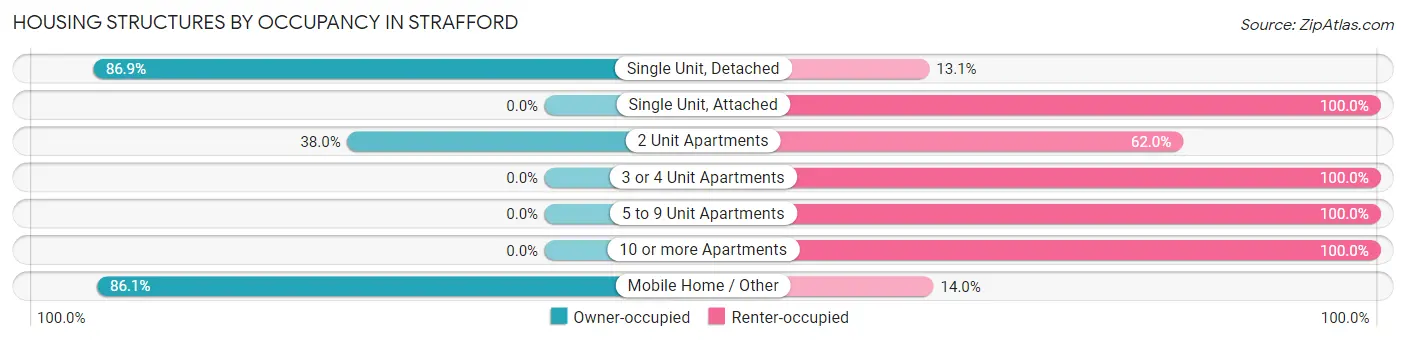
| Structure Type | Owner-occupied | Renter-occupied |
| Single Unit, Detached | 648 (86.9%) | 98 (13.1%) |
| Single Unit, Attached | 0 (0.0%) | 10 (100.0%) |
| 2 Unit Apartments | 27 (38.0%) | 44 (62.0%) |
| 3 or 4 Unit Apartments | 0 (0.0%) | 68 (100.0%) |
| 5 to 9 Unit Apartments | 0 (0.0%) | 7 (100.0%) |
| 10 or more Apartments | 0 (0.0%) | 21 (100.0%) |
| Mobile Home / Other | 74 (86.1%) | 12 (14.0%) |
| Total | 749 (74.2%) | 260 (25.8%) |
Housing Structures by Number of Rooms in Strafford
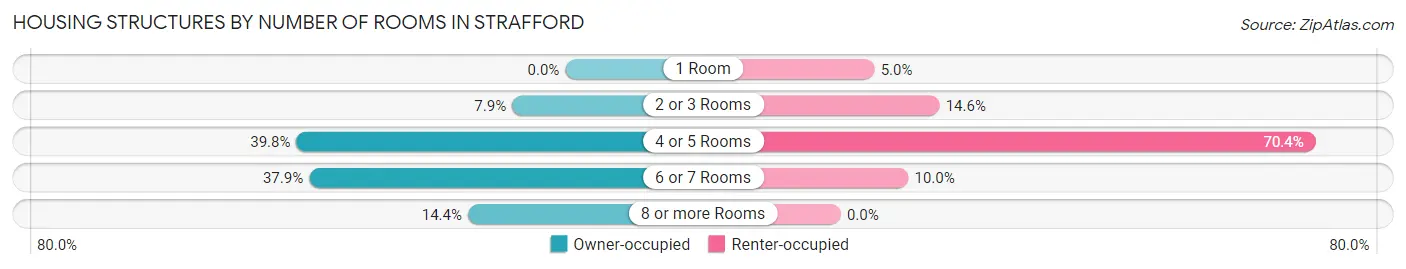
| Number of Rooms | Owner-occupied | Renter-occupied |
| 1 Room | 0 (0.0%) | 13 (5.0%) |
| 2 or 3 Rooms | 59 (7.9%) | 38 (14.6%) |
| 4 or 5 Rooms | 298 (39.8%) | 183 (70.4%) |
| 6 or 7 Rooms | 284 (37.9%) | 26 (10.0%) |
| 8 or more Rooms | 108 (14.4%) | 0 (0.0%) |
| Total | 749 (100.0%) | 260 (100.0%) |
Housing Structure by Heating Type in Strafford
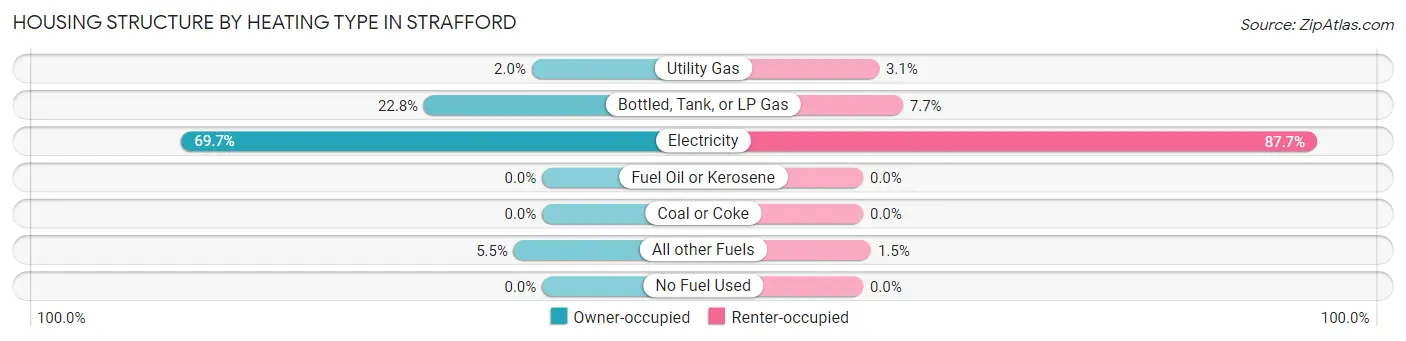
| Heating Type | Owner-occupied | Renter-occupied |
| Utility Gas | 15 (2.0%) | 8 (3.1%) |
| Bottled, Tank, or LP Gas | 171 (22.8%) | 20 (7.7%) |
| Electricity | 522 (69.7%) | 228 (87.7%) |
| Fuel Oil or Kerosene | 0 (0.0%) | 0 (0.0%) |
| Coal or Coke | 0 (0.0%) | 0 (0.0%) |
| All other Fuels | 41 (5.5%) | 4 (1.5%) |
| No Fuel Used | 0 (0.0%) | 0 (0.0%) |
| Total | 749 (100.0%) | 260 (100.0%) |
Household Vehicle Usage in Strafford
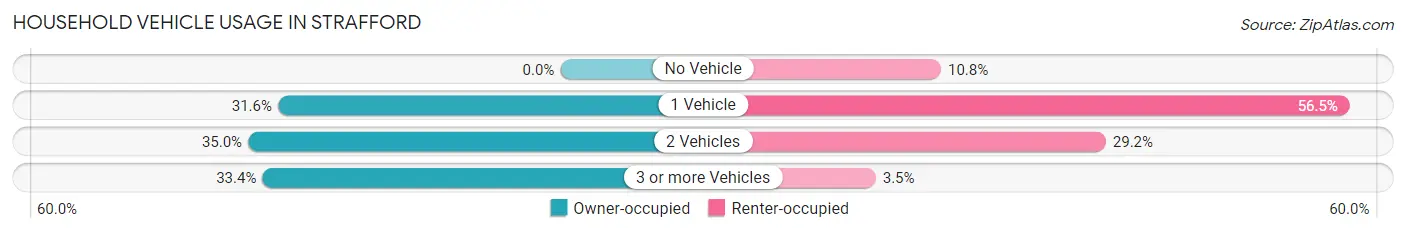
| Vehicles per Household | Owner-occupied | Renter-occupied |
| No Vehicle | 0 (0.0%) | 28 (10.8%) |
| 1 Vehicle | 237 (31.6%) | 147 (56.5%) |
| 2 Vehicles | 262 (35.0%) | 76 (29.2%) |
| 3 or more Vehicles | 250 (33.4%) | 9 (3.5%) |
| Total | 749 (100.0%) | 260 (100.0%) |
Real Estate & Mortgages in Strafford
Real Estate and Mortgage Overview in Strafford
| Characteristic | Without Mortgage | With Mortgage |
| Housing Units | 228 | 521 |
| Median Property Value | $130,800 | $154,200 |
| Median Household Income | $65,000 | $17 |
| Monthly Housing Costs | $474 | $0 |
| Real Estate Taxes | $987 | $22 |
Property Value by Mortgage Status in Strafford
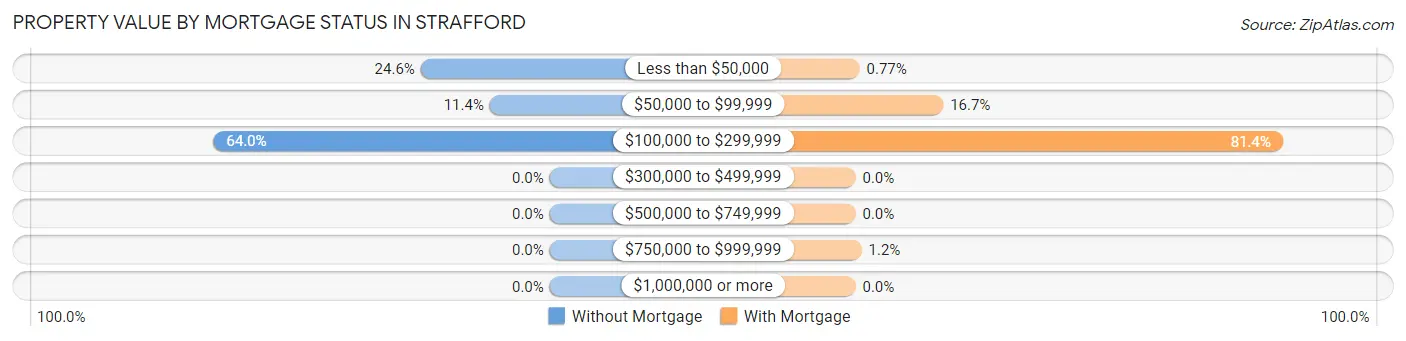
| Property Value | Without Mortgage | With Mortgage |
| Less than $50,000 | 56 (24.6%) | 4 (0.8%) |
| $50,000 to $99,999 | 26 (11.4%) | 87 (16.7%) |
| $100,000 to $299,999 | 146 (64.0%) | 424 (81.4%) |
| $300,000 to $499,999 | 0 (0.0%) | 0 (0.0%) |
| $500,000 to $749,999 | 0 (0.0%) | 0 (0.0%) |
| $750,000 to $999,999 | 0 (0.0%) | 6 (1.1%) |
| $1,000,000 or more | 0 (0.0%) | 0 (0.0%) |
| Total | 228 (100.0%) | 521 (100.0%) |
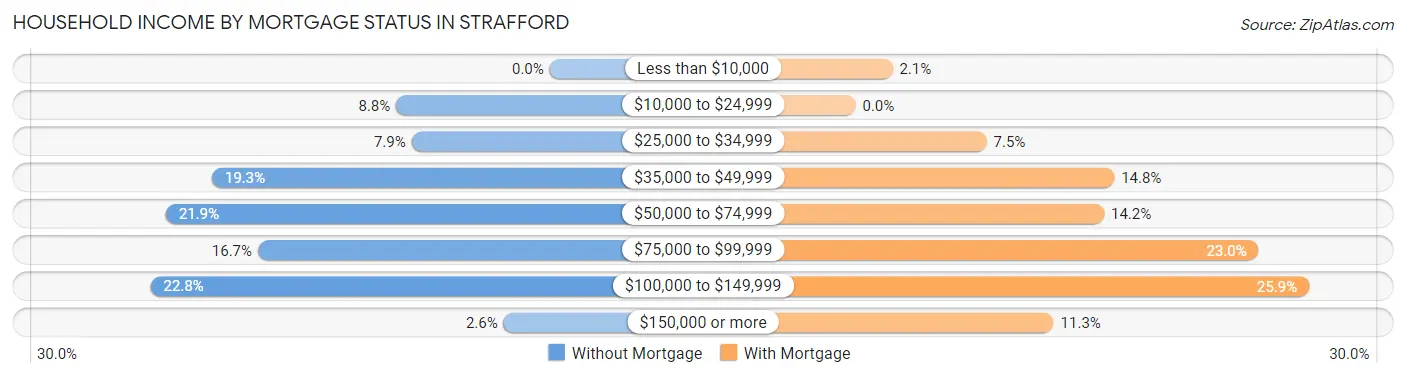
Household Income by Mortgage Status in Strafford
| Household Income | Without Mortgage | With Mortgage |
| Less than $10,000 | 0 (0.0%) | 11 (2.1%) |
| $10,000 to $24,999 | 20 (8.8%) | 0 (0.0%) |
| $25,000 to $34,999 | 18 (7.9%) | 39 (7.5%) |
| $35,000 to $49,999 | 44 (19.3%) | 77 (14.8%) |
| $50,000 to $74,999 | 50 (21.9%) | 74 (14.2%) |
| $75,000 to $99,999 | 38 (16.7%) | 120 (23.0%) |
| $100,000 to $149,999 | 52 (22.8%) | 135 (25.9%) |
| $150,000 or more | 6 (2.6%) | 59 (11.3%) |
| Total | 228 (100.0%) | 521 (100.0%) |
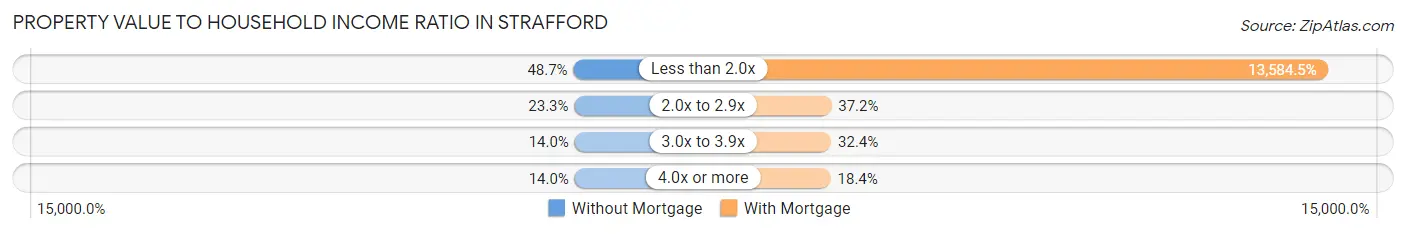
Property Value to Household Income Ratio in Strafford
| Value-to-Income Ratio | Without Mortgage | With Mortgage |
| Less than 2.0x | 111 (48.7%) | 70,775 (13,584.5%) |
| 2.0x to 2.9x | 53 (23.3%) | 194 (37.2%) |
| 3.0x to 3.9x | 32 (14.0%) | 169 (32.4%) |
| 4.0x or more | 32 (14.0%) | 96 (18.4%) |
| Total | 228 (100.0%) | 521 (100.0%) |
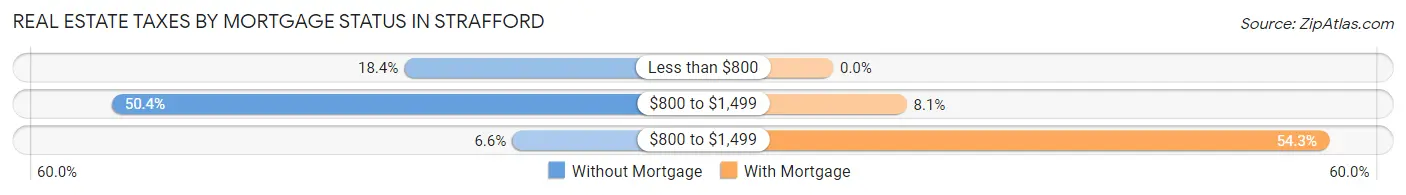
Real Estate Taxes by Mortgage Status in Strafford
| Property Taxes | Without Mortgage | With Mortgage |
| Less than $800 | 42 (18.4%) | 0 (0.0%) |
| $800 to $1,499 | 115 (50.4%) | 42 (8.1%) |
| $800 to $1,499 | 15 (6.6%) | 283 (54.3%) |
| Total | 228 (100.0%) | 521 (100.0%) |
Health & Disability in Strafford
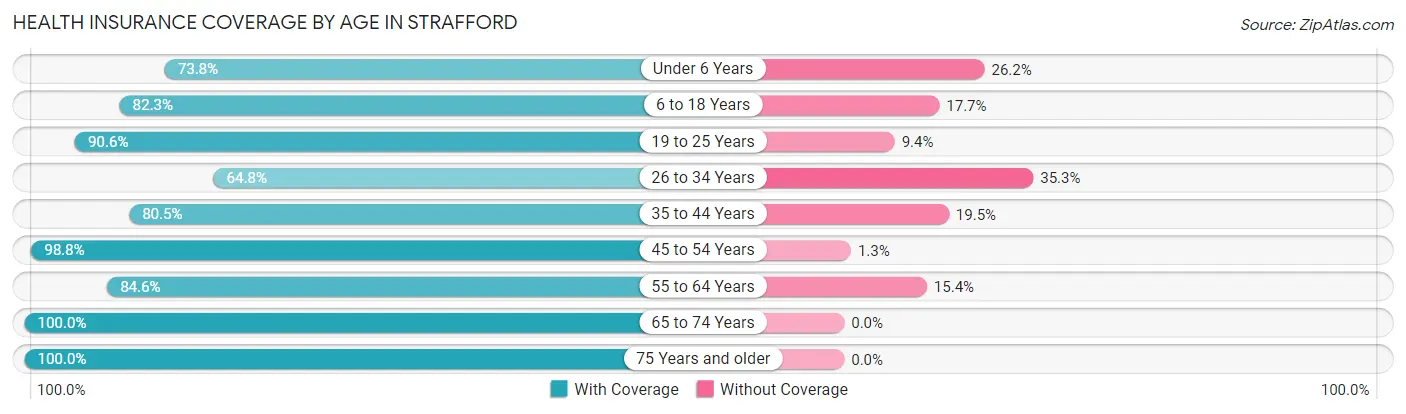
Health Insurance Coverage by Age in Strafford
| Age Bracket | With Coverage | Without Coverage |
| Under 6 Years | 254 (73.8%) | 90 (26.2%) |
| 6 to 18 Years | 399 (82.3%) | 86 (17.7%) |
| 19 to 25 Years | 135 (90.6%) | 14 (9.4%) |
| 26 to 34 Years | 180 (64.7%) | 98 (35.2%) |
| 35 to 44 Years | 293 (80.5%) | 71 (19.5%) |
| 45 to 54 Years | 316 (98.8%) | 4 (1.3%) |
| 55 to 64 Years | 269 (84.6%) | 49 (15.4%) |
| 65 to 74 Years | 134 (100.0%) | 0 (0.0%) |
| 75 Years and older | 104 (100.0%) | 0 (0.0%) |
| Total | 2,084 (83.5%) | 412 (16.5%) |
Health Insurance Coverage by Citizenship Status in Strafford
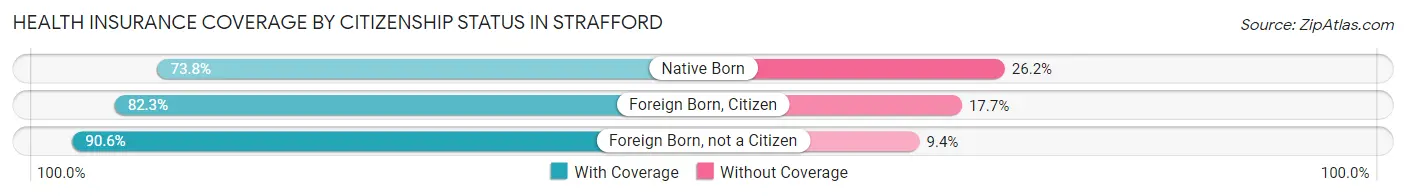
| Citizenship Status | With Coverage | Without Coverage |
| Native Born | 254 (73.8%) | 90 (26.2%) |
| Foreign Born, Citizen | 399 (82.3%) | 86 (17.7%) |
| Foreign Born, not a Citizen | 135 (90.6%) | 14 (9.4%) |
Health Insurance Coverage by Household Income in Strafford
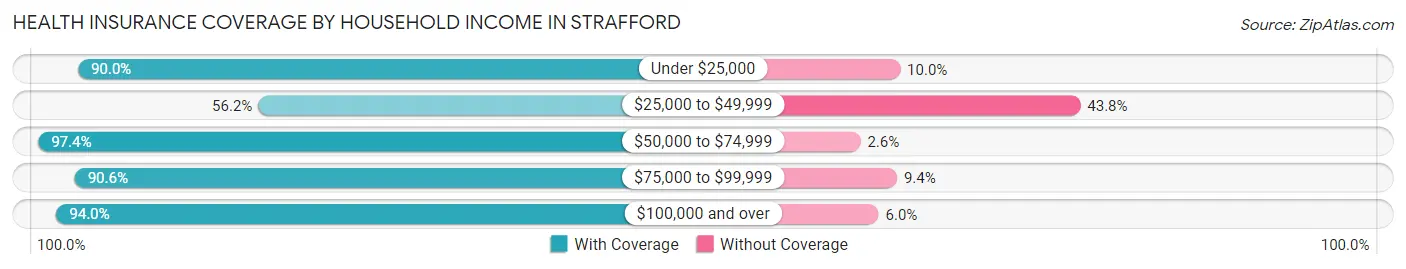
| Household Income | With Coverage | Without Coverage |
| Under $25,000 | 171 (90.0%) | 19 (10.0%) |
| $25,000 to $49,999 | 383 (56.2%) | 298 (43.8%) |
| $50,000 to $74,999 | 609 (97.4%) | 16 (2.6%) |
| $75,000 to $99,999 | 511 (90.6%) | 53 (9.4%) |
| $100,000 and over | 410 (94.0%) | 26 (6.0%) |
Public vs Private Health Insurance Coverage by Age in Strafford
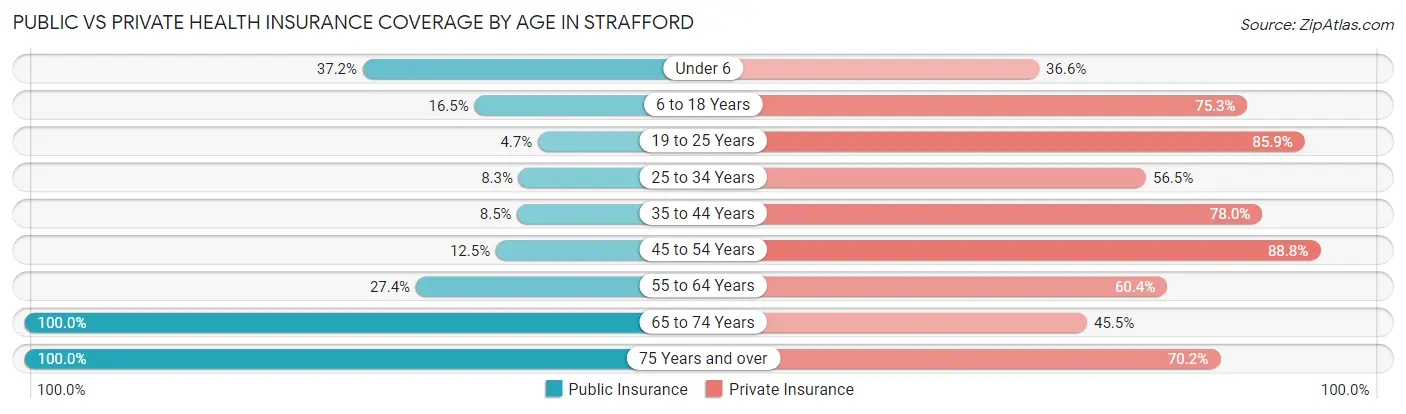
| Age Bracket | Public Insurance | Private Insurance |
| Under 6 | 128 (37.2%) | 126 (36.6%) |
| 6 to 18 Years | 80 (16.5%) | 365 (75.3%) |
| 19 to 25 Years | 7 (4.7%) | 128 (85.9%) |
| 25 to 34 Years | 23 (8.3%) | 157 (56.5%) |
| 35 to 44 Years | 31 (8.5%) | 284 (78.0%) |
| 45 to 54 Years | 40 (12.5%) | 284 (88.7%) |
| 55 to 64 Years | 87 (27.4%) | 192 (60.4%) |
| 65 to 74 Years | 134 (100.0%) | 61 (45.5%) |
| 75 Years and over | 104 (100.0%) | 73 (70.2%) |
| Total | 634 (25.4%) | 1,670 (66.9%) |
Disability Status by Sex by Age in Strafford
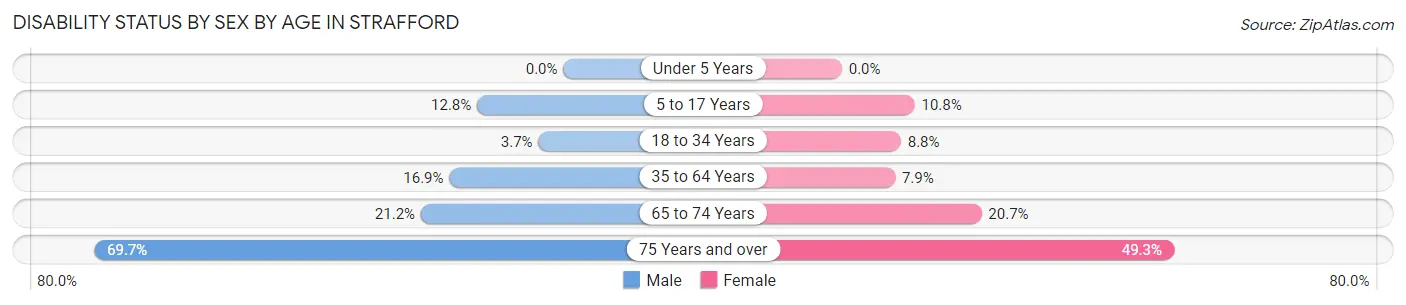
| Age Bracket | Male | Female |
| Under 5 Years | 0 (0.0%) | 0 (0.0%) |
| 5 to 17 Years | 41 (12.8%) | 23 (10.8%) |
| 18 to 34 Years | 8 (3.7%) | 19 (8.8%) |
| 35 to 64 Years | 86 (16.9%) | 39 (7.9%) |
| 65 to 74 Years | 11 (21.1%) | 17 (20.7%) |
| 75 Years and over | 23 (69.7%) | 35 (49.3%) |
Disability Class by Sex by Age in Strafford
Disability Class: Hearing Difficulty
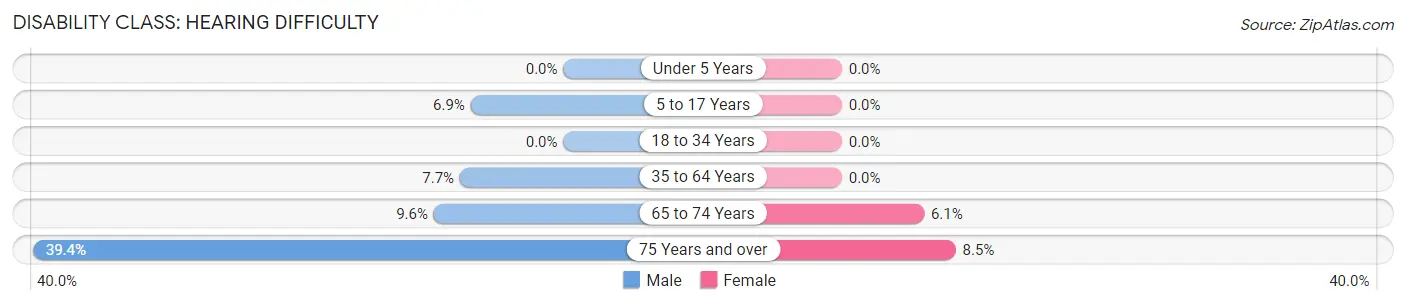
| Age Bracket | Male | Female |
| Under 5 Years | 0 (0.0%) | 0 (0.0%) |
| 5 to 17 Years | 22 (6.9%) | 0 (0.0%) |
| 18 to 34 Years | 0 (0.0%) | 0 (0.0%) |
| 35 to 64 Years | 39 (7.7%) | 0 (0.0%) |
| 65 to 74 Years | 5 (9.6%) | 5 (6.1%) |
| 75 Years and over | 13 (39.4%) | 6 (8.5%) |
Disability Class: Vision Difficulty
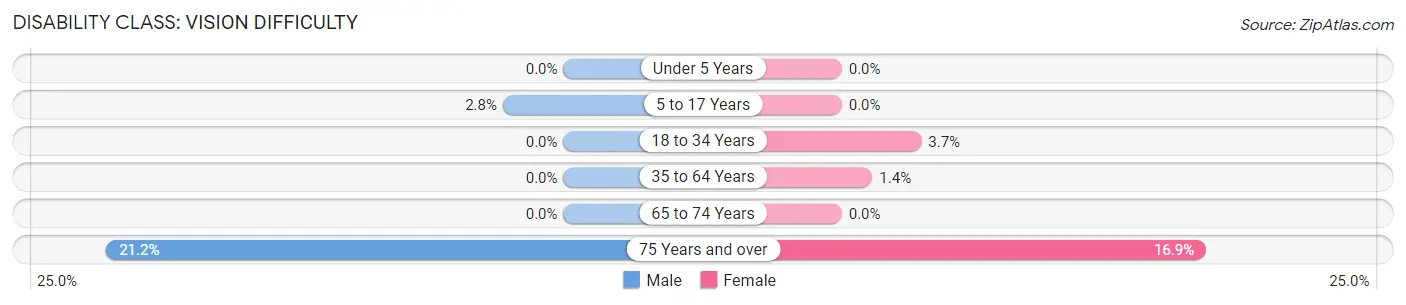
| Age Bracket | Male | Female |
| Under 5 Years | 0 (0.0%) | 0 (0.0%) |
| 5 to 17 Years | 9 (2.8%) | 0 (0.0%) |
| 18 to 34 Years | 0 (0.0%) | 8 (3.7%) |
| 35 to 64 Years | 0 (0.0%) | 7 (1.4%) |
| 65 to 74 Years | 0 (0.0%) | 0 (0.0%) |
| 75 Years and over | 7 (21.2%) | 12 (16.9%) |
Disability Class: Cognitive Difficulty
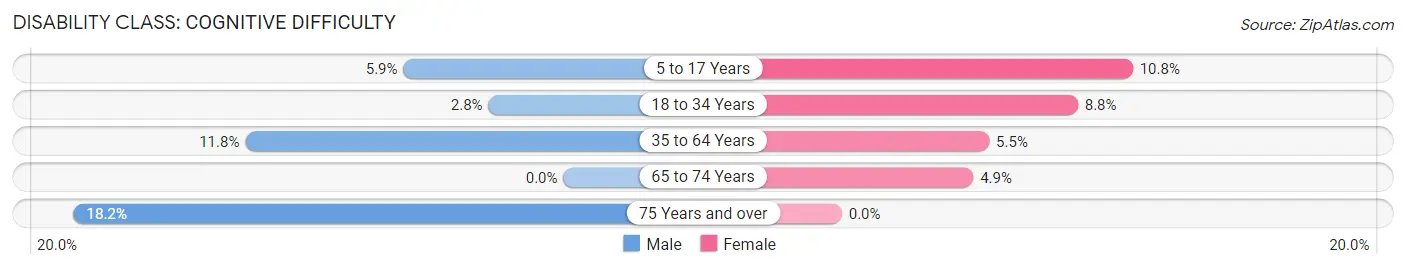
| Age Bracket | Male | Female |
| 5 to 17 Years | 19 (5.9%) | 23 (10.8%) |
| 18 to 34 Years | 6 (2.8%) | 19 (8.8%) |
| 35 to 64 Years | 60 (11.8%) | 27 (5.5%) |
| 65 to 74 Years | 0 (0.0%) | 4 (4.9%) |
| 75 Years and over | 6 (18.2%) | 0 (0.0%) |
Disability Class: Ambulatory Difficulty
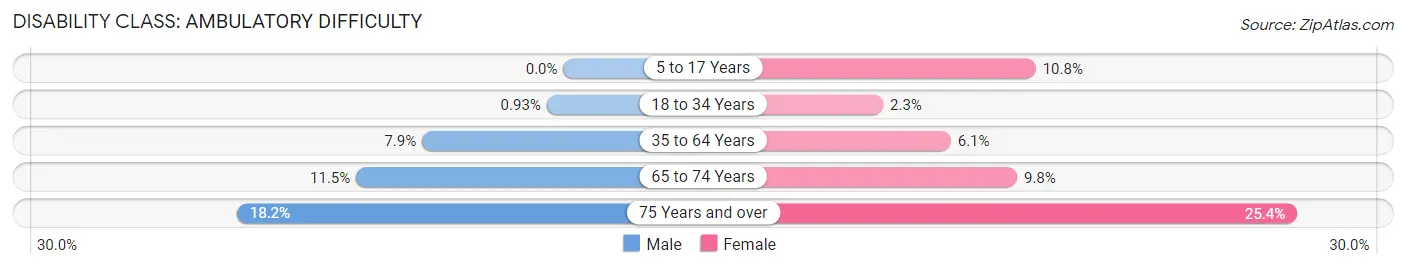
| Age Bracket | Male | Female |
| 5 to 17 Years | 0 (0.0%) | 23 (10.8%) |
| 18 to 34 Years | 2 (0.9%) | 5 (2.3%) |
| 35 to 64 Years | 40 (7.9%) | 30 (6.1%) |
| 65 to 74 Years | 6 (11.5%) | 8 (9.8%) |
| 75 Years and over | 6 (18.2%) | 18 (25.4%) |
Disability Class: Self-Care Difficulty
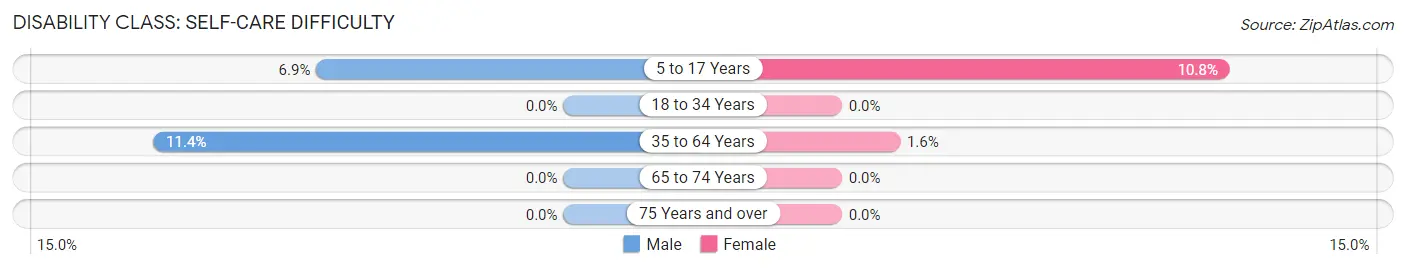
| Age Bracket | Male | Female |
| 5 to 17 Years | 22 (6.9%) | 23 (10.8%) |
| 18 to 34 Years | 0 (0.0%) | 0 (0.0%) |
| 35 to 64 Years | 58 (11.4%) | 8 (1.6%) |
| 65 to 74 Years | 0 (0.0%) | 0 (0.0%) |
| 75 Years and over | 0 (0.0%) | 0 (0.0%) |
Technology Access in Strafford
Computing Device Access in Strafford
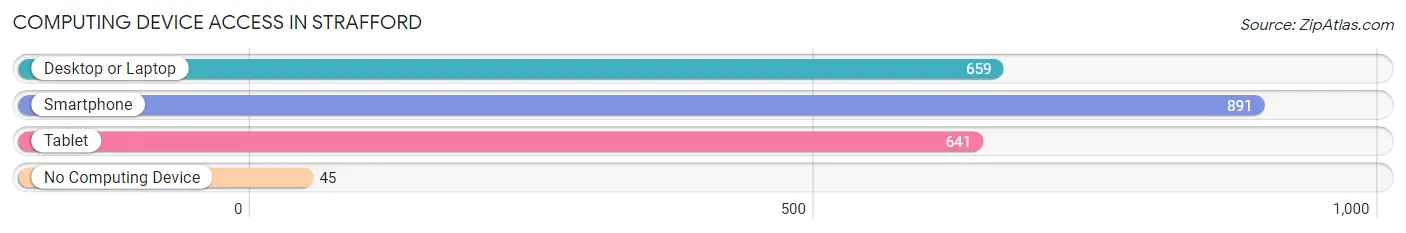
| Device Type | # Households | % Households |
| Desktop or Laptop | 659 | 65.3% |
| Smartphone | 891 | 88.3% |
| Tablet | 641 | 63.5% |
| No Computing Device | 45 | 4.5% |
| Total | 1,009 | 100.0% |
Internet Access in Strafford
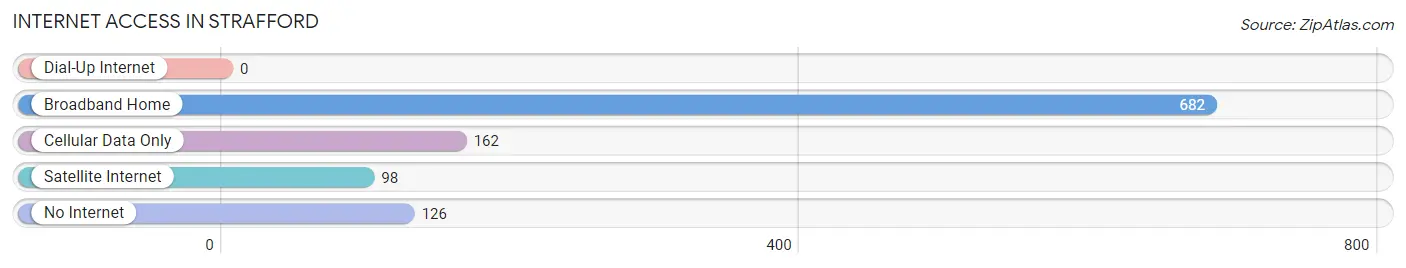
| Internet Type | # Households | % Households |
| Dial-Up Internet | 0 | 0.0% |
| Broadband Home | 682 | 67.6% |
| Cellular Data Only | 162 | 16.1% |
| Satellite Internet | 98 | 9.7% |
| No Internet | 126 | 12.5% |
| Total | 1,009 | 100.0% |
Strafford Summary
History
The town of Strafford, Missouri is located in Greene County, approximately 10 miles northeast of Springfield. It is a small town with a population of just over 2,000 people. The town was founded in 1883 by the Missouri Pacific Railroad and was named after the town of Strafford, England. The town was originally a farming community, but has since grown to include a variety of businesses and industries.
The town of Strafford has a rich history that dates back to the early 1800s. The first settlers in the area were Native Americans, who were followed by settlers from the United States. The first settlers in the area were primarily farmers, and the town was officially founded in 1883.
The town of Strafford has seen many changes over the years. In the early 1900s, the town was a thriving agricultural community, with many farms and businesses. In the 1950s, the town began to experience a population boom, as many people moved to the area to take advantage of the growing economy.
Today, Strafford is a small town with a population of just over 2,000 people. The town is home to a variety of businesses and industries, including manufacturing, retail, and healthcare. The town is also home to a number of parks and recreational areas, including the Strafford City Park and the Strafford Golf Course.
Geography
Strafford is located in Greene County, Missouri, approximately 10 miles northeast of Springfield. The town is situated in the Ozark Mountains, and is surrounded by rolling hills and wooded areas. The town is located on the banks of the James River, which provides a scenic backdrop for the town.
The town of Strafford has a total area of 2.2 square miles, all of which is land. The town is located at an elevation of 890 feet above sea level. The climate in Strafford is characterized by hot, humid summers and cold, wet winters.
Economy
The economy of Strafford is largely based on agriculture and manufacturing. The town is home to a variety of businesses and industries, including manufacturing, retail, and healthcare. The town is also home to a number of parks and recreational areas, including the Strafford City Park and the Strafford Golf Course.
The town of Strafford is home to a number of businesses and industries, including manufacturing, retail, and healthcare. The town is also home to a number of parks and recreational areas, including the Strafford City Park and the Strafford Golf Course.
Demographics
As of the 2010 census, the town of Strafford had a population of 2,072 people. The racial makeup of the town was 97.2% White, 0.7% African American, 0.2% Native American, 0.3% Asian, 0.1% Pacific Islander, 0.4% from other races, and 1.1% from two or more races. Hispanic or Latino of any race were 1.3% of the population.
The median income for a household in the town was $41,250, and the median income for a family was $50,000. The per capita income for the town was $20,945. About 8.2% of families and 10.2% of the population were below the poverty line, including 14.2% of those under age 18 and 8.3% of those age 65 or over.
Common Questions
What is Per Capita Income in Strafford?
Per Capita income in Strafford is $25,455.
What is the Median Family Income in Strafford?
Median Family Income in Strafford is $72,477.
What is the Median Household income in Strafford?
Median Household Income in Strafford is $57,266.
What is Income or Wage Gap in Strafford?
Income or Wage Gap in Strafford is 19.2%.
Women in Strafford earn 80.8 cents for every dollar earned by a man.
What is Inequality or Gini Index in Strafford?
Inequality or Gini Index in Strafford is 0.33.
What is the Total Population of Strafford?
Total Population of Strafford is 2,570.
What is the Total Male Population of Strafford?
Total Male Population of Strafford is 1,237.
What is the Total Female Population of Strafford?
Total Female Population of Strafford is 1,333.
What is the Ratio of Males per 100 Females in Strafford?
There are 92.80 Males per 100 Females in Strafford.
What is the Ratio of Females per 100 Males in Strafford?
There are 107.76 Females per 100 Males in Strafford.
What is the Median Population Age in Strafford?
Median Population Age in Strafford is 35.3 Years.
What is the Average Family Size in Strafford
Average Family Size in Strafford is 3.2 People.
What is the Average Household Size in Strafford
Average Household Size in Strafford is 2.5 People.
How Large is the Labor Force in Strafford?
There are 1,199 People in the Labor Forcein in Strafford.
What is the Percentage of People in the Labor Force in Strafford?
65.6% of People are in the Labor Force in Strafford.
What is the Unemployment Rate in Strafford?
Unemployment Rate in Strafford is 2.7%.