Lake Viking, MO Map & Demographics
Lake Viking Map
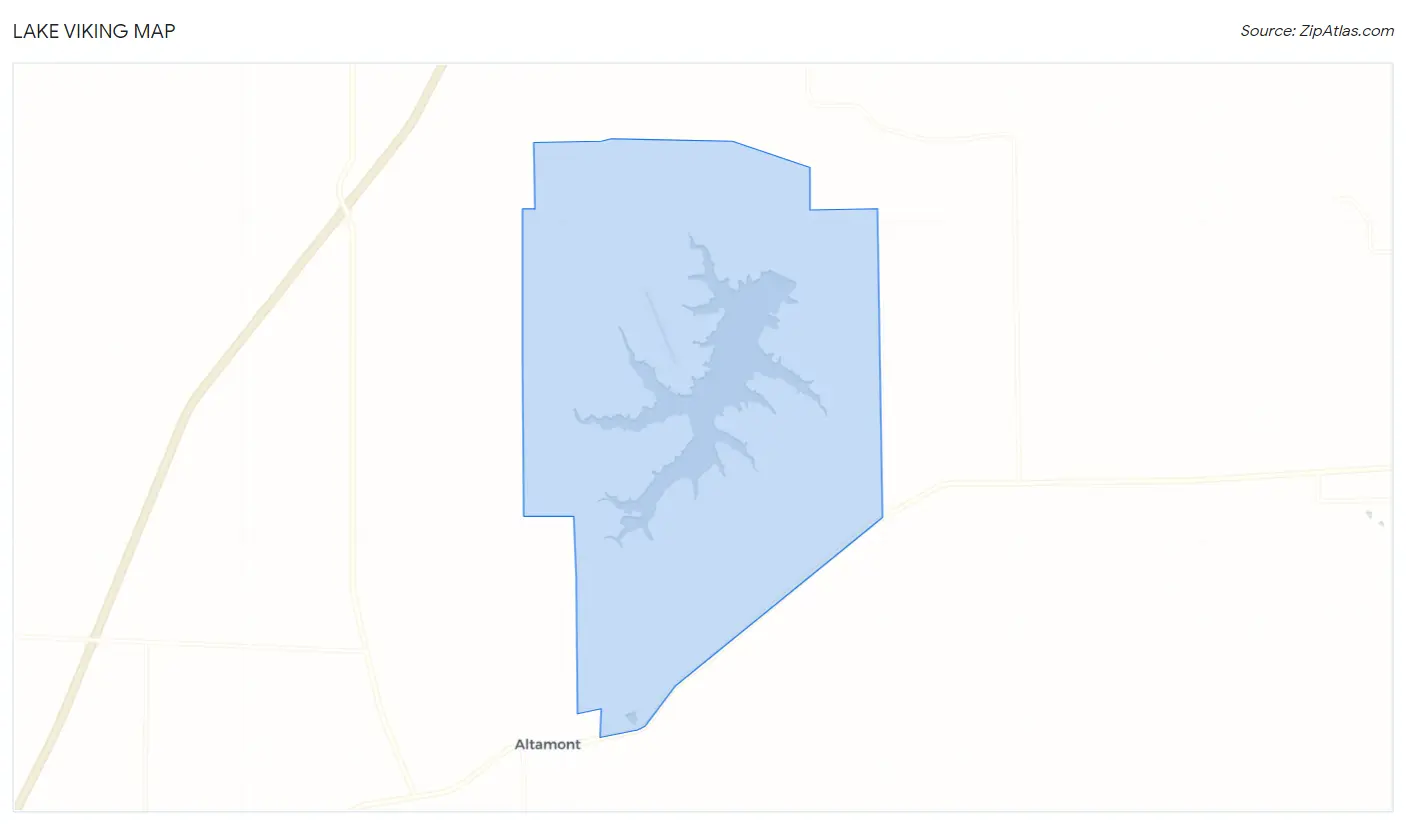
Lake Viking Overview
$49,093
PER CAPITA INCOME
$71,563
AVG FAMILY INCOME
$68,125
AVG HOUSEHOLD INCOME
32.5%
WAGE / INCOME GAP [ % ]
67.5¢/ $1
WAGE / INCOME GAP [ $ ]
$9,073
FAMILY INCOME DEFICIT
0.48
INEQUALITY / GINI INDEX
403
TOTAL POPULATION
193
MALE POPULATION
210
FEMALE POPULATION
91.90
MALES / 100 FEMALES
108.81
FEMALES / 100 MALES
61.5
MEDIAN AGE
2.4
AVG FAMILY SIZE
2.0
AVG HOUSEHOLD SIZE
185
LABOR FORCE [ PEOPLE ]
50.3%
PERCENT IN LABOR FORCE
1.6%
UNEMPLOYMENT RATE
Income in Lake Viking
Income Overview in Lake Viking
Per Capita Income in Lake Viking is $49,093, while median incomes of families and households are $71,563 and $68,125 respectively.
| Characteristic | Number | Measure |
| Per Capita Income | 403 | $49,093 |
| Median Family Income | 141 | $71,563 |
| Mean Family Income | 141 | $123,063 |
| Median Household Income | 199 | $68,125 |
| Mean Household Income | 199 | $101,137 |
| Income Deficit | 141 | $9,073 |
| Wage / Income Gap (%) | 403 | 32.51% |
| Wage / Income Gap ($) | 403 | 67.49¢ per $1 |
| Gini / Inequality Index | 403 | 0.48 |
Earnings by Sex in Lake Viking
Average Earnings in Lake Viking are $31,250, $36,250 for men and $24,464 for women, a difference of 32.5%.
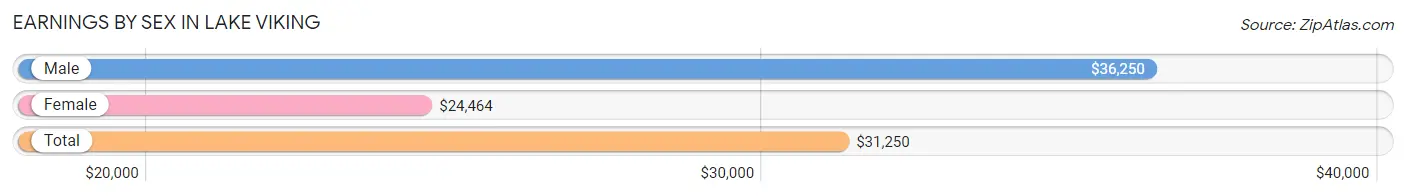
| Sex | Number | Average Earnings |
| Male | 104 (51.2%) | $36,250 |
| Female | 99 (48.8%) | $24,464 |
| Total | 203 (100.0%) | $31,250 |
Earnings by Sex by Income Bracket in Lake Viking
The most common earnings brackets in Lake Viking are $100,000+ for men (20 | 19.2%) and $65,000 to $74,999 for women (19 | 19.2%).
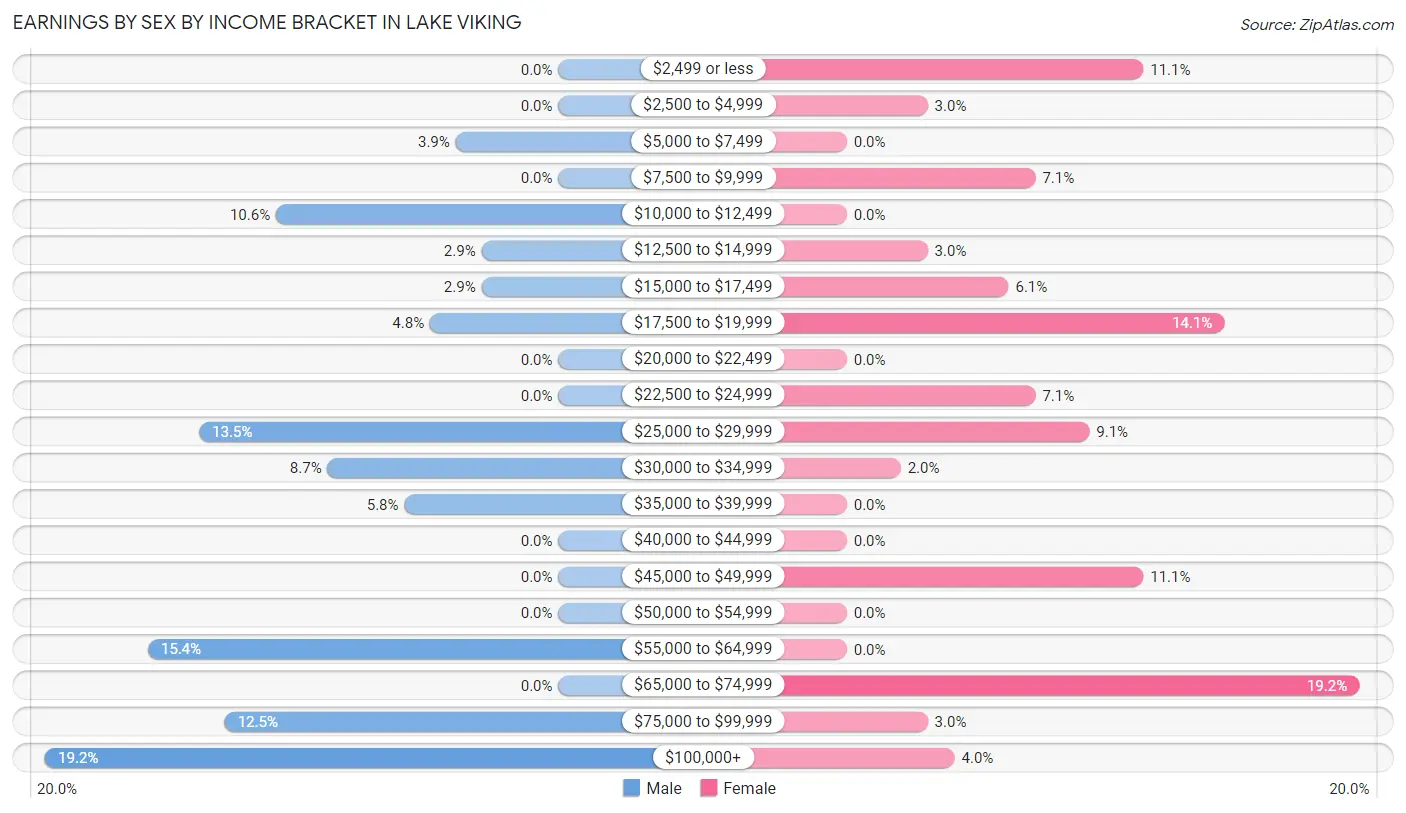
| Income | Male | Female |
| $2,499 or less | 0 (0.0%) | 11 (11.1%) |
| $2,500 to $4,999 | 0 (0.0%) | 3 (3.0%) |
| $5,000 to $7,499 | 4 (3.8%) | 0 (0.0%) |
| $7,500 to $9,999 | 0 (0.0%) | 7 (7.1%) |
| $10,000 to $12,499 | 11 (10.6%) | 0 (0.0%) |
| $12,500 to $14,999 | 3 (2.9%) | 3 (3.0%) |
| $15,000 to $17,499 | 3 (2.9%) | 6 (6.1%) |
| $17,500 to $19,999 | 5 (4.8%) | 14 (14.1%) |
| $20,000 to $22,499 | 0 (0.0%) | 0 (0.0%) |
| $22,500 to $24,999 | 0 (0.0%) | 7 (7.1%) |
| $25,000 to $29,999 | 14 (13.5%) | 9 (9.1%) |
| $30,000 to $34,999 | 9 (8.6%) | 2 (2.0%) |
| $35,000 to $39,999 | 6 (5.8%) | 0 (0.0%) |
| $40,000 to $44,999 | 0 (0.0%) | 0 (0.0%) |
| $45,000 to $49,999 | 0 (0.0%) | 11 (11.1%) |
| $50,000 to $54,999 | 0 (0.0%) | 0 (0.0%) |
| $55,000 to $64,999 | 16 (15.4%) | 0 (0.0%) |
| $65,000 to $74,999 | 0 (0.0%) | 19 (19.2%) |
| $75,000 to $99,999 | 13 (12.5%) | 3 (3.0%) |
| $100,000+ | 20 (19.2%) | 4 (4.0%) |
| Total | 104 (100.0%) | 99 (100.0%) |
Earnings by Sex by Educational Attainment in Lake Viking
Average earnings in Lake Viking are $57,656 for men and $28,194 for women, a difference of 51.1%. Men with an educational attainment of graduate degree enjoy the highest average annual earnings of $115,357, while those with high school diploma education earn the least with $47,500. Women with an educational attainment of college or associate's degree earn the most with the average annual earnings of $33,750, while those with high school diploma education have the smallest earnings of $18,839.
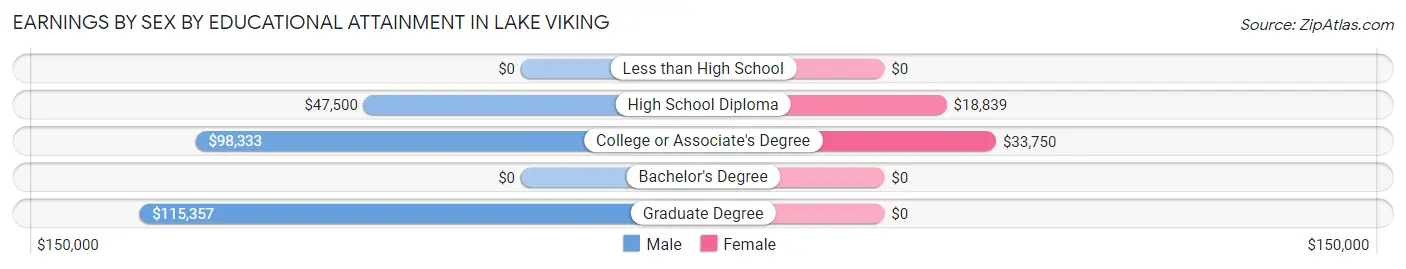
| Educational Attainment | Male Income | Female Income |
| Less than High School | - | - |
| High School Diploma | $47,500 | $18,839 |
| College or Associate's Degree | $98,333 | $33,750 |
| Bachelor's Degree | - | - |
| Graduate Degree | $115,357 | $0 |
| Total | $57,656 | $28,194 |
Family Income in Lake Viking
Family Income Brackets in Lake Viking
According to the Lake Viking family income data, there are 61 families falling into the $50,000 to $74,999 income range, which is the most common income bracket and makes up 43.3% of all families.
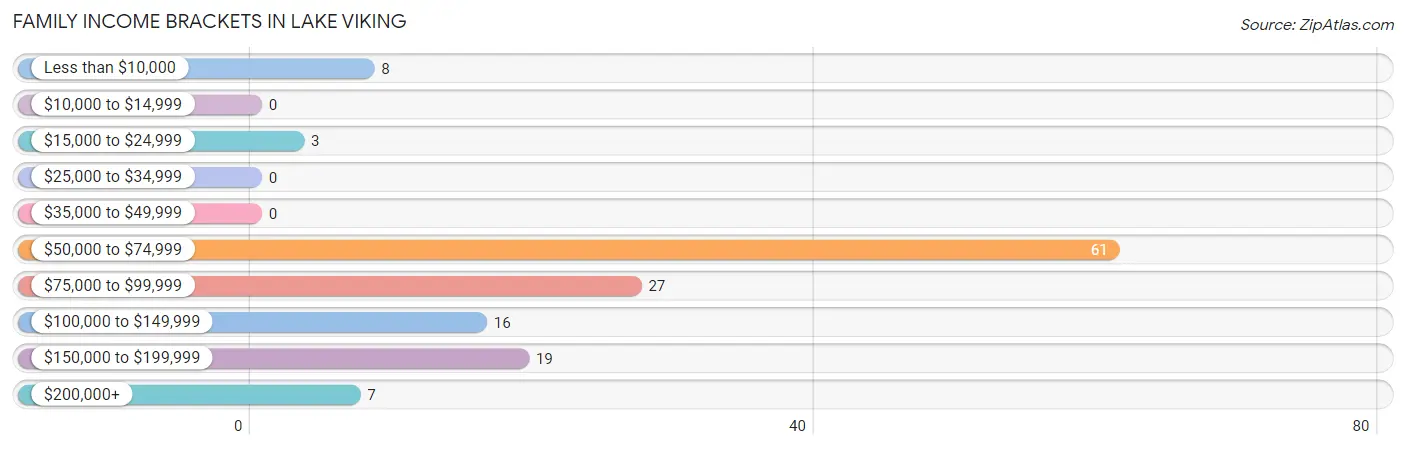
| Income Bracket | # Families | % Families |
| Less than $10,000 | 8 | 5.7% |
| $10,000 to $14,999 | 0 | 0.0% |
| $15,000 to $24,999 | 3 | 2.1% |
| $25,000 to $34,999 | 0 | 0.0% |
| $35,000 to $49,999 | 0 | 0.0% |
| $50,000 to $74,999 | 61 | 43.3% |
| $75,000 to $99,999 | 27 | 19.1% |
| $100,000 to $149,999 | 16 | 11.3% |
| $150,000 to $199,999 | 19 | 13.5% |
| $200,000+ | 7 | 5.0% |
Family Income by Famaliy Size in Lake Viking
3-person families (19 | 13.5%) account for the highest median family income in Lake Viking with $163,036 per family, while 3-person families (19 | 13.5%) have the highest median income of $54,345 per family member.
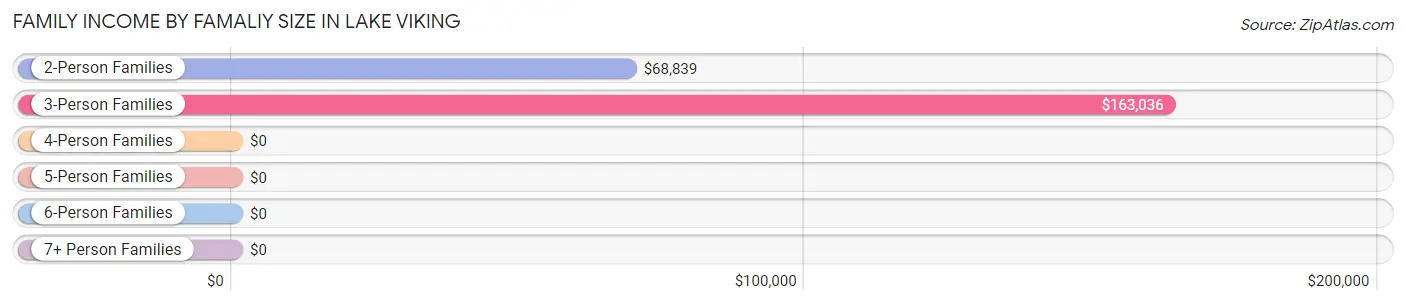
| Income Bracket | # Families | Median Income |
| 2-Person Families | 99 (70.2%) | $68,839 |
| 3-Person Families | 19 (13.5%) | $163,036 |
| 4-Person Families | 19 (13.5%) | $0 |
| 5-Person Families | 4 (2.8%) | $0 |
| 6-Person Families | 0 (0.0%) | $0 |
| 7+ Person Families | 0 (0.0%) | $0 |
| Total | 141 (100.0%) | $71,563 |
Family Income by Number of Earners in Lake Viking
The median family income in Lake Viking is $71,563, with families comprising 3+ earners (14) having the highest median family income of $163,929, while families with no earners (42) have the lowest median family income of $66,500, accounting for 9.9% and 29.8% of families, respectively.
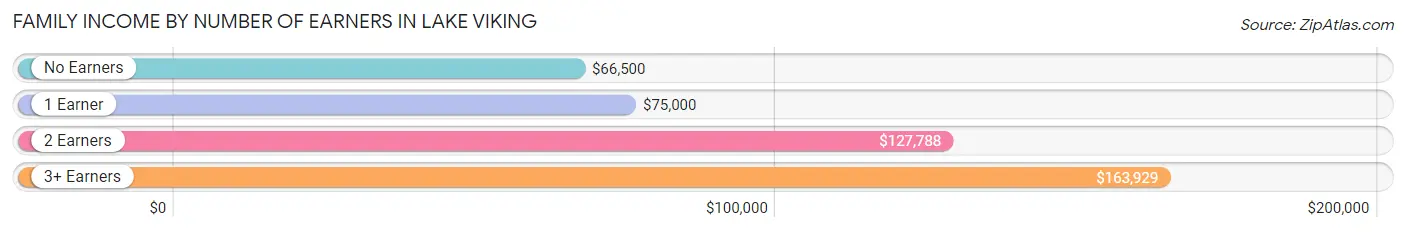
| Number of Earners | # Families | Median Income |
| No Earners | 42 (29.8%) | $66,500 |
| 1 Earner | 38 (27.0%) | $75,000 |
| 2 Earners | 47 (33.3%) | $127,788 |
| 3+ Earners | 14 (9.9%) | $163,929 |
| Total | 141 (100.0%) | $71,563 |
Household Income in Lake Viking
Household Income Brackets in Lake Viking
With 80 households falling in the category, the $50,000 to $74,999 income range is the most frequent in Lake Viking, accounting for 40.2% of all households. In contrast, only 2 households (1.0%) fall into the $25,000 to $34,999 income bracket, making it the least populous group.
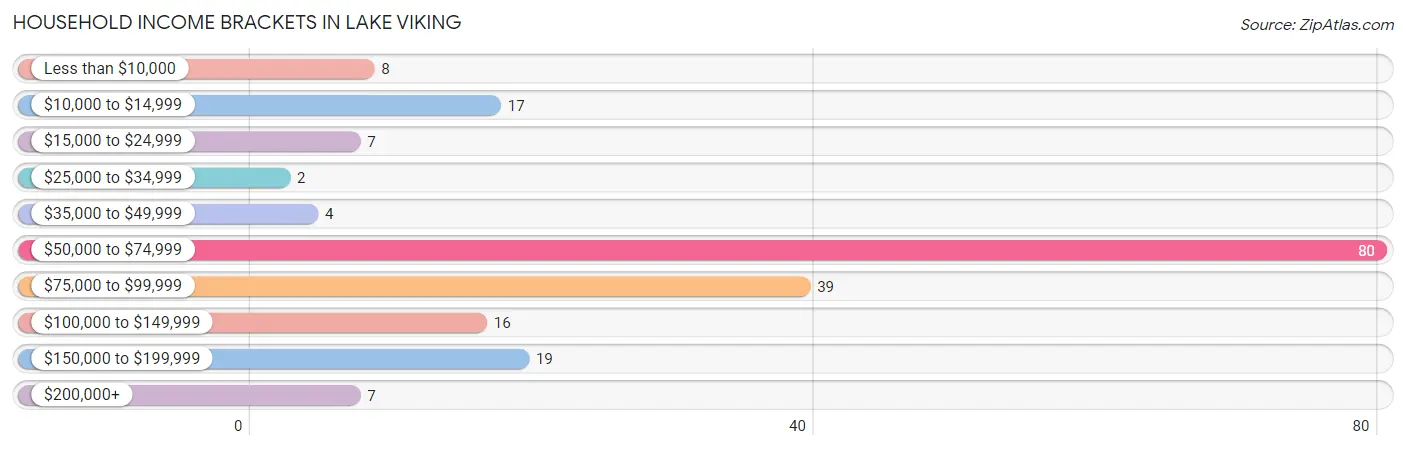
| Income Bracket | # Households | % Households |
| Less than $10,000 | 8 | 4.0% |
| $10,000 to $14,999 | 17 | 8.5% |
| $15,000 to $24,999 | 7 | 3.5% |
| $25,000 to $34,999 | 2 | 1.0% |
| $35,000 to $49,999 | 4 | 2.0% |
| $50,000 to $74,999 | 80 | 40.2% |
| $75,000 to $99,999 | 39 | 19.6% |
| $100,000 to $149,999 | 16 | 8.0% |
| $150,000 to $199,999 | 19 | 9.5% |
| $200,000+ | 7 | 3.5% |
Household Income by Householder Age in Lake Viking
The median household income in Lake Viking is $68,125, with the highest median household income of $127,885 found in the 25 to 44 years age bracket for the primary householder. A total of 22 households (11.1%) fall into this category.
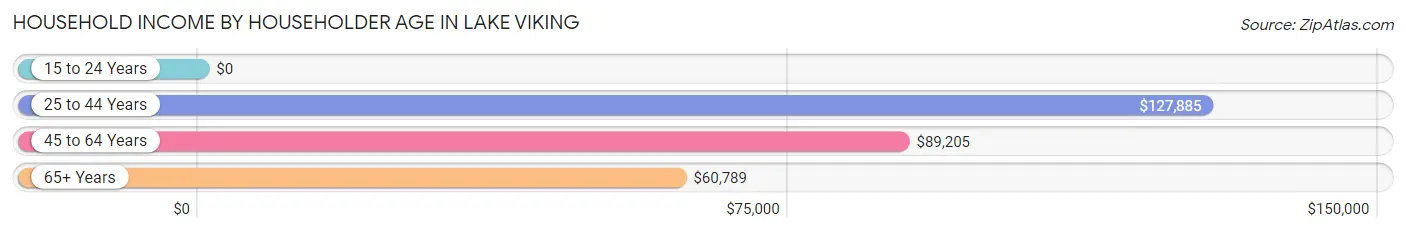
| Income Bracket | # Households | Median Income |
| 15 to 24 Years | 0 (0.0%) | $0 |
| 25 to 44 Years | 22 (11.1%) | $127,885 |
| 45 to 64 Years | 73 (36.7%) | $89,205 |
| 65+ Years | 104 (52.3%) | $60,789 |
| Total | 199 (100.0%) | $68,125 |
Poverty in Lake Viking
Income Below Poverty by Sex and Age in Lake Viking
With 5.7% poverty level for males and 13.8% for females among the residents of Lake Viking, 65 to 74 year old males and 75 year old and over females are the most vulnerable to poverty, with 8 males (53.3%) and 17 females (34.7%) in their respective age groups living below the poverty level.
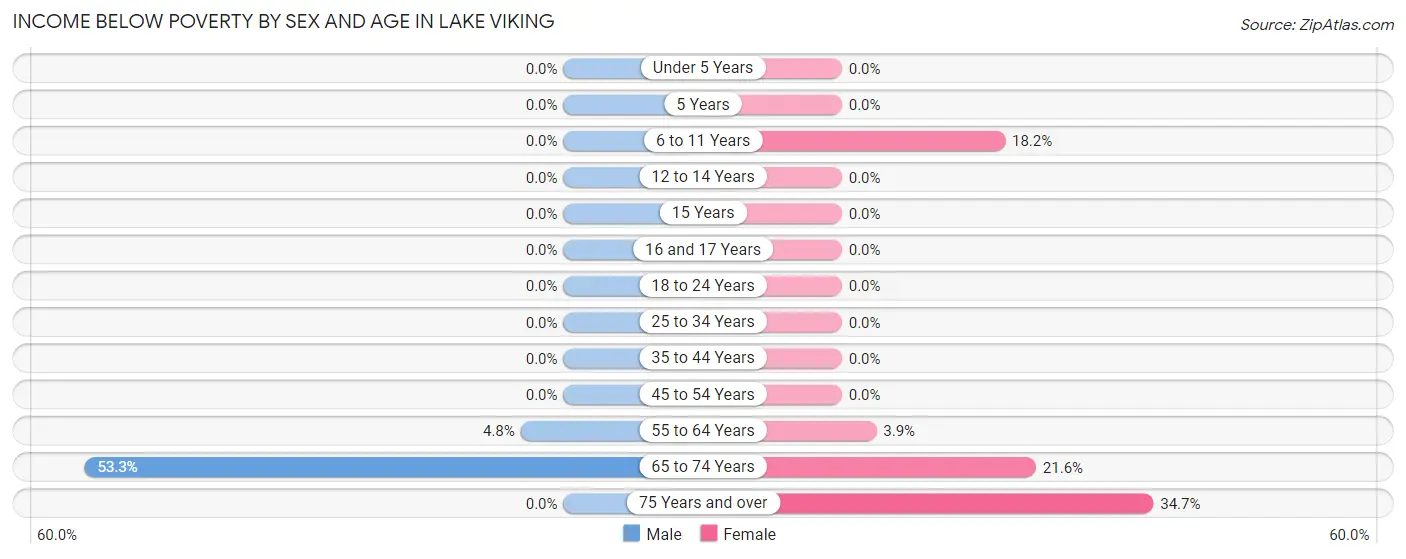
| Age Bracket | Male | Female |
| Under 5 Years | 0 (0.0%) | 0 (0.0%) |
| 5 Years | 0 (0.0%) | 0 (0.0%) |
| 6 to 11 Years | 0 (0.0%) | 2 (18.2%) |
| 12 to 14 Years | 0 (0.0%) | 0 (0.0%) |
| 15 Years | 0 (0.0%) | 0 (0.0%) |
| 16 and 17 Years | 0 (0.0%) | 0 (0.0%) |
| 18 to 24 Years | 0 (0.0%) | 0 (0.0%) |
| 25 to 34 Years | 0 (0.0%) | 0 (0.0%) |
| 35 to 44 Years | 0 (0.0%) | 0 (0.0%) |
| 45 to 54 Years | 0 (0.0%) | 0 (0.0%) |
| 55 to 64 Years | 3 (4.8%) | 2 (3.8%) |
| 65 to 74 Years | 8 (53.3%) | 8 (21.6%) |
| 75 Years and over | 0 (0.0%) | 17 (34.7%) |
| Total | 11 (5.7%) | 29 (13.8%) |
Income Above Poverty by Sex and Age in Lake Viking
According to the poverty statistics in Lake Viking, males aged 6 to 11 years and females aged 12 to 14 years are the age groups that are most secure financially, with 100.0% of males and 100.0% of females in these age groups living above the poverty line.
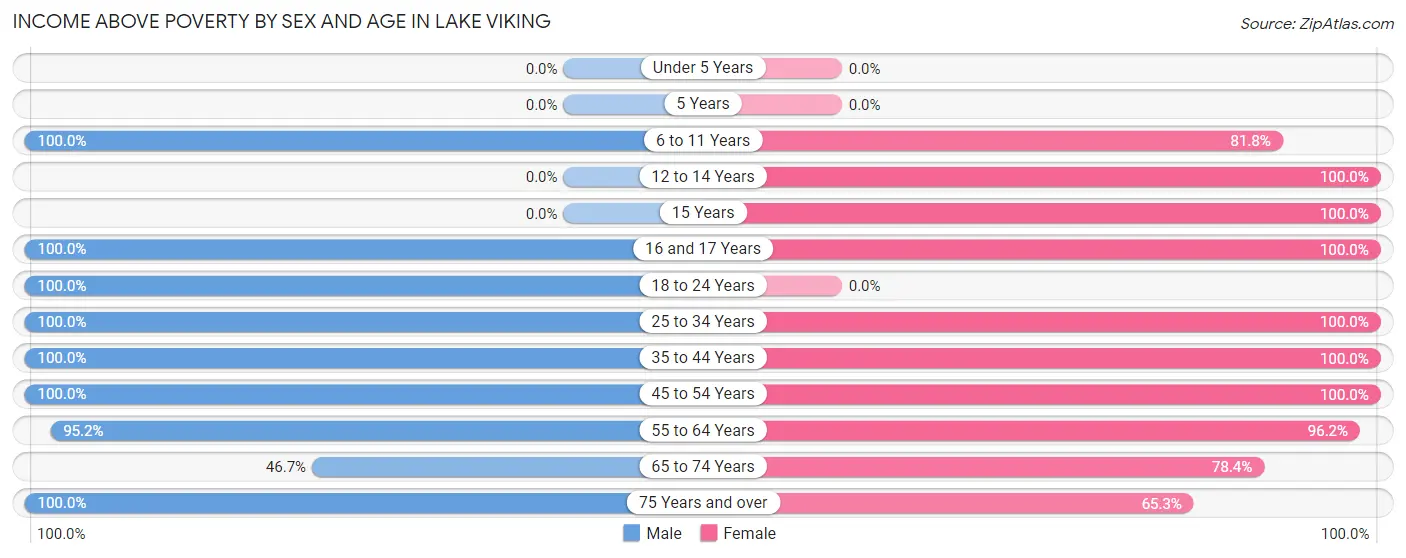
| Age Bracket | Male | Female |
| Under 5 Years | 0 (0.0%) | 0 (0.0%) |
| 5 Years | 0 (0.0%) | 0 (0.0%) |
| 6 to 11 Years | 11 (100.0%) | 9 (81.8%) |
| 12 to 14 Years | 0 (0.0%) | 6 (100.0%) |
| 15 Years | 0 (0.0%) | 7 (100.0%) |
| 16 and 17 Years | 4 (100.0%) | 8 (100.0%) |
| 18 to 24 Years | 8 (100.0%) | 0 (0.0%) |
| 25 to 34 Years | 6 (100.0%) | 5 (100.0%) |
| 35 to 44 Years | 16 (100.0%) | 24 (100.0%) |
| 45 to 54 Years | 16 (100.0%) | 11 (100.0%) |
| 55 to 64 Years | 60 (95.2%) | 50 (96.2%) |
| 65 to 74 Years | 7 (46.7%) | 29 (78.4%) |
| 75 Years and over | 54 (100.0%) | 32 (65.3%) |
| Total | 182 (94.3%) | 181 (86.2%) |
Income Below Poverty Among Married-Couple Families in Lake Viking
The poverty statistics for married-couple families in Lake Viking show that 7.8% or 11 of the total 141 families live below the poverty line. Families with 1 or 2 children have the highest poverty rate of 8.6%, comprising of 3 families. On the other hand, families with no children have the lowest poverty rate of 7.5%, which includes 8 families.
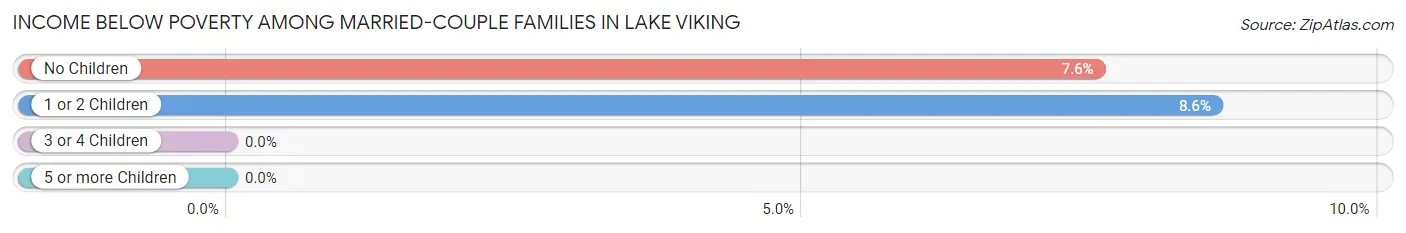
| Children | Above Poverty | Below Poverty |
| No Children | 98 (92.4%) | 8 (7.5%) |
| 1 or 2 Children | 32 (91.4%) | 3 (8.6%) |
| 3 or 4 Children | 0 (0.0%) | 0 (0.0%) |
| 5 or more Children | 0 (0.0%) | 0 (0.0%) |
| Total | 130 (92.2%) | 11 (7.8%) |
Income Below Poverty Among Single-Parent Households in Lake Viking
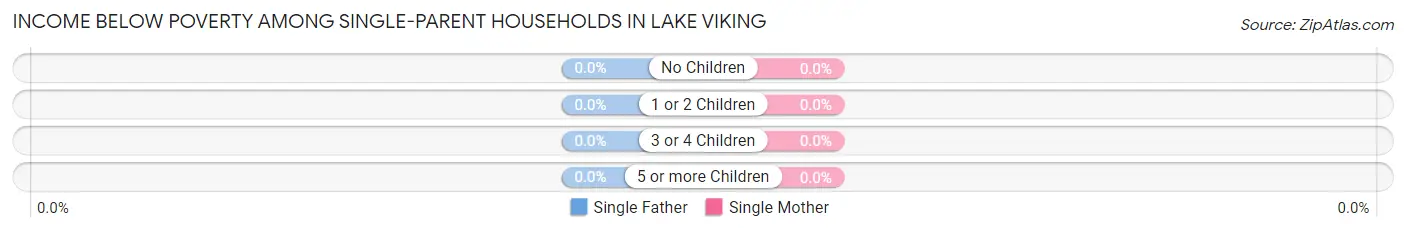
| Children | Single Father | Single Mother |
| No Children | 0 (0.0%) | 0 (0.0%) |
| 1 or 2 Children | 0 (0.0%) | 0 (0.0%) |
| 3 or 4 Children | 0 (0.0%) | 0 (0.0%) |
| 5 or more Children | 0 (0.0%) | 0 (0.0%) |
| Total | 0 (0.0%) | 0 (0.0%) |
Income Below Poverty Among Married-Couple vs Single-Parent Households in Lake Viking
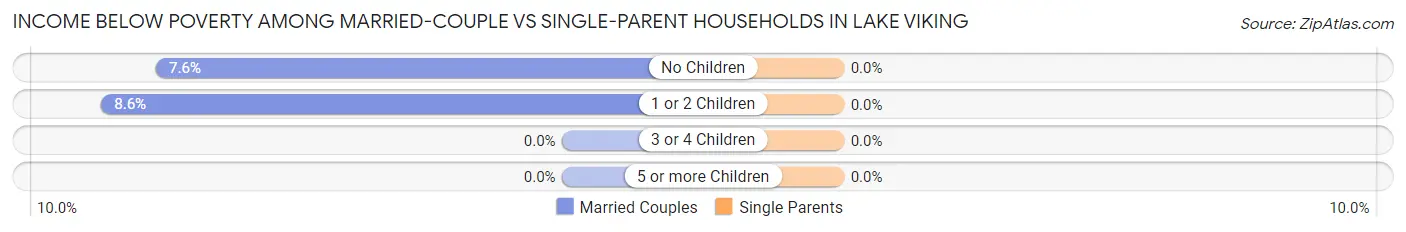
| Children | Married-Couple Families | Single-Parent Households |
| No Children | 8 (7.5%) | 0 (0.0%) |
| 1 or 2 Children | 3 (8.6%) | 0 (0.0%) |
| 3 or 4 Children | 0 (0.0%) | 0 (0.0%) |
| 5 or more Children | 0 (0.0%) | 0 (0.0%) |
| Total | 11 (7.8%) | 0 (0.0%) |
Race in Lake Viking
The most populous races in Lake Viking are , and White / Caucasian (403 | 100.0%).
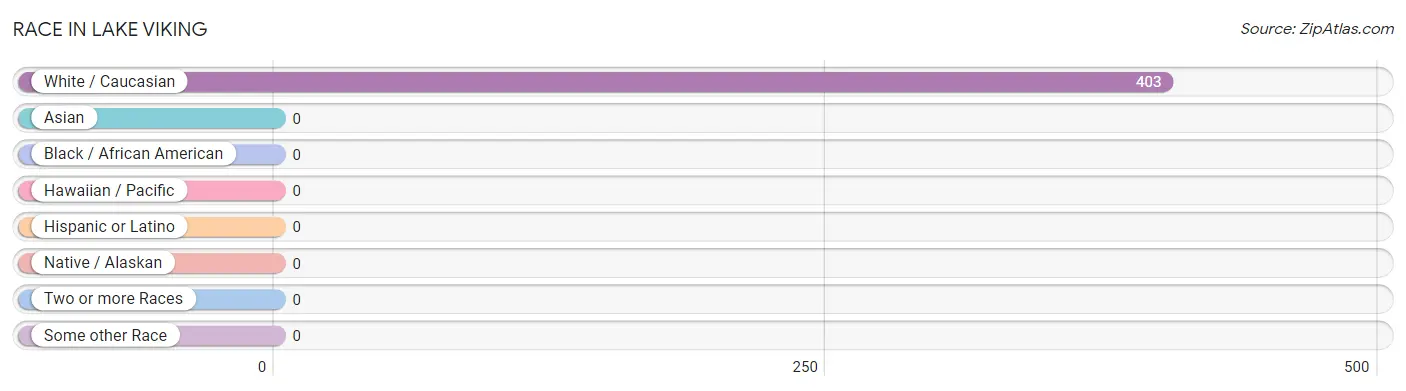
| Race | # Population | % Population |
| Asian | 0 | 0.0% |
| Black / African American | 0 | 0.0% |
| Hawaiian / Pacific | 0 | 0.0% |
| Hispanic or Latino | 0 | 0.0% |
| Native / Alaskan | 0 | 0.0% |
| White / Caucasian | 403 | 100.0% |
| Two or more Races | 0 | 0.0% |
| Some other Race | 0 | 0.0% |
| Total | 403 | 100.0% |
Ancestry in Lake Viking
The most populous ancestries reported in Lake Viking are German (71 | 17.6%), English (55 | 13.7%), Irish (55 | 13.7%), American (47 | 11.7%), and Polish (22 | 5.5%), together accounting for 62.0% of all Lake Viking residents.
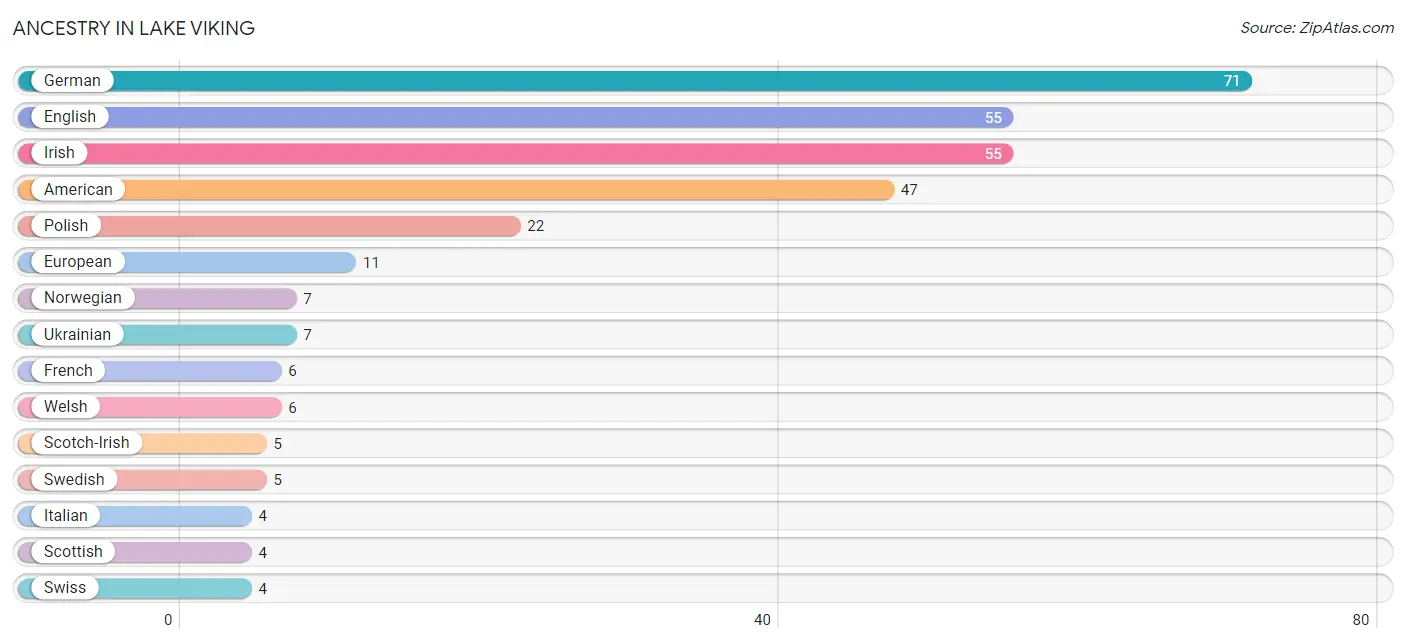
| Ancestry | # Population | % Population |
| American | 47 | 11.7% |
| Eastern European | 3 | 0.7% |
| English | 55 | 13.7% |
| European | 11 | 2.7% |
| French | 6 | 1.5% |
| German | 71 | 17.6% |
| Irish | 55 | 13.7% |
| Italian | 4 | 1.0% |
| Norwegian | 7 | 1.7% |
| Polish | 22 | 5.5% |
| Scotch-Irish | 5 | 1.2% |
| Scottish | 4 | 1.0% |
| Swedish | 5 | 1.2% |
| Swiss | 4 | 1.0% |
| Ukrainian | 7 | 1.7% |
| Welsh | 6 | 1.5% | View All 16 Rows |
Immigrants in Lake Viking

| Immigration Origin | # Population | % Population | View All 0 Rows |
Sex and Age in Lake Viking
Sex and Age in Lake Viking
The most populous age groups in Lake Viking are 75 to 79 Years (50 | 25.9%) for men and 60 to 64 Years (35 | 16.7%) for women.
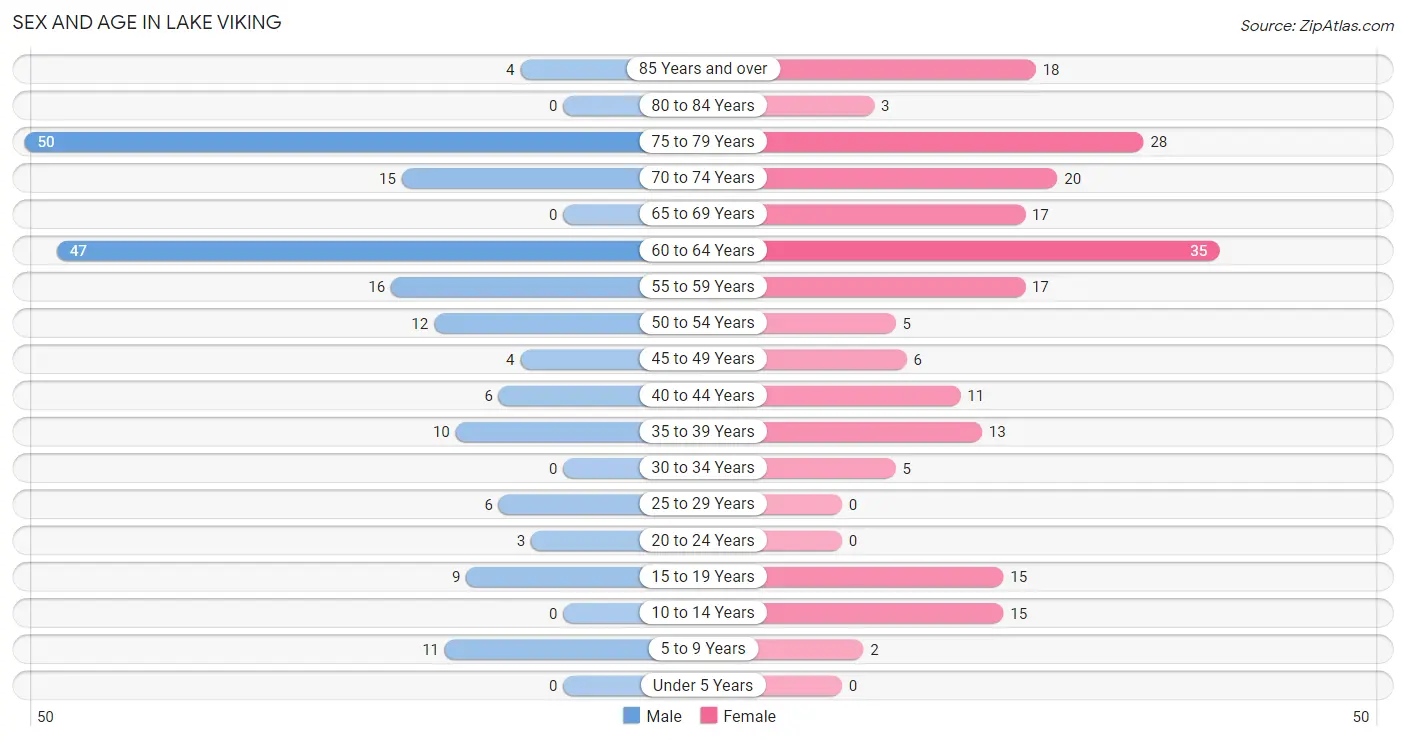
| Age Bracket | Male | Female |
| Under 5 Years | 0 (0.0%) | 0 (0.0%) |
| 5 to 9 Years | 11 (5.7%) | 2 (0.9%) |
| 10 to 14 Years | 0 (0.0%) | 15 (7.1%) |
| 15 to 19 Years | 9 (4.7%) | 15 (7.1%) |
| 20 to 24 Years | 3 (1.5%) | 0 (0.0%) |
| 25 to 29 Years | 6 (3.1%) | 0 (0.0%) |
| 30 to 34 Years | 0 (0.0%) | 5 (2.4%) |
| 35 to 39 Years | 10 (5.2%) | 13 (6.2%) |
| 40 to 44 Years | 6 (3.1%) | 11 (5.2%) |
| 45 to 49 Years | 4 (2.1%) | 6 (2.9%) |
| 50 to 54 Years | 12 (6.2%) | 5 (2.4%) |
| 55 to 59 Years | 16 (8.3%) | 17 (8.1%) |
| 60 to 64 Years | 47 (24.3%) | 35 (16.7%) |
| 65 to 69 Years | 0 (0.0%) | 17 (8.1%) |
| 70 to 74 Years | 15 (7.8%) | 20 (9.5%) |
| 75 to 79 Years | 50 (25.9%) | 28 (13.3%) |
| 80 to 84 Years | 0 (0.0%) | 3 (1.4%) |
| 85 Years and over | 4 (2.1%) | 18 (8.6%) |
| Total | 193 (100.0%) | 210 (100.0%) |
Families and Households in Lake Viking
Median Family Size in Lake Viking
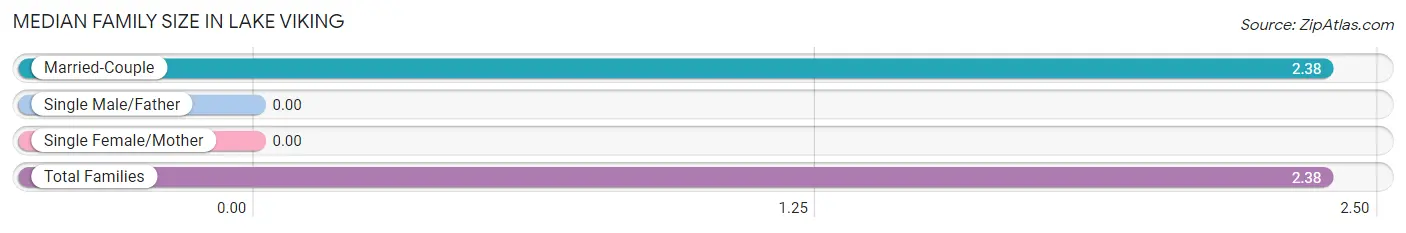
| Family Type | # Families | Family Size |
| Married-Couple | 141 (100.0%) | 2.38 |
| Single Male/Father | 0 (0.0%) | - |
| Single Female/Mother | 0 (0.0%) | - |
| Total Families | 141 (100.0%) | 2.38 |
Median Household Size in Lake Viking
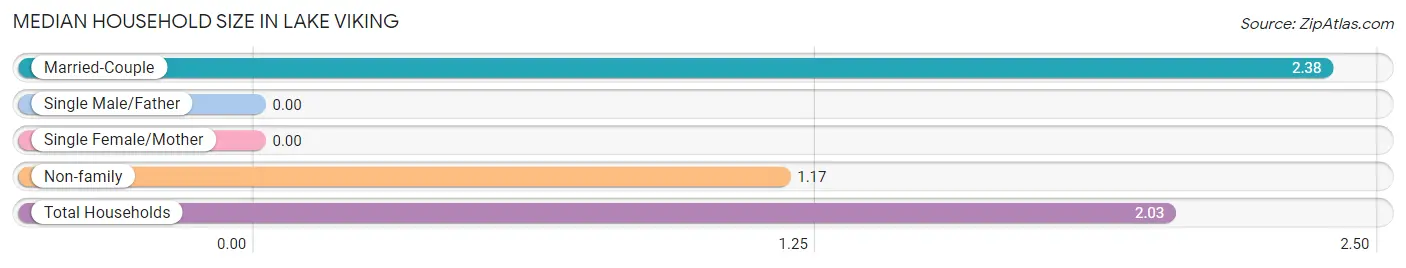
| Household Type | # Households | Household Size |
| Married-Couple | 141 (70.9%) | 2.38 |
| Single Male/Father | 0 (0.0%) | - |
| Single Female/Mother | 0 (0.0%) | - |
| Non-family | 58 (29.1%) | 1.17 |
| Total Households | 199 (100.0%) | 2.03 |
Household Size by Marriage Status in Lake Viking
Out of a total of 199 households in Lake Viking, 141 (70.9%) are family households, while 58 (29.1%) are nonfamily households. The most numerous type of family households are 2-person households, comprising 99, and the most common type of nonfamily households are 1-person households, comprising 48.
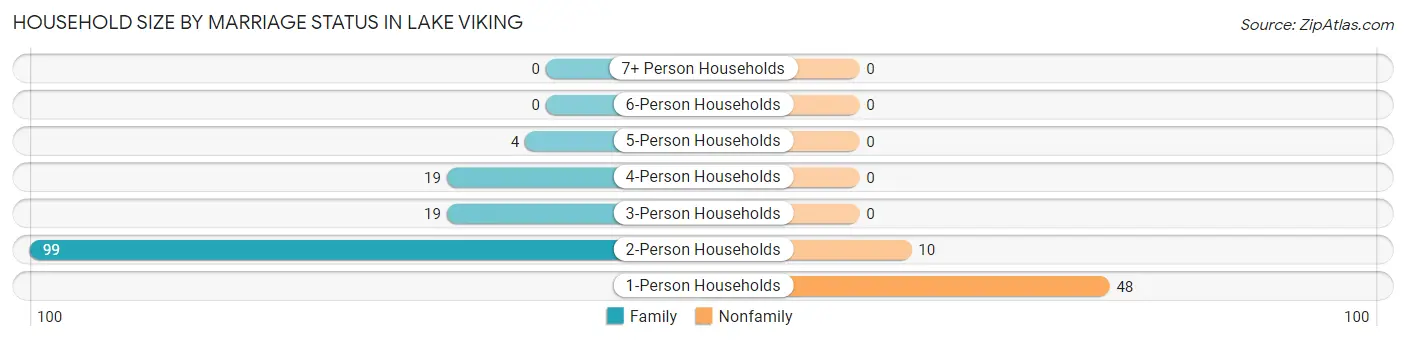
| Household Size | Family Households | Nonfamily Households |
| 1-Person Households | - | 48 (24.1%) |
| 2-Person Households | 99 (49.7%) | 10 (5.0%) |
| 3-Person Households | 19 (9.6%) | 0 (0.0%) |
| 4-Person Households | 19 (9.6%) | 0 (0.0%) |
| 5-Person Households | 4 (2.0%) | 0 (0.0%) |
| 6-Person Households | 0 (0.0%) | 0 (0.0%) |
| 7+ Person Households | 0 (0.0%) | 0 (0.0%) |
| Total | 141 (70.9%) | 58 (29.1%) |
Female Fertility in Lake Viking
Fertility by Age in Lake Viking
| Age Bracket | Women with Births | Births / 1,000 Women |
| 15 to 19 years | 0 (0.0%) | 0.0 |
| 20 to 34 years | 0 (0.0%) | 0.0 |
| 35 to 50 years | 0 (0.0%) | 0.0 |
| Total | 0 (0.0%) | 0.0 |
Fertility by Age by Marriage Status in Lake Viking
| Age Bracket | Married | Unmarried |
| 15 to 19 years | 0 (0.0%) | 0 (0.0%) |
| 20 to 34 years | 0 (0.0%) | 0 (0.0%) |
| 35 to 50 years | 0 (0.0%) | 0 (0.0%) |
| Total | 0 (0.0%) | 0 (0.0%) |
Fertility by Education in Lake Viking
| Educational Attainment | Women with Births | Births / 1,000 Women |
| Less than High School | 0 (0.0%) | 0.0 |
| High School Diploma | 0 (0.0%) | 0.0 |
| College or Associate's Degree | 0 (0.0%) | 0.0 |
| Bachelor's Degree | 0 (0.0%) | 0.0 |
| Graduate Degree | 0 (0.0%) | 0.0 |
| Total | 0 (0.0%) | 0.0 |
Fertility by Education by Marriage Status in Lake Viking
| Educational Attainment | Married | Unmarried |
| Less than High School | 0 (0.0%) | 0 (0.0%) |
| High School Diploma | 0 (0.0%) | 0 (0.0%) |
| College or Associate's Degree | 0 (0.0%) | 0 (0.0%) |
| Bachelor's Degree | 0 (0.0%) | 0 (0.0%) |
| Graduate Degree | 0 (0.0%) | 0 (0.0%) |
| Total | 0 (0.0%) | 0 (0.0%) |
Employment Characteristics in Lake Viking
Employment by Class of Employer in Lake Viking
Among the 180 employed individuals in Lake Viking, private company employees (80 | 44.4%), state government employees (30 | 16.7%), and local government employees (23 | 12.8%) make up the most common classes of employment.
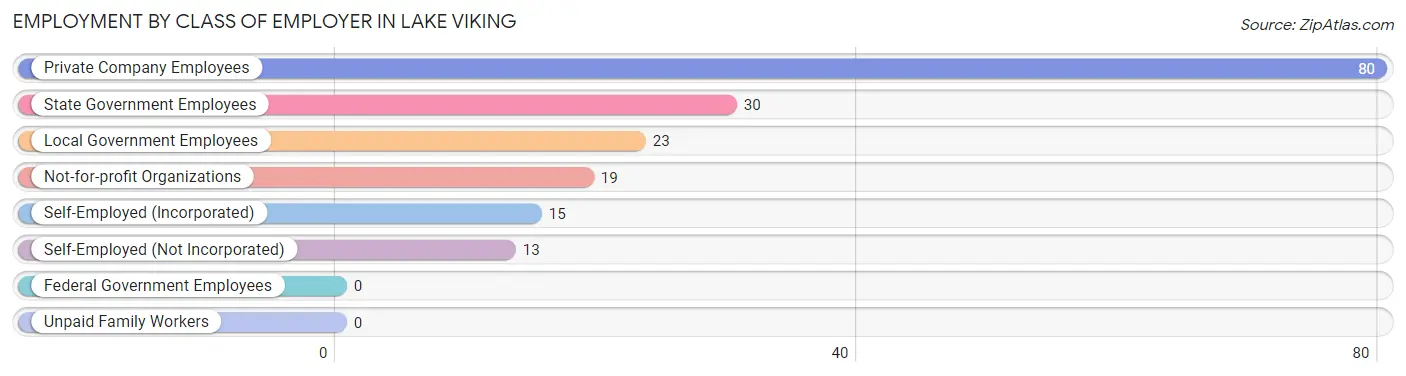
| Employer Class | # Employees | % Employees |
| Private Company Employees | 80 | 44.4% |
| Self-Employed (Incorporated) | 15 | 8.3% |
| Self-Employed (Not Incorporated) | 13 | 7.2% |
| Not-for-profit Organizations | 19 | 10.6% |
| Local Government Employees | 23 | 12.8% |
| State Government Employees | 30 | 16.7% |
| Federal Government Employees | 0 | 0.0% |
| Unpaid Family Workers | 0 | 0.0% |
| Total | 180 | 100.0% |
Employment Status by Age in Lake Viking
According to the labor force statistics for Lake Viking, out of the total population over 16 years of age (368), 50.3% or 185 individuals are in the labor force, with 1.6% or 3 of them unemployed. The age group with the highest labor force participation rate is 20 to 24 years, with 100.0% or 3 individuals in the labor force. Within the labor force, the 75 years and over age range has the highest percentage of unemployed individuals, with 14.3% or 3 of them being unemployed.
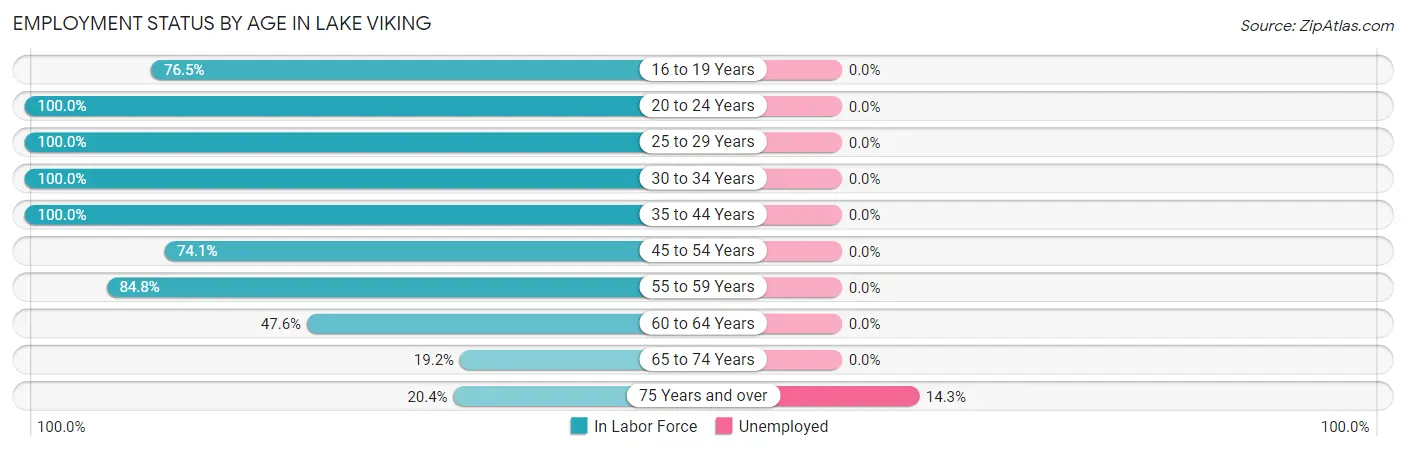
| Age Bracket | In Labor Force | Unemployed |
| 16 to 19 Years | 13 (76.5%) | 0 (0.0%) |
| 20 to 24 Years | 3 (100.0%) | 0 (0.0%) |
| 25 to 29 Years | 6 (100.0%) | 0 (0.0%) |
| 30 to 34 Years | 5 (100.0%) | 0 (0.0%) |
| 35 to 44 Years | 40 (100.0%) | 0 (0.0%) |
| 45 to 54 Years | 20 (74.1%) | 0 (0.0%) |
| 55 to 59 Years | 28 (84.8%) | 0 (0.0%) |
| 60 to 64 Years | 39 (47.6%) | 0 (0.0%) |
| 65 to 74 Years | 10 (19.2%) | 0 (0.0%) |
| 75 Years and over | 21 (20.4%) | 3 (14.3%) |
| Total | 185 (50.3%) | 3 (1.6%) |
Employment Status by Educational Attainment in Lake Viking
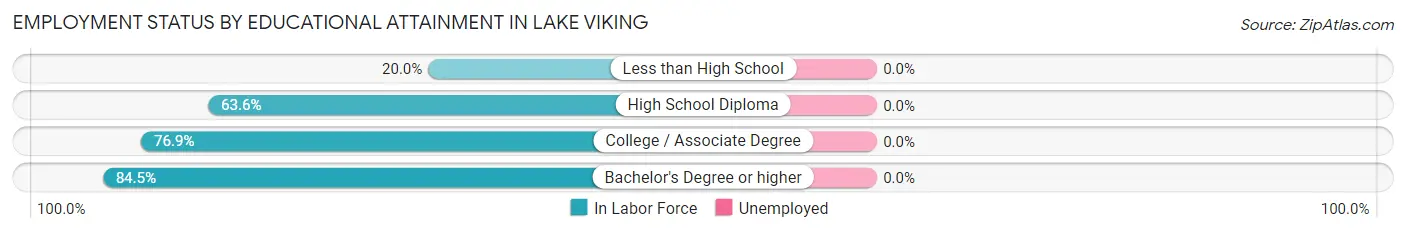
| Educational Attainment | In Labor Force | Unemployed |
| Less than High School | 3 (20.0%) | 0 (0.0%) |
| High School Diploma | 35 (63.6%) | 0 (0.0%) |
| College / Associate Degree | 40 (76.9%) | 0 (0.0%) |
| Bachelor's Degree or higher | 60 (84.5%) | 0 (0.0%) |
| Total | 138 (71.5%) | 0 (0.0%) |
Employment Occupations by Sex in Lake Viking
Management, Business, Science and Arts Occupations
The most common Management, Business, Science and Arts occupations in Lake Viking are Management (42 | 23.1%), Health Diagnosing & Treating (20 | 11.0%), Community & Social Service (11 | 6.0%), Health Technologists (7 | 3.8%), and Computers, Engineering & Science (6 | 3.3%).
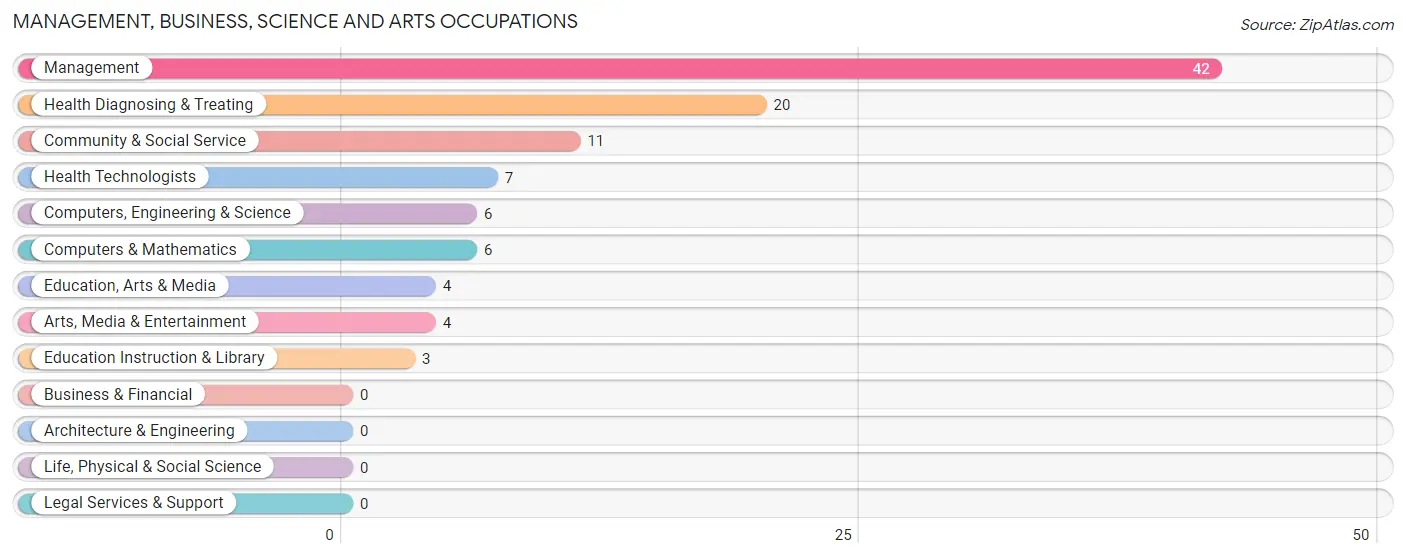
Management, Business, Science and Arts Occupations by Sex
Within the Management, Business, Science and Arts occupations in Lake Viking, the most male-oriented occupations are Health Technologists (100.0%), Management (85.7%), and Computers, Engineering & Science (50.0%), while the most female-oriented occupations are Community & Social Service (100.0%), Education, Arts & Media (100.0%), and Education Instruction & Library (100.0%).
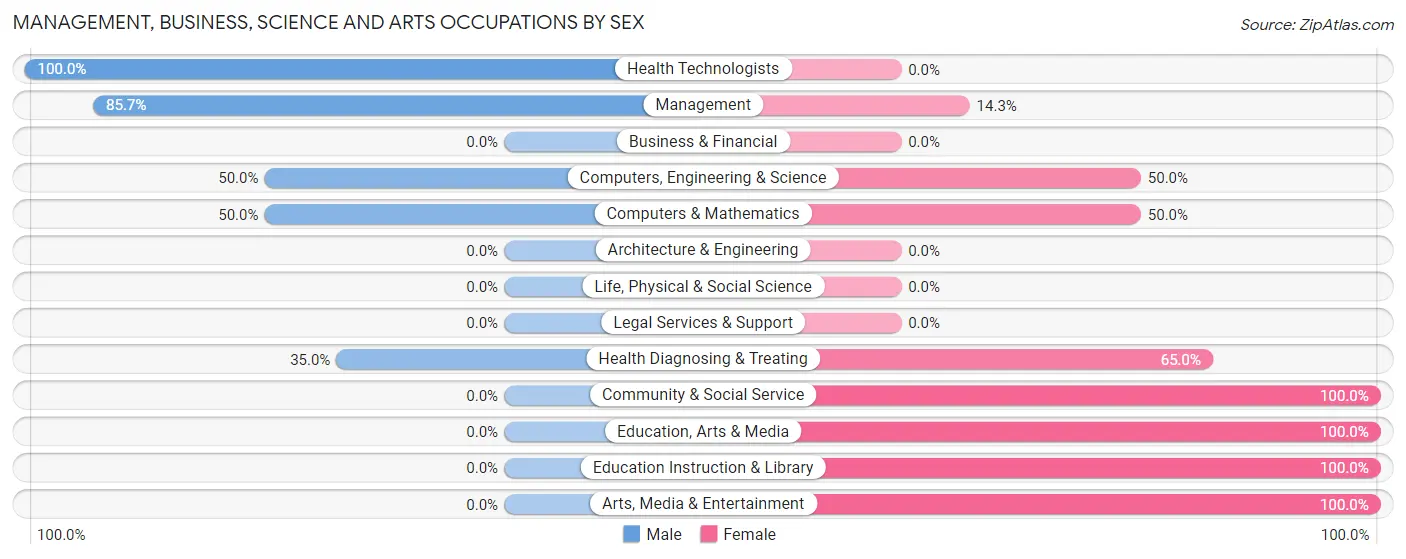
| Occupation | Male | Female |
| Management | 36 (85.7%) | 6 (14.3%) |
| Business & Financial | 0 (0.0%) | 0 (0.0%) |
| Computers, Engineering & Science | 3 (50.0%) | 3 (50.0%) |
| Computers & Mathematics | 3 (50.0%) | 3 (50.0%) |
| Architecture & Engineering | 0 (0.0%) | 0 (0.0%) |
| Life, Physical & Social Science | 0 (0.0%) | 0 (0.0%) |
| Community & Social Service | 0 (0.0%) | 11 (100.0%) |
| Education, Arts & Media | 0 (0.0%) | 4 (100.0%) |
| Legal Services & Support | 0 (0.0%) | 0 (0.0%) |
| Education Instruction & Library | 0 (0.0%) | 3 (100.0%) |
| Arts, Media & Entertainment | 0 (0.0%) | 4 (100.0%) |
| Health Diagnosing & Treating | 7 (35.0%) | 13 (65.0%) |
| Health Technologists | 7 (100.0%) | 0 (0.0%) |
| Total (Category) | 46 (58.2%) | 33 (41.8%) |
| Total (Overall) | 86 (47.2%) | 96 (52.7%) |
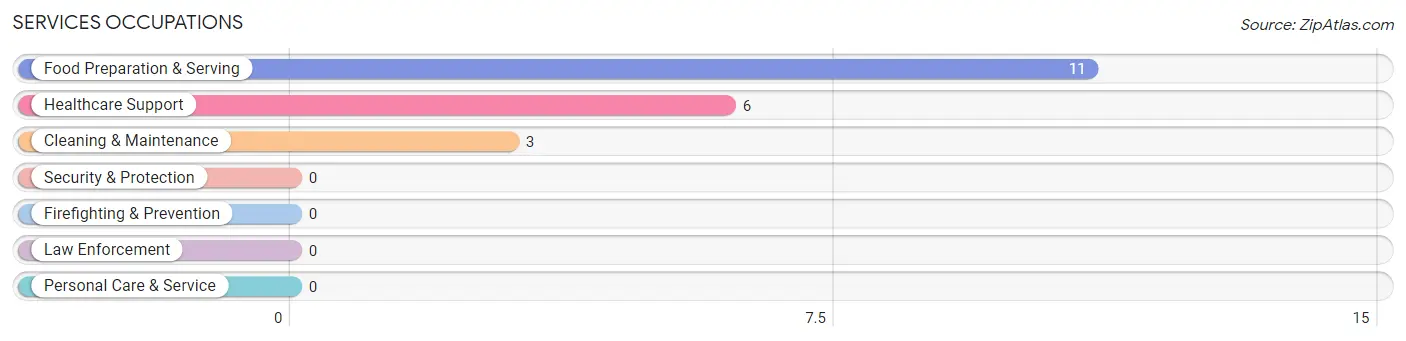
Services Occupations
The most common Services occupations in Lake Viking are Food Preparation & Serving (11 | 6.0%), Healthcare Support (6 | 3.3%), and Cleaning & Maintenance (3 | 1.7%).
Services Occupations by Sex
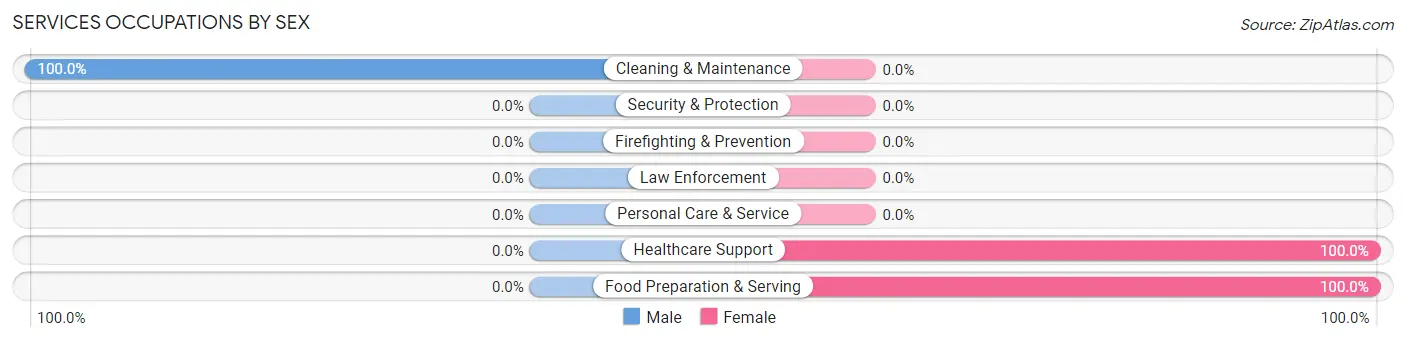
| Occupation | Male | Female |
| Healthcare Support | 0 (0.0%) | 6 (100.0%) |
| Security & Protection | 0 (0.0%) | 0 (0.0%) |
| Firefighting & Prevention | 0 (0.0%) | 0 (0.0%) |
| Law Enforcement | 0 (0.0%) | 0 (0.0%) |
| Food Preparation & Serving | 0 (0.0%) | 11 (100.0%) |
| Cleaning & Maintenance | 3 (100.0%) | 0 (0.0%) |
| Personal Care & Service | 0 (0.0%) | 0 (0.0%) |
| Total (Category) | 3 (15.0%) | 17 (85.0%) |
| Total (Overall) | 86 (47.2%) | 96 (52.7%) |
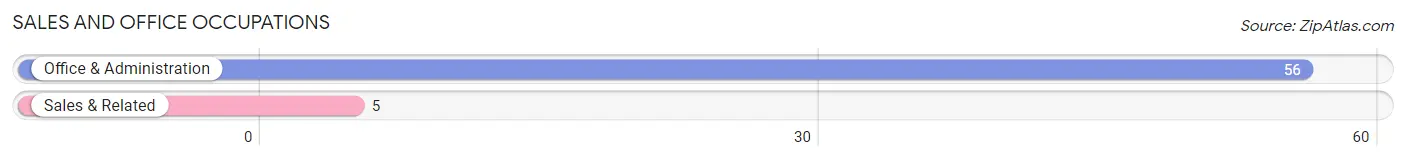
Sales and Office Occupations
The most common Sales and Office occupations in Lake Viking are Office & Administration (56 | 30.8%), and Sales & Related (5 | 2.8%).
Sales and Office Occupations by Sex
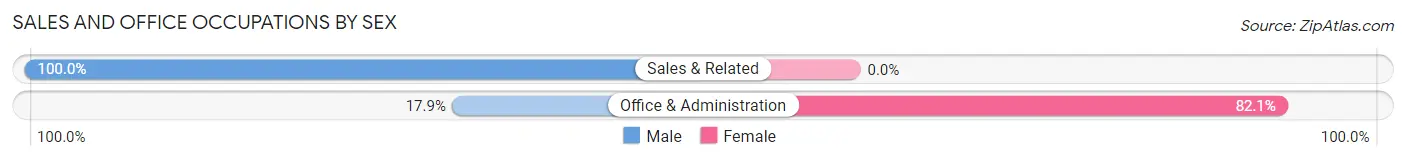
| Occupation | Male | Female |
| Sales & Related | 5 (100.0%) | 0 (0.0%) |
| Office & Administration | 10 (17.9%) | 46 (82.1%) |
| Total (Category) | 15 (24.6%) | 46 (75.4%) |
| Total (Overall) | 86 (47.2%) | 96 (52.7%) |
Natural Resources, Construction and Maintenance Occupations
The most common Natural Resources, Construction and Maintenance occupations in Lake Viking are Construction & Extraction (15 | 8.2%), and Farming, Fishing & Forestry (3 | 1.7%).
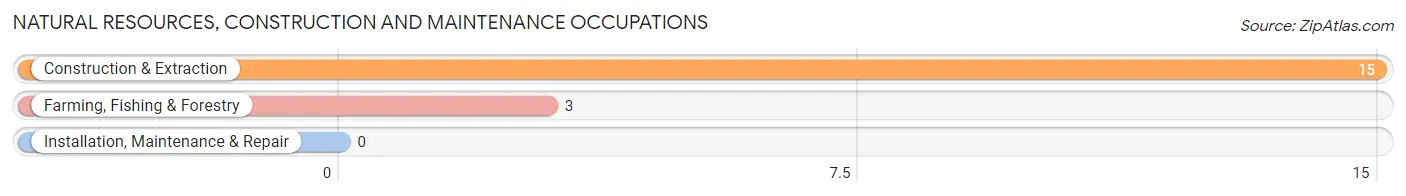
Natural Resources, Construction and Maintenance Occupations by Sex
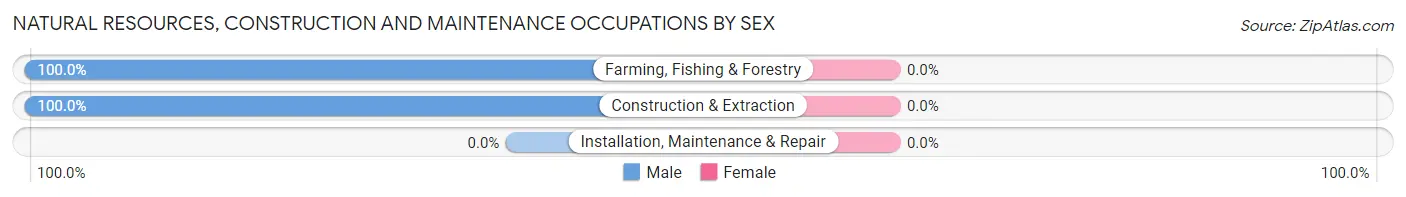
| Occupation | Male | Female |
| Farming, Fishing & Forestry | 3 (100.0%) | 0 (0.0%) |
| Construction & Extraction | 15 (100.0%) | 0 (0.0%) |
| Installation, Maintenance & Repair | 0 (0.0%) | 0 (0.0%) |
| Total (Category) | 18 (100.0%) | 0 (0.0%) |
| Total (Overall) | 86 (47.2%) | 96 (52.7%) |
Production, Transportation and Moving Occupations
The most common Production, Transportation and Moving occupations in Lake Viking are , and Production (4 | 2.2%).
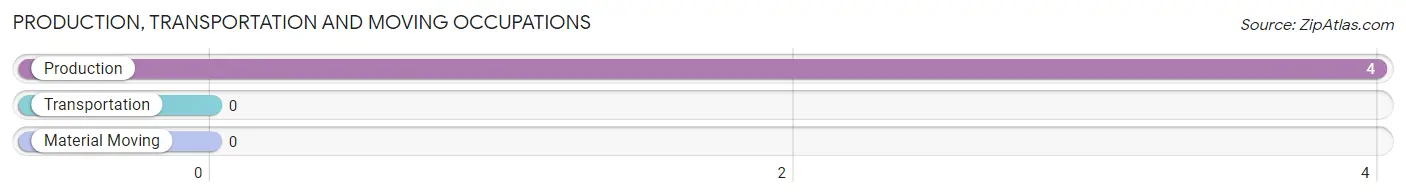
Production, Transportation and Moving Occupations by Sex
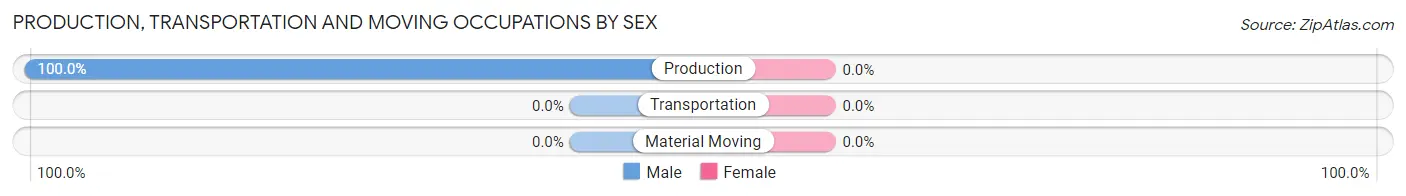
| Occupation | Male | Female |
| Production | 4 (100.0%) | 0 (0.0%) |
| Transportation | 0 (0.0%) | 0 (0.0%) |
| Material Moving | 0 (0.0%) | 0 (0.0%) |
| Total (Category) | 4 (100.0%) | 0 (0.0%) |
| Total (Overall) | 86 (47.2%) | 96 (52.7%) |
Employment Industries by Sex in Lake Viking
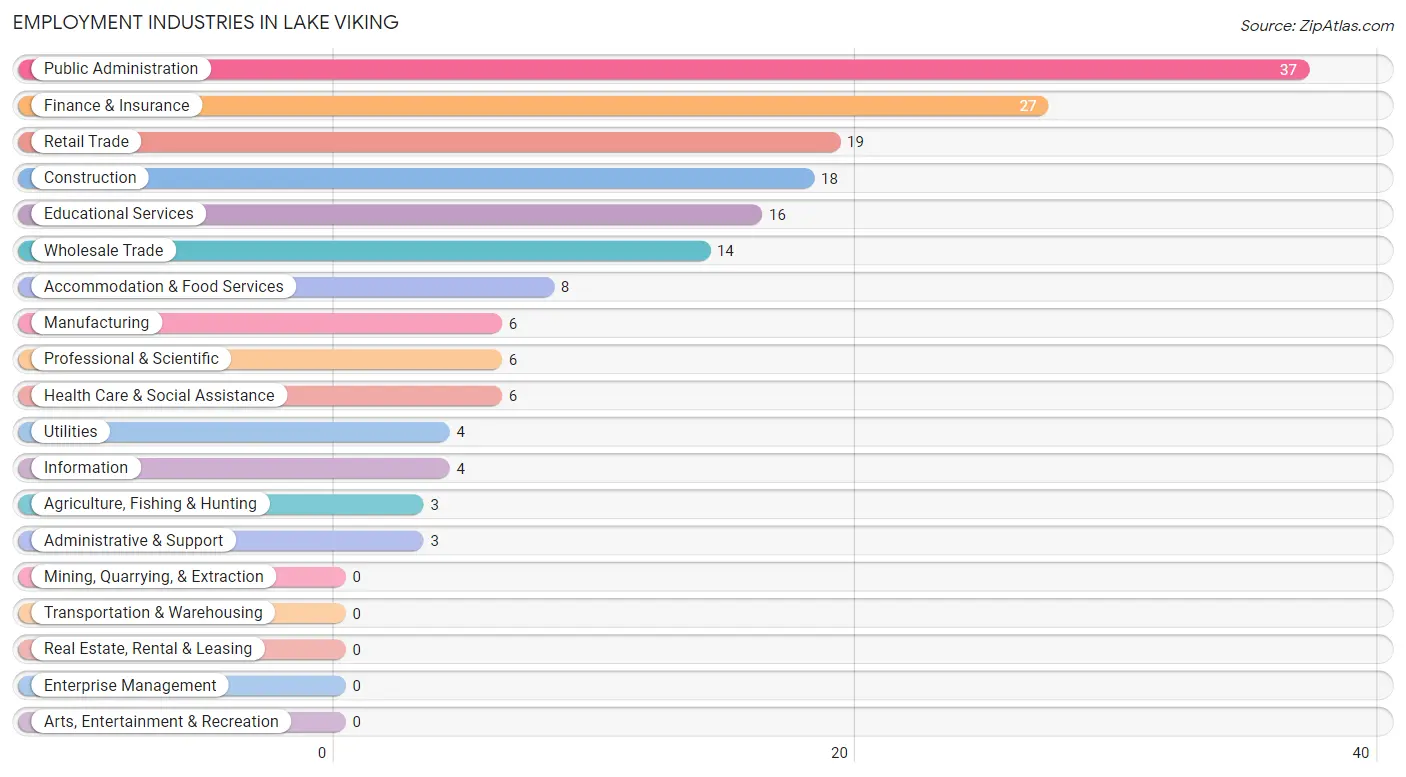
Employment Industries in Lake Viking
The major employment industries in Lake Viking include Public Administration (37 | 20.3%), Finance & Insurance (27 | 14.8%), Retail Trade (19 | 10.4%), Construction (18 | 9.9%), and Educational Services (16 | 8.8%).
Employment Industries by Sex in Lake Viking
The Lake Viking industries that see more men than women are Agriculture, Fishing & Hunting (100.0%), Construction (100.0%), and Manufacturing (100.0%), whereas the industries that tend to have a higher number of women are Utilities (100.0%), Educational Services (100.0%), and Health Care & Social Assistance (100.0%).
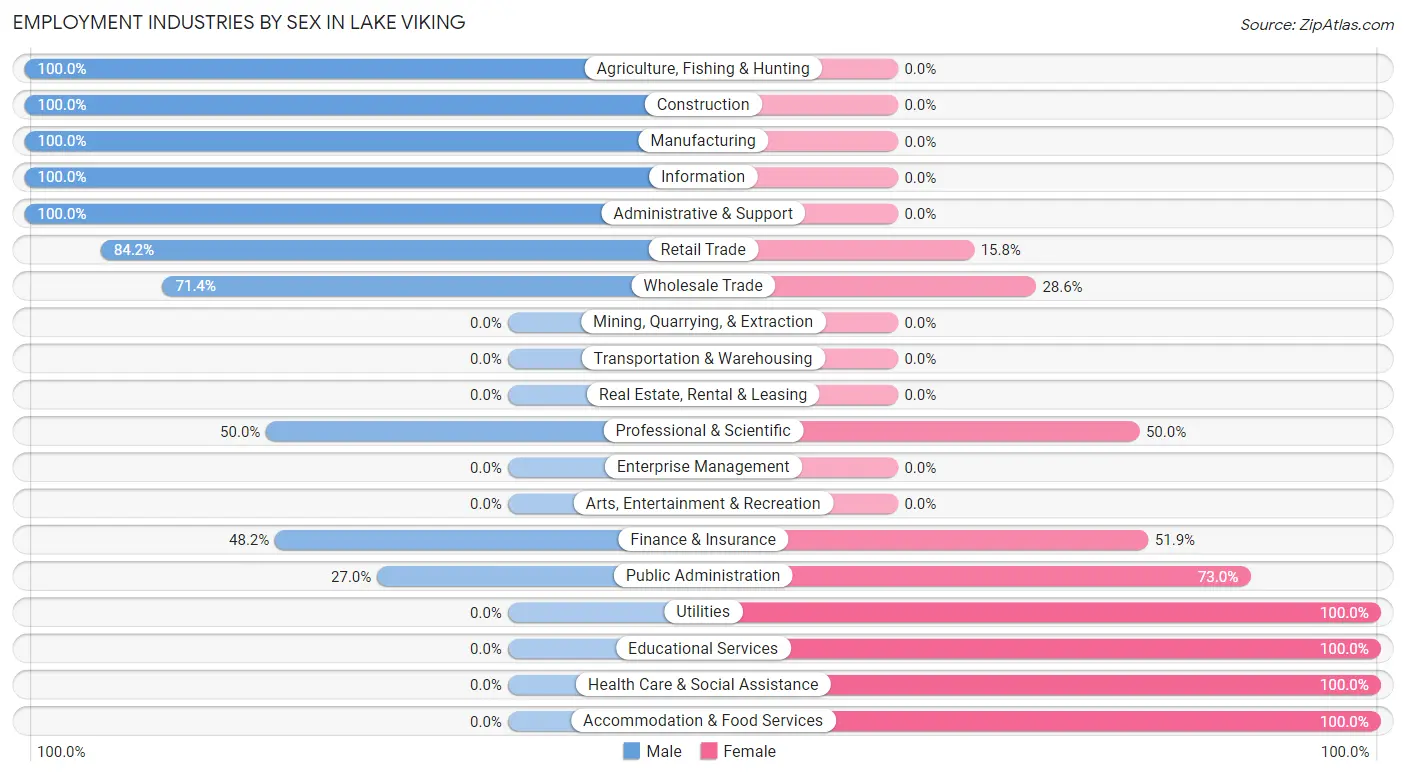
| Industry | Male | Female |
| Agriculture, Fishing & Hunting | 3 (100.0%) | 0 (0.0%) |
| Mining, Quarrying, & Extraction | 0 (0.0%) | 0 (0.0%) |
| Construction | 18 (100.0%) | 0 (0.0%) |
| Manufacturing | 6 (100.0%) | 0 (0.0%) |
| Wholesale Trade | 10 (71.4%) | 4 (28.6%) |
| Retail Trade | 16 (84.2%) | 3 (15.8%) |
| Transportation & Warehousing | 0 (0.0%) | 0 (0.0%) |
| Utilities | 0 (0.0%) | 4 (100.0%) |
| Information | 4 (100.0%) | 0 (0.0%) |
| Finance & Insurance | 13 (48.1%) | 14 (51.8%) |
| Real Estate, Rental & Leasing | 0 (0.0%) | 0 (0.0%) |
| Professional & Scientific | 3 (50.0%) | 3 (50.0%) |
| Enterprise Management | 0 (0.0%) | 0 (0.0%) |
| Administrative & Support | 3 (100.0%) | 0 (0.0%) |
| Educational Services | 0 (0.0%) | 16 (100.0%) |
| Health Care & Social Assistance | 0 (0.0%) | 6 (100.0%) |
| Arts, Entertainment & Recreation | 0 (0.0%) | 0 (0.0%) |
| Accommodation & Food Services | 0 (0.0%) | 8 (100.0%) |
| Public Administration | 10 (27.0%) | 27 (73.0%) |
| Total | 86 (47.2%) | 96 (52.7%) |
Education in Lake Viking
School Enrollment in Lake Viking
The most common levels of schooling among the 52 students in Lake Viking are high school (19 | 36.5%), middle school (15 | 28.8%), and elementary school (11 | 21.1%).
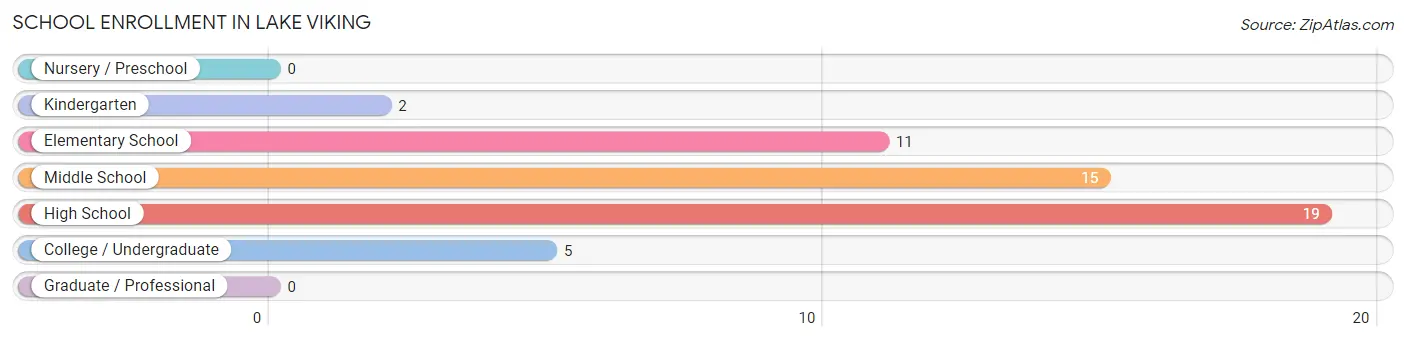
| School Level | # Students | % Students |
| Nursery / Preschool | 0 | 0.0% |
| Kindergarten | 2 | 3.8% |
| Elementary School | 11 | 21.1% |
| Middle School | 15 | 28.8% |
| High School | 19 | 36.5% |
| College / Undergraduate | 5 | 9.6% |
| Graduate / Professional | 0 | 0.0% |
| Total | 52 | 100.0% |
School Enrollment by Age by Funding Source in Lake Viking
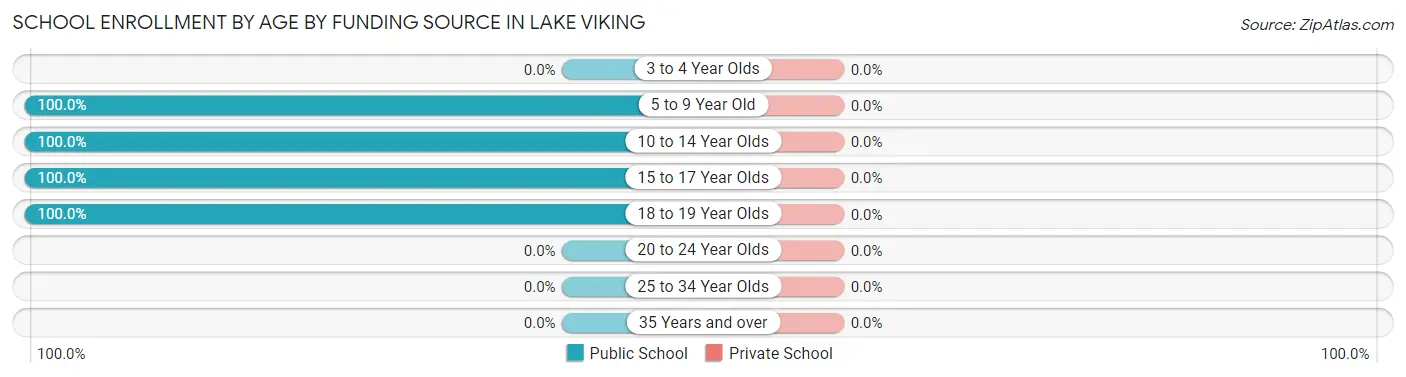
| Age Bracket | Public School | Private School |
| 3 to 4 Year Olds | 0 (0.0%) | 0 (0.0%) |
| 5 to 9 Year Old | 13 (100.0%) | 0 (0.0%) |
| 10 to 14 Year Olds | 15 (100.0%) | 0 (0.0%) |
| 15 to 17 Year Olds | 19 (100.0%) | 0 (0.0%) |
| 18 to 19 Year Olds | 5 (100.0%) | 0 (0.0%) |
| 20 to 24 Year Olds | 0 (0.0%) | 0 (0.0%) |
| 25 to 34 Year Olds | 0 (0.0%) | 0 (0.0%) |
| 35 Years and over | 0 (0.0%) | 0 (0.0%) |
| Total | 52 (100.0%) | 0 (0.0%) |
Educational Attainment by Field of Study in Lake Viking
Education (57 | 38.3%), business (44 | 29.5%), arts & humanities (18 | 12.1%), computers & mathematics (10 | 6.7%), and science & technology (5 | 3.4%) are the most common fields of study among 149 individuals in Lake Viking who have obtained a bachelor's degree or higher.
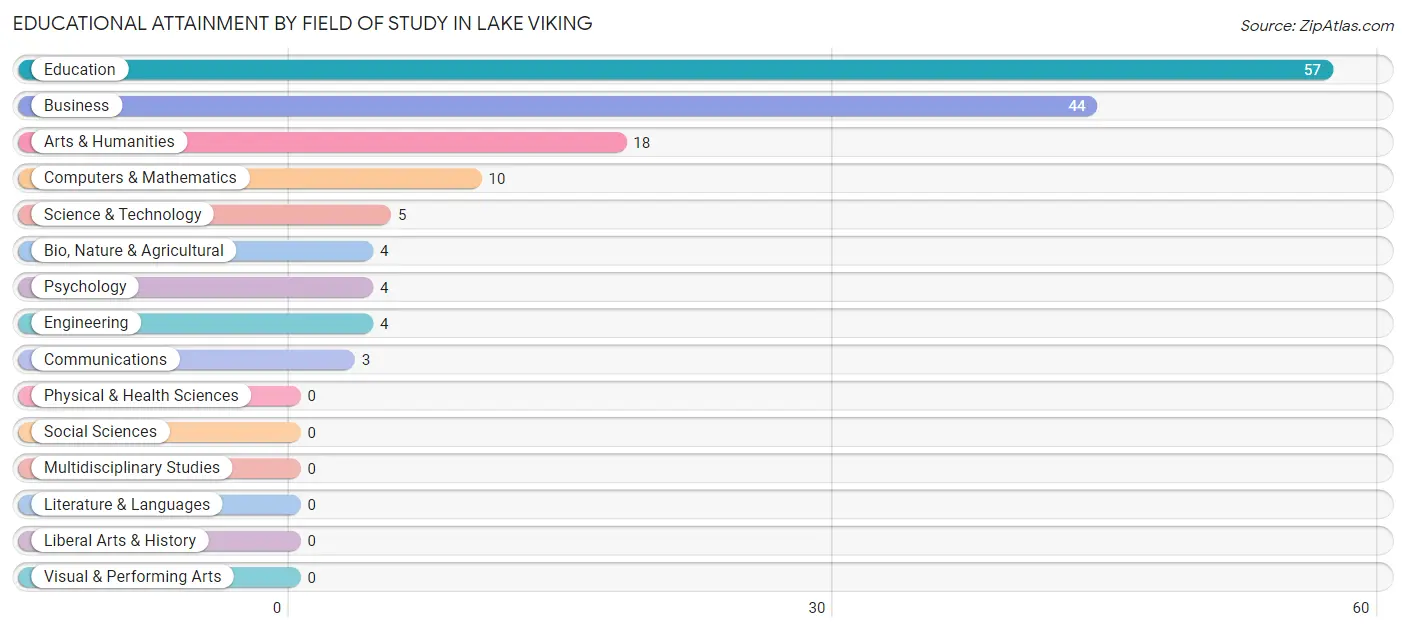
| Field of Study | # Graduates | % Graduates |
| Computers & Mathematics | 10 | 6.7% |
| Bio, Nature & Agricultural | 4 | 2.7% |
| Physical & Health Sciences | 0 | 0.0% |
| Psychology | 4 | 2.7% |
| Social Sciences | 0 | 0.0% |
| Engineering | 4 | 2.7% |
| Multidisciplinary Studies | 0 | 0.0% |
| Science & Technology | 5 | 3.4% |
| Business | 44 | 29.5% |
| Education | 57 | 38.3% |
| Literature & Languages | 0 | 0.0% |
| Liberal Arts & History | 0 | 0.0% |
| Visual & Performing Arts | 0 | 0.0% |
| Communications | 3 | 2.0% |
| Arts & Humanities | 18 | 12.1% |
| Total | 149 | 100.0% |
Transportation & Commute in Lake Viking
Vehicle Availability by Sex in Lake Viking
The most prevalent vehicle ownership categories in Lake Viking are males with 3 vehicles (36, accounting for 42.9%) and females with 3 vehicles (66, making up 37.5%).
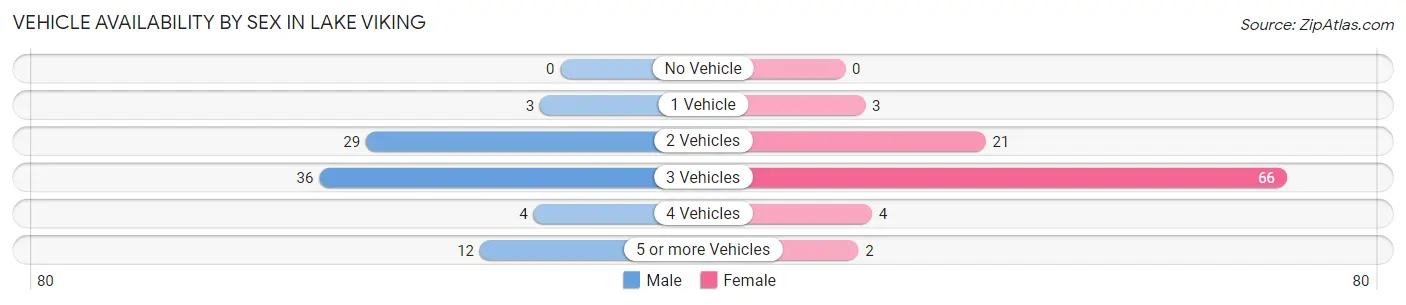
| Vehicles Available | Male | Female |
| No Vehicle | 0 (0.0%) | 0 (0.0%) |
| 1 Vehicle | 3 (3.6%) | 3 (3.1%) |
| 2 Vehicles | 29 (34.5%) | 21 (21.9%) |
| 3 Vehicles | 36 (42.9%) | 66 (68.8%) |
| 4 Vehicles | 4 (4.8%) | 4 (4.2%) |
| 5 or more Vehicles | 12 (14.3%) | 2 (2.1%) |
| Total | 84 (100.0%) | 96 (100.0%) |
Commute Time in Lake Viking
The most frequently occuring commute durations in Lake Viking are 15 to 19 minutes (40 commuters, 25.3%), 60 to 89 minutes (28 commuters, 17.7%), and 10 to 14 minutes (21 commuters, 13.3%).
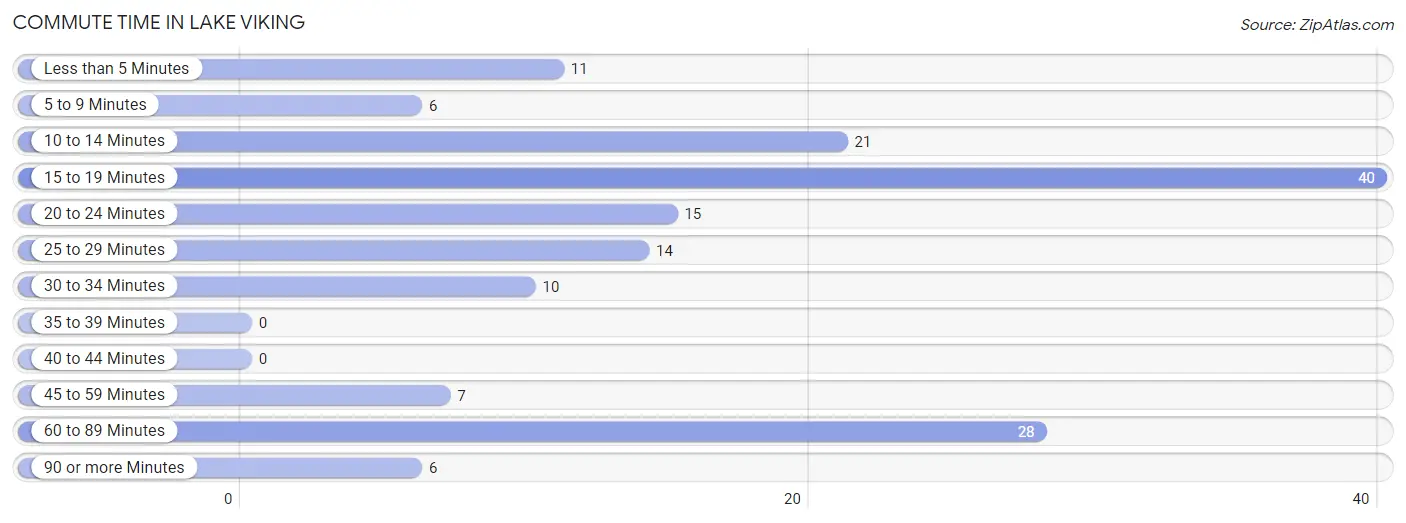
| Commute Time | # Commuters | % Commuters |
| Less than 5 Minutes | 11 | 7.0% |
| 5 to 9 Minutes | 6 | 3.8% |
| 10 to 14 Minutes | 21 | 13.3% |
| 15 to 19 Minutes | 40 | 25.3% |
| 20 to 24 Minutes | 15 | 9.5% |
| 25 to 29 Minutes | 14 | 8.9% |
| 30 to 34 Minutes | 10 | 6.3% |
| 35 to 39 Minutes | 0 | 0.0% |
| 40 to 44 Minutes | 0 | 0.0% |
| 45 to 59 Minutes | 7 | 4.4% |
| 60 to 89 Minutes | 28 | 17.7% |
| 90 or more Minutes | 6 | 3.8% |
Commute Time by Sex in Lake Viking
The most common commute times in Lake Viking are 60 to 89 minutes (22 commuters, 31.4%) for males and 15 to 19 minutes (28 commuters, 31.8%) for females.
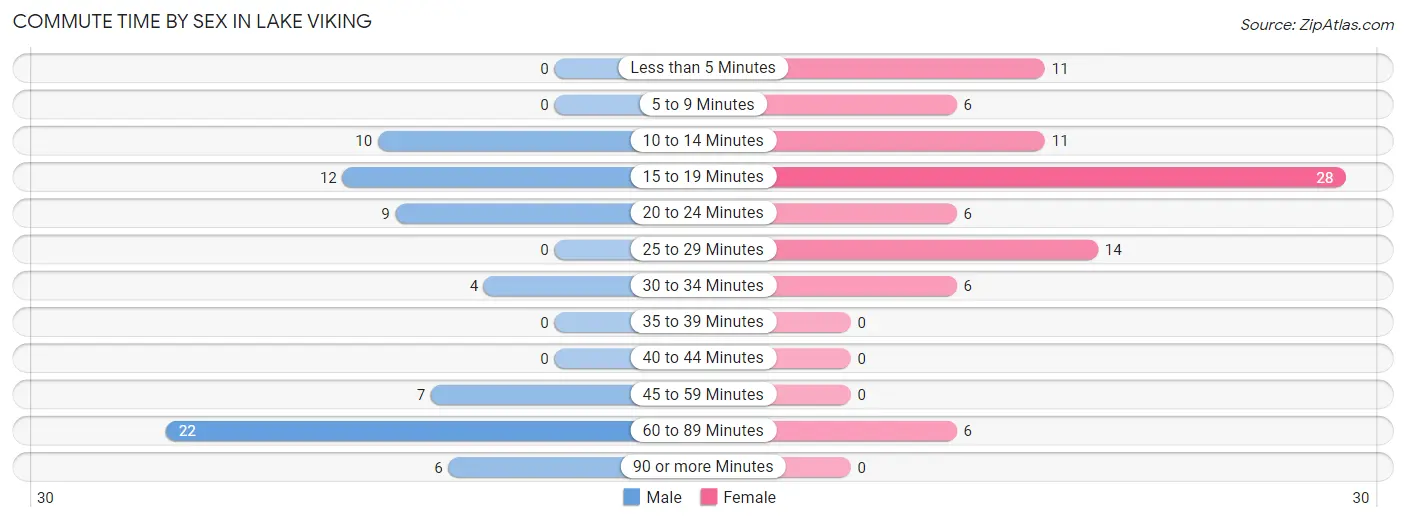
| Commute Time | Male | Female |
| Less than 5 Minutes | 0 (0.0%) | 11 (12.5%) |
| 5 to 9 Minutes | 0 (0.0%) | 6 (6.8%) |
| 10 to 14 Minutes | 10 (14.3%) | 11 (12.5%) |
| 15 to 19 Minutes | 12 (17.1%) | 28 (31.8%) |
| 20 to 24 Minutes | 9 (12.9%) | 6 (6.8%) |
| 25 to 29 Minutes | 0 (0.0%) | 14 (15.9%) |
| 30 to 34 Minutes | 4 (5.7%) | 6 (6.8%) |
| 35 to 39 Minutes | 0 (0.0%) | 0 (0.0%) |
| 40 to 44 Minutes | 0 (0.0%) | 0 (0.0%) |
| 45 to 59 Minutes | 7 (10.0%) | 0 (0.0%) |
| 60 to 89 Minutes | 22 (31.4%) | 6 (6.8%) |
| 90 or more Minutes | 6 (8.6%) | 0 (0.0%) |
Time of Departure to Work by Sex in Lake Viking
The most frequent times of departure to work in Lake Viking are 5:30 AM to 5:59 AM (16, 22.9%) for males and 7:30 AM to 7:59 AM (22, 25.0%) for females.
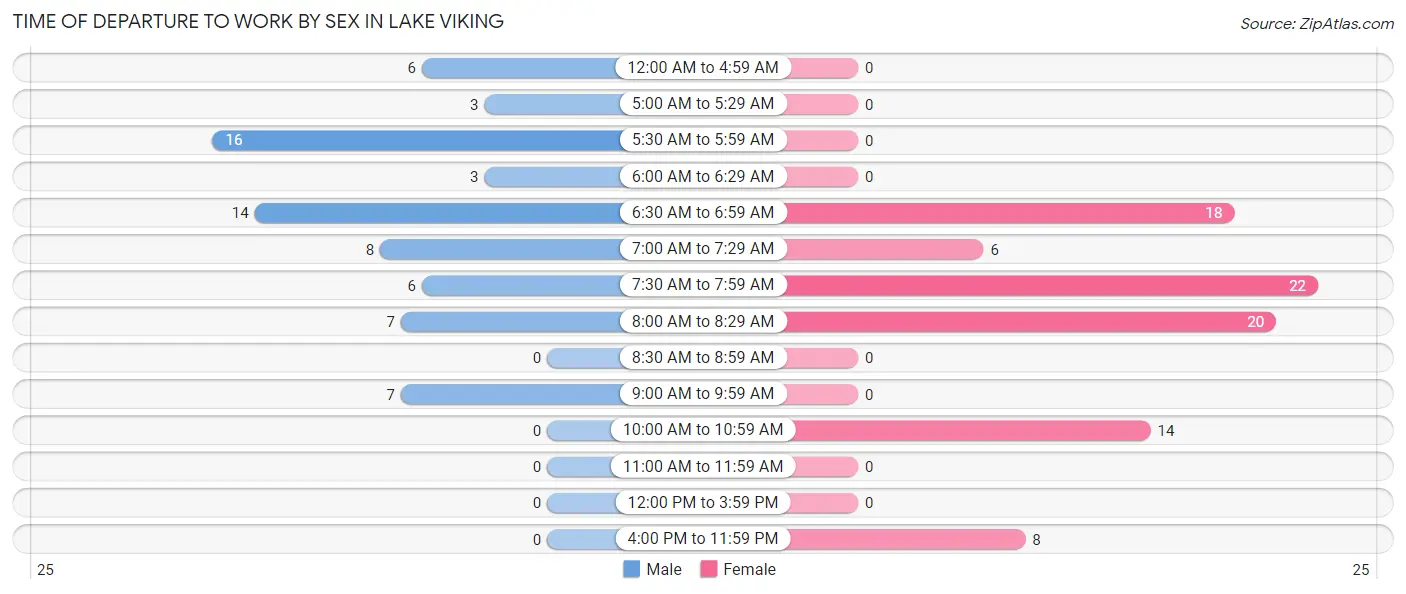
| Time of Departure | Male | Female |
| 12:00 AM to 4:59 AM | 6 (8.6%) | 0 (0.0%) |
| 5:00 AM to 5:29 AM | 3 (4.3%) | 0 (0.0%) |
| 5:30 AM to 5:59 AM | 16 (22.9%) | 0 (0.0%) |
| 6:00 AM to 6:29 AM | 3 (4.3%) | 0 (0.0%) |
| 6:30 AM to 6:59 AM | 14 (20.0%) | 18 (20.4%) |
| 7:00 AM to 7:29 AM | 8 (11.4%) | 6 (6.8%) |
| 7:30 AM to 7:59 AM | 6 (8.6%) | 22 (25.0%) |
| 8:00 AM to 8:29 AM | 7 (10.0%) | 20 (22.7%) |
| 8:30 AM to 8:59 AM | 0 (0.0%) | 0 (0.0%) |
| 9:00 AM to 9:59 AM | 7 (10.0%) | 0 (0.0%) |
| 10:00 AM to 10:59 AM | 0 (0.0%) | 14 (15.9%) |
| 11:00 AM to 11:59 AM | 0 (0.0%) | 0 (0.0%) |
| 12:00 PM to 3:59 PM | 0 (0.0%) | 0 (0.0%) |
| 4:00 PM to 11:59 PM | 0 (0.0%) | 8 (9.1%) |
| Total | 70 (100.0%) | 88 (100.0%) |
Housing Occupancy in Lake Viking
Occupancy by Ownership in Lake Viking
Of the total 199 dwellings in Lake Viking, owner-occupied units account for 197 (99.0%), while renter-occupied units make up 2 (1.0%).
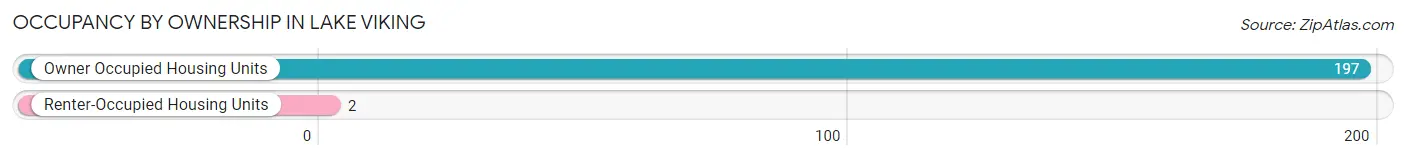
| Occupancy | # Housing Units | % Housing Units |
| Owner Occupied Housing Units | 197 | 99.0% |
| Renter-Occupied Housing Units | 2 | 1.0% |
| Total Occupied Housing Units | 199 | 100.0% |
Occupancy by Household Size in Lake Viking
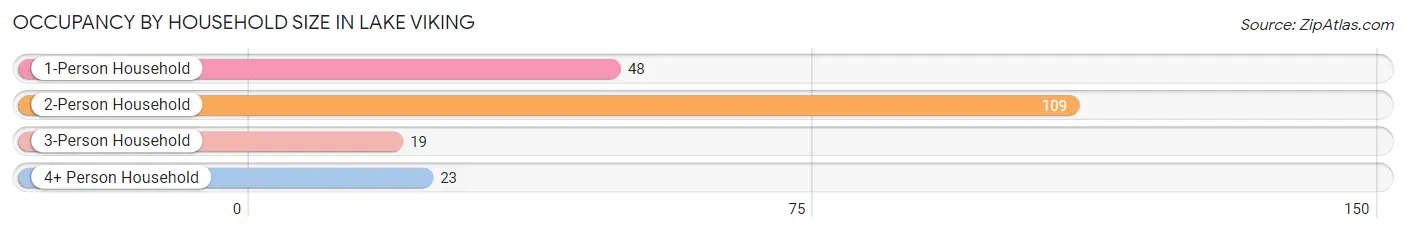
| Household Size | # Housing Units | % Housing Units |
| 1-Person Household | 48 | 24.1% |
| 2-Person Household | 109 | 54.8% |
| 3-Person Household | 19 | 9.6% |
| 4+ Person Household | 23 | 11.6% |
| Total Housing Units | 199 | 100.0% |
Occupancy by Ownership by Household Size in Lake Viking
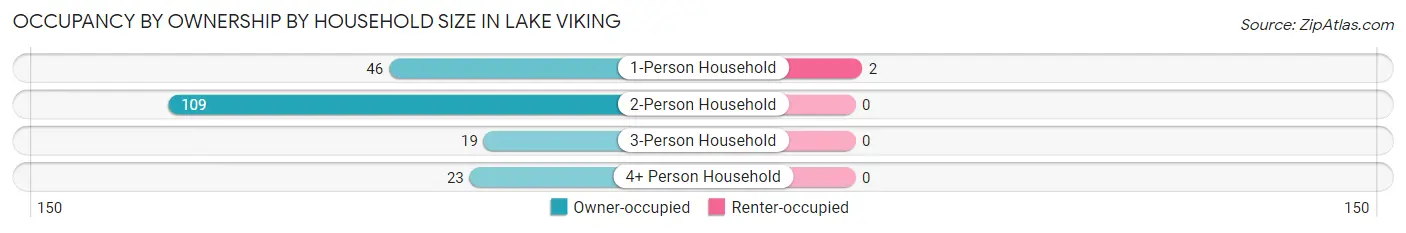
| Household Size | Owner-occupied | Renter-occupied |
| 1-Person Household | 46 (95.8%) | 2 (4.2%) |
| 2-Person Household | 109 (100.0%) | 0 (0.0%) |
| 3-Person Household | 19 (100.0%) | 0 (0.0%) |
| 4+ Person Household | 23 (100.0%) | 0 (0.0%) |
| Total Housing Units | 197 (99.0%) | 2 (1.0%) |
Occupancy by Educational Attainment in Lake Viking
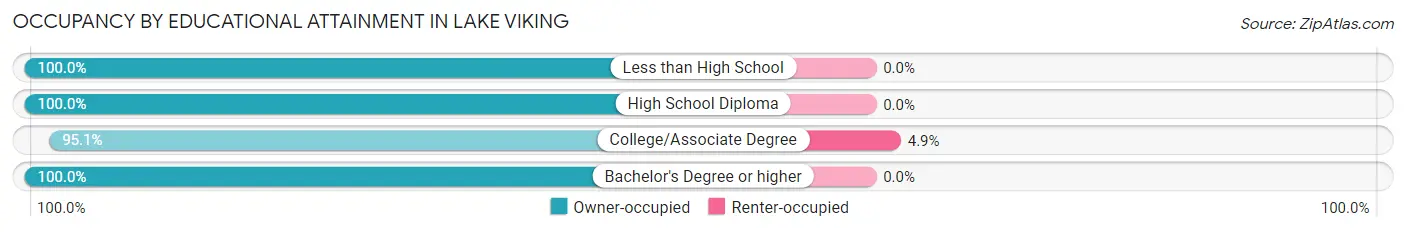
| Household Size | Owner-occupied | Renter-occupied |
| Less than High School | 3 (100.0%) | 0 (0.0%) |
| High School Diploma | 67 (100.0%) | 0 (0.0%) |
| College/Associate Degree | 39 (95.1%) | 2 (4.9%) |
| Bachelor's Degree or higher | 88 (100.0%) | 0 (0.0%) |
Occupancy by Age of Householder in Lake Viking
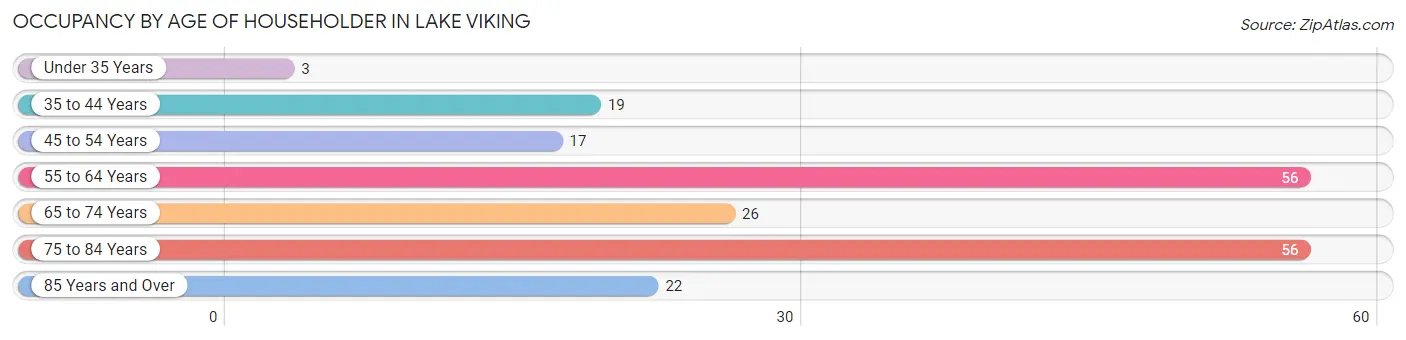
| Age Bracket | # Households | % Households |
| Under 35 Years | 3 | 1.5% |
| 35 to 44 Years | 19 | 9.6% |
| 45 to 54 Years | 17 | 8.5% |
| 55 to 64 Years | 56 | 28.1% |
| 65 to 74 Years | 26 | 13.1% |
| 75 to 84 Years | 56 | 28.1% |
| 85 Years and Over | 22 | 11.1% |
| Total | 199 | 100.0% |
Housing Finances in Lake Viking
Median Income by Occupancy in Lake Viking
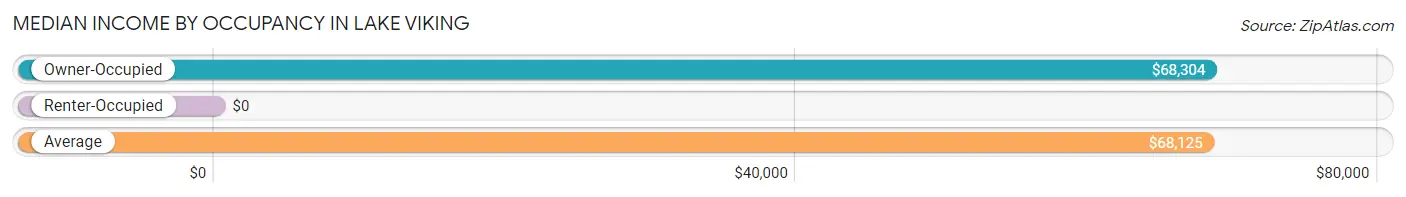
| Occupancy Type | # Households | Median Income |
| Owner-Occupied | 197 (99.0%) | $68,304 |
| Renter-Occupied | 2 (1.0%) | $0 |
| Average | 199 (100.0%) | $68,125 |
Occupancy by Householder Income Bracket in Lake Viking
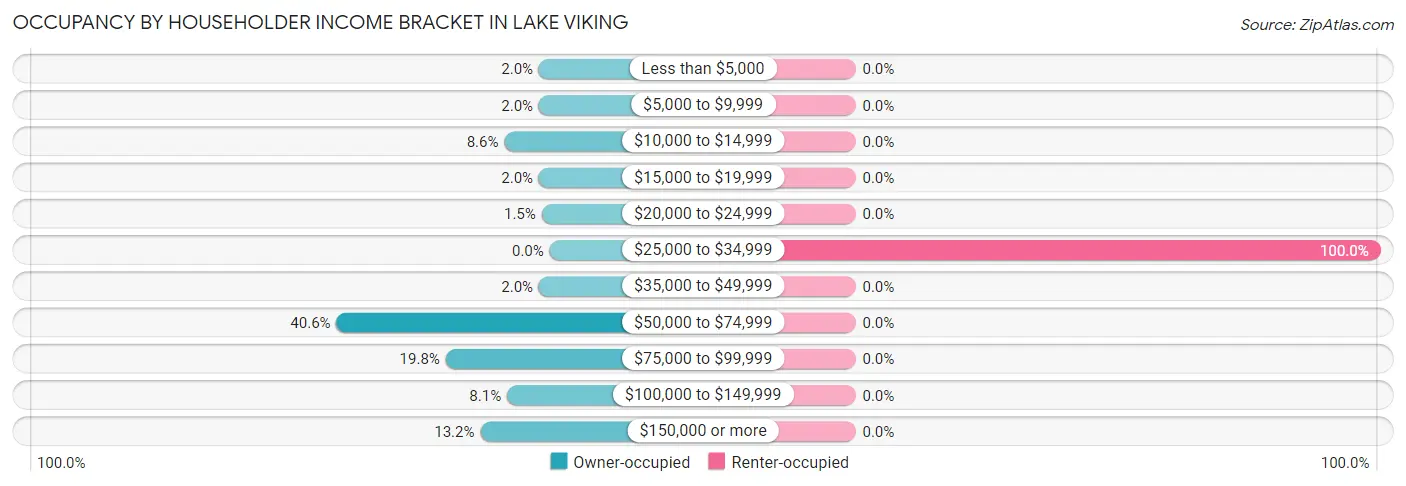
| Income Bracket | Owner-occupied | Renter-occupied |
| Less than $5,000 | 4 (2.0%) | 0 (0.0%) |
| $5,000 to $9,999 | 4 (2.0%) | 0 (0.0%) |
| $10,000 to $14,999 | 17 (8.6%) | 0 (0.0%) |
| $15,000 to $19,999 | 4 (2.0%) | 0 (0.0%) |
| $20,000 to $24,999 | 3 (1.5%) | 0 (0.0%) |
| $25,000 to $34,999 | 0 (0.0%) | 2 (100.0%) |
| $35,000 to $49,999 | 4 (2.0%) | 0 (0.0%) |
| $50,000 to $74,999 | 80 (40.6%) | 0 (0.0%) |
| $75,000 to $99,999 | 39 (19.8%) | 0 (0.0%) |
| $100,000 to $149,999 | 16 (8.1%) | 0 (0.0%) |
| $150,000 or more | 26 (13.2%) | 0 (0.0%) |
| Total | 197 (100.0%) | 2 (100.0%) |
Monthly Housing Cost Tiers in Lake Viking
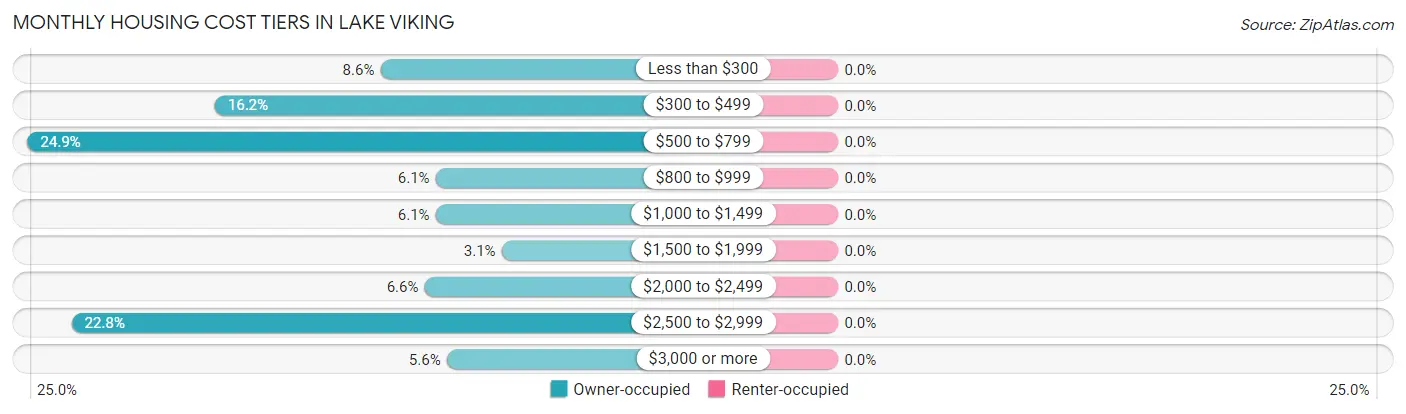
| Monthly Cost | Owner-occupied | Renter-occupied |
| Less than $300 | 17 (8.6%) | 0 (0.0%) |
| $300 to $499 | 32 (16.2%) | 0 (0.0%) |
| $500 to $799 | 49 (24.9%) | 0 (0.0%) |
| $800 to $999 | 12 (6.1%) | 0 (0.0%) |
| $1,000 to $1,499 | 12 (6.1%) | 0 (0.0%) |
| $1,500 to $1,999 | 6 (3.0%) | 0 (0.0%) |
| $2,000 to $2,499 | 13 (6.6%) | 0 (0.0%) |
| $2,500 to $2,999 | 45 (22.8%) | 0 (0.0%) |
| $3,000 or more | 11 (5.6%) | 0 (0.0%) |
| Total | 197 (100.0%) | 2 (100.0%) |
Physical Housing Characteristics in Lake Viking
Housing Structures in Lake Viking
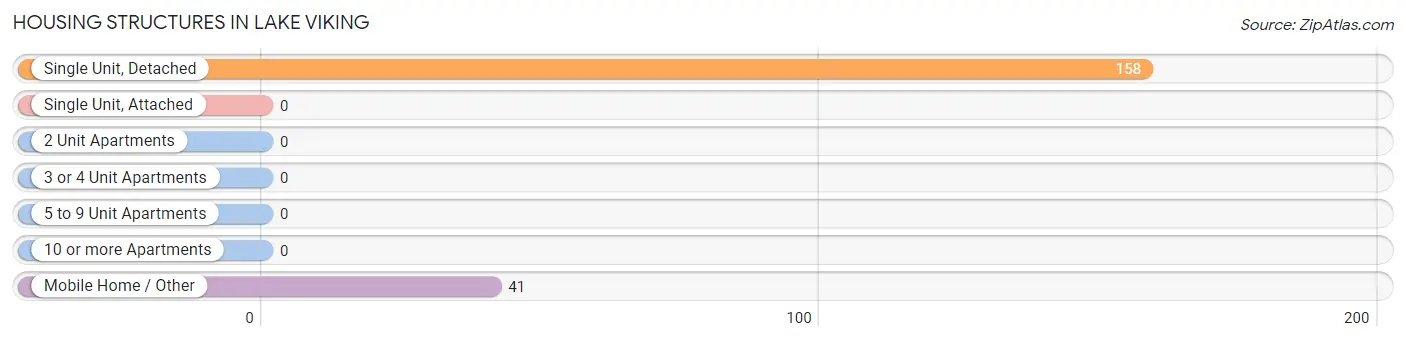
| Structure Type | # Housing Units | % Housing Units |
| Single Unit, Detached | 158 | 79.4% |
| Single Unit, Attached | 0 | 0.0% |
| 2 Unit Apartments | 0 | 0.0% |
| 3 or 4 Unit Apartments | 0 | 0.0% |
| 5 to 9 Unit Apartments | 0 | 0.0% |
| 10 or more Apartments | 0 | 0.0% |
| Mobile Home / Other | 41 | 20.6% |
| Total | 199 | 100.0% |
Housing Structures by Occupancy in Lake Viking
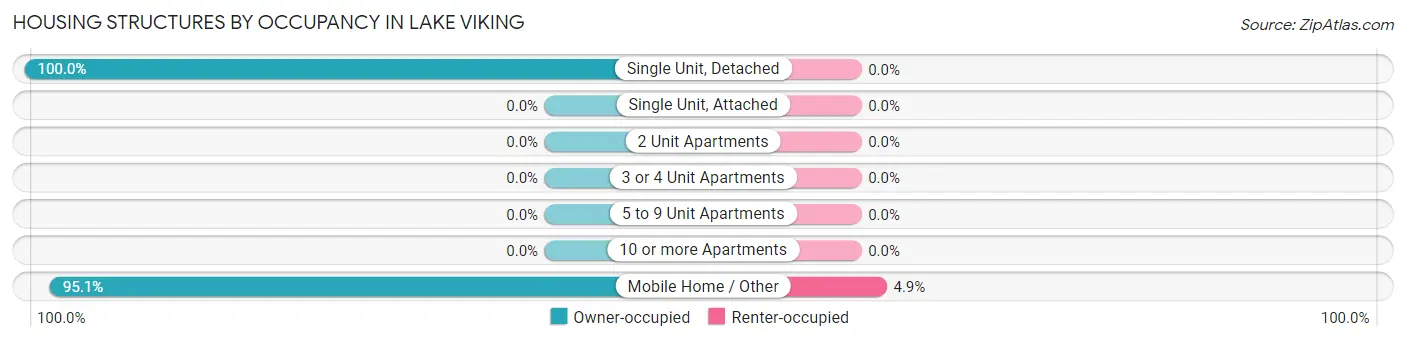
| Structure Type | Owner-occupied | Renter-occupied |
| Single Unit, Detached | 158 (100.0%) | 0 (0.0%) |
| Single Unit, Attached | 0 (0.0%) | 0 (0.0%) |
| 2 Unit Apartments | 0 (0.0%) | 0 (0.0%) |
| 3 or 4 Unit Apartments | 0 (0.0%) | 0 (0.0%) |
| 5 to 9 Unit Apartments | 0 (0.0%) | 0 (0.0%) |
| 10 or more Apartments | 0 (0.0%) | 0 (0.0%) |
| Mobile Home / Other | 39 (95.1%) | 2 (4.9%) |
| Total | 197 (99.0%) | 2 (1.0%) |
Housing Structures by Number of Rooms in Lake Viking
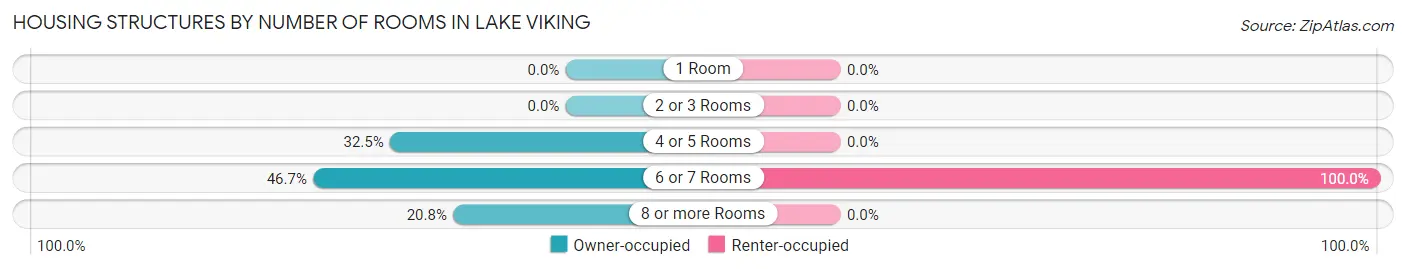
| Number of Rooms | Owner-occupied | Renter-occupied |
| 1 Room | 0 (0.0%) | 0 (0.0%) |
| 2 or 3 Rooms | 0 (0.0%) | 0 (0.0%) |
| 4 or 5 Rooms | 64 (32.5%) | 0 (0.0%) |
| 6 or 7 Rooms | 92 (46.7%) | 2 (100.0%) |
| 8 or more Rooms | 41 (20.8%) | 0 (0.0%) |
| Total | 197 (100.0%) | 2 (100.0%) |
Housing Structure by Heating Type in Lake Viking
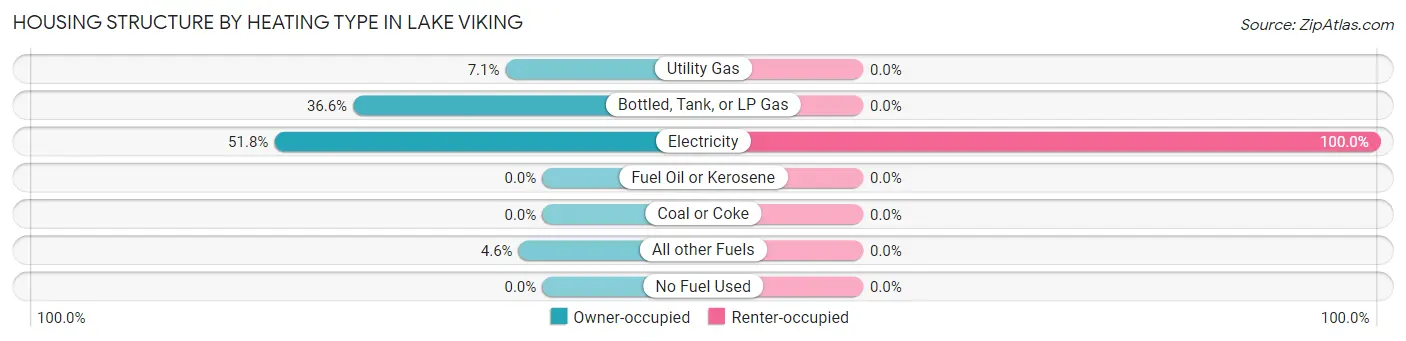
| Heating Type | Owner-occupied | Renter-occupied |
| Utility Gas | 14 (7.1%) | 0 (0.0%) |
| Bottled, Tank, or LP Gas | 72 (36.5%) | 0 (0.0%) |
| Electricity | 102 (51.8%) | 2 (100.0%) |
| Fuel Oil or Kerosene | 0 (0.0%) | 0 (0.0%) |
| Coal or Coke | 0 (0.0%) | 0 (0.0%) |
| All other Fuels | 9 (4.6%) | 0 (0.0%) |
| No Fuel Used | 0 (0.0%) | 0 (0.0%) |
| Total | 197 (100.0%) | 2 (100.0%) |
Household Vehicle Usage in Lake Viking
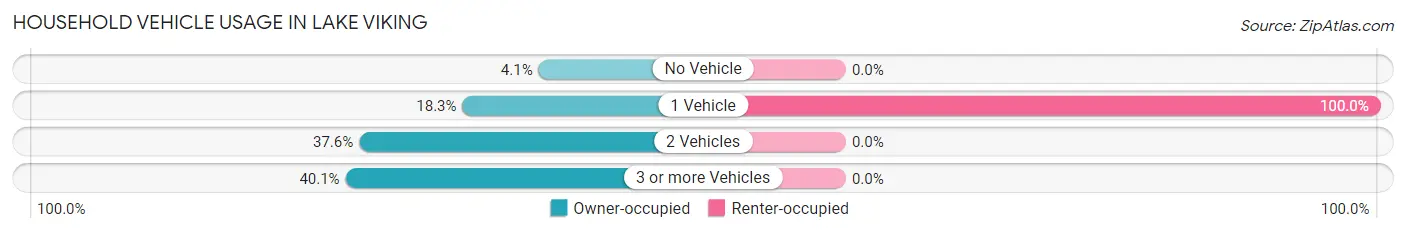
| Vehicles per Household | Owner-occupied | Renter-occupied |
| No Vehicle | 8 (4.1%) | 0 (0.0%) |
| 1 Vehicle | 36 (18.3%) | 2 (100.0%) |
| 2 Vehicles | 74 (37.6%) | 0 (0.0%) |
| 3 or more Vehicles | 79 (40.1%) | 0 (0.0%) |
| Total | 197 (100.0%) | 2 (100.0%) |
Real Estate & Mortgages in Lake Viking
Real Estate and Mortgage Overview in Lake Viking
| Characteristic | Without Mortgage | With Mortgage |
| Housing Units | 111 | 86 |
| Median Property Value | $225,000 | $610,500 |
| Median Household Income | $63,125 | $15 |
| Monthly Housing Costs | $579 | $11 |
| Real Estate Taxes | $1,781 | $0 |
Property Value by Mortgage Status in Lake Viking
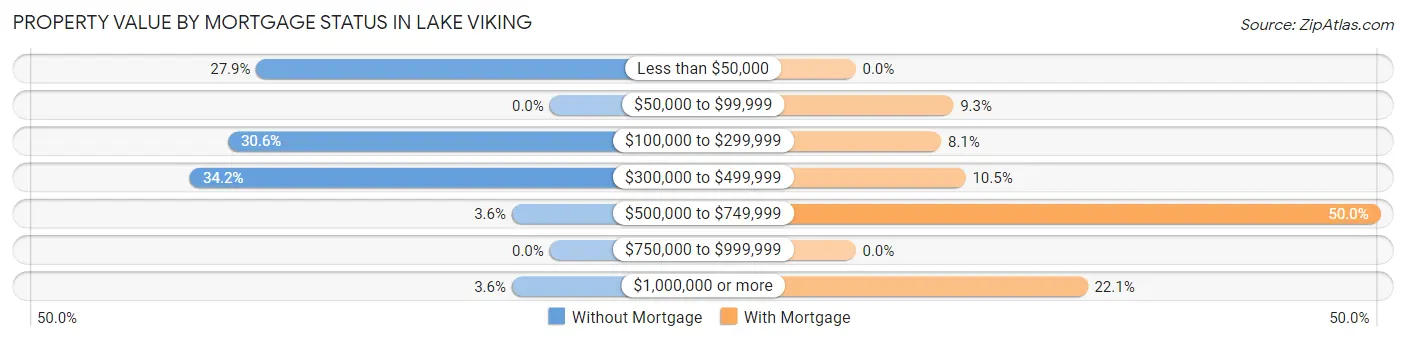
| Property Value | Without Mortgage | With Mortgage |
| Less than $50,000 | 31 (27.9%) | 0 (0.0%) |
| $50,000 to $99,999 | 0 (0.0%) | 8 (9.3%) |
| $100,000 to $299,999 | 34 (30.6%) | 7 (8.1%) |
| $300,000 to $499,999 | 38 (34.2%) | 9 (10.5%) |
| $500,000 to $749,999 | 4 (3.6%) | 43 (50.0%) |
| $750,000 to $999,999 | 0 (0.0%) | 0 (0.0%) |
| $1,000,000 or more | 4 (3.6%) | 19 (22.1%) |
| Total | 111 (100.0%) | 86 (100.0%) |
Household Income by Mortgage Status in Lake Viking
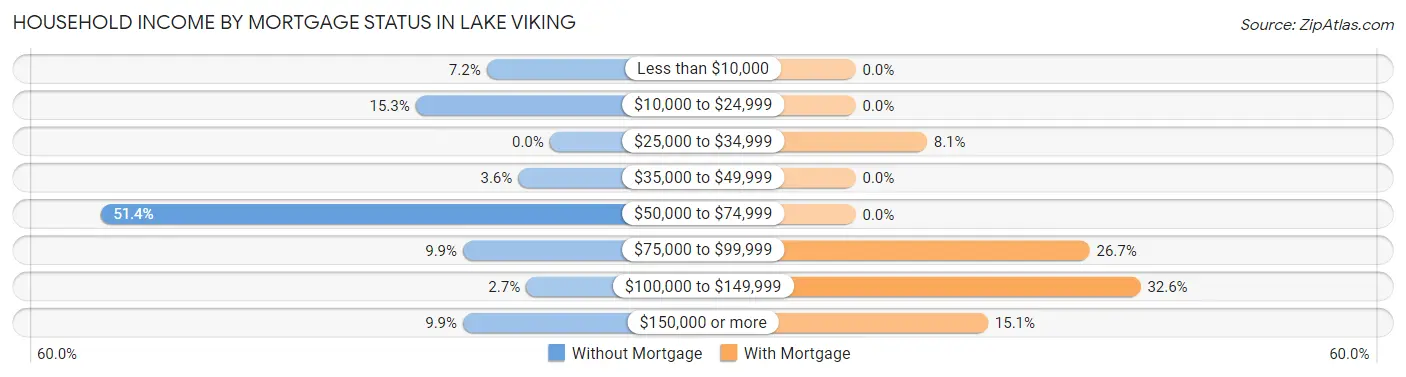
| Household Income | Without Mortgage | With Mortgage |
| Less than $10,000 | 8 (7.2%) | 0 (0.0%) |
| $10,000 to $24,999 | 17 (15.3%) | 0 (0.0%) |
| $25,000 to $34,999 | 0 (0.0%) | 7 (8.1%) |
| $35,000 to $49,999 | 4 (3.6%) | 0 (0.0%) |
| $50,000 to $74,999 | 57 (51.3%) | 0 (0.0%) |
| $75,000 to $99,999 | 11 (9.9%) | 23 (26.7%) |
| $100,000 to $149,999 | 3 (2.7%) | 28 (32.6%) |
| $150,000 or more | 11 (9.9%) | 13 (15.1%) |
| Total | 111 (100.0%) | 86 (100.0%) |
Property Value to Household Income Ratio in Lake Viking
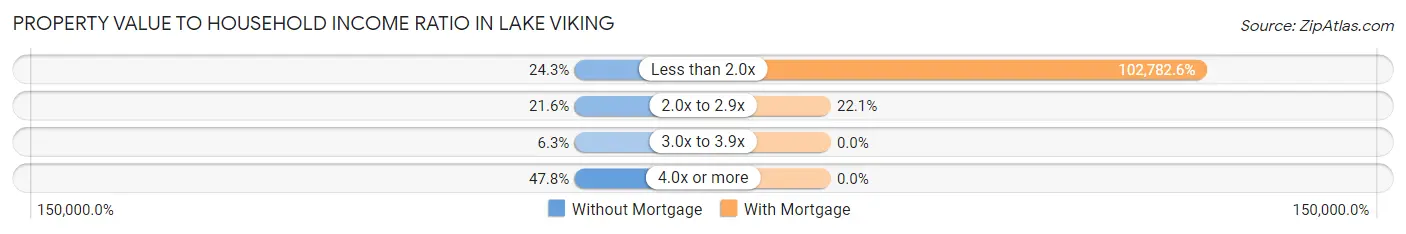
| Value-to-Income Ratio | Without Mortgage | With Mortgage |
| Less than 2.0x | 27 (24.3%) | 88,393 (102,782.6%) |
| 2.0x to 2.9x | 24 (21.6%) | 19 (22.1%) |
| 3.0x to 3.9x | 7 (6.3%) | 0 (0.0%) |
| 4.0x or more | 53 (47.7%) | 0 (0.0%) |
| Total | 111 (100.0%) | 86 (100.0%) |
Real Estate Taxes by Mortgage Status in Lake Viking
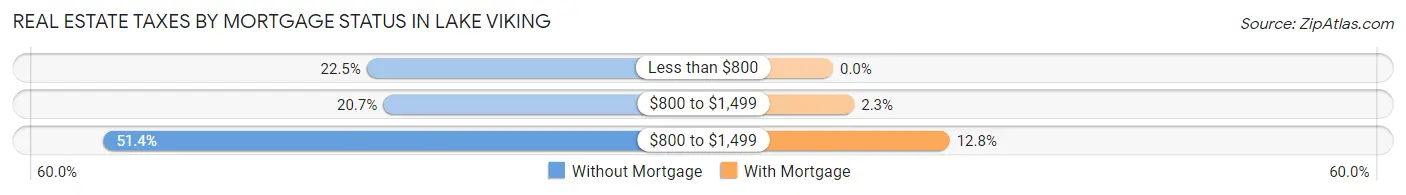
| Property Taxes | Without Mortgage | With Mortgage |
| Less than $800 | 25 (22.5%) | 0 (0.0%) |
| $800 to $1,499 | 23 (20.7%) | 2 (2.3%) |
| $800 to $1,499 | 57 (51.3%) | 11 (12.8%) |
| Total | 111 (100.0%) | 86 (100.0%) |
Health & Disability in Lake Viking
Health Insurance Coverage by Age in Lake Viking
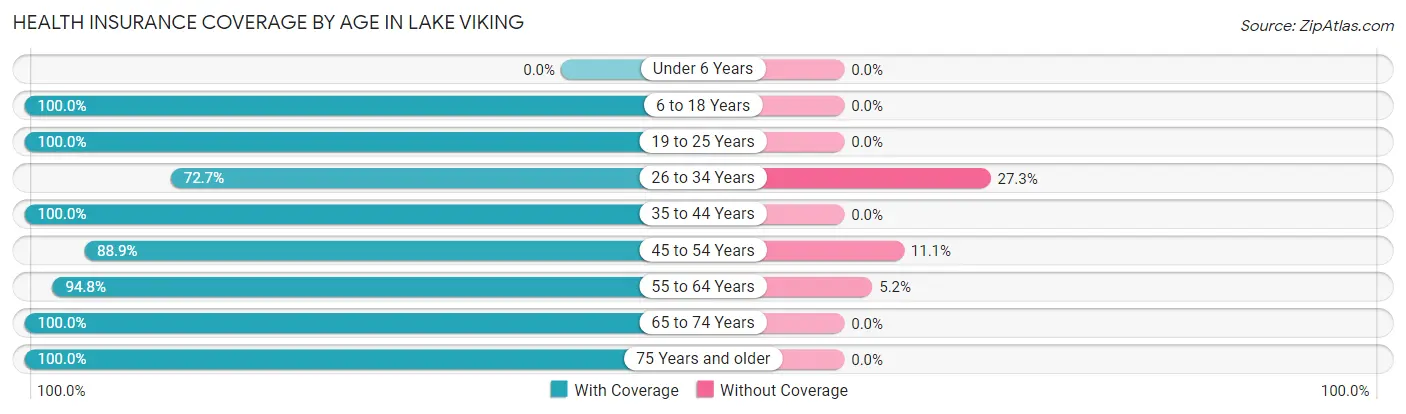
| Age Bracket | With Coverage | Without Coverage |
| Under 6 Years | 0 (0.0%) | 0 (0.0%) |
| 6 to 18 Years | 47 (100.0%) | 0 (0.0%) |
| 19 to 25 Years | 8 (100.0%) | 0 (0.0%) |
| 26 to 34 Years | 8 (72.7%) | 3 (27.3%) |
| 35 to 44 Years | 40 (100.0%) | 0 (0.0%) |
| 45 to 54 Years | 24 (88.9%) | 3 (11.1%) |
| 55 to 64 Years | 109 (94.8%) | 6 (5.2%) |
| 65 to 74 Years | 52 (100.0%) | 0 (0.0%) |
| 75 Years and older | 103 (100.0%) | 0 (0.0%) |
| Total | 391 (97.0%) | 12 (3.0%) |
Health Insurance Coverage by Citizenship Status in Lake Viking
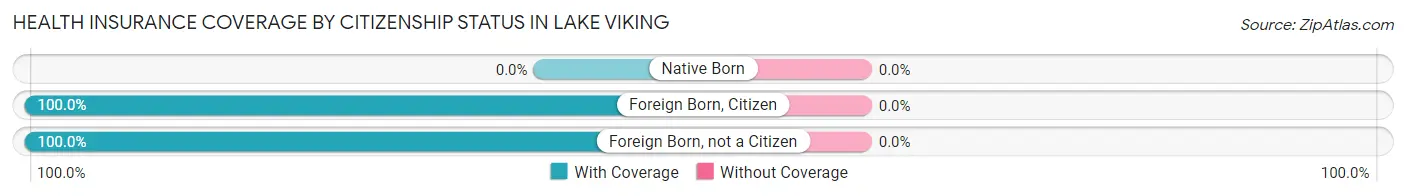
| Citizenship Status | With Coverage | Without Coverage |
| Native Born | 0 (0.0%) | 0 (0.0%) |
| Foreign Born, Citizen | 47 (100.0%) | 0 (0.0%) |
| Foreign Born, not a Citizen | 8 (100.0%) | 0 (0.0%) |
Health Insurance Coverage by Household Income in Lake Viking
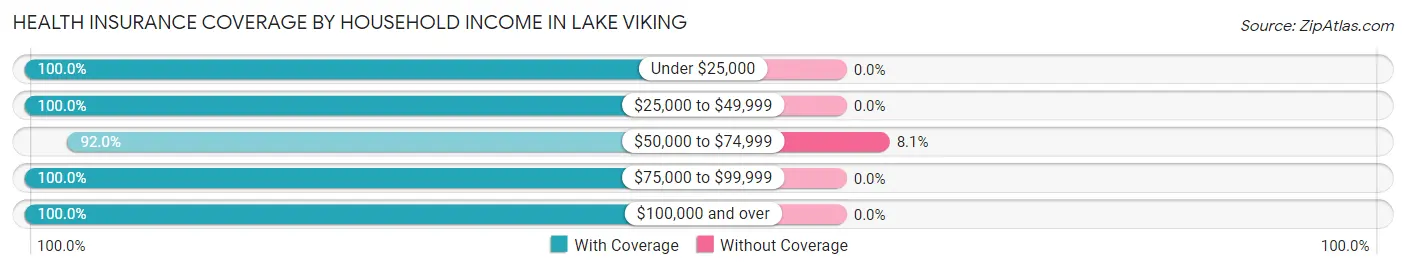
| Household Income | With Coverage | Without Coverage |
| Under $25,000 | 44 (100.0%) | 0 (0.0%) |
| $25,000 to $49,999 | 6 (100.0%) | 0 (0.0%) |
| $50,000 to $74,999 | 137 (91.9%) | 12 (8.1%) |
| $75,000 to $99,999 | 77 (100.0%) | 0 (0.0%) |
| $100,000 and over | 127 (100.0%) | 0 (0.0%) |
Public vs Private Health Insurance Coverage by Age in Lake Viking
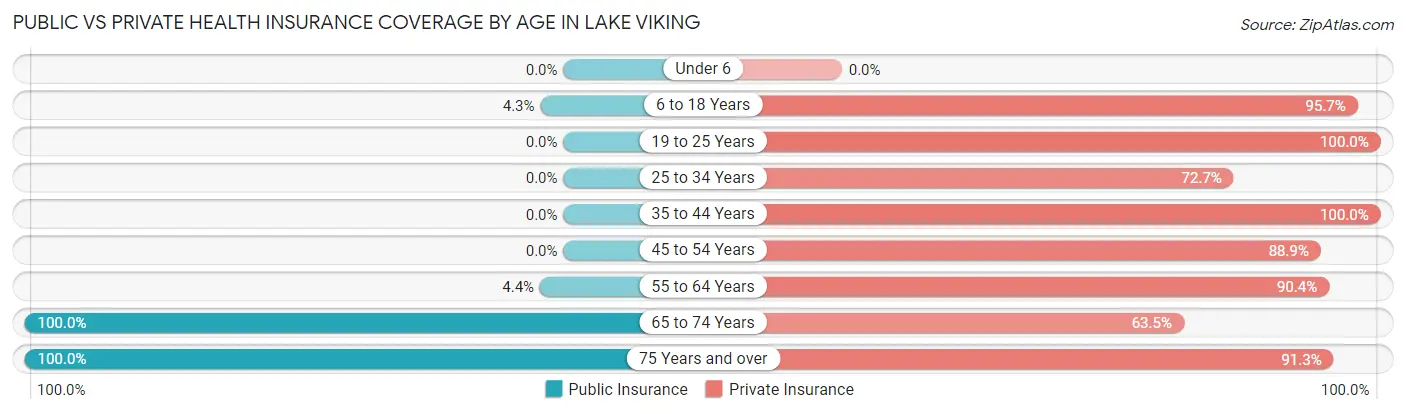
| Age Bracket | Public Insurance | Private Insurance |
| Under 6 | 0 (0.0%) | 0 (0.0%) |
| 6 to 18 Years | 2 (4.3%) | 45 (95.7%) |
| 19 to 25 Years | 0 (0.0%) | 8 (100.0%) |
| 25 to 34 Years | 0 (0.0%) | 8 (72.7%) |
| 35 to 44 Years | 0 (0.0%) | 40 (100.0%) |
| 45 to 54 Years | 0 (0.0%) | 24 (88.9%) |
| 55 to 64 Years | 5 (4.3%) | 104 (90.4%) |
| 65 to 74 Years | 52 (100.0%) | 33 (63.5%) |
| 75 Years and over | 103 (100.0%) | 94 (91.3%) |
| Total | 162 (40.2%) | 356 (88.3%) |
Disability Status by Sex by Age in Lake Viking
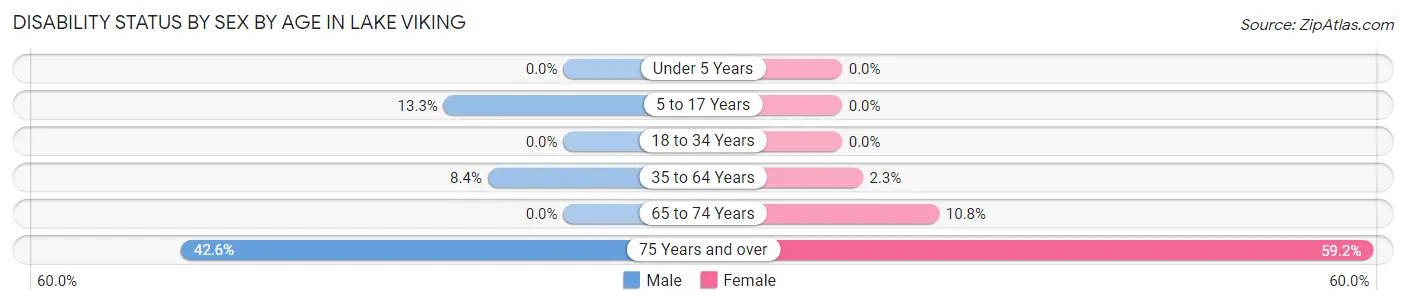
| Age Bracket | Male | Female |
| Under 5 Years | 0 (0.0%) | 0 (0.0%) |
| 5 to 17 Years | 2 (13.3%) | 0 (0.0%) |
| 18 to 34 Years | 0 (0.0%) | 0 (0.0%) |
| 35 to 64 Years | 8 (8.4%) | 2 (2.3%) |
| 65 to 74 Years | 0 (0.0%) | 4 (10.8%) |
| 75 Years and over | 23 (42.6%) | 29 (59.2%) |
Disability Class by Sex by Age in Lake Viking
Disability Class: Hearing Difficulty
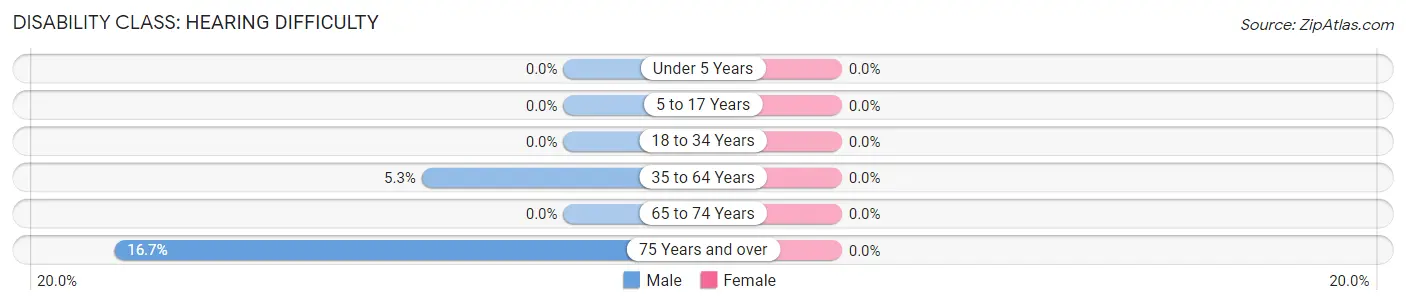
| Age Bracket | Male | Female |
| Under 5 Years | 0 (0.0%) | 0 (0.0%) |
| 5 to 17 Years | 0 (0.0%) | 0 (0.0%) |
| 18 to 34 Years | 0 (0.0%) | 0 (0.0%) |
| 35 to 64 Years | 5 (5.3%) | 0 (0.0%) |
| 65 to 74 Years | 0 (0.0%) | 0 (0.0%) |
| 75 Years and over | 9 (16.7%) | 0 (0.0%) |
Disability Class: Vision Difficulty
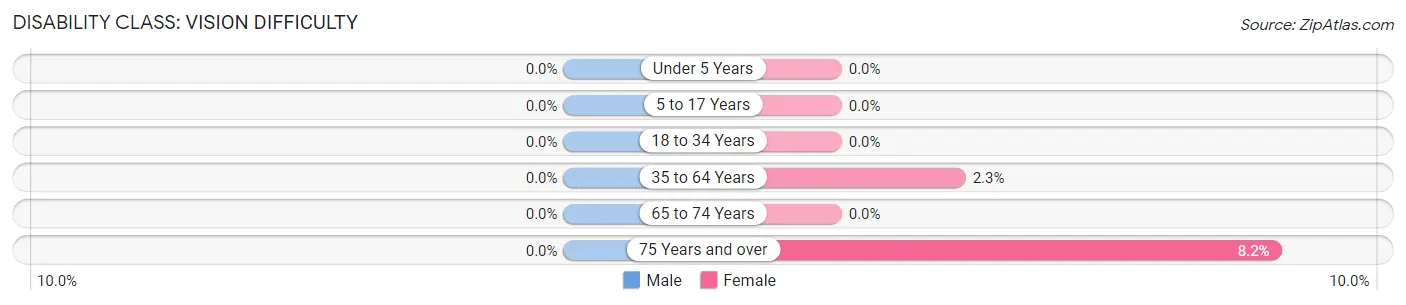
| Age Bracket | Male | Female |
| Under 5 Years | 0 (0.0%) | 0 (0.0%) |
| 5 to 17 Years | 0 (0.0%) | 0 (0.0%) |
| 18 to 34 Years | 0 (0.0%) | 0 (0.0%) |
| 35 to 64 Years | 0 (0.0%) | 2 (2.3%) |
| 65 to 74 Years | 0 (0.0%) | 0 (0.0%) |
| 75 Years and over | 0 (0.0%) | 4 (8.2%) |
Disability Class: Cognitive Difficulty
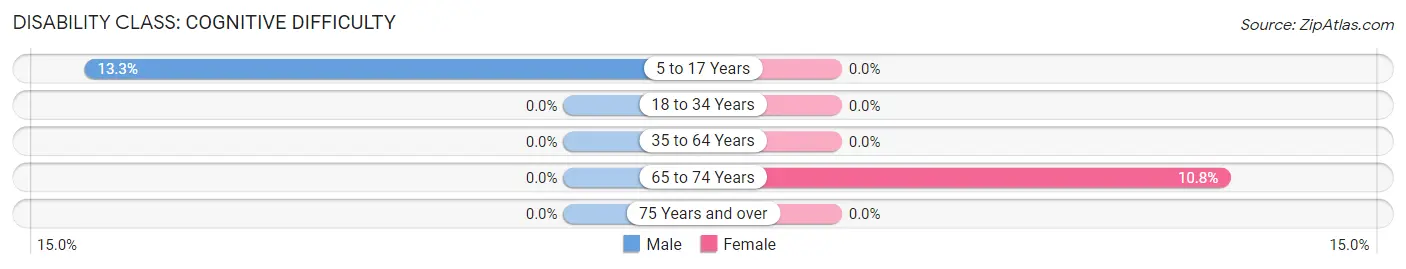
| Age Bracket | Male | Female |
| 5 to 17 Years | 2 (13.3%) | 0 (0.0%) |
| 18 to 34 Years | 0 (0.0%) | 0 (0.0%) |
| 35 to 64 Years | 0 (0.0%) | 0 (0.0%) |
| 65 to 74 Years | 0 (0.0%) | 4 (10.8%) |
| 75 Years and over | 0 (0.0%) | 0 (0.0%) |
Disability Class: Ambulatory Difficulty
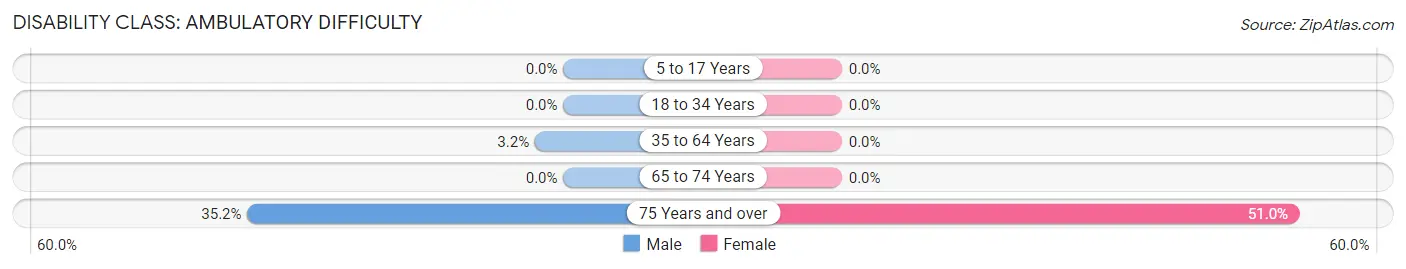
| Age Bracket | Male | Female |
| 5 to 17 Years | 0 (0.0%) | 0 (0.0%) |
| 18 to 34 Years | 0 (0.0%) | 0 (0.0%) |
| 35 to 64 Years | 3 (3.2%) | 0 (0.0%) |
| 65 to 74 Years | 0 (0.0%) | 0 (0.0%) |
| 75 Years and over | 19 (35.2%) | 25 (51.0%) |
Disability Class: Self-Care Difficulty
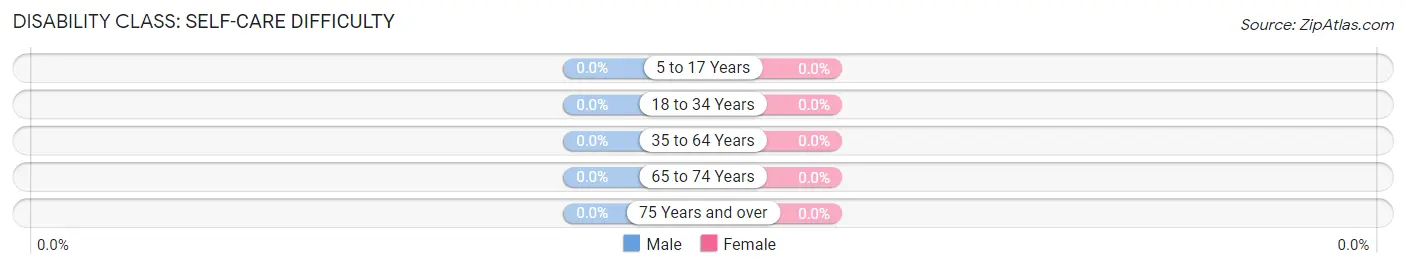
| Age Bracket | Male | Female |
| 5 to 17 Years | 0 (0.0%) | 0 (0.0%) |
| 18 to 34 Years | 0 (0.0%) | 0 (0.0%) |
| 35 to 64 Years | 0 (0.0%) | 0 (0.0%) |
| 65 to 74 Years | 0 (0.0%) | 0 (0.0%) |
| 75 Years and over | 0 (0.0%) | 0 (0.0%) |
Technology Access in Lake Viking
Computing Device Access in Lake Viking
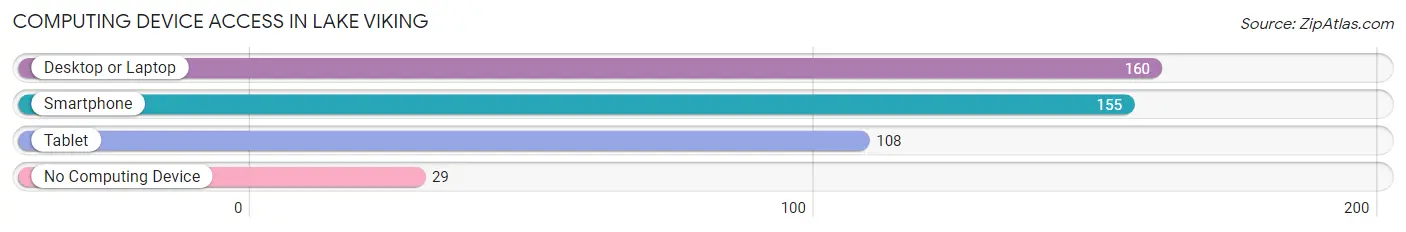
| Device Type | # Households | % Households |
| Desktop or Laptop | 160 | 80.4% |
| Smartphone | 155 | 77.9% |
| Tablet | 108 | 54.3% |
| No Computing Device | 29 | 14.6% |
| Total | 199 | 100.0% |
Internet Access in Lake Viking
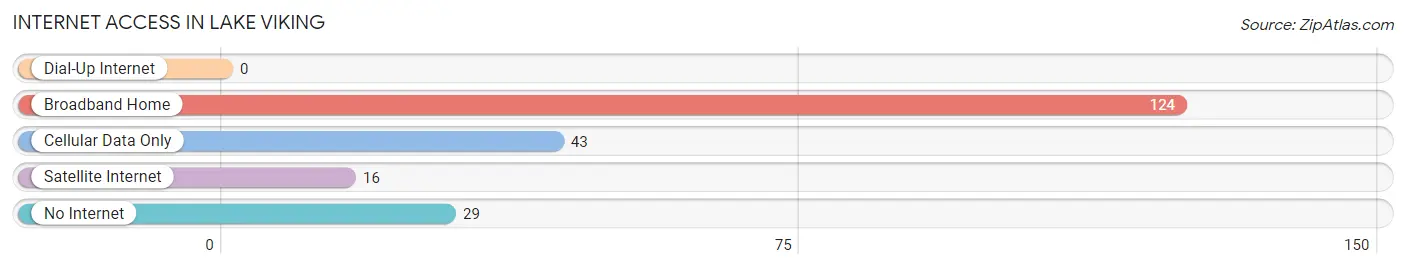
| Internet Type | # Households | % Households |
| Dial-Up Internet | 0 | 0.0% |
| Broadband Home | 124 | 62.3% |
| Cellular Data Only | 43 | 21.6% |
| Satellite Internet | 16 | 8.0% |
| No Internet | 29 | 14.6% |
| Total | 199 | 100.0% |
Lake Viking Summary
History
Lake Viking is a small unincorporated community located in Daviess County, Missouri. It is situated on the banks of the Lake Viking, a man-made lake created in the early 1970s. The lake was created by the damming of the Grand River, and the community was established shortly after.
The area was first settled in the early 1800s by a group of settlers from Kentucky. The settlers were attracted to the area due to its abundance of natural resources, including timber and fertile soil. The settlers established a small farming community and named it after the nearby lake.
The community grew slowly over the years, and by the early 1900s, it had become a popular destination for vacationers. The lake was a popular spot for fishing, swimming, and boating, and the area was known for its beautiful scenery.
In the late 1960s, the lake was dammed to create a larger lake, and the community of Lake Viking was established shortly after. The lake was stocked with fish, and the area quickly became a popular destination for fishing and recreational activities.
Geography
Lake Viking is located in the northwest corner of Daviess County, Missouri. It is situated on the banks of the Lake Viking, a man-made lake created in the early 1970s. The lake is approximately 1,000 acres in size and is surrounded by rolling hills and wooded areas.
The area is known for its beautiful scenery and is a popular destination for fishing, swimming, and boating. The lake is stocked with a variety of fish, including bass, catfish, and crappie.
Economy
The economy of Lake Viking is largely based on tourism and recreation. The lake is a popular destination for fishing, swimming, and boating, and the area is known for its beautiful scenery.
The area also has a few small businesses, including a convenience store, a restaurant, and a marina. The marina offers boat rentals, fishing supplies, and other services.
Demographics
As of the 2010 census, the population of Lake Viking was 1,072. The population is predominantly white (97.2%) and the median age is 44. The median household income is $45,000 and the median home value is $150,000.
The area is served by the Daviess County School District, which includes two elementary schools, one middle school, and one high school. The area is also home to a few churches, including the Lake Viking Church of Christ and the Lake Viking Baptist Church.
Conclusion
Lake Viking is a small unincorporated community located in Daviess County, Missouri. It is situated on the banks of the Lake Viking, a man-made lake created in the early 1970s. The area is known for its beautiful scenery and is a popular destination for fishing, swimming, and boating. The economy of the area is largely based on tourism and recreation, and the population is predominantly white. The area is served by the Daviess County School District and is home to a few churches.
Common Questions
What is Per Capita Income in Lake Viking?
Per Capita income in Lake Viking is $49,093.
What is the Median Family Income in Lake Viking?
Median Family Income in Lake Viking is $71,563.
What is the Median Household income in Lake Viking?
Median Household Income in Lake Viking is $68,125.
What is Income or Wage Gap in Lake Viking?
Income or Wage Gap in Lake Viking is 32.5%.
Women in Lake Viking earn 67.5 cents for every dollar earned by a man.
What is Family Income Deficit in Lake Viking?
Family Income Deficit in Lake Viking is $9,073.
Families that are below poverty line in Lake Viking earn $9,073 less on average than the poverty threshold level.
What is Inequality or Gini Index in Lake Viking?
Inequality or Gini Index in Lake Viking is 0.48.
What is the Total Population of Lake Viking?
Total Population of Lake Viking is 403.
What is the Total Male Population of Lake Viking?
Total Male Population of Lake Viking is 193.
What is the Total Female Population of Lake Viking?
Total Female Population of Lake Viking is 210.
What is the Ratio of Males per 100 Females in Lake Viking?
There are 91.90 Males per 100 Females in Lake Viking.
What is the Ratio of Females per 100 Males in Lake Viking?
There are 108.81 Females per 100 Males in Lake Viking.
What is the Median Population Age in Lake Viking?
Median Population Age in Lake Viking is 61.5 Years.
What is the Average Family Size in Lake Viking
Average Family Size in Lake Viking is 2.4 People.
What is the Average Household Size in Lake Viking
Average Household Size in Lake Viking is 2.0 People.
How Large is the Labor Force in Lake Viking?
There are 185 People in the Labor Forcein in Lake Viking.
What is the Percentage of People in the Labor Force in Lake Viking?
50.3% of People are in the Labor Force in Lake Viking.
What is the Unemployment Rate in Lake Viking?
Unemployment Rate in Lake Viking is 1.6%.