Edesville, MD Map & Demographics
Edesville Map
Edesville Overview
$35,261
PER CAPITA INCOME
0.16
INEQUALITY / GINI INDEX
33
TOTAL POPULATION
23
MALE POPULATION
10
FEMALE POPULATION
230.00
MALES / 100 FEMALES
43.48
FEMALES / 100 MALES
44.9
MEDIAN AGE
1.9
AVG FAMILY SIZE
1.9
AVG HOUSEHOLD SIZE
26
LABOR FORCE [ PEOPLE ]
78.8%
PERCENT IN LABOR FORCE
30.8%
UNEMPLOYMENT RATE
Income in Edesville
Income Overview in Edesville
| Characteristic | Number | Measure |
| Per Capita Income | 33 | $35,261 |
| Median Family Income | 17 | $0 |
| Mean Family Income | 17 | $0 |
| Median Household Income | 17 | $0 |
| Mean Household Income | 17 | $0 |
| Income Deficit | 17 | $0 |
| Wage / Income Gap (%) | 33 | 0.00% |
| Wage / Income Gap ($) | 33 | 100.00¢ per $1 |
| Gini / Inequality Index | 33 | 0.16 |
Earnings by Sex in Edesville
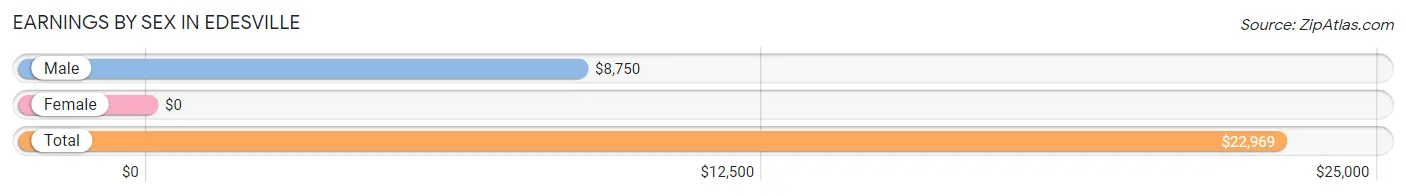
| Sex | Number | Average Earnings |
| Male | 23 (69.7%) | $8,750 |
| Female | 10 (30.3%) | $0 |
| Total | 33 (100.0%) | $22,969 |
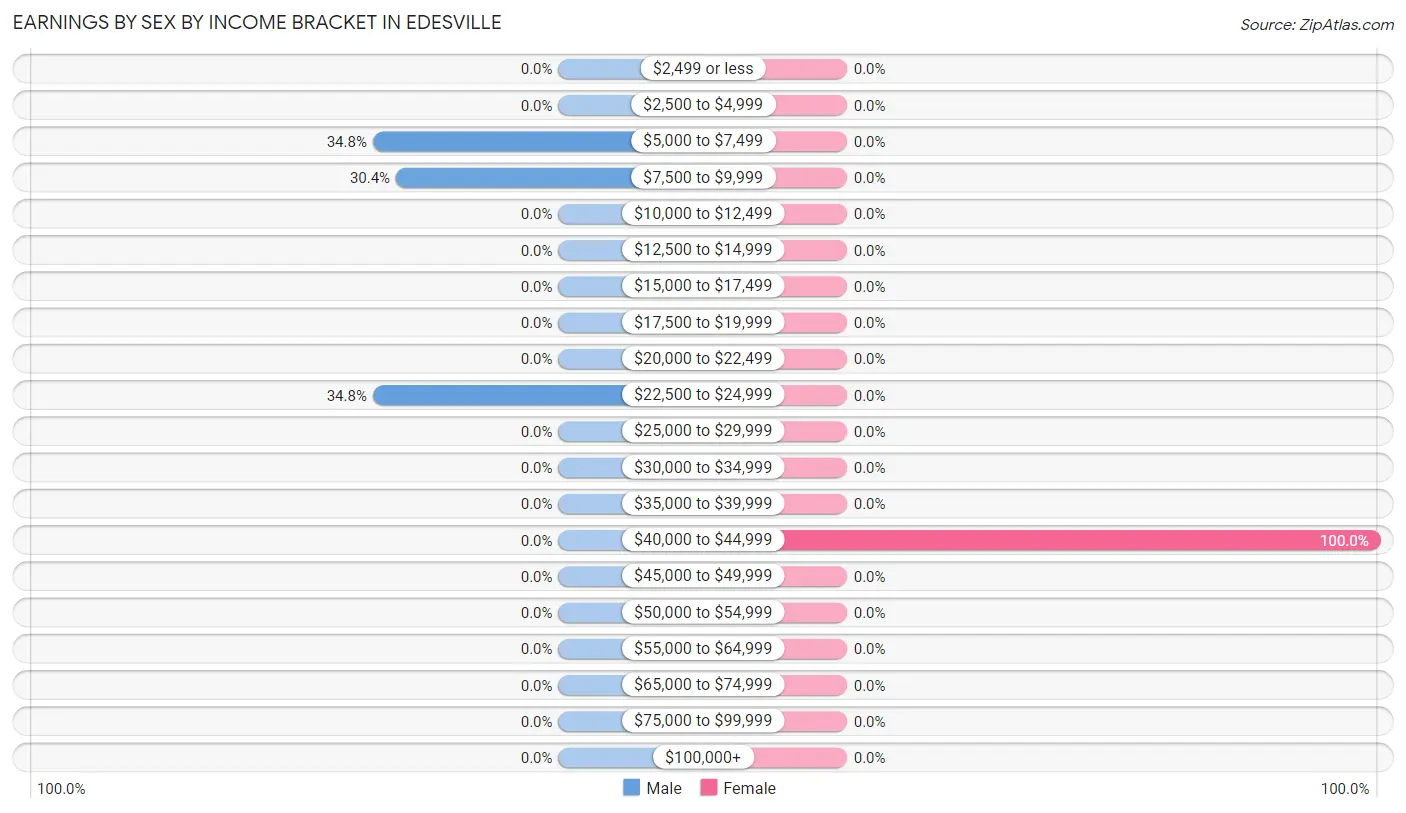
Earnings by Sex by Income Bracket in Edesville
The most common earnings brackets in Edesville are $5,000 to $7,499 for men (8 | 34.8%) and $40,000 to $44,999 for women (10 | 100.0%).
| Income | Male | Female |
| $2,499 or less | 0 (0.0%) | 0 (0.0%) |
| $2,500 to $4,999 | 0 (0.0%) | 0 (0.0%) |
| $5,000 to $7,499 | 8 (34.8%) | 0 (0.0%) |
| $7,500 to $9,999 | 7 (30.4%) | 0 (0.0%) |
| $10,000 to $12,499 | 0 (0.0%) | 0 (0.0%) |
| $12,500 to $14,999 | 0 (0.0%) | 0 (0.0%) |
| $15,000 to $17,499 | 0 (0.0%) | 0 (0.0%) |
| $17,500 to $19,999 | 0 (0.0%) | 0 (0.0%) |
| $20,000 to $22,499 | 0 (0.0%) | 0 (0.0%) |
| $22,500 to $24,999 | 8 (34.8%) | 0 (0.0%) |
| $25,000 to $29,999 | 0 (0.0%) | 0 (0.0%) |
| $30,000 to $34,999 | 0 (0.0%) | 0 (0.0%) |
| $35,000 to $39,999 | 0 (0.0%) | 0 (0.0%) |
| $40,000 to $44,999 | 0 (0.0%) | 10 (100.0%) |
| $45,000 to $49,999 | 0 (0.0%) | 0 (0.0%) |
| $50,000 to $54,999 | 0 (0.0%) | 0 (0.0%) |
| $55,000 to $64,999 | 0 (0.0%) | 0 (0.0%) |
| $65,000 to $74,999 | 0 (0.0%) | 0 (0.0%) |
| $75,000 to $99,999 | 0 (0.0%) | 0 (0.0%) |
| $100,000+ | 0 (0.0%) | 0 (0.0%) |
| Total | 23 (100.0%) | 10 (100.0%) |
Earnings by Sex by Educational Attainment in Edesville
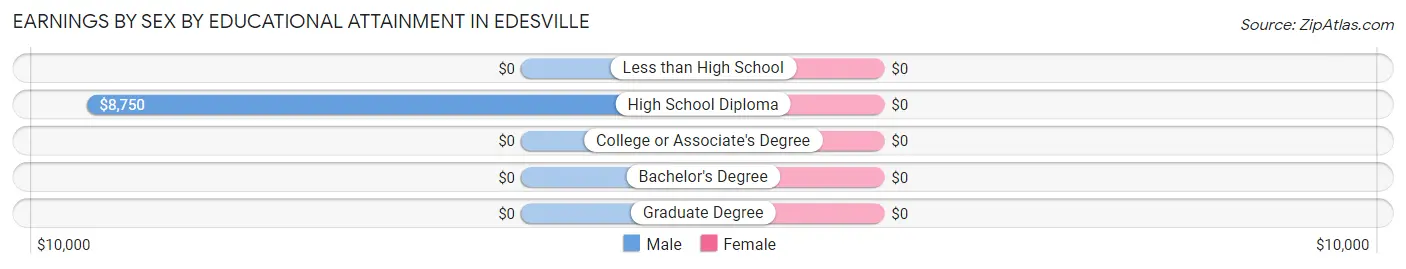
| Educational Attainment | Male Income | Female Income |
| Less than High School | - | - |
| High School Diploma | $8,750 | $0 |
| College or Associate's Degree | - | - |
| Bachelor's Degree | - | - |
| Graduate Degree | - | - |
| Total | $8,750 | $0 |
Family Income in Edesville
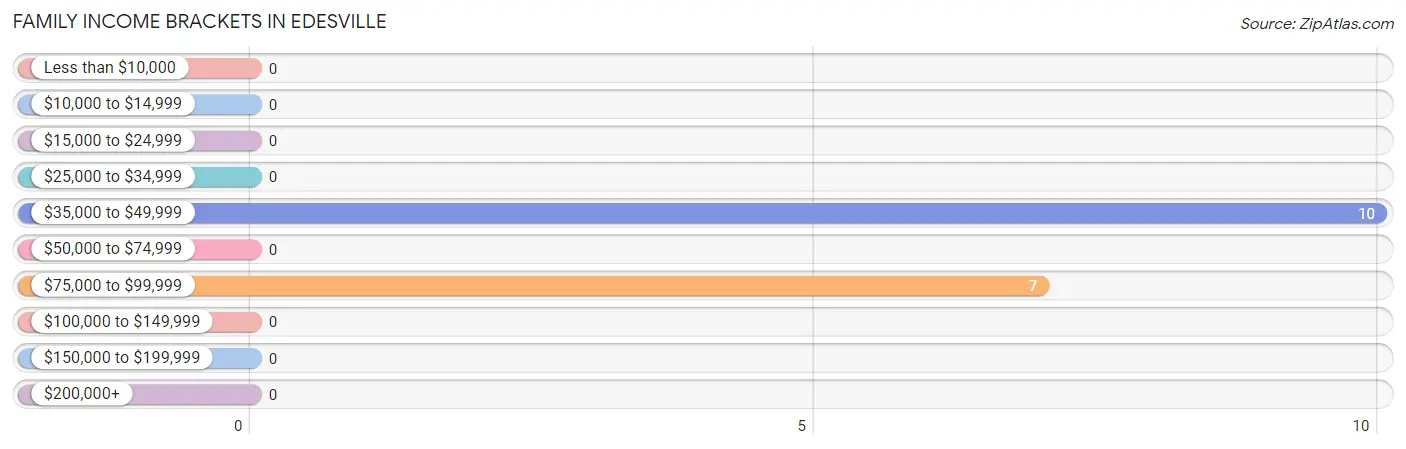
Family Income Brackets in Edesville
According to the Edesville family income data, there are 10 families falling into the $35,000 to $49,999 income range, which is the most common income bracket and makes up 58.8% of all families.
| Income Bracket | # Families | % Families |
| Less than $10,000 | 0 | 0.0% |
| $10,000 to $14,999 | 0 | 0.0% |
| $15,000 to $24,999 | 0 | 0.0% |
| $25,000 to $34,999 | 0 | 0.0% |
| $35,000 to $49,999 | 10 | 58.8% |
| $50,000 to $74,999 | 0 | 0.0% |
| $75,000 to $99,999 | 7 | 41.2% |
| $100,000 to $149,999 | 0 | 0.0% |
| $150,000 to $199,999 | 0 | 0.0% |
| $200,000+ | 0 | 0.0% |
Family Income by Famaliy Size in Edesville
| Income Bracket | # Families | Median Income |
| 2-Person Families | 17 (100.0%) | $0 |
| 3-Person Families | 0 (0.0%) | $0 |
| 4-Person Families | 0 (0.0%) | $0 |
| 5-Person Families | 0 (0.0%) | $0 |
| 6-Person Families | 0 (0.0%) | $0 |
| 7+ Person Families | 0 (0.0%) | $0 |
| Total | 17 (100.0%) | $0 |
Family Income by Number of Earners in Edesville
| Number of Earners | # Families | Median Income |
| No Earners | 0 (0.0%) | $0 |
| 1 Earner | 0 (0.0%) | $0 |
| 2 Earners | 17 (100.0%) | $0 |
| 3+ Earners | 0 (0.0%) | $0 |
| Total | 17 (100.0%) | $0 |
Household Income in Edesville
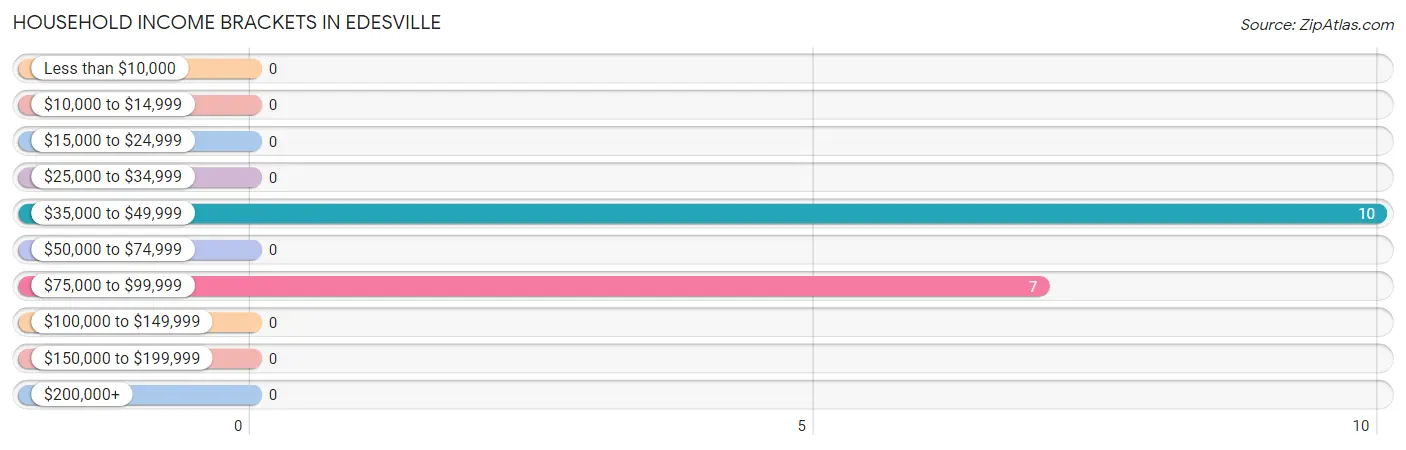
Household Income Brackets in Edesville
With 10 households falling in the category, the $35,000 to $49,999 income range is the most frequent in Edesville, accounting for 58.8% of all households.
| Income Bracket | # Households | % Households |
| Less than $10,000 | 0 | 0.0% |
| $10,000 to $14,999 | 0 | 0.0% |
| $15,000 to $24,999 | 0 | 0.0% |
| $25,000 to $34,999 | 0 | 0.0% |
| $35,000 to $49,999 | 10 | 58.8% |
| $50,000 to $74,999 | 0 | 0.0% |
| $75,000 to $99,999 | 7 | 41.2% |
| $100,000 to $149,999 | 0 | 0.0% |
| $150,000 to $199,999 | 0 | 0.0% |
| $200,000+ | 0 | 0.0% |
Household Income by Householder Age in Edesville
| Income Bracket | # Households | Median Income |
| 15 to 24 Years | 0 (0.0%) | $0 |
| 25 to 44 Years | 10 (58.8%) | $0 |
| 45 to 64 Years | 0 (0.0%) | $0 |
| 65+ Years | 7 (41.2%) | $0 |
| Total | 17 (100.0%) | $0 |
Poverty in Edesville
Income Below Poverty by Sex and Age in Edesville
| Age Bracket | Male | Female |
| Under 5 Years | 0 (0.0%) | 0 (0.0%) |
| 5 Years | 0 (0.0%) | 0 (0.0%) |
| 6 to 11 Years | 0 (0.0%) | 0 (0.0%) |
| 12 to 14 Years | 0 (0.0%) | 0 (0.0%) |
| 15 Years | 0 (0.0%) | 0 (0.0%) |
| 16 and 17 Years | 0 (0.0%) | 0 (0.0%) |
| 18 to 24 Years | 0 (0.0%) | 0 (0.0%) |
| 25 to 34 Years | 0 (0.0%) | 0 (0.0%) |
| 35 to 44 Years | 0 (0.0%) | 0 (0.0%) |
| 45 to 54 Years | 0 (0.0%) | 0 (0.0%) |
| 55 to 64 Years | 0 (0.0%) | 0 (0.0%) |
| 65 to 74 Years | 0 (0.0%) | 0 (0.0%) |
| 75 Years and over | 0 (0.0%) | 0 (0.0%) |
| Total | 0 (0.0%) | 0 (0.0%) |
Income Above Poverty by Sex and Age in Edesville
According to the poverty statistics in Edesville, males aged 35 to 44 years and females aged 35 to 44 years are the age groups that are most secure financially, with 100.0% of males and 100.0% of females in these age groups living above the poverty line.
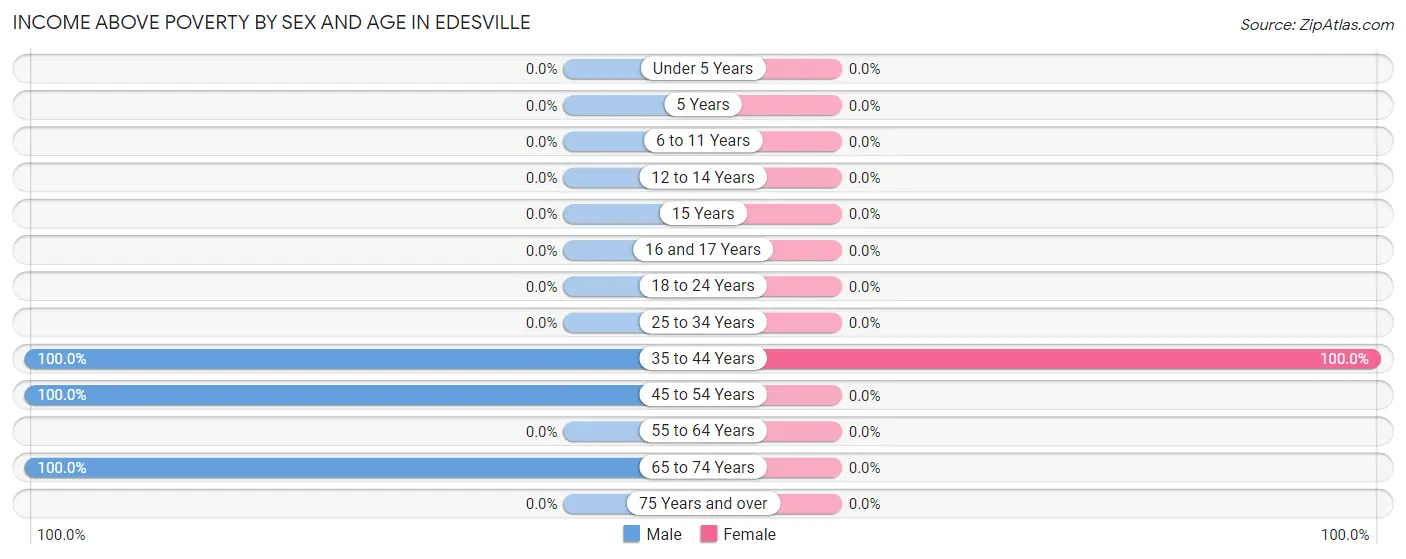
| Age Bracket | Male | Female |
| Under 5 Years | 0 (0.0%) | 0 (0.0%) |
| 5 Years | 0 (0.0%) | 0 (0.0%) |
| 6 to 11 Years | 0 (0.0%) | 0 (0.0%) |
| 12 to 14 Years | 0 (0.0%) | 0 (0.0%) |
| 15 Years | 0 (0.0%) | 0 (0.0%) |
| 16 and 17 Years | 0 (0.0%) | 0 (0.0%) |
| 18 to 24 Years | 0 (0.0%) | 0 (0.0%) |
| 25 to 34 Years | 0 (0.0%) | 0 (0.0%) |
| 35 to 44 Years | 8 (100.0%) | 10 (100.0%) |
| 45 to 54 Years | 8 (100.0%) | 0 (0.0%) |
| 55 to 64 Years | 0 (0.0%) | 0 (0.0%) |
| 65 to 74 Years | 7 (100.0%) | 0 (0.0%) |
| 75 Years and over | 0 (0.0%) | 0 (0.0%) |
| Total | 23 (100.0%) | 10 (100.0%) |
Income Below Poverty Among Married-Couple Families in Edesville
| Children | Above Poverty | Below Poverty |
| No Children | 10 (100.0%) | 0 (0.0%) |
| 1 or 2 Children | 0 (0.0%) | 0 (0.0%) |
| 3 or 4 Children | 0 (0.0%) | 0 (0.0%) |
| 5 or more Children | 0 (0.0%) | 0 (0.0%) |
| Total | 10 (100.0%) | 0 (0.0%) |
Income Below Poverty Among Single-Parent Households in Edesville
| Children | Single Father | Single Mother |
| No Children | 0 (0.0%) | 0 (0.0%) |
| 1 or 2 Children | 0 (0.0%) | 0 (0.0%) |
| 3 or 4 Children | 0 (0.0%) | 0 (0.0%) |
| 5 or more Children | 0 (0.0%) | 0 (0.0%) |
| Total | 0 (0.0%) | 0 (0.0%) |
Income Below Poverty Among Married-Couple vs Single-Parent Households in Edesville
| Children | Married-Couple Families | Single-Parent Households |
| No Children | 0 (0.0%) | 0 (0.0%) |
| 1 or 2 Children | 0 (0.0%) | 0 (0.0%) |
| 3 or 4 Children | 0 (0.0%) | 0 (0.0%) |
| 5 or more Children | 0 (0.0%) | 0 (0.0%) |
| Total | 0 (0.0%) | 0 (0.0%) |
Race in Edesville
The most populous races in Edesville are White / Caucasian (18 | 54.5%), and Black / African American (15 | 45.5%).
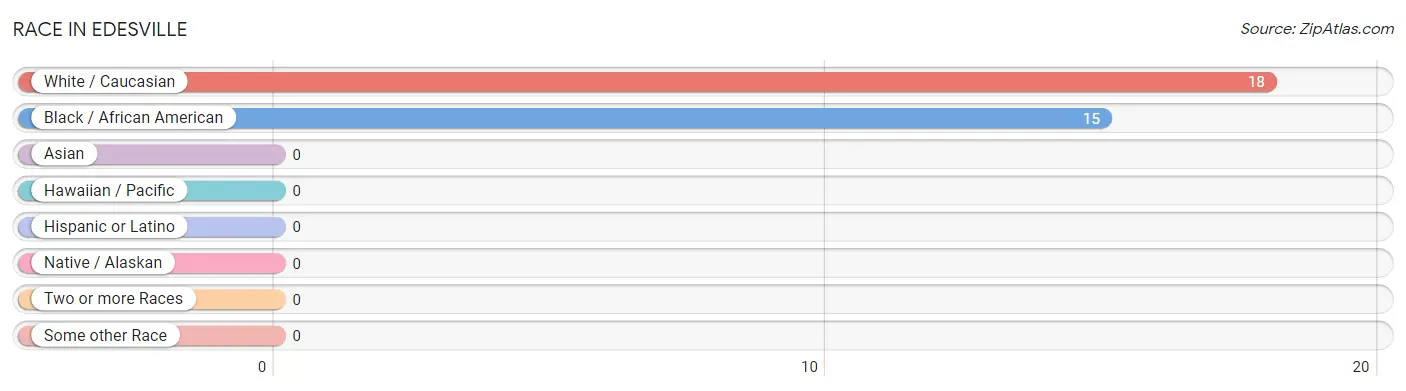
| Race | # Population | % Population |
| Asian | 0 | 0.0% |
| Black / African American | 15 | 45.5% |
| Hawaiian / Pacific | 0 | 0.0% |
| Hispanic or Latino | 0 | 0.0% |
| Native / Alaskan | 0 | 0.0% |
| White / Caucasian | 18 | 54.5% |
| Two or more Races | 0 | 0.0% |
| Some other Race | 0 | 0.0% |
| Total | 33 | 100.0% |
Ancestry in Edesville
The most populous ancestries reported in Edesville are Irish (10 | 30.3%), and Polish (10 | 30.3%), together accounting for 60.6% of all Edesville residents.
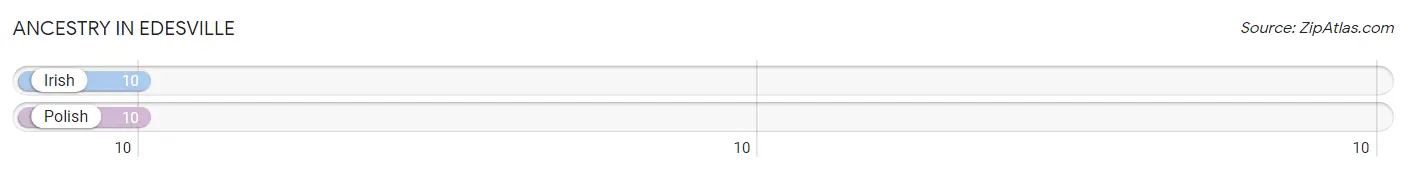
| Ancestry | # Population | % Population |
| Irish | 10 | 30.3% |
| Polish | 10 | 30.3% | View All 2 Rows |
Immigrants in Edesville

| Immigration Origin | # Population | % Population | View All 0 Rows |
Sex and Age in Edesville
Sex and Age in Edesville
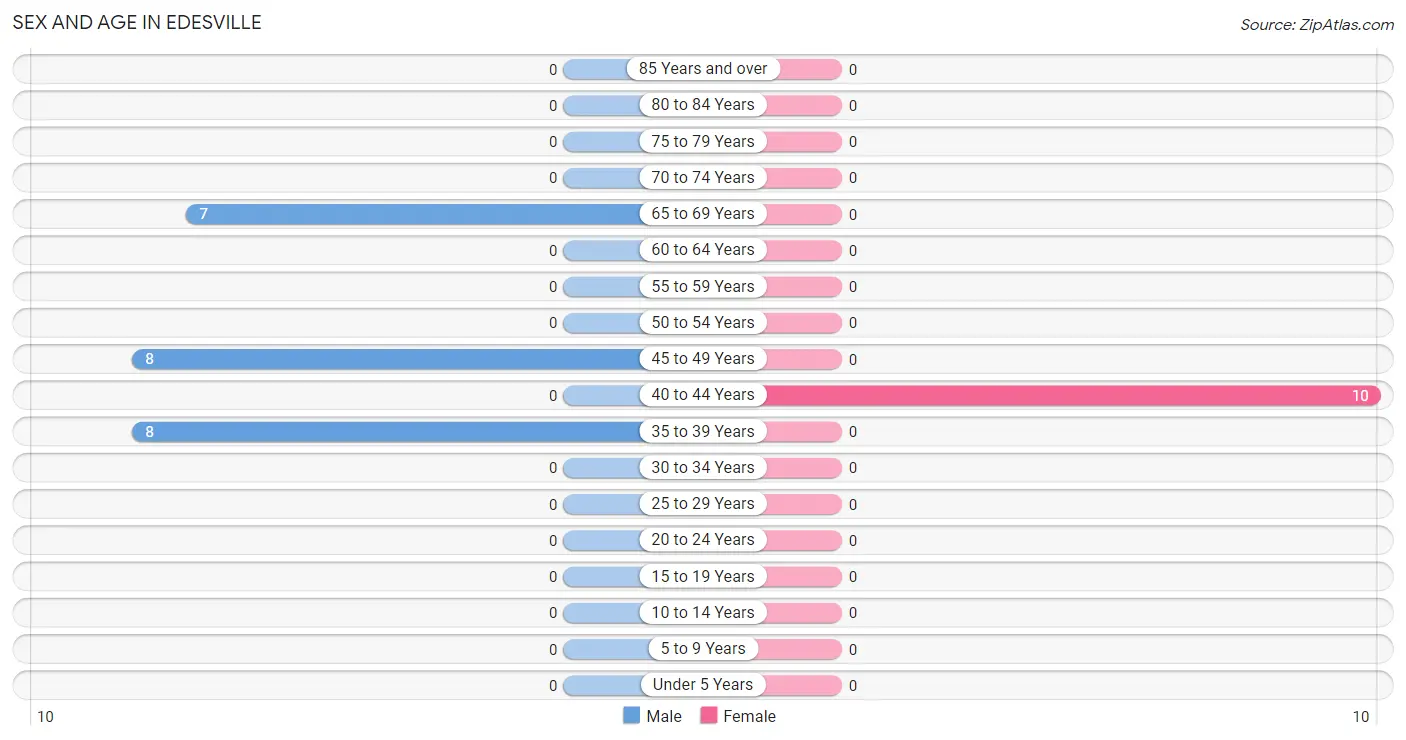
The most populous age groups in Edesville are 35 to 39 Years (8 | 34.8%) for men and 40 to 44 Years (10 | 100.0%) for women.
| Age Bracket | Male | Female |
| Under 5 Years | 0 (0.0%) | 0 (0.0%) |
| 5 to 9 Years | 0 (0.0%) | 0 (0.0%) |
| 10 to 14 Years | 0 (0.0%) | 0 (0.0%) |
| 15 to 19 Years | 0 (0.0%) | 0 (0.0%) |
| 20 to 24 Years | 0 (0.0%) | 0 (0.0%) |
| 25 to 29 Years | 0 (0.0%) | 0 (0.0%) |
| 30 to 34 Years | 0 (0.0%) | 0 (0.0%) |
| 35 to 39 Years | 8 (34.8%) | 0 (0.0%) |
| 40 to 44 Years | 0 (0.0%) | 10 (100.0%) |
| 45 to 49 Years | 8 (34.8%) | 0 (0.0%) |
| 50 to 54 Years | 0 (0.0%) | 0 (0.0%) |
| 55 to 59 Years | 0 (0.0%) | 0 (0.0%) |
| 60 to 64 Years | 0 (0.0%) | 0 (0.0%) |
| 65 to 69 Years | 7 (30.4%) | 0 (0.0%) |
| 70 to 74 Years | 0 (0.0%) | 0 (0.0%) |
| 75 to 79 Years | 0 (0.0%) | 0 (0.0%) |
| 80 to 84 Years | 0 (0.0%) | 0 (0.0%) |
| 85 Years and over | 0 (0.0%) | 0 (0.0%) |
| Total | 23 (100.0%) | 10 (100.0%) |
Families and Households in Edesville
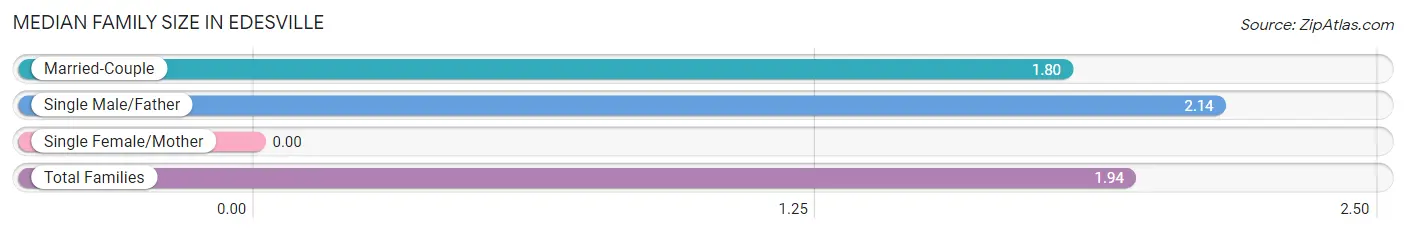
Median Family Size in Edesville
| Family Type | # Families | Family Size |
| Married-Couple | 10 (58.8%) | 1.80 |
| Single Male/Father | 7 (41.2%) | 2.14 |
| Single Female/Mother | 0 (0.0%) | - |
| Total Families | 17 (100.0%) | 1.94 |
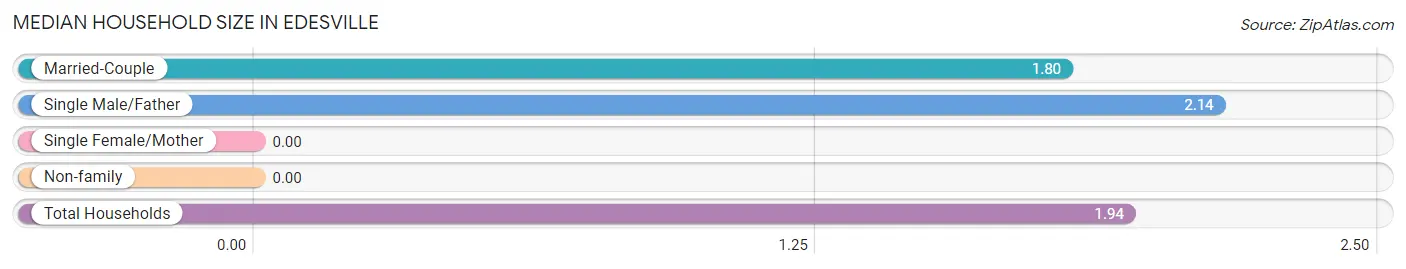
Median Household Size in Edesville
| Household Type | # Households | Household Size |
| Married-Couple | 10 (58.8%) | 1.80 |
| Single Male/Father | 7 (41.2%) | 2.14 |
| Single Female/Mother | 0 (0.0%) | - |
| Non-family | 0 (0.0%) | - |
| Total Households | 17 (100.0%) | 1.94 |
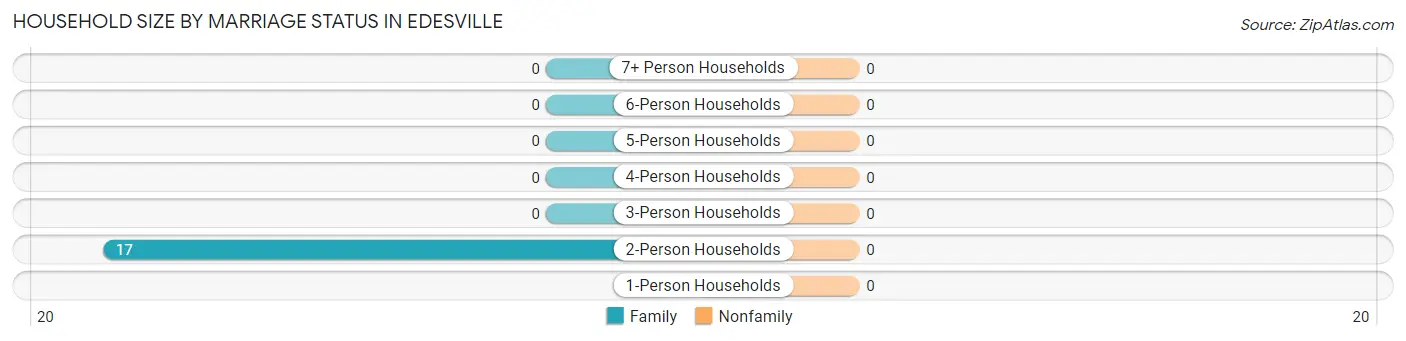
Household Size by Marriage Status in Edesville
| Household Size | Family Households | Nonfamily Households |
| 1-Person Households | - | 0 (0.0%) |
| 2-Person Households | 17 (100.0%) | 0 (0.0%) |
| 3-Person Households | 0 (0.0%) | 0 (0.0%) |
| 4-Person Households | 0 (0.0%) | 0 (0.0%) |
| 5-Person Households | 0 (0.0%) | 0 (0.0%) |
| 6-Person Households | 0 (0.0%) | 0 (0.0%) |
| 7+ Person Households | 0 (0.0%) | 0 (0.0%) |
| Total | 17 (100.0%) | 0 (0.0%) |
Female Fertility in Edesville
Fertility by Age in Edesville
| Age Bracket | Women with Births | Births / 1,000 Women |
| 15 to 19 years | 0 (0.0%) | 0.0 |
| 20 to 34 years | 0 (0.0%) | 0.0 |
| 35 to 50 years | 0 (0.0%) | 0.0 |
| Total | 0 (0.0%) | 0.0 |
Fertility by Age by Marriage Status in Edesville
| Age Bracket | Married | Unmarried |
| 15 to 19 years | 0 (0.0%) | 0 (0.0%) |
| 20 to 34 years | 0 (0.0%) | 0 (0.0%) |
| 35 to 50 years | 0 (0.0%) | 0 (0.0%) |
| Total | 0 (0.0%) | 0 (0.0%) |
Fertility by Education in Edesville
| Educational Attainment | Women with Births | Births / 1,000 Women |
| Less than High School | 0 (0.0%) | 0.0 |
| High School Diploma | 0 (0.0%) | 0.0 |
| College or Associate's Degree | 0 (0.0%) | 0.0 |
| Bachelor's Degree | 0 (0.0%) | 0.0 |
| Graduate Degree | 0 (0.0%) | 0.0 |
| Total | 0 (0.0%) | 0.0 |
Fertility by Education by Marriage Status in Edesville
| Educational Attainment | Married | Unmarried |
| Less than High School | 0 (0.0%) | 0 (0.0%) |
| High School Diploma | 0 (0.0%) | 0 (0.0%) |
| College or Associate's Degree | 0 (0.0%) | 0 (0.0%) |
| Bachelor's Degree | 0 (0.0%) | 0 (0.0%) |
| Graduate Degree | 0 (0.0%) | 0 (0.0%) |
| Total | 0 (0.0%) | 0 (0.0%) |
Employment Characteristics in Edesville
Employment by Class of Employer in Edesville
Among the 18 employed individuals in Edesville, private company employees (10 | 55.6%), and self-employed (not incorporated) (8 | 44.4%) make up the most common classes of employment.
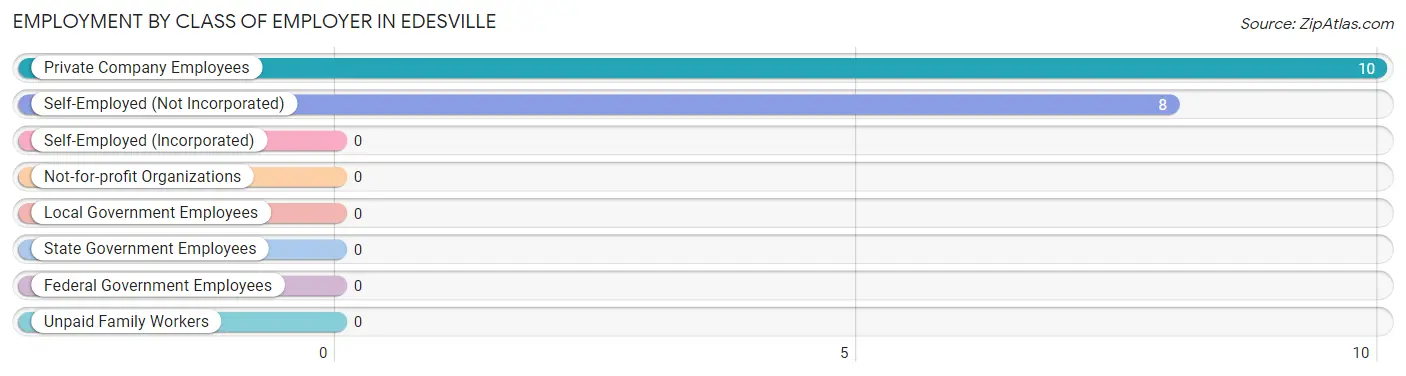
| Employer Class | # Employees | % Employees |
| Private Company Employees | 10 | 55.6% |
| Self-Employed (Incorporated) | 0 | 0.0% |
| Self-Employed (Not Incorporated) | 8 | 44.4% |
| Not-for-profit Organizations | 0 | 0.0% |
| Local Government Employees | 0 | 0.0% |
| State Government Employees | 0 | 0.0% |
| Federal Government Employees | 0 | 0.0% |
| Unpaid Family Workers | 0 | 0.0% |
| Total | 18 | 100.0% |
Employment Status by Age in Edesville
According to the labor force statistics for Edesville, out of the total population over 16 years of age (33), 78.8% or 26 individuals are in the labor force, with 30.8% or 8 of them unemployed. The age group with the highest labor force participation rate is 35 to 44 years, with 100.0% or 18 individuals in the labor force. Within the labor force, the 35 to 44 years age range has the highest percentage of unemployed individuals, with 44.4% or 8 of them being unemployed.
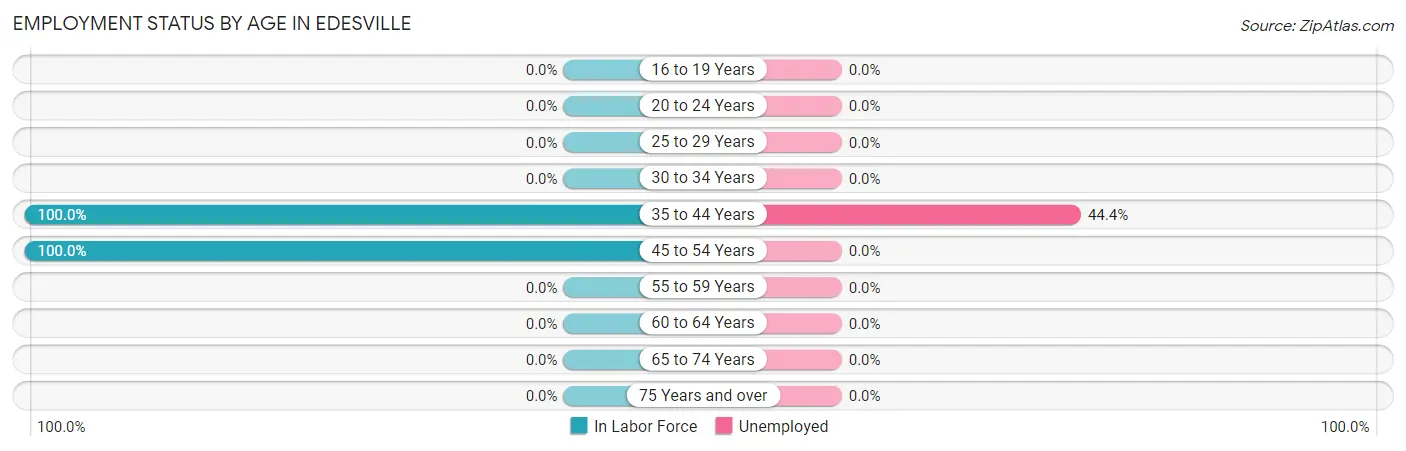
| Age Bracket | In Labor Force | Unemployed |
| 16 to 19 Years | 0 (0.0%) | 0 (0.0%) |
| 20 to 24 Years | 0 (0.0%) | 0 (0.0%) |
| 25 to 29 Years | 0 (0.0%) | 0 (0.0%) |
| 30 to 34 Years | 0 (0.0%) | 0 (0.0%) |
| 35 to 44 Years | 18 (100.0%) | 8 (44.4%) |
| 45 to 54 Years | 8 (100.0%) | 0 (0.0%) |
| 55 to 59 Years | 0 (0.0%) | 0 (0.0%) |
| 60 to 64 Years | 0 (0.0%) | 0 (0.0%) |
| 65 to 74 Years | 0 (0.0%) | 0 (0.0%) |
| 75 Years and over | 0 (0.0%) | 0 (0.0%) |
| Total | 26 (78.8%) | 8 (30.8%) |
Employment Status by Educational Attainment in Edesville
According to labor force statistics for Edesville, 100.0% of individuals (26) out of the total population between 25 and 64 years of age (26) are in the labor force, with 30.8% or 8 of them being unemployed. The group with the highest labor force participation rate are those with the educational attainment of high school diploma, with 100.0% or 26 individuals in the labor force. Within the labor force, individuals with high school diploma education have the highest percentage of unemployment, with 30.8% or 8 of them being unemployed.
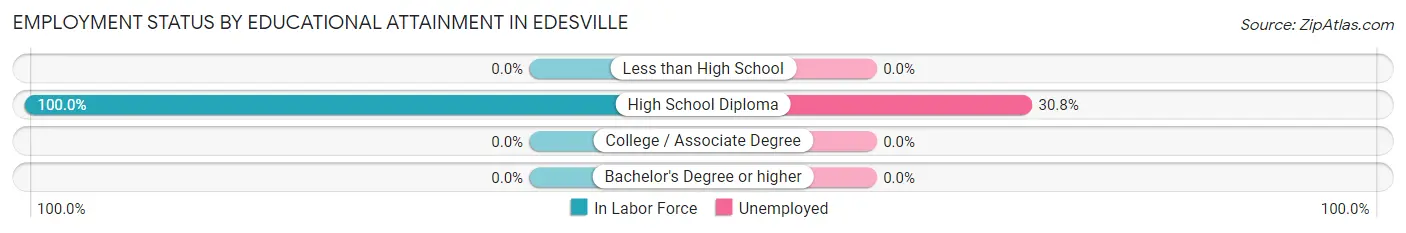
| Educational Attainment | In Labor Force | Unemployed |
| Less than High School | 0 (0.0%) | 0 (0.0%) |
| High School Diploma | 26 (100.0%) | 8 (30.8%) |
| College / Associate Degree | 0 (0.0%) | 0 (0.0%) |
| Bachelor's Degree or higher | 0 (0.0%) | 0 (0.0%) |
| Total | 26 (100.0%) | 8 (30.8%) |
Employment Occupations by Sex in Edesville
Management, Business, Science and Arts Occupations
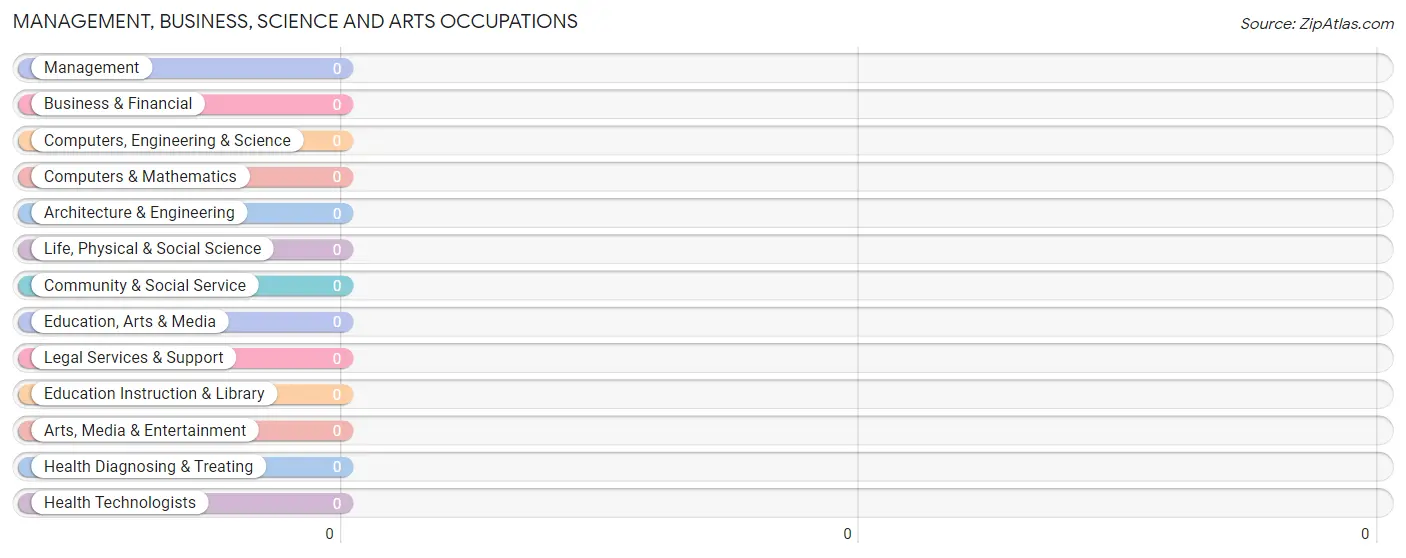
Management, Business, Science and Arts Occupations by Sex
| Occupation | Male | Female |
| Management | 0 (0.0%) | 0 (0.0%) |
| Business & Financial | 0 (0.0%) | 0 (0.0%) |
| Computers, Engineering & Science | 0 (0.0%) | 0 (0.0%) |
| Computers & Mathematics | 0 (0.0%) | 0 (0.0%) |
| Architecture & Engineering | 0 (0.0%) | 0 (0.0%) |
| Life, Physical & Social Science | 0 (0.0%) | 0 (0.0%) |
| Community & Social Service | 0 (0.0%) | 0 (0.0%) |
| Education, Arts & Media | 0 (0.0%) | 0 (0.0%) |
| Legal Services & Support | 0 (0.0%) | 0 (0.0%) |
| Education Instruction & Library | 0 (0.0%) | 0 (0.0%) |
| Arts, Media & Entertainment | 0 (0.0%) | 0 (0.0%) |
| Health Diagnosing & Treating | 0 (0.0%) | 0 (0.0%) |
| Health Technologists | 0 (0.0%) | 0 (0.0%) |
| Total (Category) | 0 (0.0%) | 0 (0.0%) |
| Total (Overall) | 8 (44.4%) | 10 (55.6%) |
Services Occupations
The most common Services occupations in Edesville are , and Healthcare Support (18 | 100.0%).
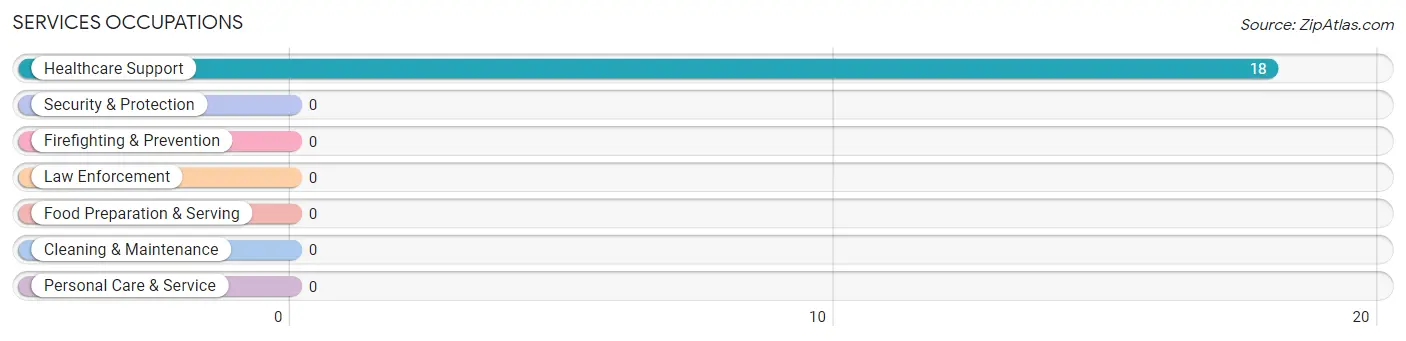
Services Occupations by Sex
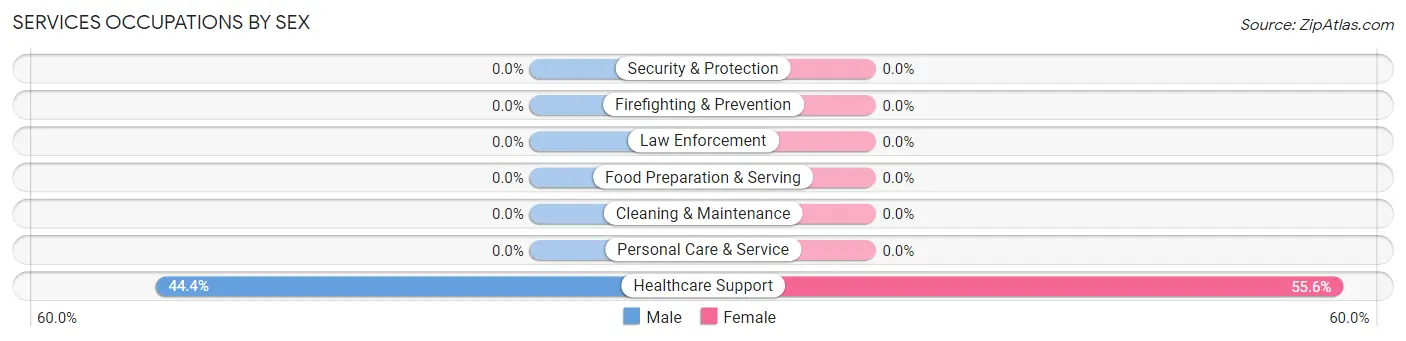
| Occupation | Male | Female |
| Healthcare Support | 8 (44.4%) | 10 (55.6%) |
| Security & Protection | 0 (0.0%) | 0 (0.0%) |
| Firefighting & Prevention | 0 (0.0%) | 0 (0.0%) |
| Law Enforcement | 0 (0.0%) | 0 (0.0%) |
| Food Preparation & Serving | 0 (0.0%) | 0 (0.0%) |
| Cleaning & Maintenance | 0 (0.0%) | 0 (0.0%) |
| Personal Care & Service | 0 (0.0%) | 0 (0.0%) |
| Total (Category) | 8 (44.4%) | 10 (55.6%) |
| Total (Overall) | 8 (44.4%) | 10 (55.6%) |
Sales and Office Occupations
Sales and Office Occupations by Sex
| Occupation | Male | Female |
| Sales & Related | 0 (0.0%) | 0 (0.0%) |
| Office & Administration | 0 (0.0%) | 0 (0.0%) |
| Total (Category) | 0 (0.0%) | 0 (0.0%) |
| Total (Overall) | 8 (44.4%) | 10 (55.6%) |
Natural Resources, Construction and Maintenance Occupations

Natural Resources, Construction and Maintenance Occupations by Sex
| Occupation | Male | Female |
| Farming, Fishing & Forestry | 0 (0.0%) | 0 (0.0%) |
| Construction & Extraction | 0 (0.0%) | 0 (0.0%) |
| Installation, Maintenance & Repair | 0 (0.0%) | 0 (0.0%) |
| Total (Category) | 0 (0.0%) | 0 (0.0%) |
| Total (Overall) | 8 (44.4%) | 10 (55.6%) |
Production, Transportation and Moving Occupations
Production, Transportation and Moving Occupations by Sex
| Occupation | Male | Female |
| Production | 0 (0.0%) | 0 (0.0%) |
| Transportation | 0 (0.0%) | 0 (0.0%) |
| Material Moving | 0 (0.0%) | 0 (0.0%) |
| Total (Category) | 0 (0.0%) | 0 (0.0%) |
| Total (Overall) | 8 (44.4%) | 10 (55.6%) |
Employment Industries by Sex in Edesville
Employment Industries in Edesville
The major employment industries in Edesville include , and Health Care & Social Assistance (10 | 55.6%).
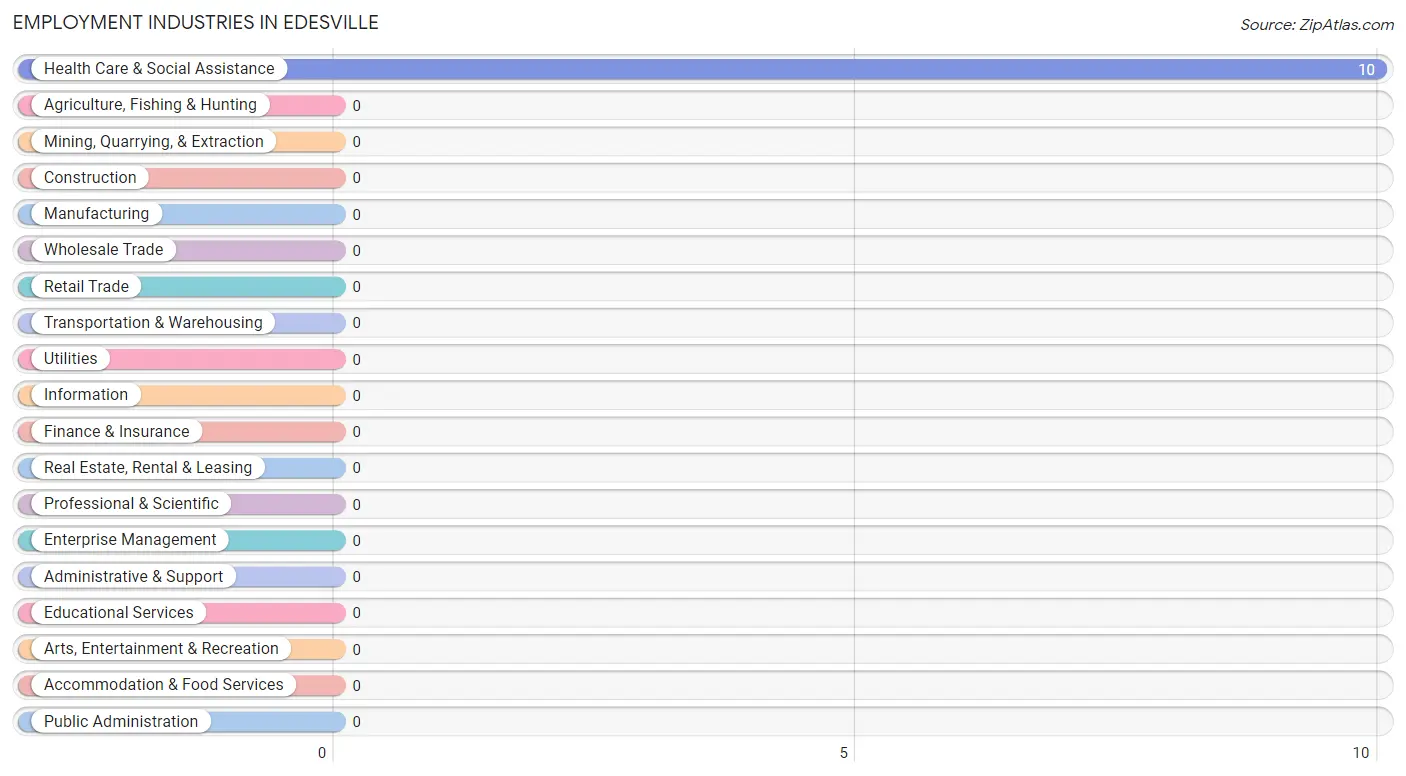
Employment Industries by Sex in Edesville
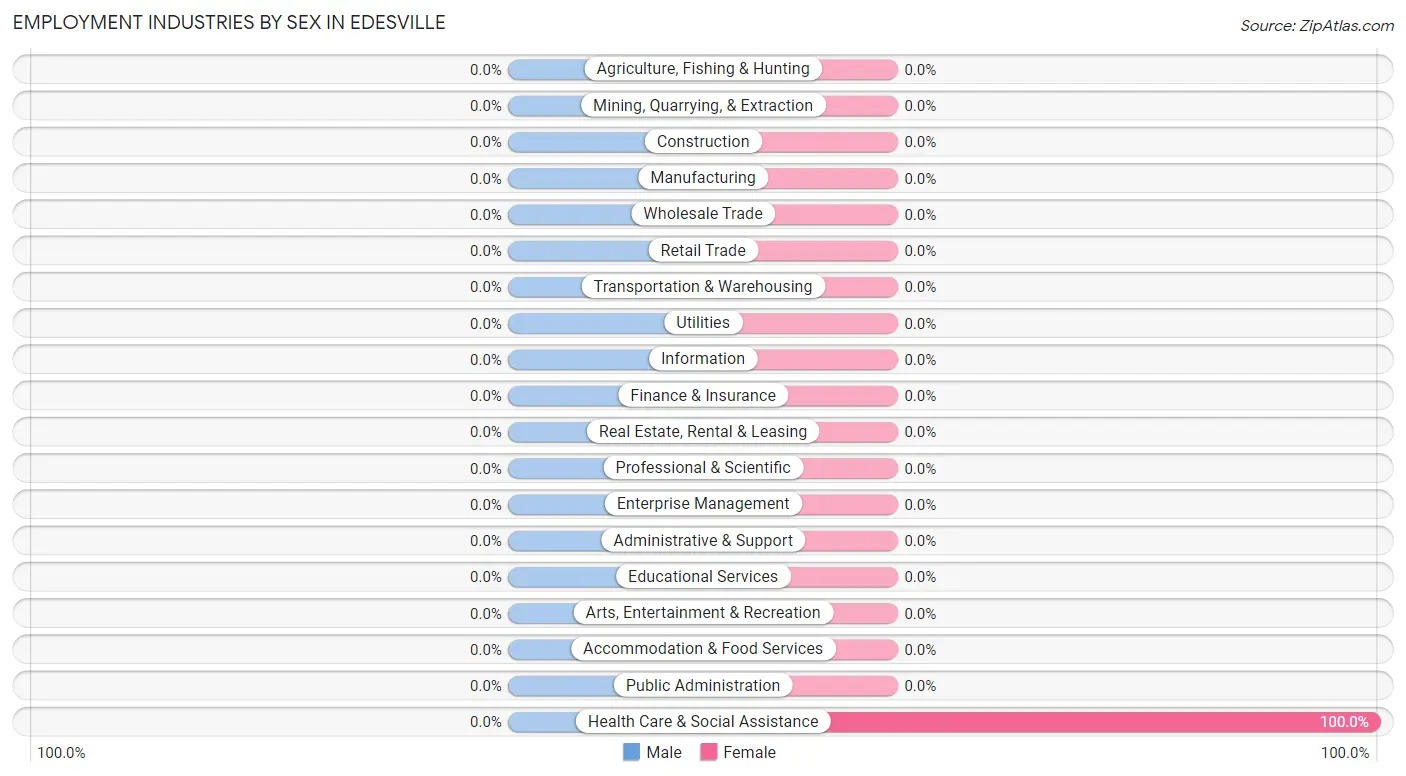
| Industry | Male | Female |
| Agriculture, Fishing & Hunting | 0 (0.0%) | 0 (0.0%) |
| Mining, Quarrying, & Extraction | 0 (0.0%) | 0 (0.0%) |
| Construction | 0 (0.0%) | 0 (0.0%) |
| Manufacturing | 0 (0.0%) | 0 (0.0%) |
| Wholesale Trade | 0 (0.0%) | 0 (0.0%) |
| Retail Trade | 0 (0.0%) | 0 (0.0%) |
| Transportation & Warehousing | 0 (0.0%) | 0 (0.0%) |
| Utilities | 0 (0.0%) | 0 (0.0%) |
| Information | 0 (0.0%) | 0 (0.0%) |
| Finance & Insurance | 0 (0.0%) | 0 (0.0%) |
| Real Estate, Rental & Leasing | 0 (0.0%) | 0 (0.0%) |
| Professional & Scientific | 0 (0.0%) | 0 (0.0%) |
| Enterprise Management | 0 (0.0%) | 0 (0.0%) |
| Administrative & Support | 0 (0.0%) | 0 (0.0%) |
| Educational Services | 0 (0.0%) | 0 (0.0%) |
| Health Care & Social Assistance | 0 (0.0%) | 10 (100.0%) |
| Arts, Entertainment & Recreation | 0 (0.0%) | 0 (0.0%) |
| Accommodation & Food Services | 0 (0.0%) | 0 (0.0%) |
| Public Administration | 0 (0.0%) | 0 (0.0%) |
| Total | 8 (44.4%) | 10 (55.6%) |
Education in Edesville
School Enrollment in Edesville
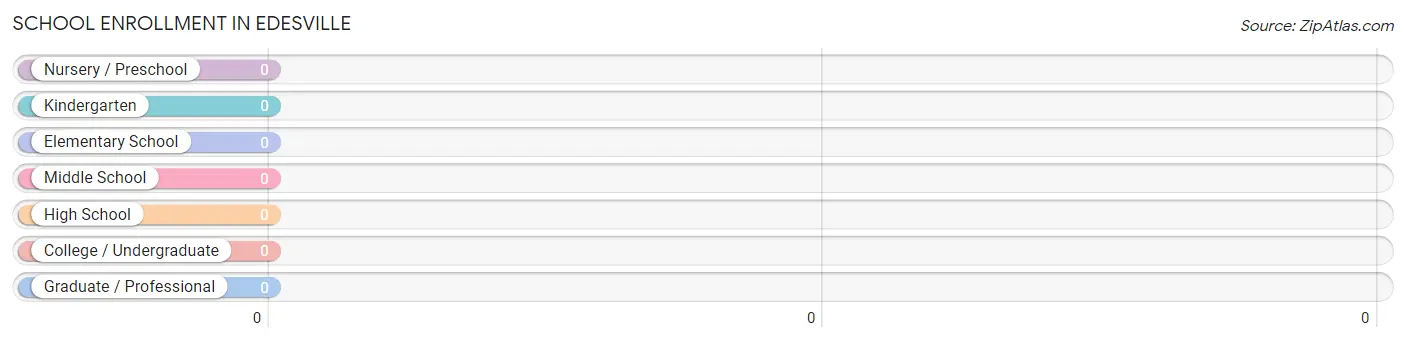
| School Level | # Students | % Students |
| Nursery / Preschool | 0 | 0.0% |
| Kindergarten | 0 | 0.0% |
| Elementary School | 0 | 0.0% |
| Middle School | 0 | 0.0% |
| High School | 0 | 0.0% |
| College / Undergraduate | 0 | 0.0% |
| Graduate / Professional | 0 | 0.0% |
| Total | 0 | 0.0% |
School Enrollment by Age by Funding Source in Edesville
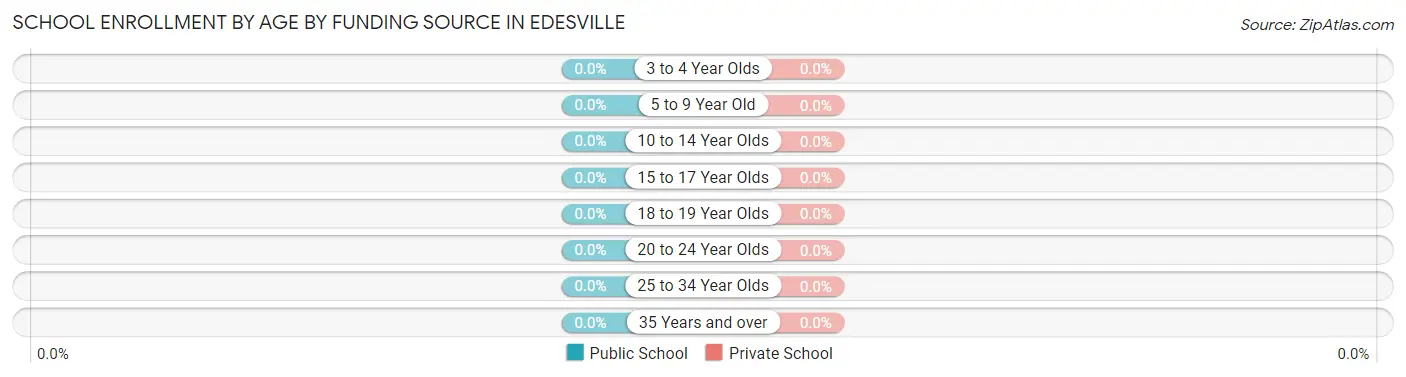
| Age Bracket | Public School | Private School |
| 3 to 4 Year Olds | 0 (0.0%) | 0 (0.0%) |
| 5 to 9 Year Old | 0 (0.0%) | 0 (0.0%) |
| 10 to 14 Year Olds | 0 (0.0%) | 0 (0.0%) |
| 15 to 17 Year Olds | 0 (0.0%) | 0 (0.0%) |
| 18 to 19 Year Olds | 0 (0.0%) | 0 (0.0%) |
| 20 to 24 Year Olds | 0 (0.0%) | 0 (0.0%) |
| 25 to 34 Year Olds | 0 (0.0%) | 0 (0.0%) |
| 35 Years and over | 0 (0.0%) | 0 (0.0%) |
| Total | 0 (0.0%) | 0 (0.0%) |
Educational Attainment by Field of Study in Edesville
| Field of Study | # Graduates | % Graduates |
| Computers & Mathematics | 0 | 0.0% |
| Bio, Nature & Agricultural | 0 | 0.0% |
| Physical & Health Sciences | 0 | 0.0% |
| Psychology | 0 | 0.0% |
| Social Sciences | 0 | 0.0% |
| Engineering | 0 | 0.0% |
| Multidisciplinary Studies | 0 | 0.0% |
| Science & Technology | 0 | 0.0% |
| Business | 0 | 0.0% |
| Education | 0 | 0.0% |
| Literature & Languages | 0 | 0.0% |
| Liberal Arts & History | 0 | 0.0% |
| Visual & Performing Arts | 0 | 0.0% |
| Communications | 0 | 0.0% |
| Arts & Humanities | 0 | 0.0% |
| Total | 0 | 0.0% |
Transportation & Commute in Edesville
Vehicle Availability by Sex in Edesville
The most prevalent vehicle ownership categories in Edesville are males with 2 vehicles (8, accounting for 100.0%) and females with 2 vehicles (10, making up 80.0%).
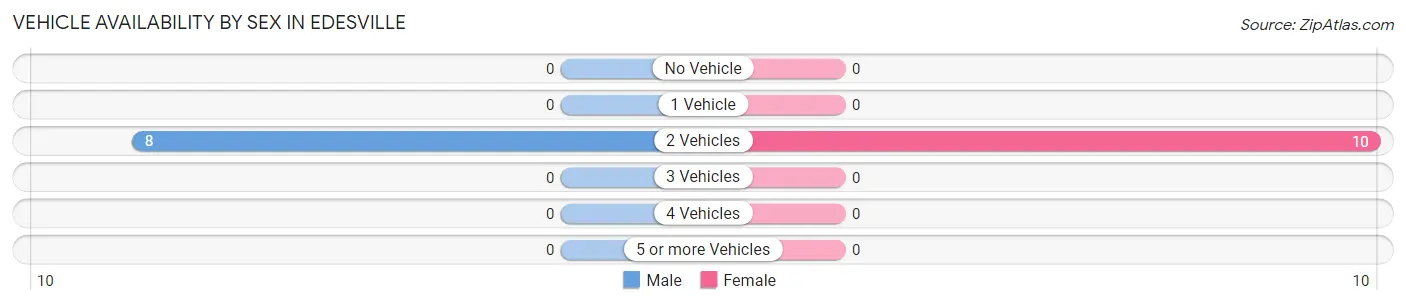
| Vehicles Available | Male | Female |
| No Vehicle | 0 (0.0%) | 0 (0.0%) |
| 1 Vehicle | 0 (0.0%) | 0 (0.0%) |
| 2 Vehicles | 8 (100.0%) | 10 (100.0%) |
| 3 Vehicles | 0 (0.0%) | 0 (0.0%) |
| 4 Vehicles | 0 (0.0%) | 0 (0.0%) |
| 5 or more Vehicles | 0 (0.0%) | 0 (0.0%) |
| Total | 8 (100.0%) | 10 (100.0%) |
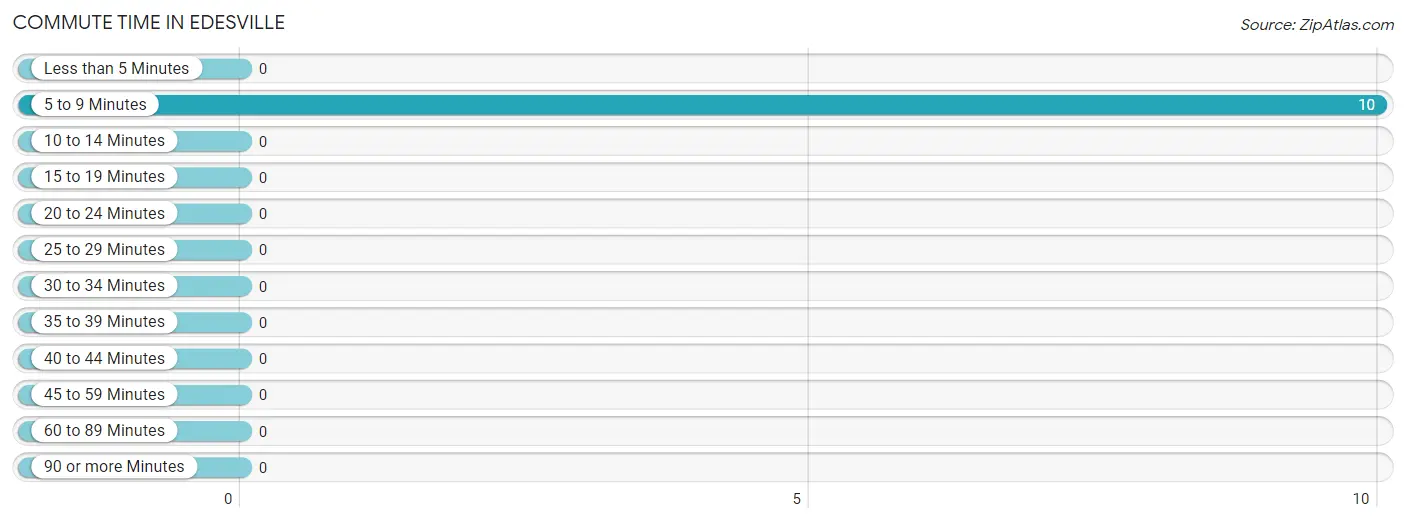
Commute Time in Edesville
The most frequently occuring commute durations in Edesville are 5 to 9 minutes (10 commuters, 100.0%), less than 5 minutes (0 commuters, 0.0%), and 10 to 14 minutes (0 commuters, 0.0%).
| Commute Time | # Commuters | % Commuters |
| Less than 5 Minutes | 0 | 0.0% |
| 5 to 9 Minutes | 10 | 100.0% |
| 10 to 14 Minutes | 0 | 0.0% |
| 15 to 19 Minutes | 0 | 0.0% |
| 20 to 24 Minutes | 0 | 0.0% |
| 25 to 29 Minutes | 0 | 0.0% |
| 30 to 34 Minutes | 0 | 0.0% |
| 35 to 39 Minutes | 0 | 0.0% |
| 40 to 44 Minutes | 0 | 0.0% |
| 45 to 59 Minutes | 0 | 0.0% |
| 60 to 89 Minutes | 0 | 0.0% |
| 90 or more Minutes | 0 | 0.0% |
Commute Time by Sex in Edesville
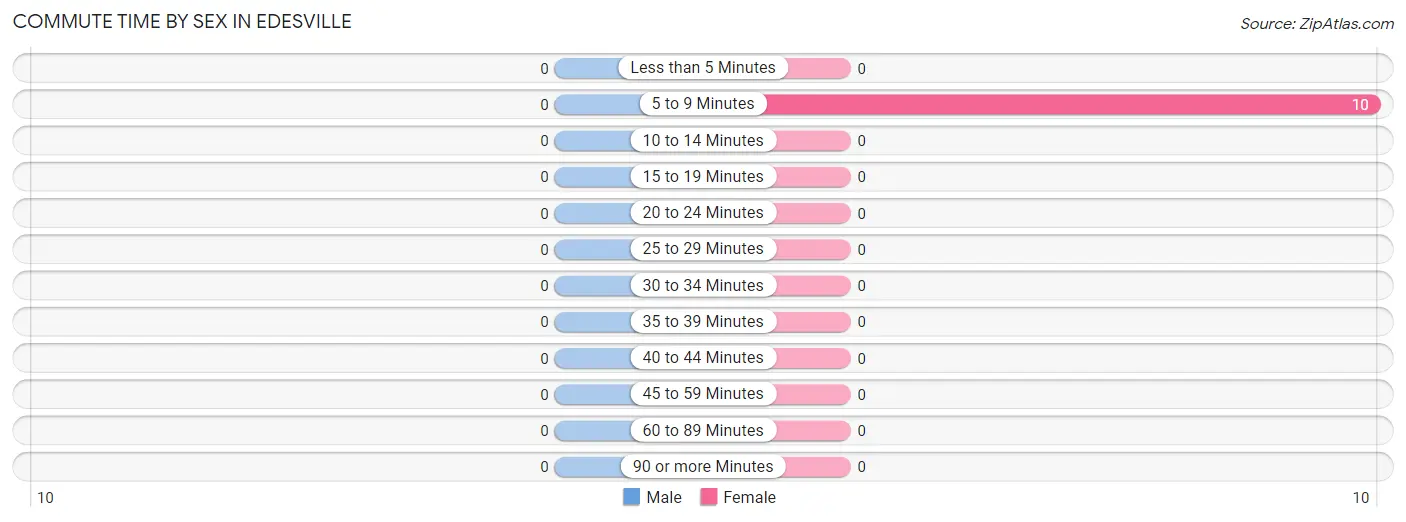
| Commute Time | Male | Female |
| Less than 5 Minutes | 0 (0.0%) | 0 (0.0%) |
| 5 to 9 Minutes | 0 (0.0%) | 10 (100.0%) |
| 10 to 14 Minutes | 0 (0.0%) | 0 (0.0%) |
| 15 to 19 Minutes | 0 (0.0%) | 0 (0.0%) |
| 20 to 24 Minutes | 0 (0.0%) | 0 (0.0%) |
| 25 to 29 Minutes | 0 (0.0%) | 0 (0.0%) |
| 30 to 34 Minutes | 0 (0.0%) | 0 (0.0%) |
| 35 to 39 Minutes | 0 (0.0%) | 0 (0.0%) |
| 40 to 44 Minutes | 0 (0.0%) | 0 (0.0%) |
| 45 to 59 Minutes | 0 (0.0%) | 0 (0.0%) |
| 60 to 89 Minutes | 0 (0.0%) | 0 (0.0%) |
| 90 or more Minutes | 0 (0.0%) | 0 (0.0%) |
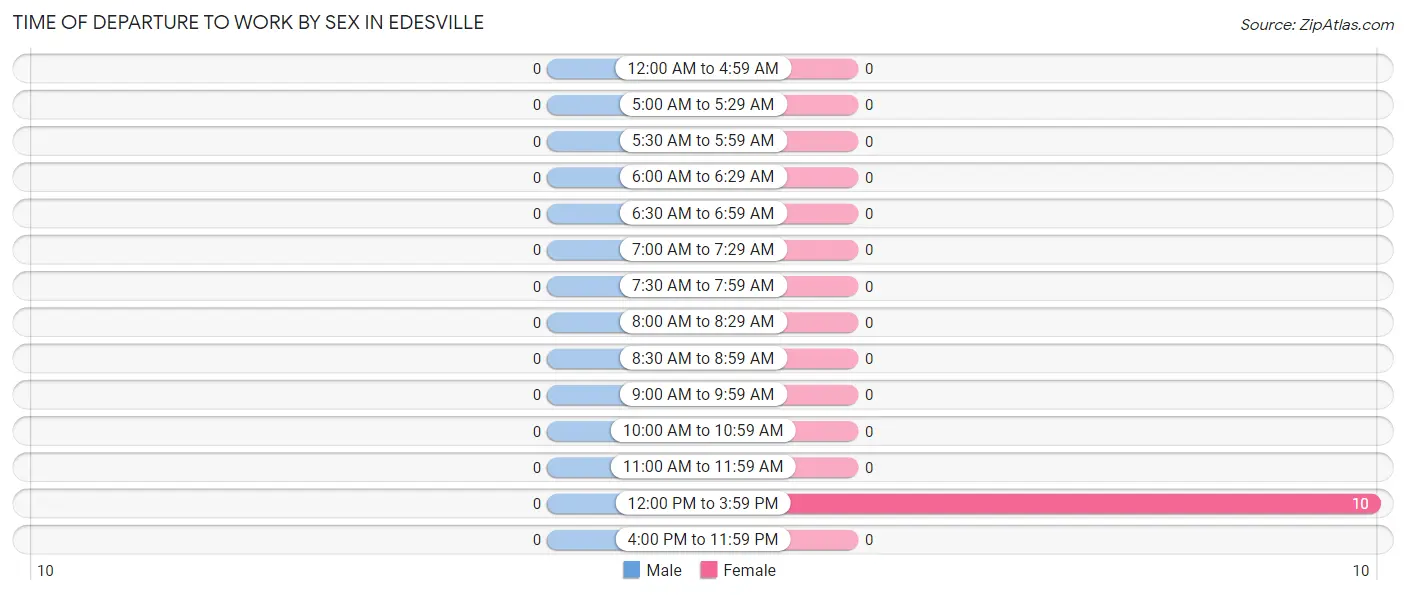
Time of Departure to Work by Sex in Edesville
| Time of Departure | Male | Female |
| 12:00 AM to 4:59 AM | 0 (0.0%) | 0 (0.0%) |
| 5:00 AM to 5:29 AM | 0 (0.0%) | 0 (0.0%) |
| 5:30 AM to 5:59 AM | 0 (0.0%) | 0 (0.0%) |
| 6:00 AM to 6:29 AM | 0 (0.0%) | 0 (0.0%) |
| 6:30 AM to 6:59 AM | 0 (0.0%) | 0 (0.0%) |
| 7:00 AM to 7:29 AM | 0 (0.0%) | 0 (0.0%) |
| 7:30 AM to 7:59 AM | 0 (0.0%) | 0 (0.0%) |
| 8:00 AM to 8:29 AM | 0 (0.0%) | 0 (0.0%) |
| 8:30 AM to 8:59 AM | 0 (0.0%) | 0 (0.0%) |
| 9:00 AM to 9:59 AM | 0 (0.0%) | 0 (0.0%) |
| 10:00 AM to 10:59 AM | 0 (0.0%) | 0 (0.0%) |
| 11:00 AM to 11:59 AM | 0 (0.0%) | 0 (0.0%) |
| 12:00 PM to 3:59 PM | 0 (0.0%) | 10 (100.0%) |
| 4:00 PM to 11:59 PM | 0 (0.0%) | 0 (0.0%) |
| Total | 0 (0.0%) | 10 (100.0%) |
Housing Occupancy in Edesville
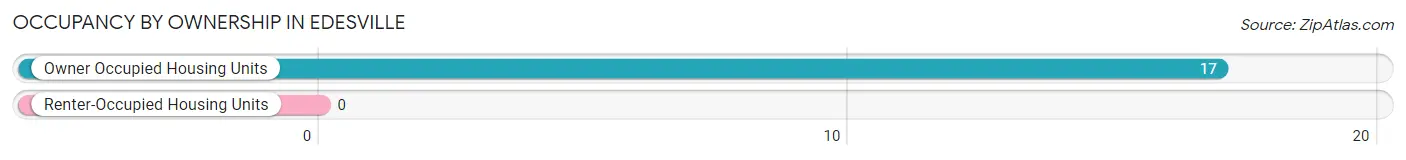
Occupancy by Ownership in Edesville
Of the total 17 dwellings in Edesville, owner-occupied units account for 17 (100.0%), while renter-occupied units make up 0 (0.0%).
| Occupancy | # Housing Units | % Housing Units |
| Owner Occupied Housing Units | 17 | 100.0% |
| Renter-Occupied Housing Units | 0 | 0.0% |
| Total Occupied Housing Units | 17 | 100.0% |
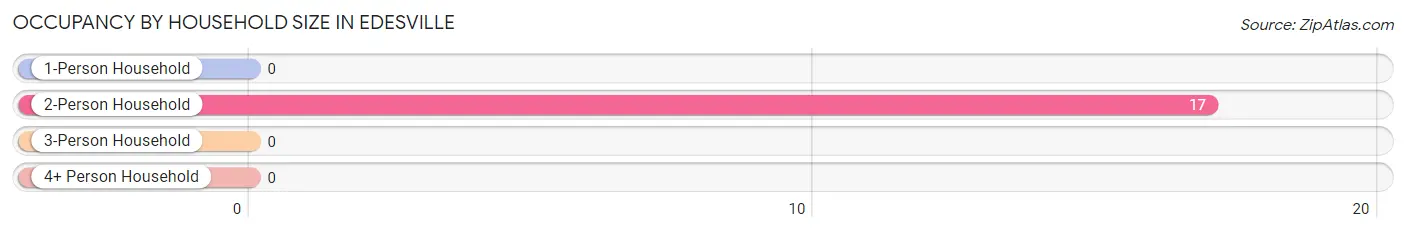
Occupancy by Household Size in Edesville
| Household Size | # Housing Units | % Housing Units |
| 1-Person Household | 0 | 0.0% |
| 2-Person Household | 17 | 100.0% |
| 3-Person Household | 0 | 0.0% |
| 4+ Person Household | 0 | 0.0% |
| Total Housing Units | 17 | 100.0% |
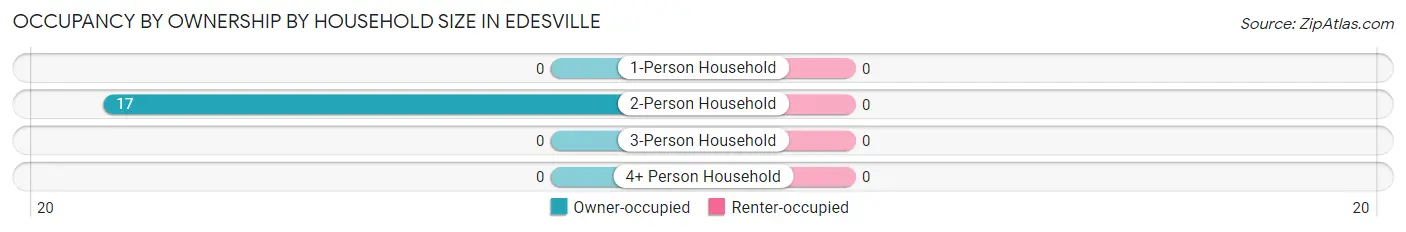
Occupancy by Ownership by Household Size in Edesville
| Household Size | Owner-occupied | Renter-occupied |
| 1-Person Household | 0 (0.0%) | 0 (0.0%) |
| 2-Person Household | 17 (100.0%) | 0 (0.0%) |
| 3-Person Household | 0 (0.0%) | 0 (0.0%) |
| 4+ Person Household | 0 (0.0%) | 0 (0.0%) |
| Total Housing Units | 17 (100.0%) | 0 (0.0%) |
Occupancy by Educational Attainment in Edesville
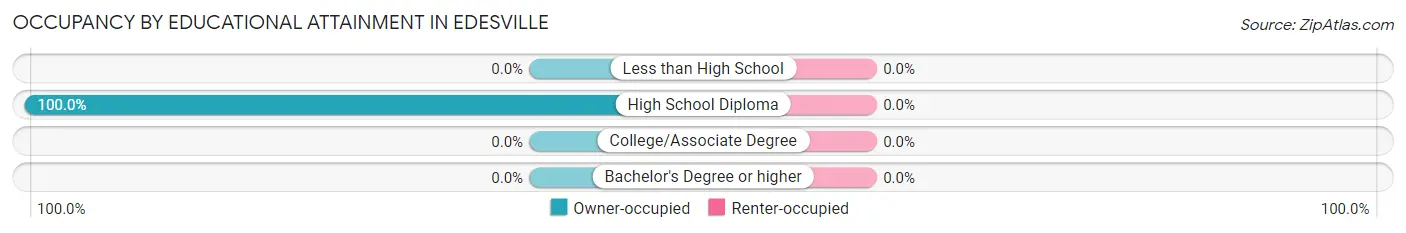
| Household Size | Owner-occupied | Renter-occupied |
| Less than High School | 0 (0.0%) | 0 (0.0%) |
| High School Diploma | 17 (100.0%) | 0 (0.0%) |
| College/Associate Degree | 0 (0.0%) | 0 (0.0%) |
| Bachelor's Degree or higher | 0 (0.0%) | 0 (0.0%) |
Occupancy by Age of Householder in Edesville
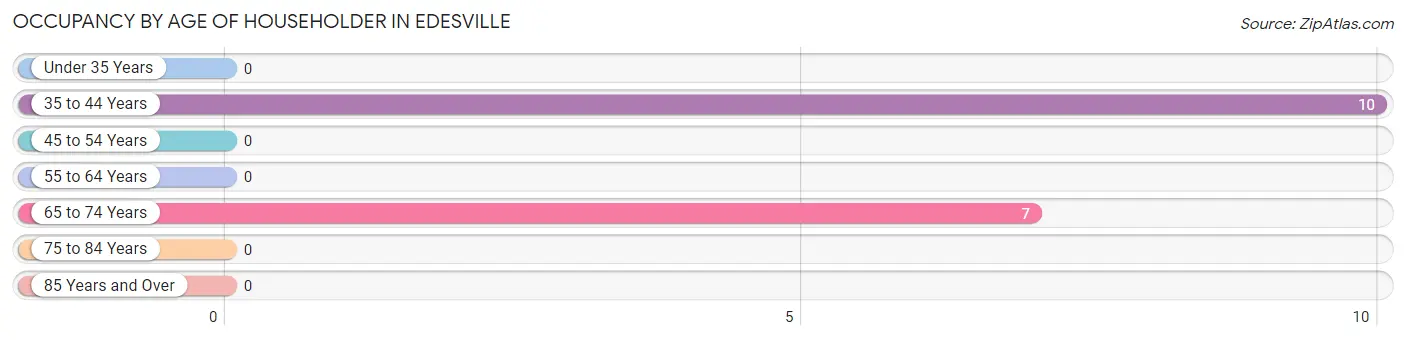
| Age Bracket | # Households | % Households |
| Under 35 Years | 0 | 0.0% |
| 35 to 44 Years | 10 | 58.8% |
| 45 to 54 Years | 0 | 0.0% |
| 55 to 64 Years | 0 | 0.0% |
| 65 to 74 Years | 7 | 41.2% |
| 75 to 84 Years | 0 | 0.0% |
| 85 Years and Over | 0 | 0.0% |
| Total | 17 | 100.0% |
Housing Finances in Edesville
Median Income by Occupancy in Edesville
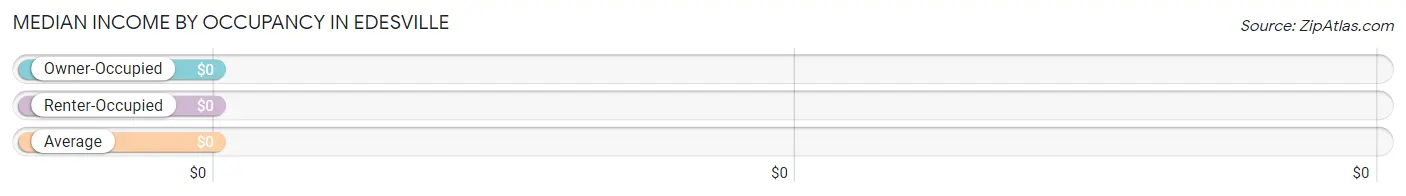
| Occupancy Type | # Households | Median Income |
| Owner-Occupied | 17 (100.0%) | $0 |
| Renter-Occupied | 0 (0.0%) | $0 |
| Average | 17 (100.0%) | $0 |
Occupancy by Householder Income Bracket in Edesville
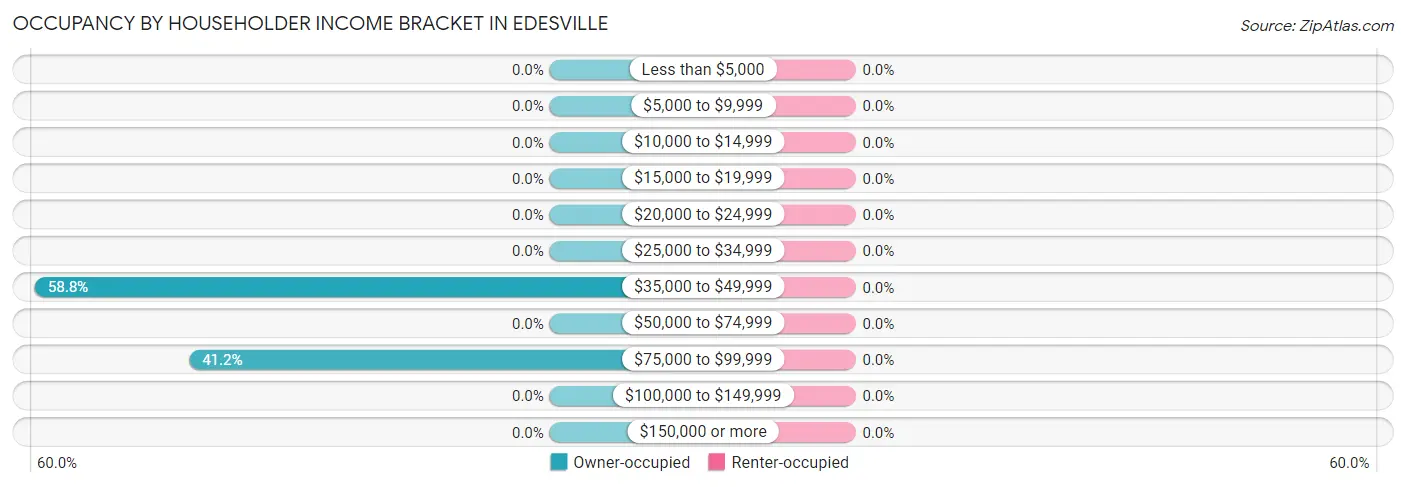
| Income Bracket | Owner-occupied | Renter-occupied |
| Less than $5,000 | 0 (0.0%) | 0 (0.0%) |
| $5,000 to $9,999 | 0 (0.0%) | 0 (0.0%) |
| $10,000 to $14,999 | 0 (0.0%) | 0 (0.0%) |
| $15,000 to $19,999 | 0 (0.0%) | 0 (0.0%) |
| $20,000 to $24,999 | 0 (0.0%) | 0 (0.0%) |
| $25,000 to $34,999 | 0 (0.0%) | 0 (0.0%) |
| $35,000 to $49,999 | 10 (58.8%) | 0 (0.0%) |
| $50,000 to $74,999 | 0 (0.0%) | 0 (0.0%) |
| $75,000 to $99,999 | 7 (41.2%) | 0 (0.0%) |
| $100,000 to $149,999 | 0 (0.0%) | 0 (0.0%) |
| $150,000 or more | 0 (0.0%) | 0 (0.0%) |
| Total | 17 (100.0%) | 0 (0.0%) |
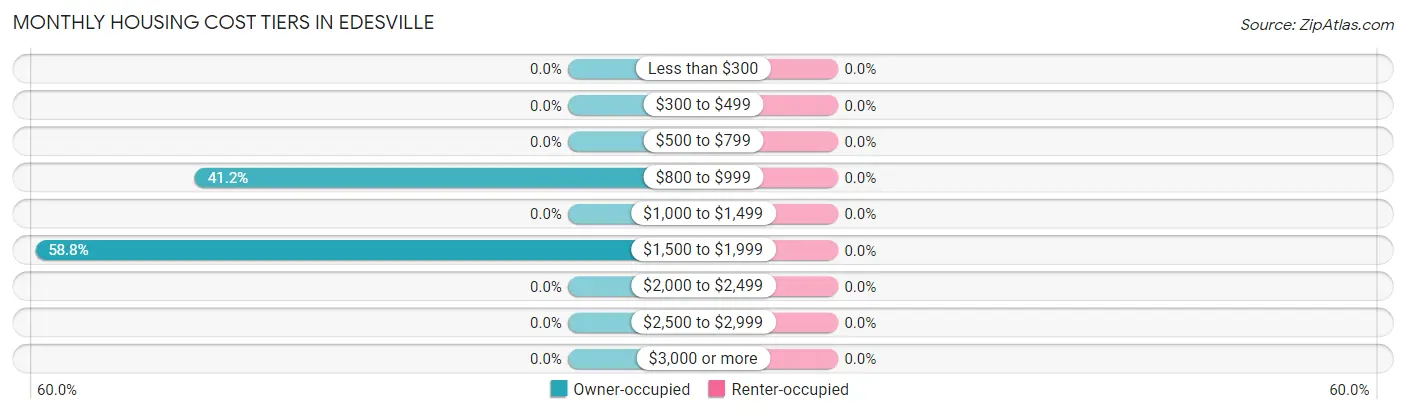
Monthly Housing Cost Tiers in Edesville
| Monthly Cost | Owner-occupied | Renter-occupied |
| Less than $300 | 0 (0.0%) | 0 (0.0%) |
| $300 to $499 | 0 (0.0%) | 0 (0.0%) |
| $500 to $799 | 0 (0.0%) | 0 (0.0%) |
| $800 to $999 | 7 (41.2%) | 0 (0.0%) |
| $1,000 to $1,499 | 0 (0.0%) | 0 (0.0%) |
| $1,500 to $1,999 | 10 (58.8%) | 0 (0.0%) |
| $2,000 to $2,499 | 0 (0.0%) | 0 (0.0%) |
| $2,500 to $2,999 | 0 (0.0%) | 0 (0.0%) |
| $3,000 or more | 0 (0.0%) | 0 (0.0%) |
| Total | 17 (100.0%) | 0 (0.0%) |
Physical Housing Characteristics in Edesville
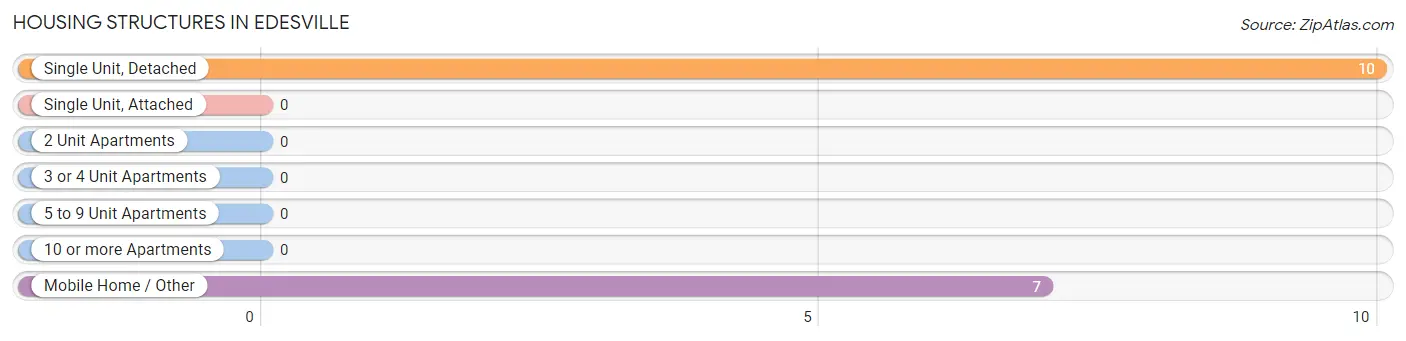
Housing Structures in Edesville
| Structure Type | # Housing Units | % Housing Units |
| Single Unit, Detached | 10 | 58.8% |
| Single Unit, Attached | 0 | 0.0% |
| 2 Unit Apartments | 0 | 0.0% |
| 3 or 4 Unit Apartments | 0 | 0.0% |
| 5 to 9 Unit Apartments | 0 | 0.0% |
| 10 or more Apartments | 0 | 0.0% |
| Mobile Home / Other | 7 | 41.2% |
| Total | 17 | 100.0% |
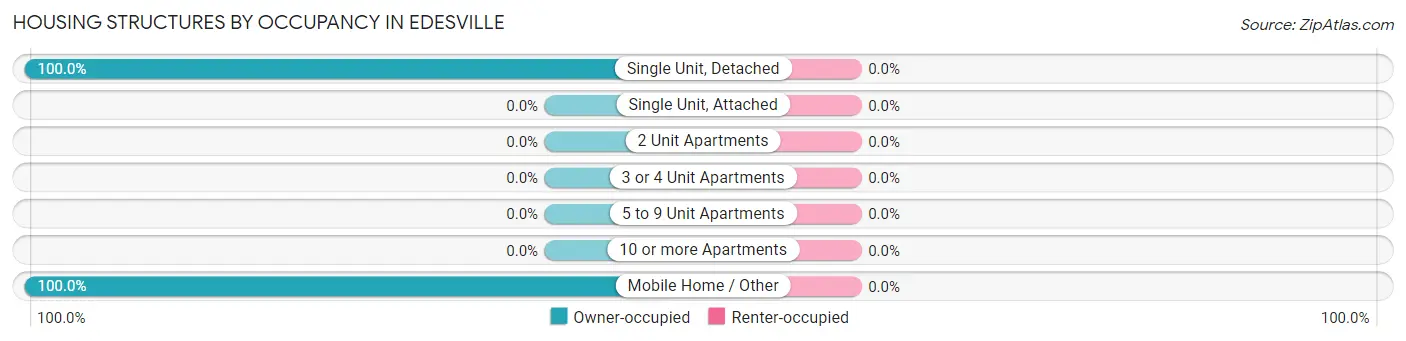
Housing Structures by Occupancy in Edesville
| Structure Type | Owner-occupied | Renter-occupied |
| Single Unit, Detached | 10 (100.0%) | 0 (0.0%) |
| Single Unit, Attached | 0 (0.0%) | 0 (0.0%) |
| 2 Unit Apartments | 0 (0.0%) | 0 (0.0%) |
| 3 or 4 Unit Apartments | 0 (0.0%) | 0 (0.0%) |
| 5 to 9 Unit Apartments | 0 (0.0%) | 0 (0.0%) |
| 10 or more Apartments | 0 (0.0%) | 0 (0.0%) |
| Mobile Home / Other | 7 (100.0%) | 0 (0.0%) |
| Total | 17 (100.0%) | 0 (0.0%) |
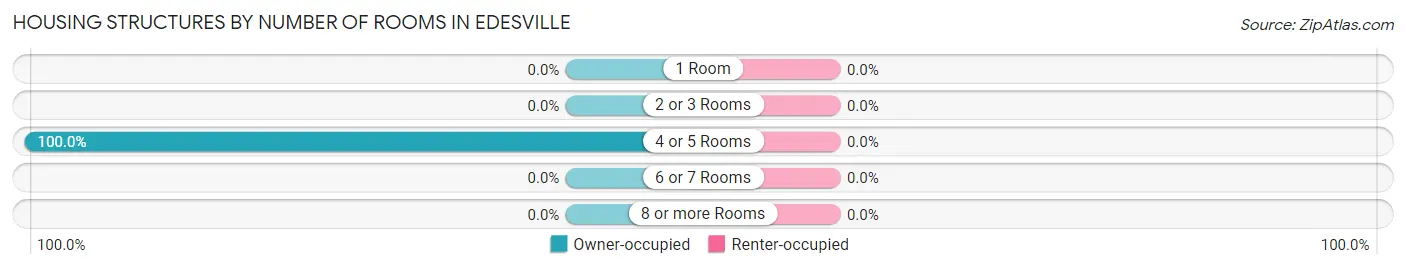
Housing Structures by Number of Rooms in Edesville
| Number of Rooms | Owner-occupied | Renter-occupied |
| 1 Room | 0 (0.0%) | 0 (0.0%) |
| 2 or 3 Rooms | 0 (0.0%) | 0 (0.0%) |
| 4 or 5 Rooms | 17 (100.0%) | 0 (0.0%) |
| 6 or 7 Rooms | 0 (0.0%) | 0 (0.0%) |
| 8 or more Rooms | 0 (0.0%) | 0 (0.0%) |
| Total | 17 (100.0%) | 0 (0.0%) |
Housing Structure by Heating Type in Edesville
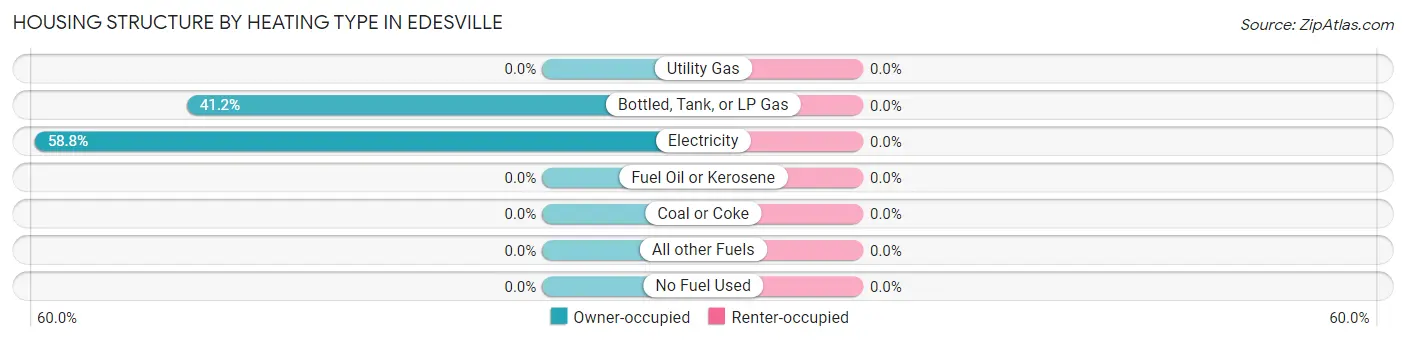
| Heating Type | Owner-occupied | Renter-occupied |
| Utility Gas | 0 (0.0%) | 0 (0.0%) |
| Bottled, Tank, or LP Gas | 7 (41.2%) | 0 (0.0%) |
| Electricity | 10 (58.8%) | 0 (0.0%) |
| Fuel Oil or Kerosene | 0 (0.0%) | 0 (0.0%) |
| Coal or Coke | 0 (0.0%) | 0 (0.0%) |
| All other Fuels | 0 (0.0%) | 0 (0.0%) |
| No Fuel Used | 0 (0.0%) | 0 (0.0%) |
| Total | 17 (100.0%) | 0 (0.0%) |
Household Vehicle Usage in Edesville
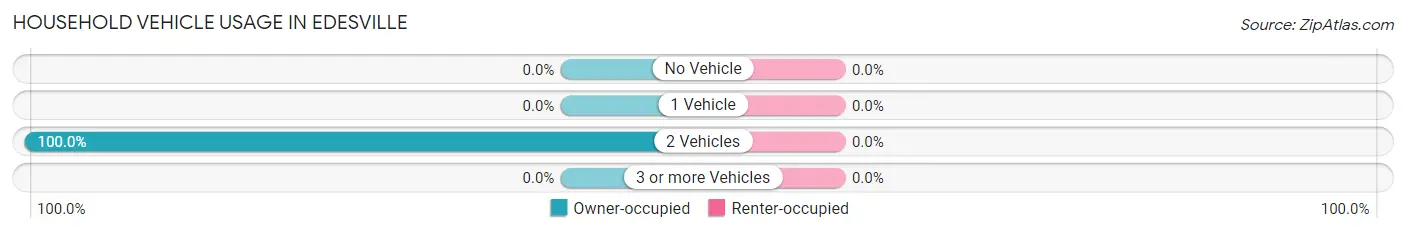
| Vehicles per Household | Owner-occupied | Renter-occupied |
| No Vehicle | 0 (0.0%) | 0 (0.0%) |
| 1 Vehicle | 0 (0.0%) | 0 (0.0%) |
| 2 Vehicles | 17 (100.0%) | 0 (0.0%) |
| 3 or more Vehicles | 0 (0.0%) | 0 (0.0%) |
| Total | 17 (100.0%) | 0 (0.0%) |
Real Estate & Mortgages in Edesville
Real Estate and Mortgage Overview in Edesville
| Characteristic | Without Mortgage | With Mortgage |
| Housing Units | 7 | 10 |
| Median Property Value | - | - |
| Median Household Income | - | - |
| Monthly Housing Costs | - | - |
| Real Estate Taxes | - | - |
Property Value by Mortgage Status in Edesville
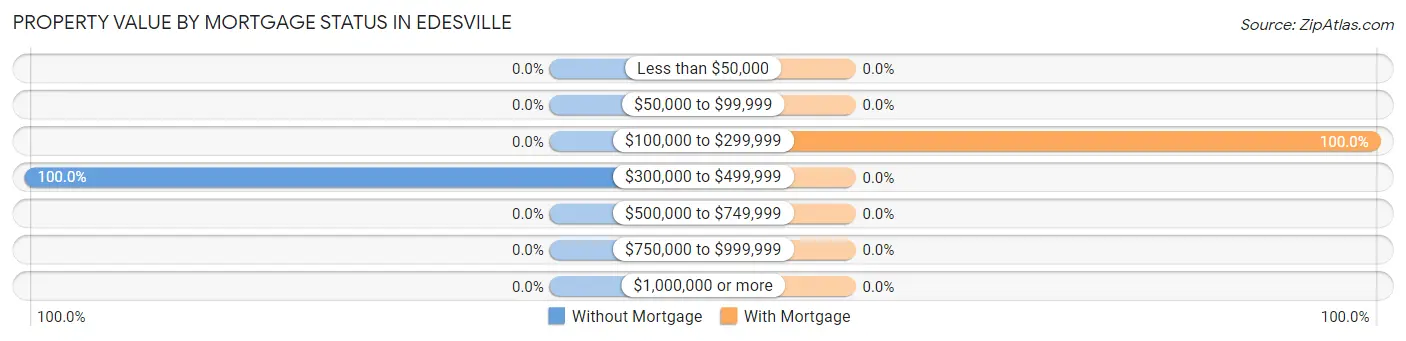
| Property Value | Without Mortgage | With Mortgage |
| Less than $50,000 | 0 (0.0%) | 0 (0.0%) |
| $50,000 to $99,999 | 0 (0.0%) | 0 (0.0%) |
| $100,000 to $299,999 | 0 (0.0%) | 10 (100.0%) |
| $300,000 to $499,999 | 7 (100.0%) | 0 (0.0%) |
| $500,000 to $749,999 | 0 (0.0%) | 0 (0.0%) |
| $750,000 to $999,999 | 0 (0.0%) | 0 (0.0%) |
| $1,000,000 or more | 0 (0.0%) | 0 (0.0%) |
| Total | 7 (100.0%) | 10 (100.0%) |
Household Income by Mortgage Status in Edesville
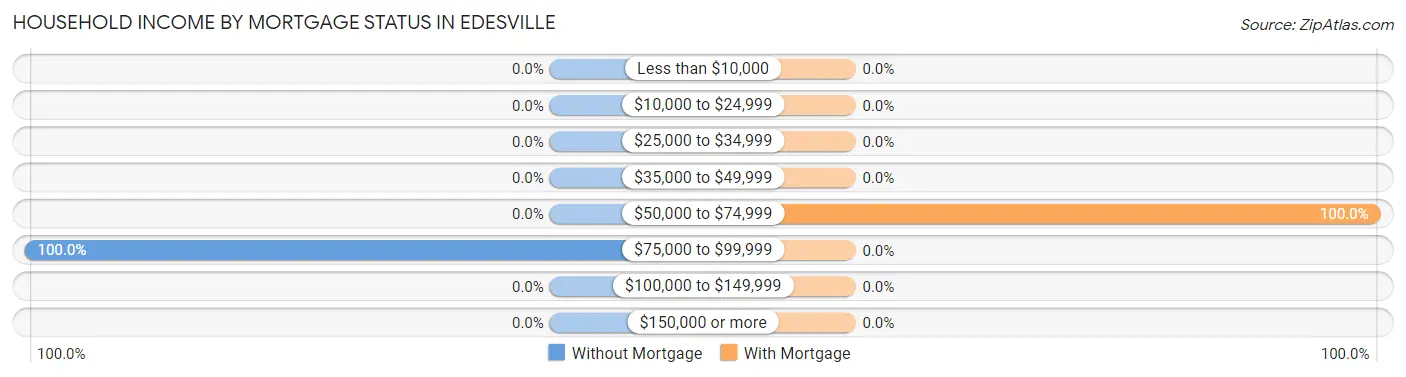
| Household Income | Without Mortgage | With Mortgage |
| Less than $10,000 | 0 (0.0%) | 0 (0.0%) |
| $10,000 to $24,999 | 0 (0.0%) | 0 (0.0%) |
| $25,000 to $34,999 | 0 (0.0%) | 0 (0.0%) |
| $35,000 to $49,999 | 0 (0.0%) | 0 (0.0%) |
| $50,000 to $74,999 | 0 (0.0%) | 10 (100.0%) |
| $75,000 to $99,999 | 7 (100.0%) | 0 (0.0%) |
| $100,000 to $149,999 | 0 (0.0%) | 0 (0.0%) |
| $150,000 or more | 0 (0.0%) | 0 (0.0%) |
| Total | 7 (100.0%) | 10 (100.0%) |
Property Value to Household Income Ratio in Edesville
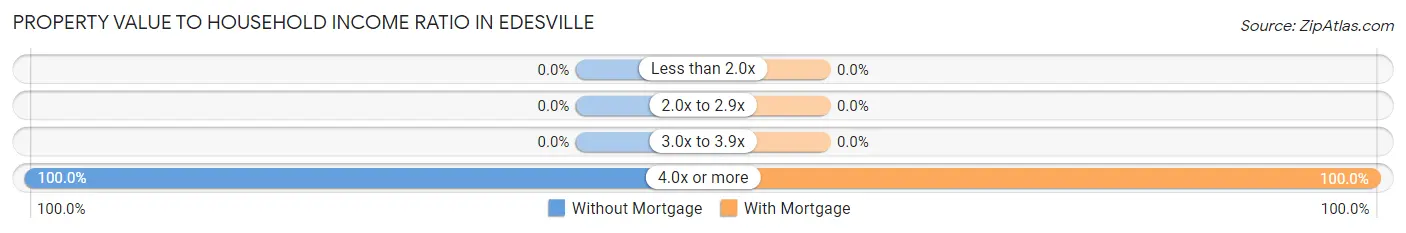
| Value-to-Income Ratio | Without Mortgage | With Mortgage |
| Less than 2.0x | 0 (0.0%) | 0 (0.0%) |
| 2.0x to 2.9x | 0 (0.0%) | 0 (0.0%) |
| 3.0x to 3.9x | 0 (0.0%) | 0 (0.0%) |
| 4.0x or more | 7 (100.0%) | 10 (100.0%) |
| Total | 7 (100.0%) | 10 (100.0%) |
Real Estate Taxes by Mortgage Status in Edesville
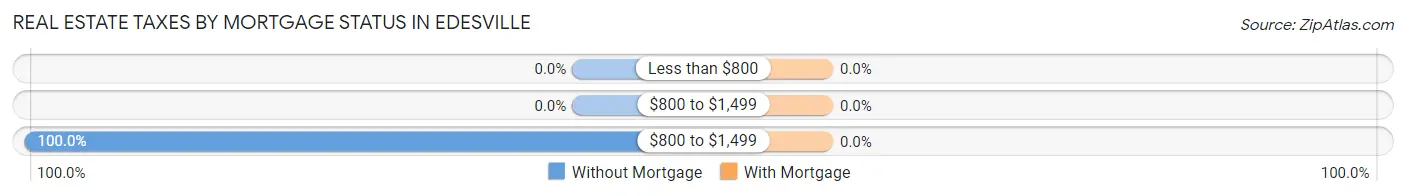
| Property Taxes | Without Mortgage | With Mortgage |
| Less than $800 | 0 (0.0%) | 0 (0.0%) |
| $800 to $1,499 | 0 (0.0%) | 0 (0.0%) |
| $800 to $1,499 | 7 (100.0%) | 0 (0.0%) |
| Total | 7 (100.0%) | 10 (100.0%) |
Health & Disability in Edesville
Health Insurance Coverage by Age in Edesville
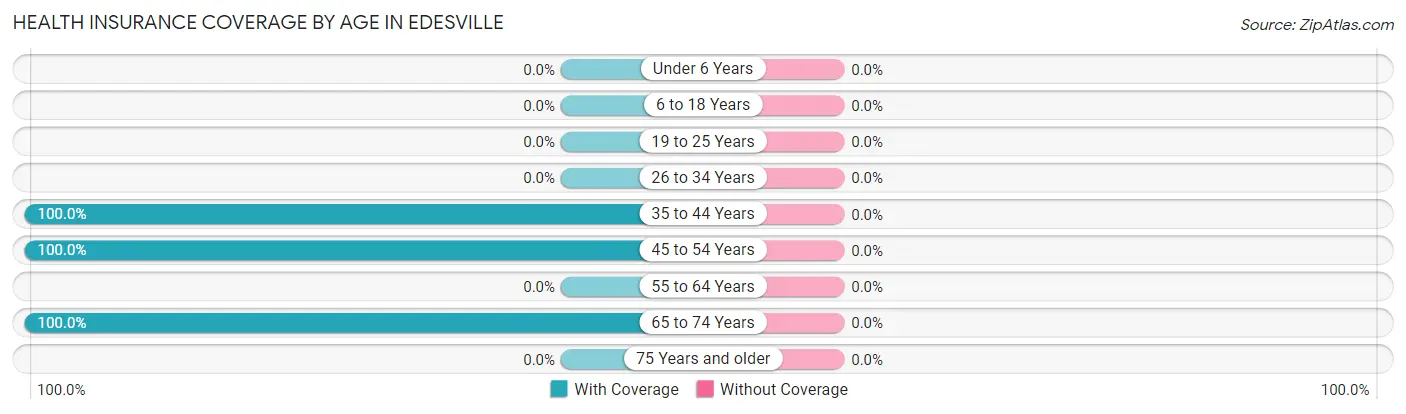
| Age Bracket | With Coverage | Without Coverage |
| Under 6 Years | 0 (0.0%) | 0 (0.0%) |
| 6 to 18 Years | 0 (0.0%) | 0 (0.0%) |
| 19 to 25 Years | 0 (0.0%) | 0 (0.0%) |
| 26 to 34 Years | 0 (0.0%) | 0 (0.0%) |
| 35 to 44 Years | 18 (100.0%) | 0 (0.0%) |
| 45 to 54 Years | 8 (100.0%) | 0 (0.0%) |
| 55 to 64 Years | 0 (0.0%) | 0 (0.0%) |
| 65 to 74 Years | 7 (100.0%) | 0 (0.0%) |
| 75 Years and older | 0 (0.0%) | 0 (0.0%) |
| Total | 33 (100.0%) | 0 (0.0%) |
Health Insurance Coverage by Citizenship Status in Edesville
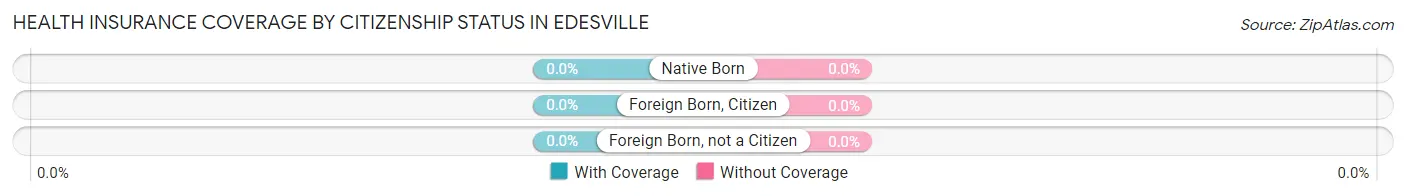
| Citizenship Status | With Coverage | Without Coverage |
| Native Born | 0 (0.0%) | 0 (0.0%) |
| Foreign Born, Citizen | 0 (0.0%) | 0 (0.0%) |
| Foreign Born, not a Citizen | 0 (0.0%) | 0 (0.0%) |
Health Insurance Coverage by Household Income in Edesville
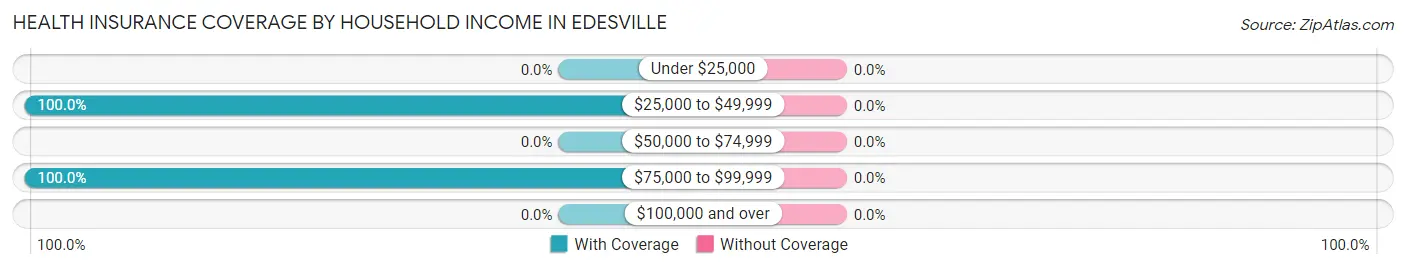
| Household Income | With Coverage | Without Coverage |
| Under $25,000 | 0 (0.0%) | 0 (0.0%) |
| $25,000 to $49,999 | 18 (100.0%) | 0 (0.0%) |
| $50,000 to $74,999 | 0 (0.0%) | 0 (0.0%) |
| $75,000 to $99,999 | 15 (100.0%) | 0 (0.0%) |
| $100,000 and over | 0 (0.0%) | 0 (0.0%) |
Public vs Private Health Insurance Coverage by Age in Edesville
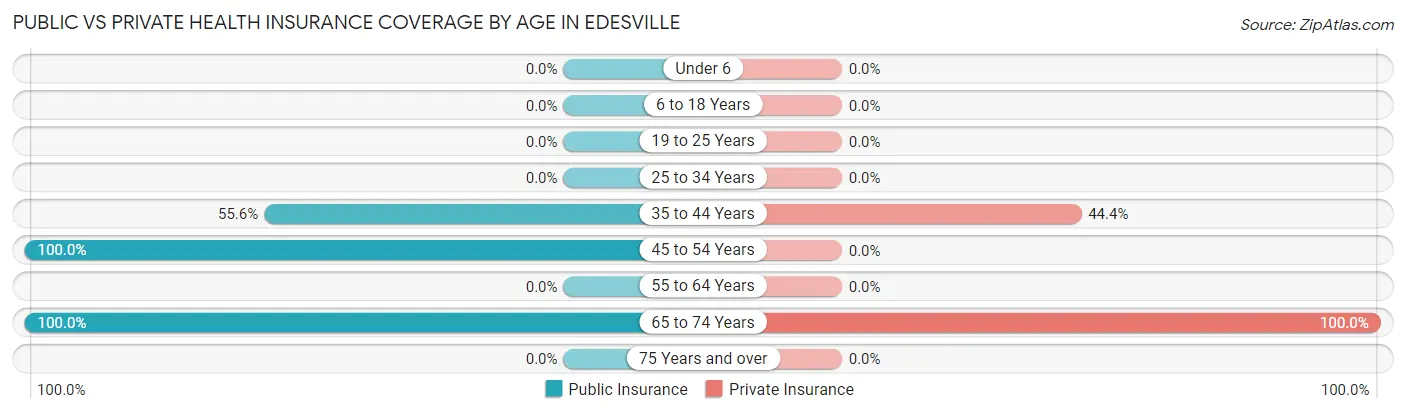
| Age Bracket | Public Insurance | Private Insurance |
| Under 6 | 0 (0.0%) | 0 (0.0%) |
| 6 to 18 Years | 0 (0.0%) | 0 (0.0%) |
| 19 to 25 Years | 0 (0.0%) | 0 (0.0%) |
| 25 to 34 Years | 0 (0.0%) | 0 (0.0%) |
| 35 to 44 Years | 10 (55.6%) | 8 (44.4%) |
| 45 to 54 Years | 8 (100.0%) | 0 (0.0%) |
| 55 to 64 Years | 0 (0.0%) | 0 (0.0%) |
| 65 to 74 Years | 7 (100.0%) | 7 (100.0%) |
| 75 Years and over | 0 (0.0%) | 0 (0.0%) |
| Total | 25 (75.8%) | 15 (45.5%) |
Disability Status by Sex by Age in Edesville
| Age Bracket | Male | Female |
| Under 5 Years | 0 (0.0%) | 0 (0.0%) |
| 5 to 17 Years | 0 (0.0%) | 0 (0.0%) |
| 18 to 34 Years | 0 (0.0%) | 0 (0.0%) |
| 35 to 64 Years | 0 (0.0%) | 0 (0.0%) |
| 65 to 74 Years | 0 (0.0%) | 0 (0.0%) |
| 75 Years and over | 0 (0.0%) | 0 (0.0%) |
Disability Class by Sex by Age in Edesville
Disability Class: Hearing Difficulty
| Age Bracket | Male | Female |
| Under 5 Years | 0 (0.0%) | 0 (0.0%) |
| 5 to 17 Years | 0 (0.0%) | 0 (0.0%) |
| 18 to 34 Years | 0 (0.0%) | 0 (0.0%) |
| 35 to 64 Years | 0 (0.0%) | 0 (0.0%) |
| 65 to 74 Years | 0 (0.0%) | 0 (0.0%) |
| 75 Years and over | 0 (0.0%) | 0 (0.0%) |
Disability Class: Vision Difficulty
| Age Bracket | Male | Female |
| Under 5 Years | 0 (0.0%) | 0 (0.0%) |
| 5 to 17 Years | 0 (0.0%) | 0 (0.0%) |
| 18 to 34 Years | 0 (0.0%) | 0 (0.0%) |
| 35 to 64 Years | 0 (0.0%) | 0 (0.0%) |
| 65 to 74 Years | 0 (0.0%) | 0 (0.0%) |
| 75 Years and over | 0 (0.0%) | 0 (0.0%) |
Disability Class: Cognitive Difficulty
| Age Bracket | Male | Female |
| 5 to 17 Years | 0 (0.0%) | 0 (0.0%) |
| 18 to 34 Years | 0 (0.0%) | 0 (0.0%) |
| 35 to 64 Years | 0 (0.0%) | 0 (0.0%) |
| 65 to 74 Years | 0 (0.0%) | 0 (0.0%) |
| 75 Years and over | 0 (0.0%) | 0 (0.0%) |
Disability Class: Ambulatory Difficulty
| Age Bracket | Male | Female |
| 5 to 17 Years | 0 (0.0%) | 0 (0.0%) |
| 18 to 34 Years | 0 (0.0%) | 0 (0.0%) |
| 35 to 64 Years | 0 (0.0%) | 0 (0.0%) |
| 65 to 74 Years | 0 (0.0%) | 0 (0.0%) |
| 75 Years and over | 0 (0.0%) | 0 (0.0%) |
Disability Class: Self-Care Difficulty
| Age Bracket | Male | Female |
| 5 to 17 Years | 0 (0.0%) | 0 (0.0%) |
| 18 to 34 Years | 0 (0.0%) | 0 (0.0%) |
| 35 to 64 Years | 0 (0.0%) | 0 (0.0%) |
| 65 to 74 Years | 0 (0.0%) | 0 (0.0%) |
| 75 Years and over | 0 (0.0%) | 0 (0.0%) |
Technology Access in Edesville
Computing Device Access in Edesville
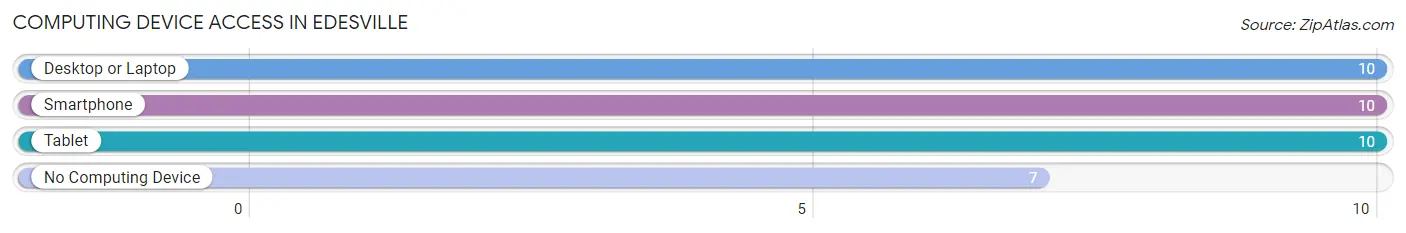
| Device Type | # Households | % Households |
| Desktop or Laptop | 10 | 58.8% |
| Smartphone | 10 | 58.8% |
| Tablet | 10 | 58.8% |
| No Computing Device | 7 | 41.2% |
| Total | 17 | 100.0% |
Internet Access in Edesville
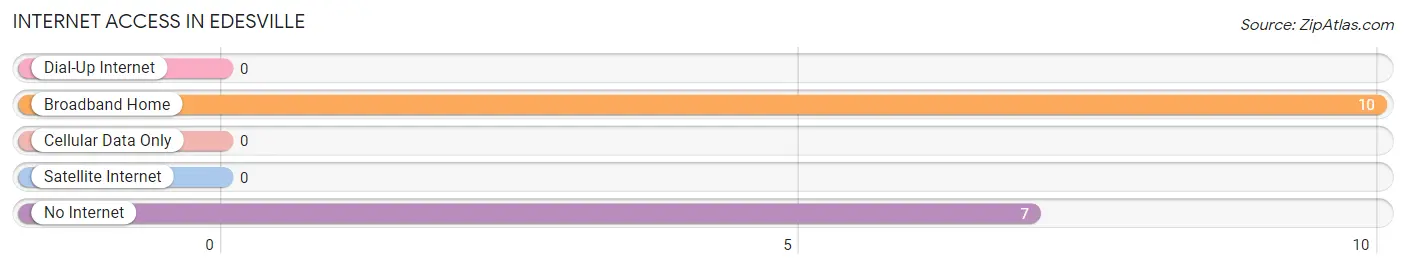
| Internet Type | # Households | % Households |
| Dial-Up Internet | 0 | 0.0% |
| Broadband Home | 10 | 58.8% |
| Cellular Data Only | 0 | 0.0% |
| Satellite Internet | 0 | 0.0% |
| No Internet | 7 | 41.2% |
| Total | 17 | 100.0% |
Edesville Summary
Edesville, MD is a small town located in Montgomery County, Maryland. It is situated in the northern part of the county, just south of the Potomac River. The town is bordered by the towns of Poolesville, Germantown, and Gaithersburg. The population of Edesville was estimated to be 2,845 in 2019.
History
The area that is now Edesville was first settled in the late 1700s by German immigrants. The town was originally known as “Edesville” after the Edes family, who were among the first settlers. The town was officially incorporated in 1891.
In the early 1900s, Edesville was a thriving agricultural community. The town was home to several farms, including the Edes family farm, which was one of the largest in the area. The town also had a general store, a post office, and a blacksmith shop.
In the 1950s, Edesville began to experience a population boom as people moved to the area from Washington, D.C. and other parts of Maryland. This growth continued into the 1960s and 1970s, and the town’s population reached its peak in the 1980s.
Geography
Edesville is located in the northern part of Montgomery County, Maryland. It is situated just south of the Potomac River and is bordered by the towns of Poolesville, Germantown, and Gaithersburg. The town is located in the Piedmont region of Maryland, which is characterized by rolling hills and valleys.
The climate in Edesville is humid subtropical, with hot, humid summers and mild winters. The average annual temperature is around 57 degrees Fahrenheit. The average annual precipitation is around 40 inches.
Economy
The economy of Edesville is largely based on agriculture and tourism. The town is home to several farms, including the Edes family farm, which is one of the largest in the area. The town also has several small businesses, including restaurants, shops, and a gas station.
The town is also home to several parks and recreational areas, including the Edesville Community Park, which features a playground, picnic areas, and a walking trail. The town also has several historic sites, including the Edes family farmhouse, which is listed on the National Register of Historic Places.
Demographics
As of 2019, the population of Edesville was estimated to be 2,845. The racial makeup of the town was 79.3% White, 11.2% African American, 4.2% Asian, and 5.3% Hispanic or Latino. The median household income was $90,945, and the median home value was $400,000.
The town is served by the Montgomery County Public Schools system. The town is also home to several churches, including the Edesville United Methodist Church and the Edesville Baptist Church.
Conclusion
Edesville, MD is a small town located in Montgomery County, Maryland. It is situated in the northern part of the county, just south of the Potomac River. The town was first settled in the late 1700s by German immigrants and was officially incorporated in 1891. The town’s economy is largely based on agriculture and tourism, and the population was estimated to be 2,845 in 2019. The town is served by the Montgomery County Public Schools system and is home to several parks and recreational areas.
Common Questions
What is Per Capita Income in Edesville?
Per Capita income in Edesville is $35,261.
What is Inequality or Gini Index in Edesville?
Inequality or Gini Index in Edesville is 0.16.
What is the Total Population of Edesville?
Total Population of Edesville is 33.
What is the Total Male Population of Edesville?
Total Male Population of Edesville is 23.
What is the Total Female Population of Edesville?
Total Female Population of Edesville is 10.
What is the Ratio of Males per 100 Females in Edesville?
There are 230.00 Males per 100 Females in Edesville.
What is the Ratio of Females per 100 Males in Edesville?
There are 43.48 Females per 100 Males in Edesville.
What is the Median Population Age in Edesville?
Median Population Age in Edesville is 44.9 Years.
What is the Average Family Size in Edesville
Average Family Size in Edesville is 1.9 People.
What is the Average Household Size in Edesville
Average Household Size in Edesville is 1.9 People.
How Large is the Labor Force in Edesville?
There are 26 People in the Labor Forcein in Edesville.
What is the Percentage of People in the Labor Force in Edesville?
78.8% of People are in the Labor Force in Edesville.
What is the Unemployment Rate in Edesville?
Unemployment Rate in Edesville is 30.8%.