Zip Codes with the Highest Percentage of Population with a Degree in Visual and Performing Arts in Dubuque, IA
RELATED REPORTS & OPTIONS
Visual and Performing Arts
Dubuque
Compare Zip Codes
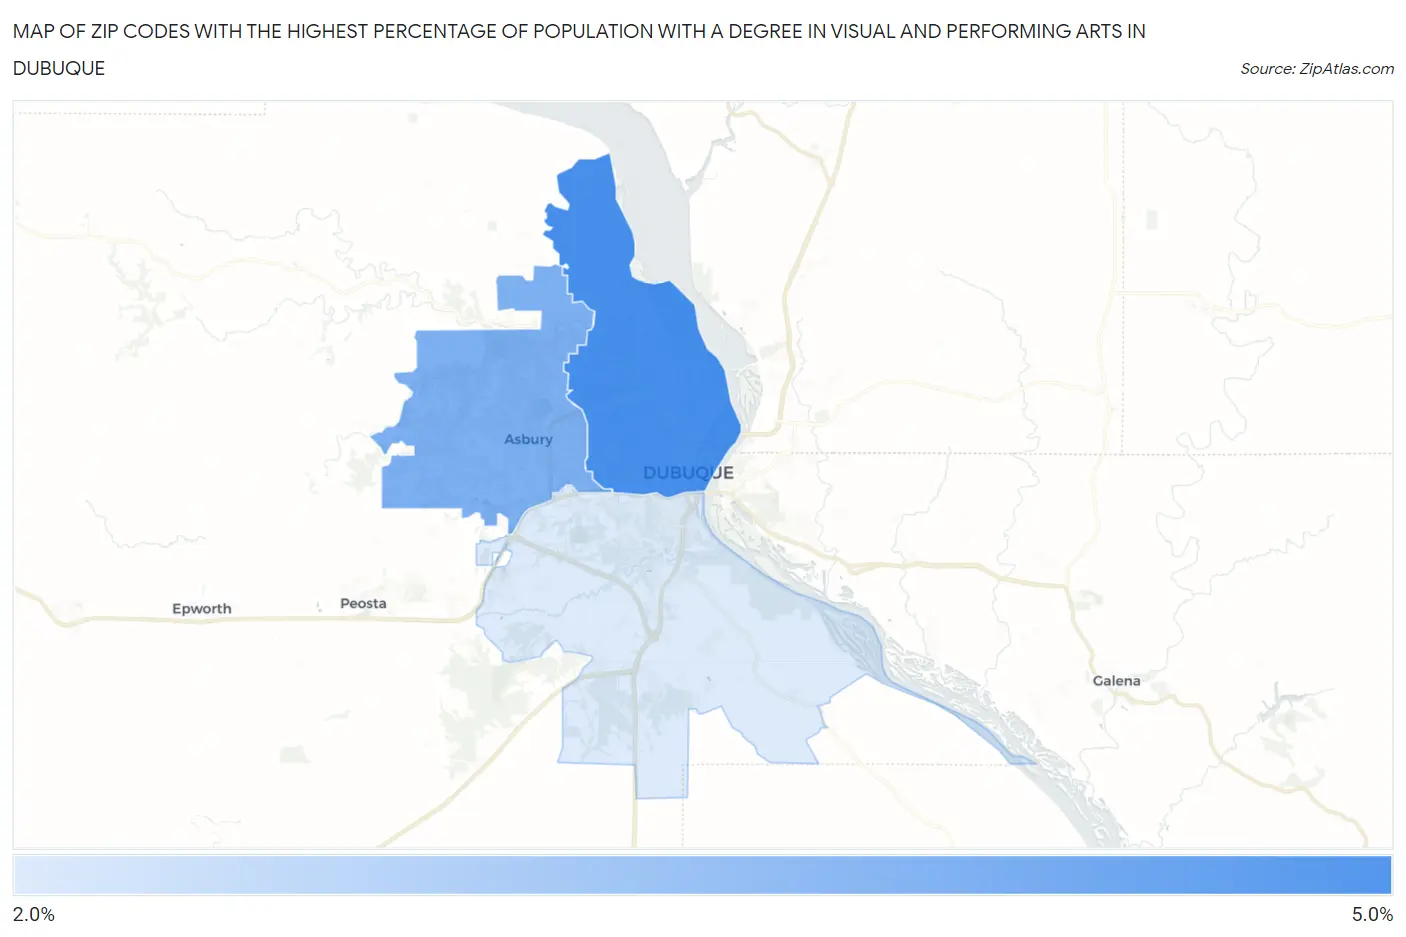
Map of Zip Codes with the Highest Percentage of Population with a Degree in Visual and Performing Arts in Dubuque
2.8%
4.3%
Zip Codes with the Highest Percentage of Population with a Degree in Visual and Performing Arts in Dubuque, IA
| Zip Code | % Graduates | vs State | vs National | |
| 1. | 52001 | 4.3% | 3.5%(+0.841)#170 | 4.3%(+0.093)#8,231 |
| 2. | 52002 | 3.8% | 3.5%(+0.277)#204 | 4.3%(-0.471)#9,911 |
| 3. | 52003 | 2.8% | 3.5%(-0.732)#281 | 4.3%(-1.48)#13,602 |
1
Common Questions
What are the Top Zip Codes with the Highest Percentage of Population with a Degree in Visual and Performing Arts in Dubuque, IA?
Top Zip Codes with the Highest Percentage of Population with a Degree in Visual and Performing Arts in Dubuque, IA are:
What zip code has the Highest Percentage of Population with a Degree in Visual and Performing Arts in Dubuque, IA?
52001 has the Highest Percentage of Population with a Degree in Visual and Performing Arts in Dubuque, IA with 4.3%.
What is the Percentage of Population with a Degree in Visual and Performing Arts in Dubuque, IA?
Percentage of Population with a Degree in Visual and Performing Arts in Dubuque is 4.5%.
What is the Percentage of Population with a Degree in Visual and Performing Arts in Iowa?
Percentage of Population with a Degree in Visual and Performing Arts in Iowa is 3.5%.
What is the Percentage of Population with a Degree in Visual and Performing Arts in the United States?
Percentage of Population with a Degree in Visual and Performing Arts in the United States is 4.3%.