Dublin, GA Map & Demographics
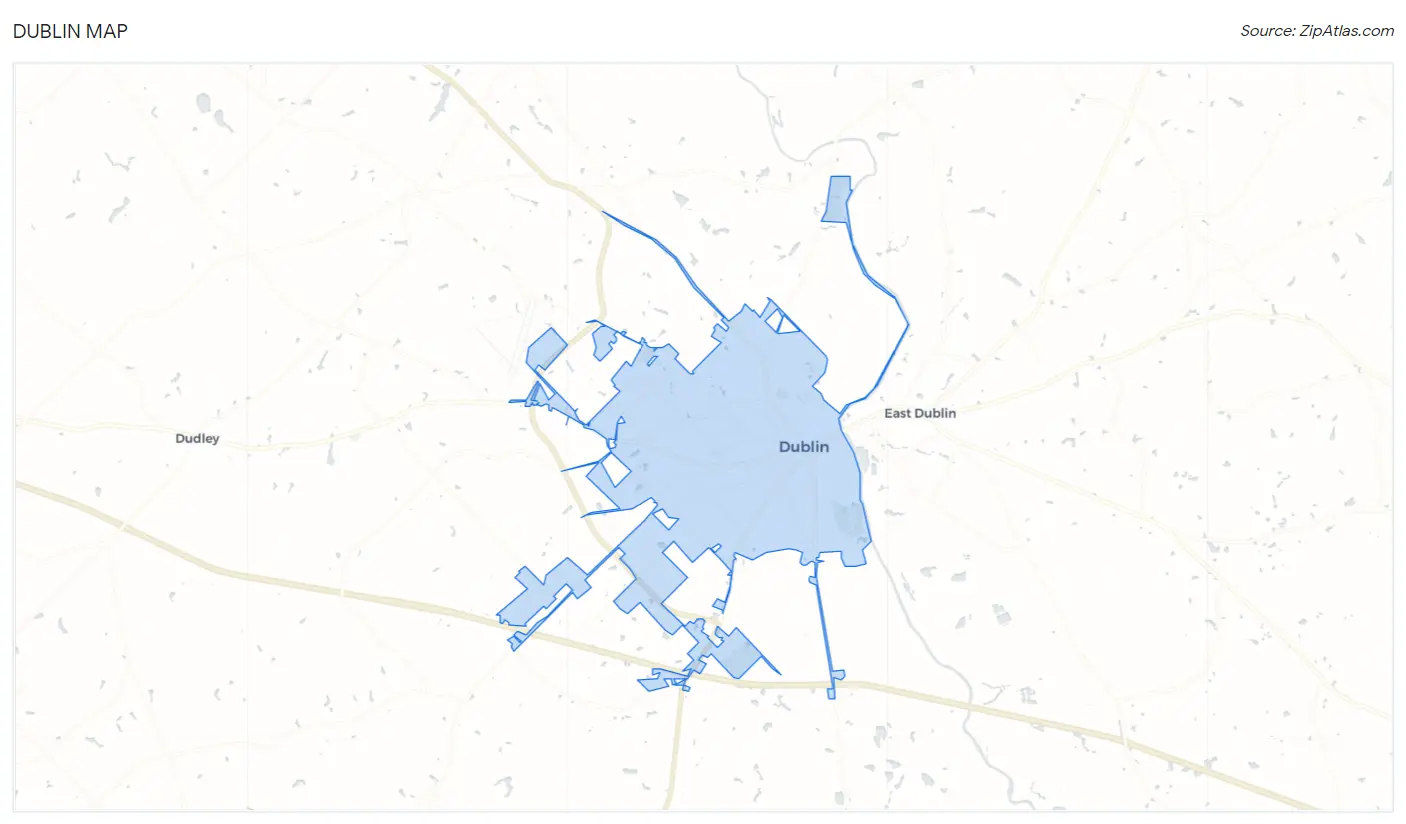
Dublin Map
Dublin Overview
$27,194
PER CAPITA INCOME
$48,420
AVG FAMILY INCOME
$37,734
AVG HOUSEHOLD INCOME
32.5%
WAGE / INCOME GAP [ % ]
67.5¢/ $1
WAGE / INCOME GAP [ $ ]
0.61
INEQUALITY / GINI INDEX
15,985
TOTAL POPULATION
7,558
MALE POPULATION
8,427
FEMALE POPULATION
89.69
MALES / 100 FEMALES
111.50
FEMALES / 100 MALES
34.9
MEDIAN AGE
3.4
AVG FAMILY SIZE
2.7
AVG HOUSEHOLD SIZE
5,797
LABOR FORCE [ PEOPLE ]
47.4%
PERCENT IN LABOR FORCE
7.5%
UNEMPLOYMENT RATE
Dublin Zip Codes
Dublin Area Codes
Income in Dublin
Income Overview in Dublin
Per Capita Income in Dublin is $27,194, while median incomes of families and households are $48,420 and $37,734 respectively.
| Characteristic | Number | Measure |
| Per Capita Income | 15,985 | $27,194 |
| Median Family Income | 3,648 | $48,420 |
| Mean Family Income | 3,648 | $90,026 |
| Median Household Income | 5,709 | $37,734 |
| Mean Household Income | 5,709 | $71,139 |
| Income Deficit | 3,648 | $0 |
| Wage / Income Gap (%) | 15,985 | 32.54% |
| Wage / Income Gap ($) | 15,985 | 67.46¢ per $1 |
| Gini / Inequality Index | 15,985 | 0.61 |
Earnings by Sex in Dublin
Average Earnings in Dublin are $26,815, $34,976 for men and $23,594 for women, a difference of 32.5%.
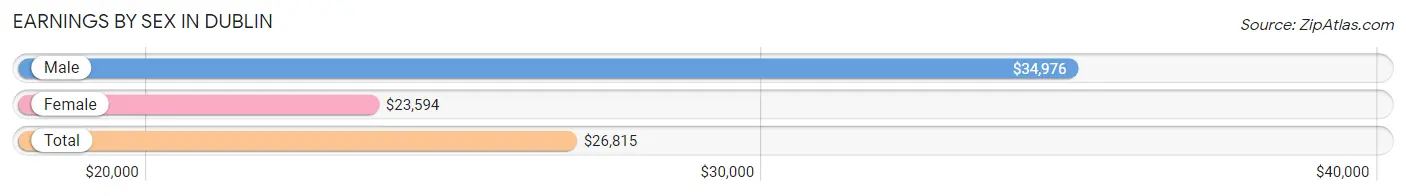
| Sex | Number | Average Earnings |
| Male | 2,962 (46.5%) | $34,976 |
| Female | 3,414 (53.5%) | $23,594 |
| Total | 6,376 (100.0%) | $26,815 |
Earnings by Sex by Income Bracket in Dublin
The most common earnings brackets in Dublin are $55,000 to $64,999 for men (268 | 9.0%) and $25,000 to $29,999 for women (345 | 10.1%).
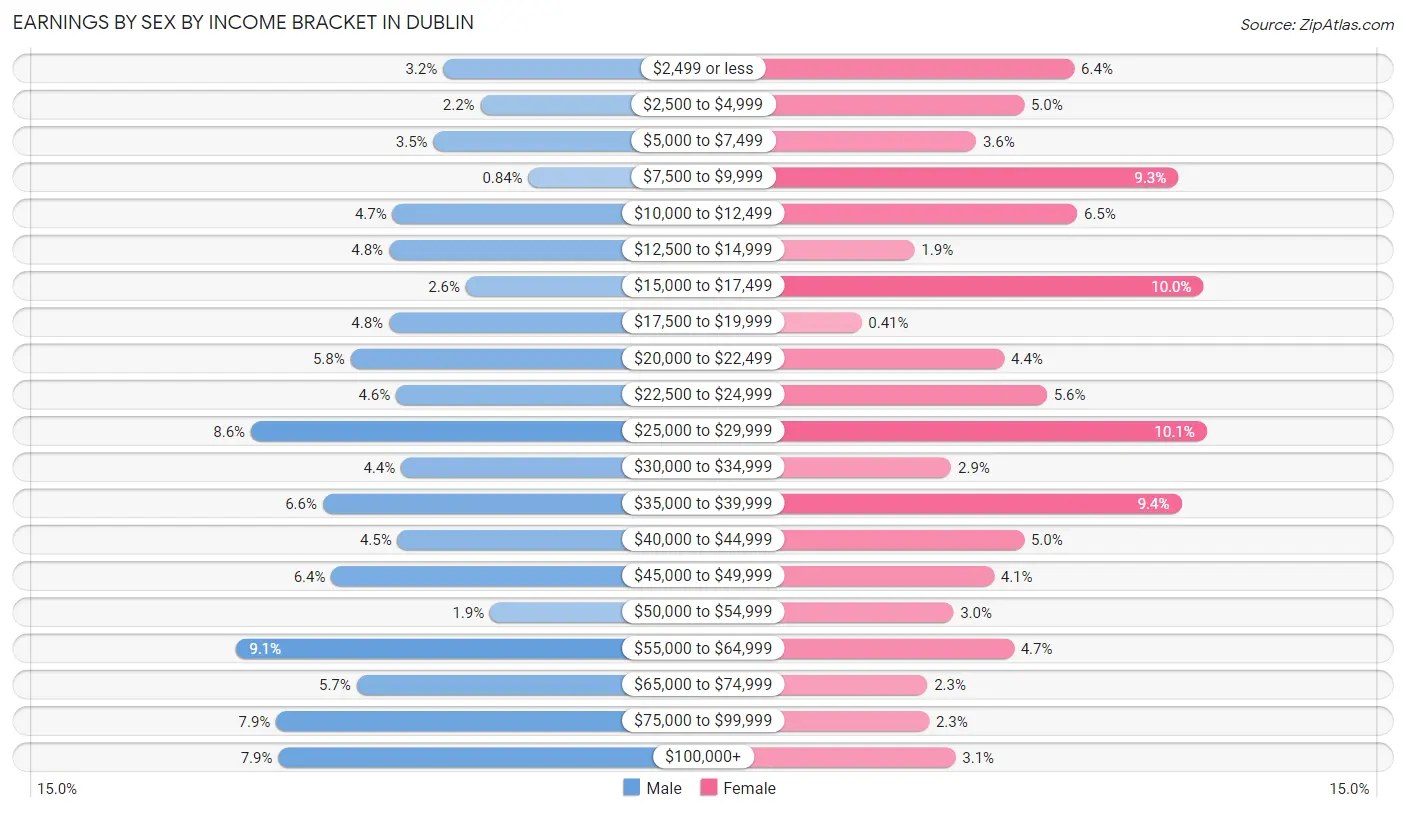
| Income | Male | Female |
| $2,499 or less | 96 (3.2%) | 218 (6.4%) |
| $2,500 to $4,999 | 65 (2.2%) | 170 (5.0%) |
| $5,000 to $7,499 | 104 (3.5%) | 124 (3.6%) |
| $7,500 to $9,999 | 25 (0.8%) | 318 (9.3%) |
| $10,000 to $12,499 | 138 (4.7%) | 221 (6.5%) |
| $12,500 to $14,999 | 141 (4.8%) | 65 (1.9%) |
| $15,000 to $17,499 | 77 (2.6%) | 342 (10.0%) |
| $17,500 to $19,999 | 141 (4.8%) | 14 (0.4%) |
| $20,000 to $22,499 | 173 (5.8%) | 151 (4.4%) |
| $22,500 to $24,999 | 135 (4.6%) | 192 (5.6%) |
| $25,000 to $29,999 | 256 (8.6%) | 345 (10.1%) |
| $30,000 to $34,999 | 131 (4.4%) | 100 (2.9%) |
| $35,000 to $39,999 | 196 (6.6%) | 321 (9.4%) |
| $40,000 to $44,999 | 134 (4.5%) | 170 (5.0%) |
| $45,000 to $49,999 | 189 (6.4%) | 141 (4.1%) |
| $50,000 to $54,999 | 57 (1.9%) | 102 (3.0%) |
| $55,000 to $64,999 | 268 (9.0%) | 160 (4.7%) |
| $65,000 to $74,999 | 168 (5.7%) | 77 (2.3%) |
| $75,000 to $99,999 | 235 (7.9%) | 79 (2.3%) |
| $100,000+ | 233 (7.9%) | 104 (3.0%) |
| Total | 2,962 (100.0%) | 3,414 (100.0%) |
Earnings by Sex by Educational Attainment in Dublin
Average earnings in Dublin are $41,988 for men and $25,575 for women, a difference of 39.1%. Men with an educational attainment of graduate degree enjoy the highest average annual earnings of $74,034, while those with high school diploma education earn the least with $27,363. Women with an educational attainment of graduate degree earn the most with the average annual earnings of $48,385, while those with less than high school education have the smallest earnings of $11,266.
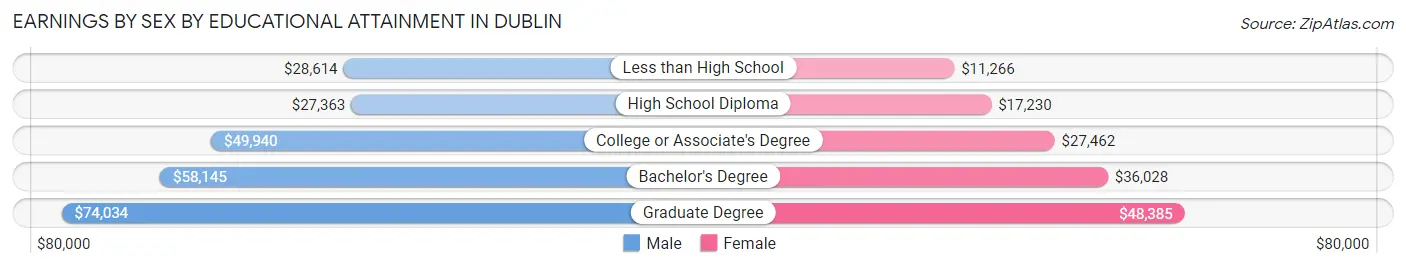
| Educational Attainment | Male Income | Female Income |
| Less than High School | $28,614 | $11,266 |
| High School Diploma | $27,363 | $17,230 |
| College or Associate's Degree | $49,940 | $27,462 |
| Bachelor's Degree | $58,145 | $36,028 |
| Graduate Degree | $74,034 | $48,385 |
| Total | $41,988 | $25,575 |
Family Income in Dublin
Family Income Brackets in Dublin
According to the Dublin family income data, there are 624 families falling into the $35,000 to $49,999 income range, which is the most common income bracket and makes up 17.1% of all families. Conversely, the $150,000 to $199,999 income bracket is the least frequent group with only 142 families (3.9%) belonging to this category.
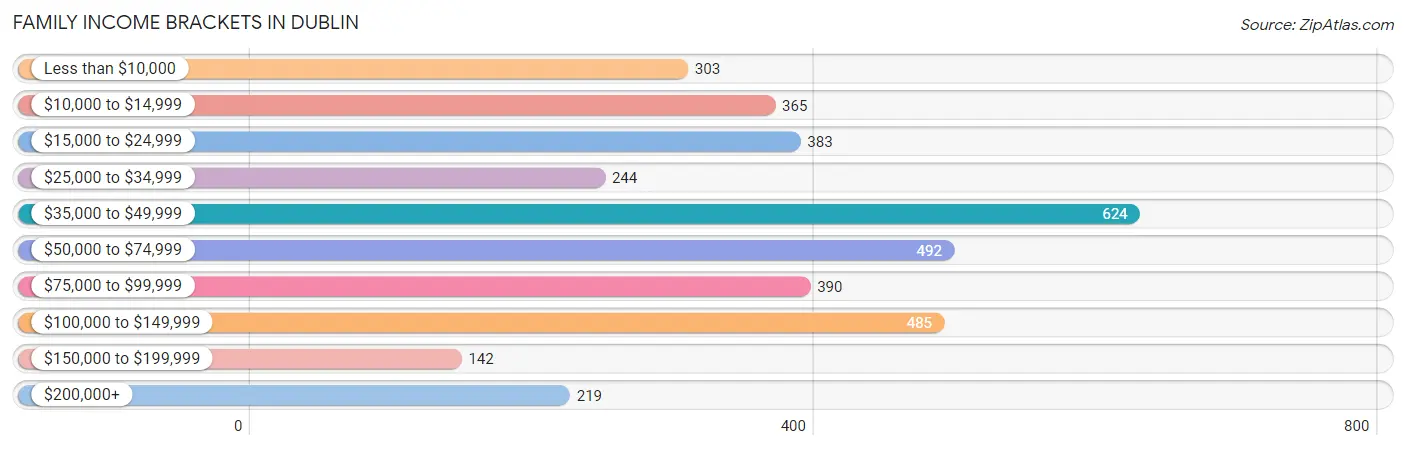
| Income Bracket | # Families | % Families |
| Less than $10,000 | 303 | 8.3% |
| $10,000 to $14,999 | 365 | 10.0% |
| $15,000 to $24,999 | 383 | 10.5% |
| $25,000 to $34,999 | 244 | 6.7% |
| $35,000 to $49,999 | 624 | 17.1% |
| $50,000 to $74,999 | 492 | 13.5% |
| $75,000 to $99,999 | 390 | 10.7% |
| $100,000 to $149,999 | 485 | 13.3% |
| $150,000 to $199,999 | 142 | 3.9% |
| $200,000+ | 219 | 6.0% |
Family Income by Famaliy Size in Dublin
4-person families (578 | 15.8%) account for the highest median family income in Dublin with $63,750 per family, while 2-person families (1,657 | 45.4%) have the highest median income of $25,928 per family member.
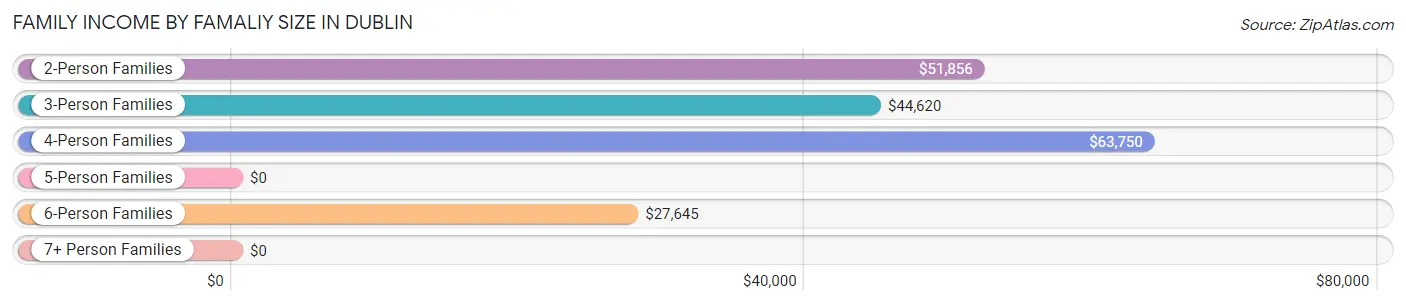
| Income Bracket | # Families | Median Income |
| 2-Person Families | 1,657 (45.4%) | $51,856 |
| 3-Person Families | 910 (24.9%) | $44,620 |
| 4-Person Families | 578 (15.8%) | $63,750 |
| 5-Person Families | 300 (8.2%) | $0 |
| 6-Person Families | 169 (4.6%) | $27,645 |
| 7+ Person Families | 34 (0.9%) | $0 |
| Total | 3,648 (100.0%) | $48,420 |
Family Income by Number of Earners in Dublin
The median family income in Dublin is $48,420, with families comprising 2 earners (875) having the highest median family income of $96,042, while families with no earners (580) have the lowest median family income of $24,542, accounting for 24.0% and 15.9% of families, respectively.
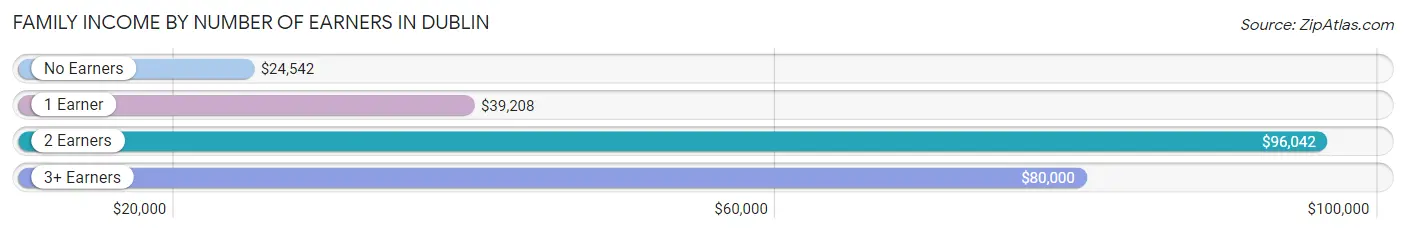
| Number of Earners | # Families | Median Income |
| No Earners | 580 (15.9%) | $24,542 |
| 1 Earner | 2,037 (55.8%) | $39,208 |
| 2 Earners | 875 (24.0%) | $96,042 |
| 3+ Earners | 156 (4.3%) | $80,000 |
| Total | 3,648 (100.0%) | $48,420 |
Household Income in Dublin
Household Income Brackets in Dublin
With 879 households falling in the category, the $35,000 to $49,999 income range is the most frequent in Dublin, accounting for 15.4% of all households. In contrast, only 148 households (2.6%) fall into the $150,000 to $199,999 income bracket, making it the least populous group.
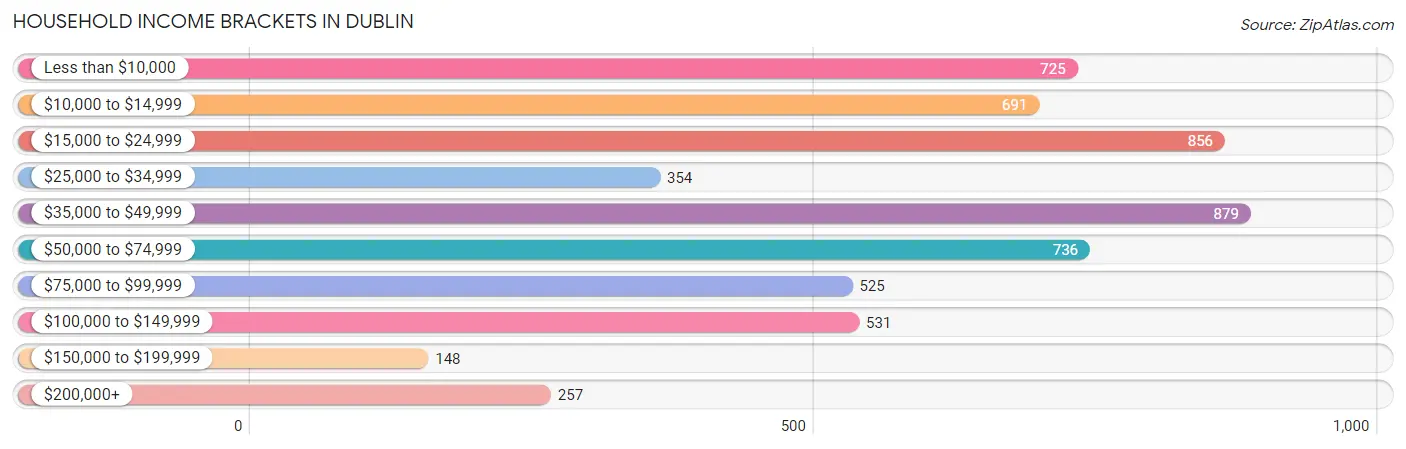
| Income Bracket | # Households | % Households |
| Less than $10,000 | 725 | 12.7% |
| $10,000 to $14,999 | 691 | 12.1% |
| $15,000 to $24,999 | 856 | 15.0% |
| $25,000 to $34,999 | 354 | 6.2% |
| $35,000 to $49,999 | 879 | 15.4% |
| $50,000 to $74,999 | 736 | 12.9% |
| $75,000 to $99,999 | 525 | 9.2% |
| $100,000 to $149,999 | 531 | 9.3% |
| $150,000 to $199,999 | 148 | 2.6% |
| $200,000+ | 257 | 4.5% |
Household Income by Householder Age in Dublin
The median household income in Dublin is $37,734, with the highest median household income of $44,531 found in the 15 to 24 years age bracket for the primary householder. A total of 222 households (3.9%) fall into this category. Meanwhile, the 45 to 64 years age bracket for the primary householder has the lowest median household income of $28,547, with 2,139 households (37.5%) in this group.
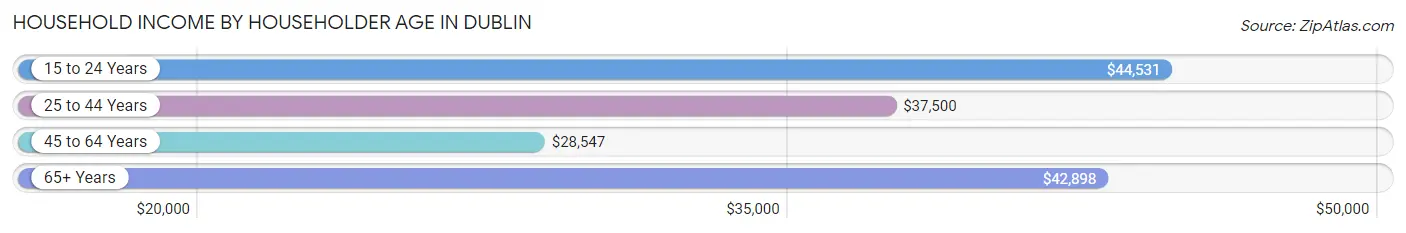
| Income Bracket | # Households | Median Income |
| 15 to 24 Years | 222 (3.9%) | $44,531 |
| 25 to 44 Years | 1,892 (33.1%) | $37,500 |
| 45 to 64 Years | 2,139 (37.5%) | $28,547 |
| 65+ Years | 1,456 (25.5%) | $42,898 |
| Total | 5,709 (100.0%) | $37,734 |
Poverty in Dublin
Income Below Poverty by Sex and Age in Dublin
With 32.5% poverty level for males and 38.1% for females among the residents of Dublin, 5 year old males and 16 and 17 year old females are the most vulnerable to poverty, with 79 males (88.8%) and 147 females (85.5%) in their respective age groups living below the poverty level.
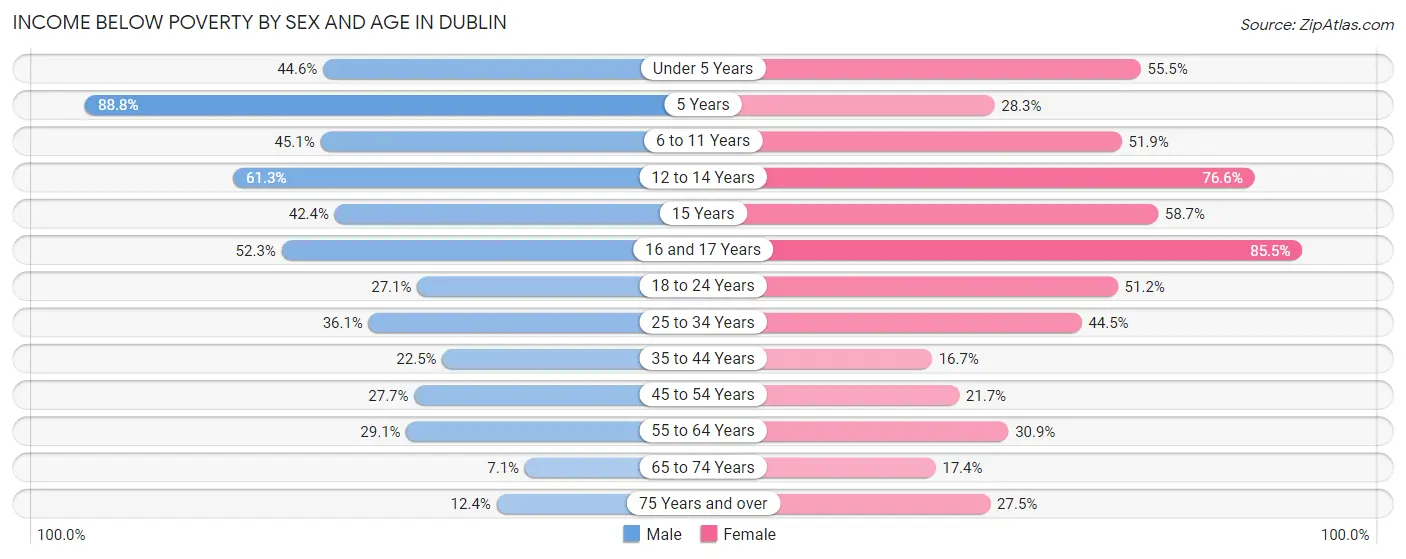
| Age Bracket | Male | Female |
| Under 5 Years | 300 (44.6%) | 320 (55.5%) |
| 5 Years | 79 (88.8%) | 45 (28.3%) |
| 6 to 11 Years | 334 (45.1%) | 256 (51.9%) |
| 12 to 14 Years | 220 (61.3%) | 344 (76.6%) |
| 15 Years | 56 (42.4%) | 44 (58.7%) |
| 16 and 17 Years | 57 (52.3%) | 147 (85.5%) |
| 18 to 24 Years | 177 (27.1%) | 383 (51.2%) |
| 25 to 34 Years | 401 (36.1%) | 632 (44.5%) |
| 35 to 44 Years | 130 (22.5%) | 123 (16.7%) |
| 45 to 54 Years | 229 (27.7%) | 215 (21.7%) |
| 55 to 64 Years | 210 (29.1%) | 329 (30.9%) |
| 65 to 74 Years | 47 (7.1%) | 127 (17.3%) |
| 75 Years and over | 50 (12.4%) | 168 (27.5%) |
| Total | 2,290 (32.5%) | 3,133 (38.1%) |
Income Above Poverty by Sex and Age in Dublin
According to the poverty statistics in Dublin, males aged 65 to 74 years and females aged 35 to 44 years are the age groups that are most secure financially, with 92.9% of males and 83.3% of females in these age groups living above the poverty line.
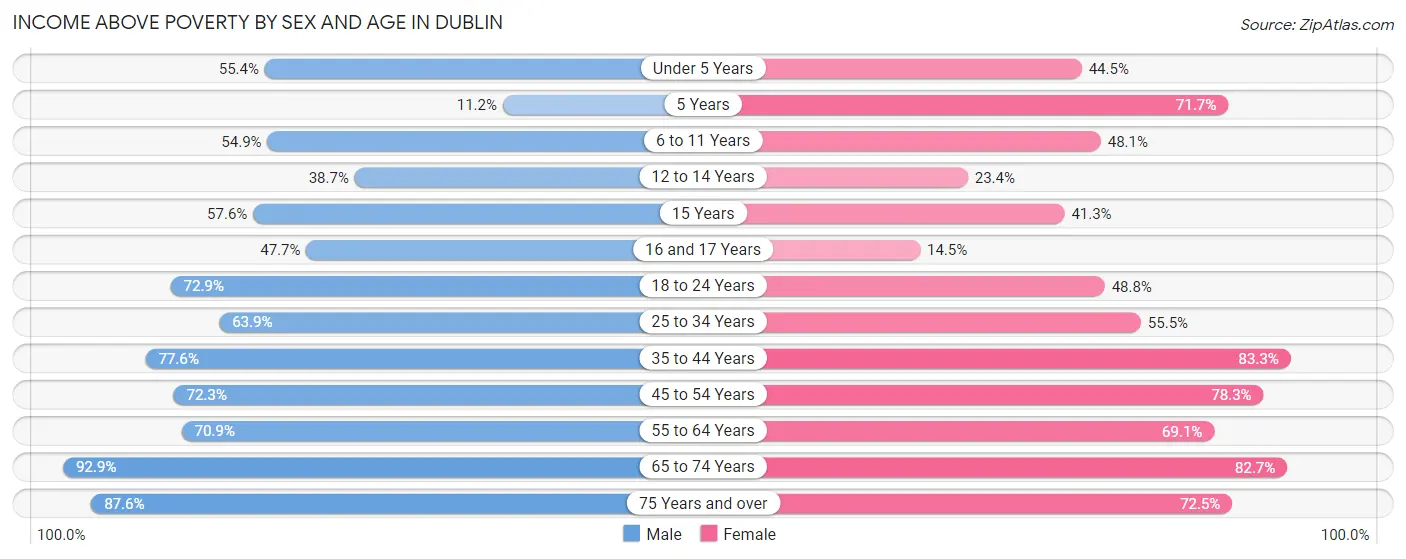
| Age Bracket | Male | Female |
| Under 5 Years | 373 (55.4%) | 257 (44.5%) |
| 5 Years | 10 (11.2%) | 114 (71.7%) |
| 6 to 11 Years | 407 (54.9%) | 237 (48.1%) |
| 12 to 14 Years | 139 (38.7%) | 105 (23.4%) |
| 15 Years | 76 (57.6%) | 31 (41.3%) |
| 16 and 17 Years | 52 (47.7%) | 25 (14.5%) |
| 18 to 24 Years | 476 (72.9%) | 365 (48.8%) |
| 25 to 34 Years | 709 (63.9%) | 789 (55.5%) |
| 35 to 44 Years | 449 (77.5%) | 614 (83.3%) |
| 45 to 54 Years | 599 (72.3%) | 774 (78.3%) |
| 55 to 64 Years | 511 (70.9%) | 736 (69.1%) |
| 65 to 74 Years | 612 (92.9%) | 605 (82.7%) |
| 75 Years and over | 354 (87.6%) | 442 (72.5%) |
| Total | 4,767 (67.5%) | 5,094 (61.9%) |
Income Below Poverty Among Married-Couple Families in Dublin
The poverty statistics for married-couple families in Dublin show that 14.3% or 255 of the total 1,787 families live below the poverty line. Families with 5 or more children have the highest poverty rate of 100.0%, comprising of 17 families. On the other hand, families with no children have the lowest poverty rate of 9.9%, which includes 113 families.
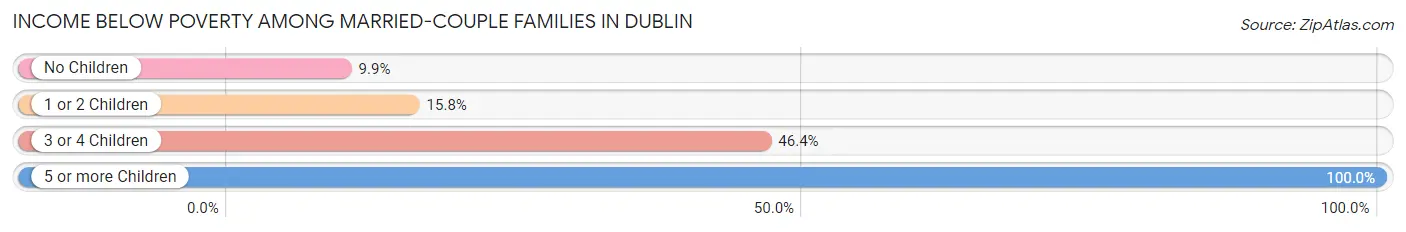
| Children | Above Poverty | Below Poverty |
| No Children | 1,029 (90.1%) | 113 (9.9%) |
| 1 or 2 Children | 458 (84.2%) | 86 (15.8%) |
| 3 or 4 Children | 45 (53.6%) | 39 (46.4%) |
| 5 or more Children | 0 (0.0%) | 17 (100.0%) |
| Total | 1,532 (85.7%) | 255 (14.3%) |
Income Below Poverty Among Single-Parent Households in Dublin
According to the poverty data in Dublin, 15.8% or 61 single-father households and 47.5% or 701 single-mother households are living below the poverty line. Among single-father households, those with 3 or 4 children have the highest poverty rate, with 57 households (77.0%) experiencing poverty. Likewise, among single-mother households, those with 5 or more children have the highest poverty rate, with 112 households (91.8%) falling below the poverty line.
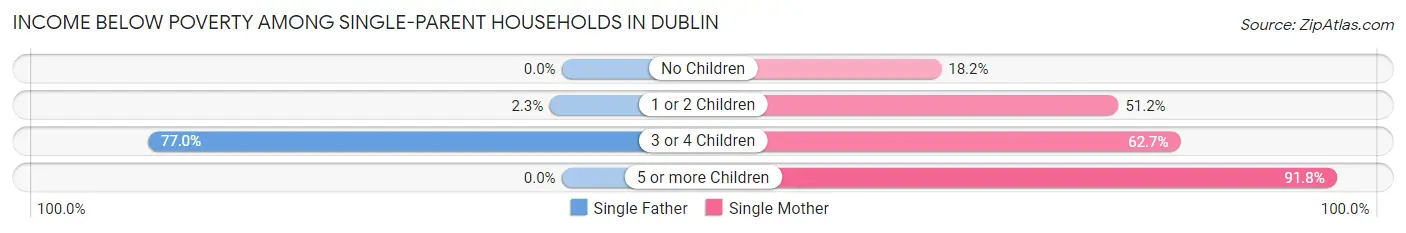
| Children | Single Father | Single Mother |
| No Children | 0 (0.0%) | 74 (18.2%) |
| 1 or 2 Children | 4 (2.3%) | 347 (51.2%) |
| 3 or 4 Children | 57 (77.0%) | 168 (62.7%) |
| 5 or more Children | 0 (0.0%) | 112 (91.8%) |
| Total | 61 (15.8%) | 701 (47.5%) |
Income Below Poverty Among Married-Couple vs Single-Parent Households in Dublin
The poverty data for Dublin shows that 255 of the married-couple family households (14.3%) and 762 of the single-parent households (40.9%) are living below the poverty level. Within the married-couple family households, those with 5 or more children have the highest poverty rate, with 17 households (100.0%) falling below the poverty line. Among the single-parent households, those with 5 or more children have the highest poverty rate, with 112 household (91.8%) living below poverty.
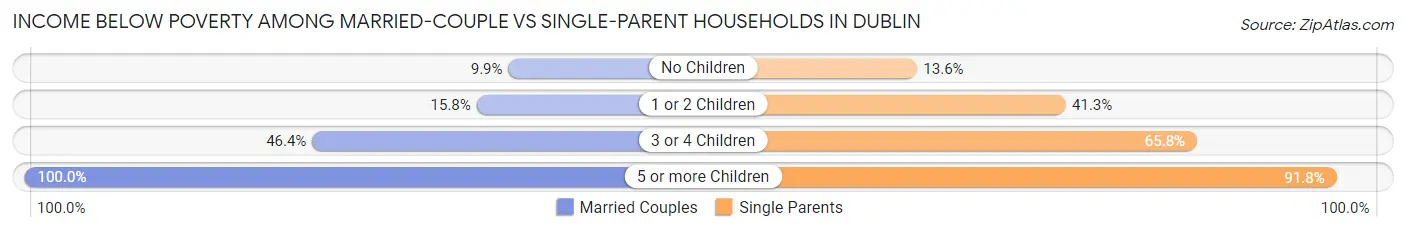
| Children | Married-Couple Families | Single-Parent Households |
| No Children | 113 (9.9%) | 74 (13.6%) |
| 1 or 2 Children | 86 (15.8%) | 351 (41.2%) |
| 3 or 4 Children | 39 (46.4%) | 225 (65.8%) |
| 5 or more Children | 17 (100.0%) | 112 (91.8%) |
| Total | 255 (14.3%) | 762 (40.9%) |
Race in Dublin
The most populous races in Dublin are Black / African American (10,560 | 66.1%), White / Caucasian (4,788 | 29.9%), and Asian (407 | 2.5%).
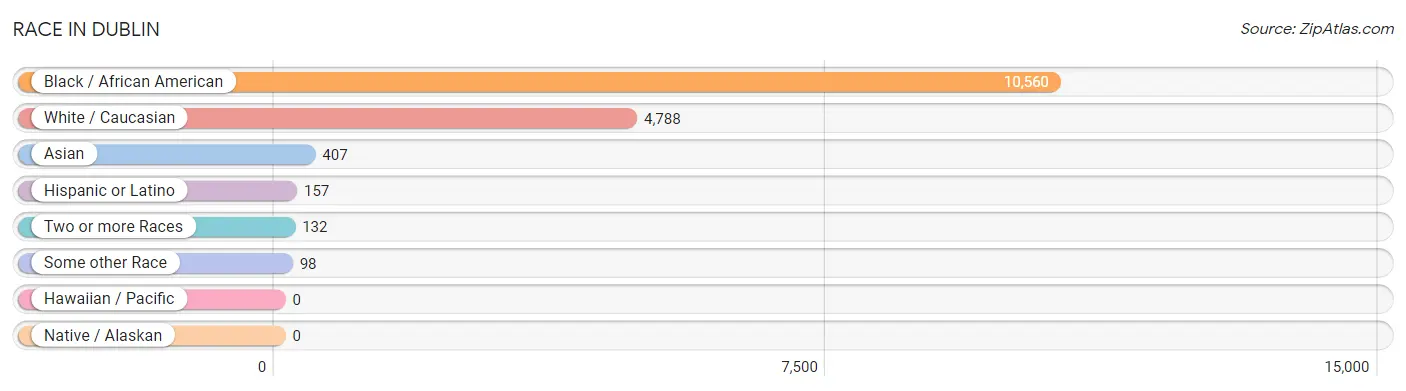
| Race | # Population | % Population |
| Asian | 407 | 2.5% |
| Black / African American | 10,560 | 66.1% |
| Hawaiian / Pacific | 0 | 0.0% |
| Hispanic or Latino | 157 | 1.0% |
| Native / Alaskan | 0 | 0.0% |
| White / Caucasian | 4,788 | 29.9% |
| Two or more Races | 132 | 0.8% |
| Some other Race | 98 | 0.6% |
| Total | 15,985 | 100.0% |
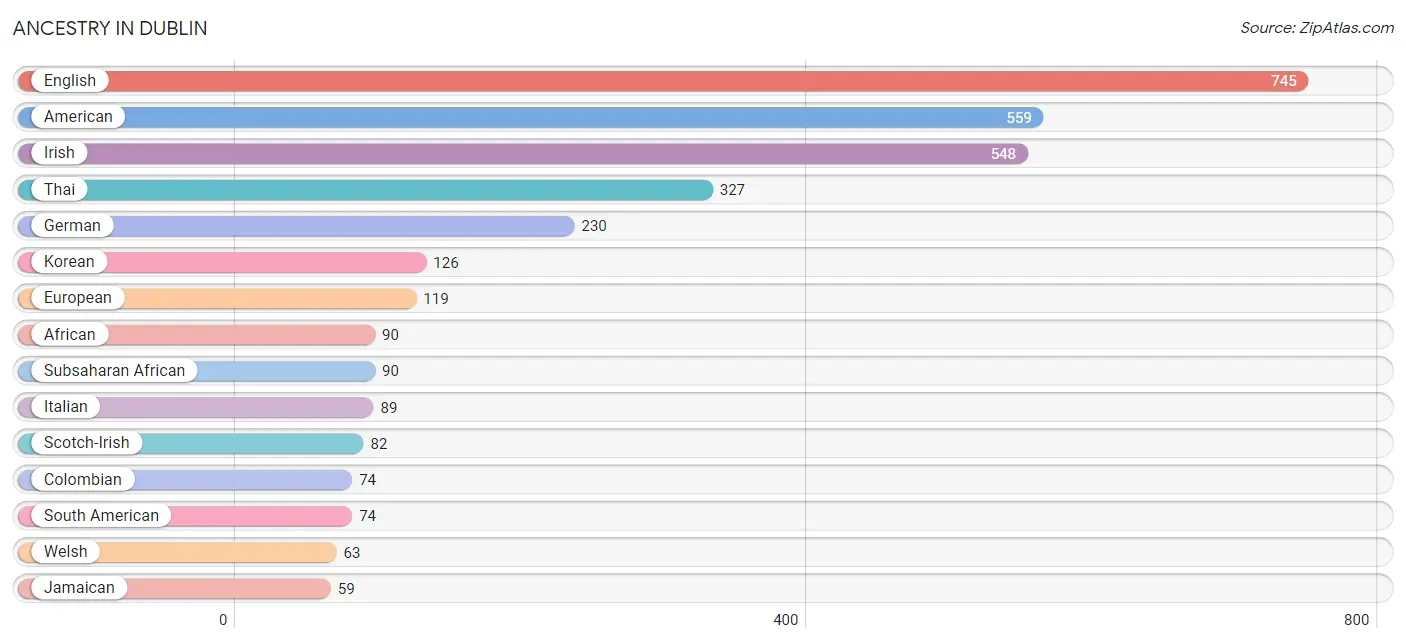
Ancestry in Dublin
The most populous ancestries reported in Dublin are English (745 | 4.7%), American (559 | 3.5%), Irish (548 | 3.4%), Thai (327 | 2.1%), and German (230 | 1.4%), together accounting for 15.1% of all Dublin residents.
| Ancestry | # Population | % Population |
| African | 90 | 0.6% |
| American | 559 | 3.5% |
| British | 22 | 0.1% |
| Canadian | 6 | 0.0% |
| Cherokee | 19 | 0.1% |
| Choctaw | 11 | 0.1% |
| Colombian | 74 | 0.5% |
| Cuban | 2 | 0.0% |
| Eastern European | 6 | 0.0% |
| English | 745 | 4.7% |
| European | 119 | 0.7% |
| Finnish | 53 | 0.3% |
| French | 44 | 0.3% |
| German | 230 | 1.4% |
| Hungarian | 16 | 0.1% |
| Irish | 548 | 3.4% |
| Italian | 89 | 0.6% |
| Jamaican | 59 | 0.4% |
| Korean | 126 | 0.8% |
| Mexican | 31 | 0.2% |
| Northern European | 4 | 0.0% |
| Norwegian | 36 | 0.2% |
| Pennsylvania German | 7 | 0.0% |
| Polish | 12 | 0.1% |
| Puerto Rican | 29 | 0.2% |
| Russian | 24 | 0.2% |
| Scotch-Irish | 82 | 0.5% |
| Scottish | 52 | 0.3% |
| South American | 74 | 0.5% |
| Spaniard | 1 | 0.0% |
| Subsaharan African | 90 | 0.6% |
| Swedish | 9 | 0.1% |
| Swiss | 15 | 0.1% |
| Thai | 327 | 2.1% |
| U.S. Virgin Islander | 32 | 0.2% |
| Welsh | 63 | 0.4% | View All 36 Rows |
Immigrants in Dublin
The most numerous immigrant groups reported in Dublin came from Asia (185 | 1.2%), India (164 | 1.0%), South Central Asia (164 | 1.0%), Latin America (47 | 0.3%), and Europe (35 | 0.2%), together accounting for 3.7% of all Dublin residents.
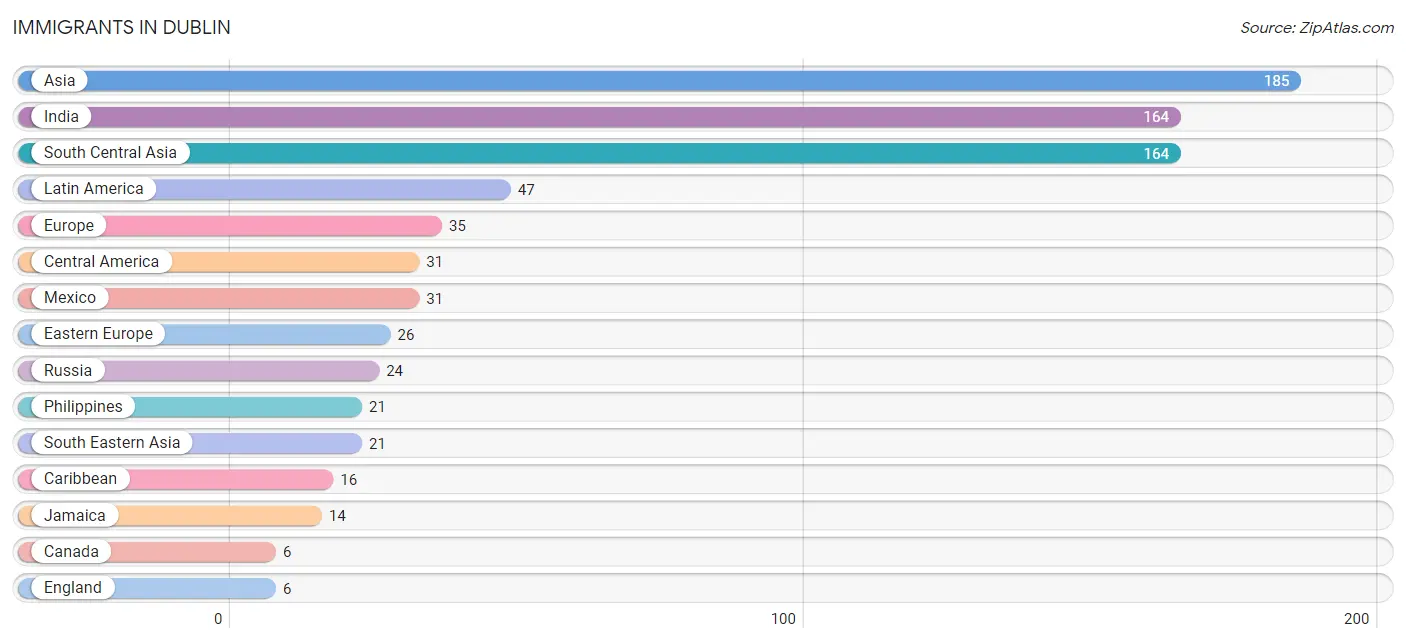
| Immigration Origin | # Population | % Population |
| Africa | 5 | 0.0% |
| Asia | 185 | 1.2% |
| Canada | 6 | 0.0% |
| Caribbean | 16 | 0.1% |
| Central America | 31 | 0.2% |
| Cuba | 2 | 0.0% |
| Eastern Africa | 5 | 0.0% |
| Eastern Europe | 26 | 0.2% |
| England | 6 | 0.0% |
| Europe | 35 | 0.2% |
| Germany | 3 | 0.0% |
| Hungary | 2 | 0.0% |
| India | 164 | 1.0% |
| Jamaica | 14 | 0.1% |
| Latin America | 47 | 0.3% |
| Mexico | 31 | 0.2% |
| Northern Europe | 6 | 0.0% |
| Philippines | 21 | 0.1% |
| Russia | 24 | 0.2% |
| South Central Asia | 164 | 1.0% |
| South Eastern Asia | 21 | 0.1% |
| Western Europe | 3 | 0.0% |
| Zimbabwe | 5 | 0.0% | View All 23 Rows |
Sex and Age in Dublin
Sex and Age in Dublin
The most populous age groups in Dublin are Under 5 Years (673 | 8.9%) for men and 30 to 34 Years (784 | 9.3%) for women.
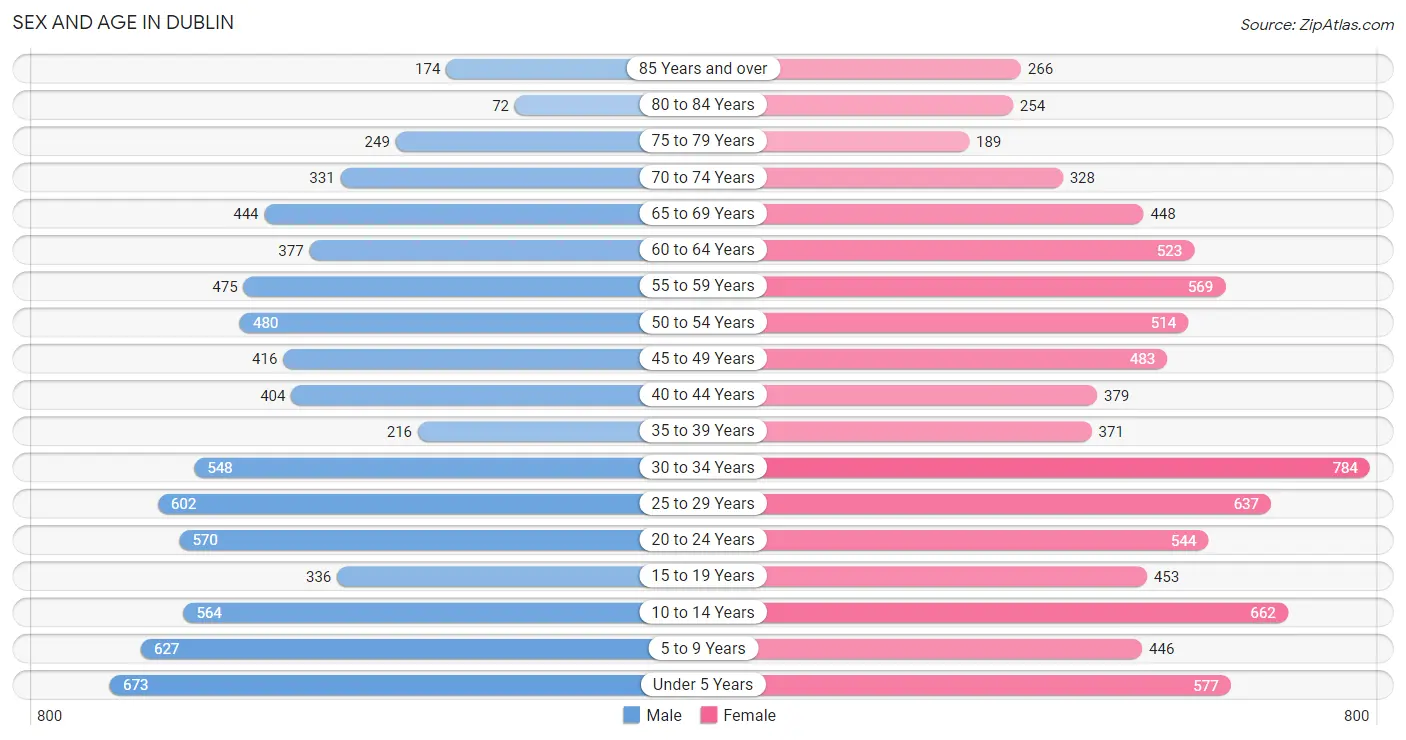
| Age Bracket | Male | Female |
| Under 5 Years | 673 (8.9%) | 577 (6.9%) |
| 5 to 9 Years | 627 (8.3%) | 446 (5.3%) |
| 10 to 14 Years | 564 (7.5%) | 662 (7.9%) |
| 15 to 19 Years | 336 (4.4%) | 453 (5.4%) |
| 20 to 24 Years | 570 (7.5%) | 544 (6.5%) |
| 25 to 29 Years | 602 (8.0%) | 637 (7.6%) |
| 30 to 34 Years | 548 (7.2%) | 784 (9.3%) |
| 35 to 39 Years | 216 (2.9%) | 371 (4.4%) |
| 40 to 44 Years | 404 (5.3%) | 379 (4.5%) |
| 45 to 49 Years | 416 (5.5%) | 483 (5.7%) |
| 50 to 54 Years | 480 (6.4%) | 514 (6.1%) |
| 55 to 59 Years | 475 (6.3%) | 569 (6.8%) |
| 60 to 64 Years | 377 (5.0%) | 523 (6.2%) |
| 65 to 69 Years | 444 (5.9%) | 448 (5.3%) |
| 70 to 74 Years | 331 (4.4%) | 328 (3.9%) |
| 75 to 79 Years | 249 (3.3%) | 189 (2.2%) |
| 80 to 84 Years | 72 (0.9%) | 254 (3.0%) |
| 85 Years and over | 174 (2.3%) | 266 (3.2%) |
| Total | 7,558 (100.0%) | 8,427 (100.0%) |
Families and Households in Dublin
Median Family Size in Dublin
The median family size in Dublin is 3.43 persons per family, with single female/mother families (1,475 | 40.4%) accounting for the largest median family size of 3.82 persons per family. On the other hand, single male/father families (386 | 10.6%) represent the smallest median family size with 3.00 persons per family.
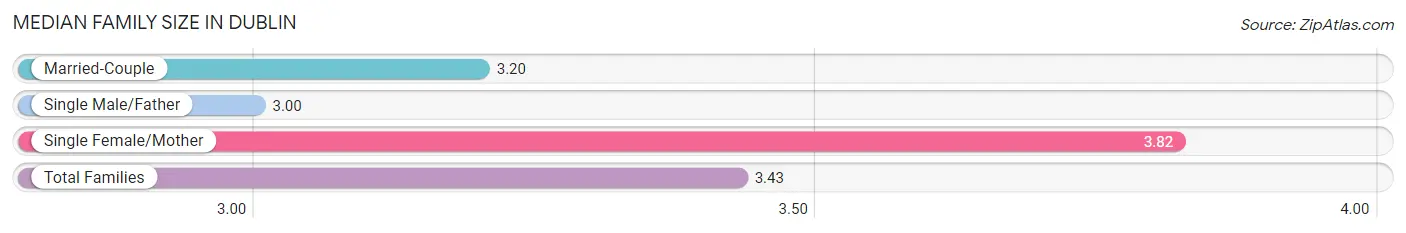
| Family Type | # Families | Family Size |
| Married-Couple | 1,787 (49.0%) | 3.20 |
| Single Male/Father | 386 (10.6%) | 3.00 |
| Single Female/Mother | 1,475 (40.4%) | 3.82 |
| Total Families | 3,648 (100.0%) | 3.43 |
Median Household Size in Dublin
The median household size in Dublin is 2.66 persons per household, with single female/mother households (1,475 | 25.8%) accounting for the largest median household size of 3.93 persons per household. non-family households (2,061 | 36.1%) represent the smallest median household size with 1.16 persons per household.
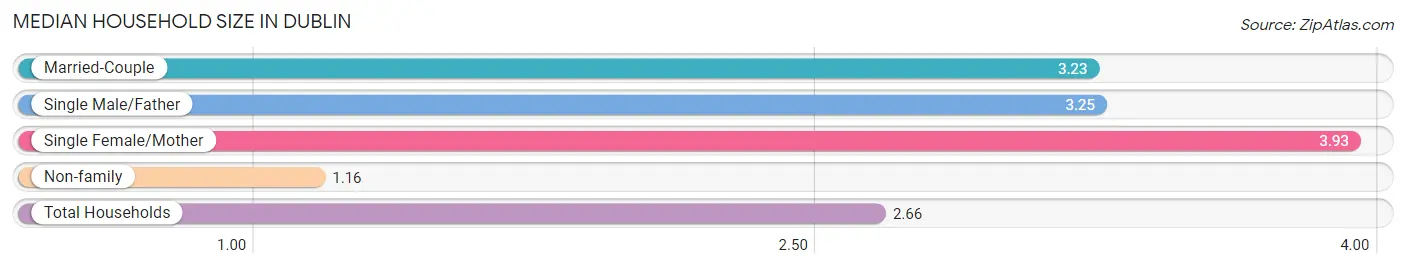
| Household Type | # Households | Household Size |
| Married-Couple | 1,787 (31.3%) | 3.23 |
| Single Male/Father | 386 (6.8%) | 3.25 |
| Single Female/Mother | 1,475 (25.8%) | 3.93 |
| Non-family | 2,061 (36.1%) | 1.16 |
| Total Households | 5,709 (100.0%) | 2.66 |
Household Size by Marriage Status in Dublin
Out of a total of 5,709 households in Dublin, 3,648 (63.9%) are family households, while 2,061 (36.1%) are nonfamily households. The most numerous type of family households are 2-person households, comprising 1,574, and the most common type of nonfamily households are 1-person households, comprising 1,888.
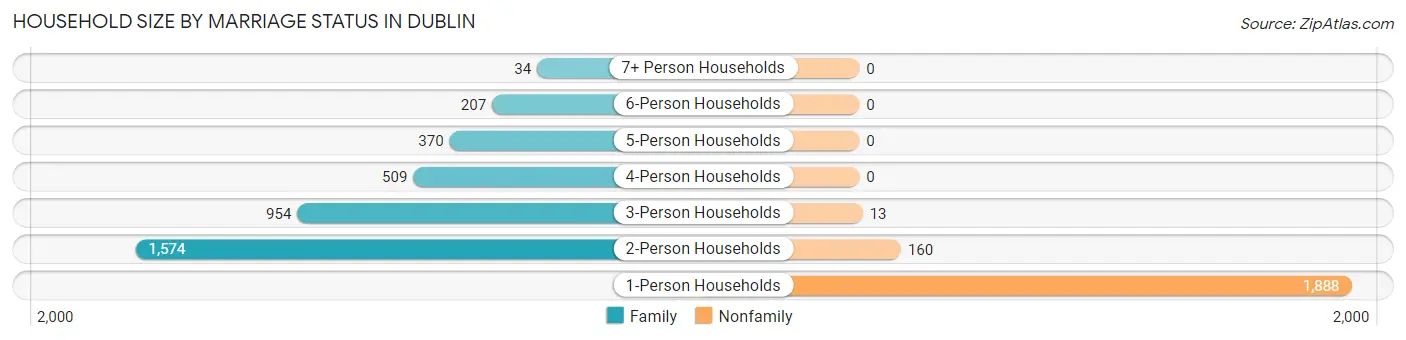
| Household Size | Family Households | Nonfamily Households |
| 1-Person Households | - | 1,888 (33.1%) |
| 2-Person Households | 1,574 (27.6%) | 160 (2.8%) |
| 3-Person Households | 954 (16.7%) | 13 (0.2%) |
| 4-Person Households | 509 (8.9%) | 0 (0.0%) |
| 5-Person Households | 370 (6.5%) | 0 (0.0%) |
| 6-Person Households | 207 (3.6%) | 0 (0.0%) |
| 7+ Person Households | 34 (0.6%) | 0 (0.0%) |
| Total | 3,648 (63.9%) | 2,061 (36.1%) |
Female Fertility in Dublin
Fertility by Age in Dublin
Average fertility rate in Dublin is 29.0 births per 1,000 women. Women in the age bracket of 15 to 19 years have the highest fertility rate with 40.0 births per 1,000 women. Women in the age bracket of 20 to 34 years acount for 69.0% of all women with births.
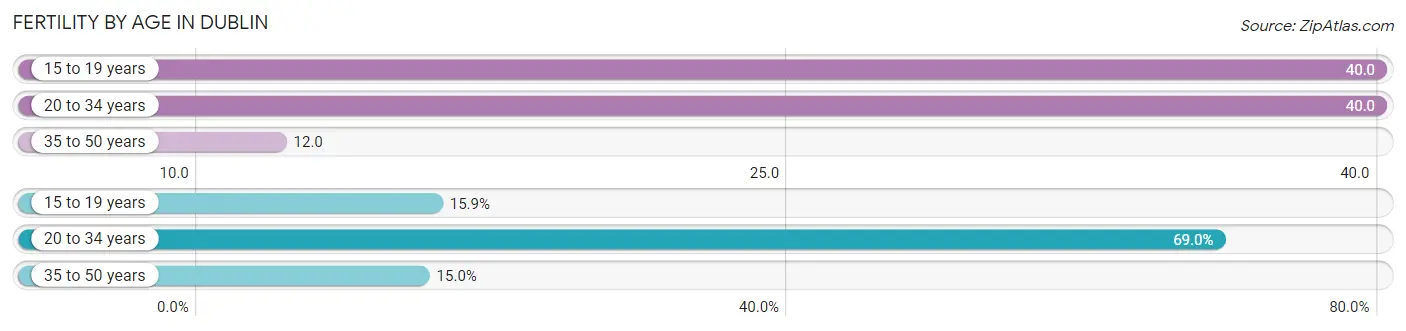
| Age Bracket | Women with Births | Births / 1,000 Women |
| 15 to 19 years | 18 (15.9%) | 40.0 |
| 20 to 34 years | 78 (69.0%) | 40.0 |
| 35 to 50 years | 17 (15.0%) | 12.0 |
| Total | 113 (100.0%) | 29.0 |
Fertility by Age by Marriage Status in Dublin
15.0% of women with births (113) in Dublin are married. The highest percentage of unmarried women with births falls into 15 to 19 years age bracket with 100.0% of them unmarried at the time of birth, while the lowest percentage of unmarried women with births belong to 35 to 50 years age bracket with 0.0% of them unmarried.
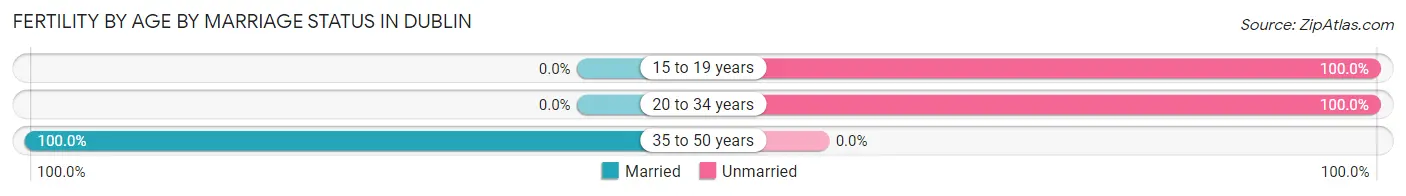
| Age Bracket | Married | Unmarried |
| 15 to 19 years | 0 (0.0%) | 18 (100.0%) |
| 20 to 34 years | 0 (0.0%) | 78 (100.0%) |
| 35 to 50 years | 17 (100.0%) | 0 (0.0%) |
| Total | 17 (15.0%) | 96 (85.0%) |
Fertility by Education in Dublin
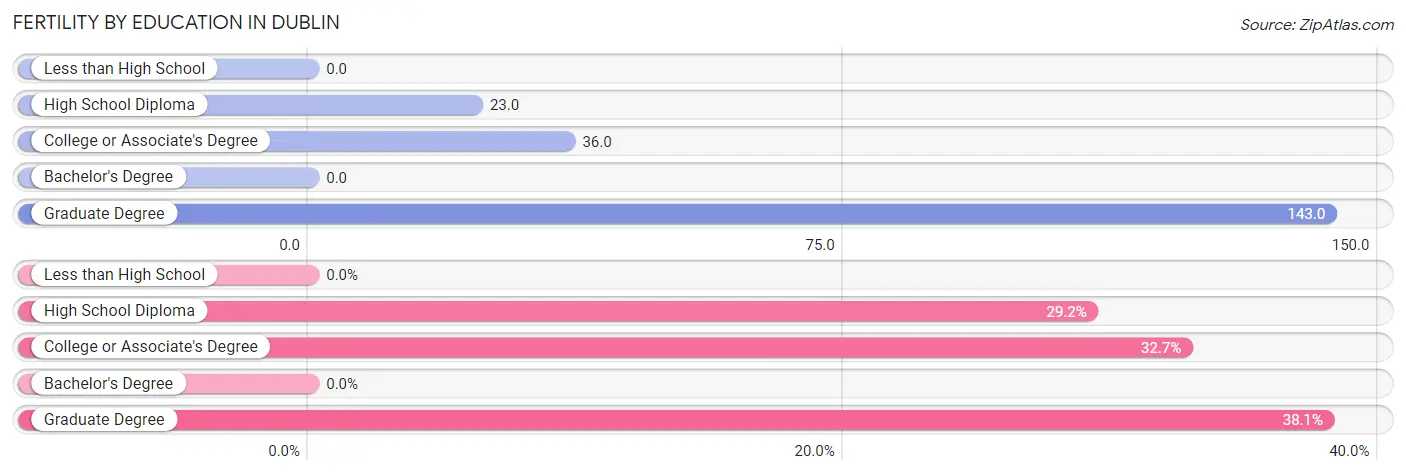
| Educational Attainment | Women with Births | Births / 1,000 Women |
| Less than High School | 0 (0.0%) | 0.0 |
| High School Diploma | 33 (29.2%) | 23.0 |
| College or Associate's Degree | 37 (32.7%) | 36.0 |
| Bachelor's Degree | 0 (0.0%) | 0.0 |
| Graduate Degree | 43 (38.1%) | 143.0 |
| Total | 113 (100.0%) | 29.0 |
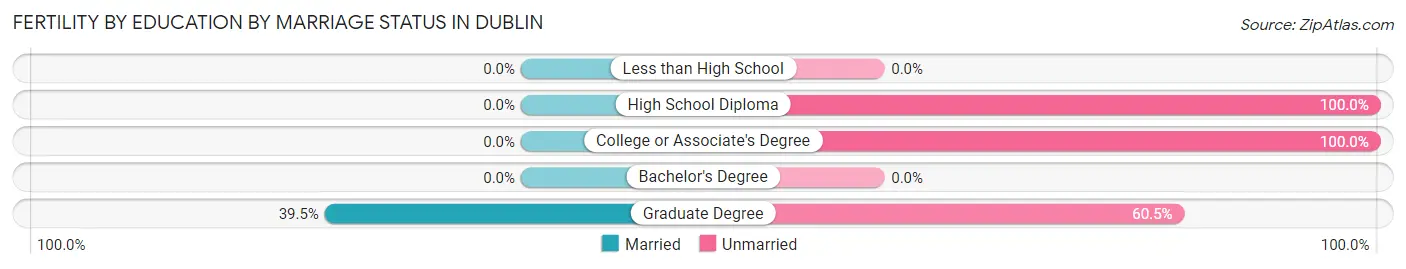
Fertility by Education by Marriage Status in Dublin
85.0% of women with births in Dublin are unmarried. Women with the educational attainment of graduate degree are most likely to be married with 39.5% of them married at childbirth, while women with the educational attainment of high school diploma are least likely to be married with 100.0% of them unmarried at childbirth.
| Educational Attainment | Married | Unmarried |
| Less than High School | 0 (0.0%) | 0 (0.0%) |
| High School Diploma | 0 (0.0%) | 33 (100.0%) |
| College or Associate's Degree | 0 (0.0%) | 37 (100.0%) |
| Bachelor's Degree | 0 (0.0%) | 0 (0.0%) |
| Graduate Degree | 17 (39.5%) | 26 (60.5%) |
| Total | 17 (15.0%) | 96 (85.0%) |
Employment Characteristics in Dublin
Employment by Class of Employer in Dublin
Among the 5,163 employed individuals in Dublin, private company employees (3,114 | 60.3%), not-for-profit organizations (877 | 17.0%), and state government employees (416 | 8.1%) make up the most common classes of employment.
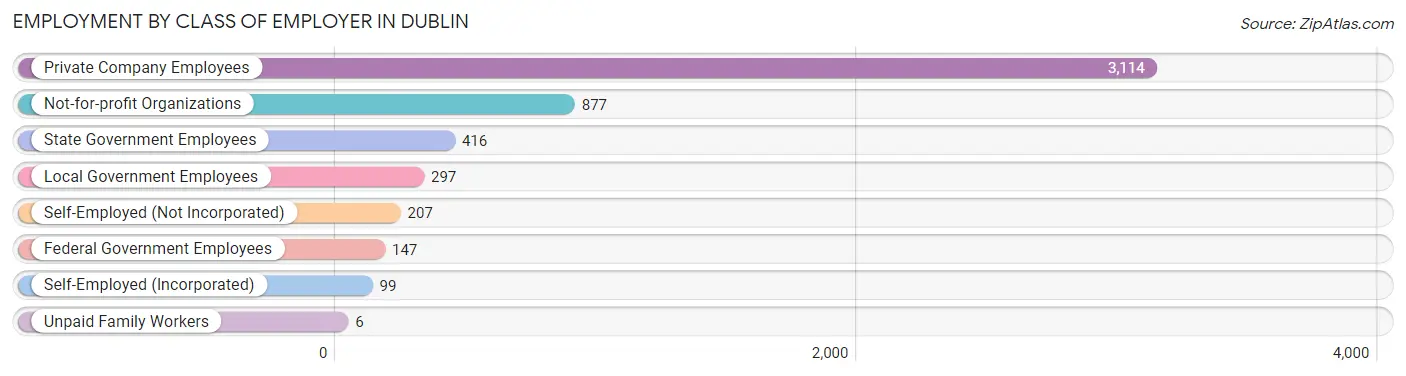
| Employer Class | # Employees | % Employees |
| Private Company Employees | 3,114 | 60.3% |
| Self-Employed (Incorporated) | 99 | 1.9% |
| Self-Employed (Not Incorporated) | 207 | 4.0% |
| Not-for-profit Organizations | 877 | 17.0% |
| Local Government Employees | 297 | 5.8% |
| State Government Employees | 416 | 8.1% |
| Federal Government Employees | 147 | 2.9% |
| Unpaid Family Workers | 6 | 0.1% |
| Total | 5,163 | 100.0% |
Employment Status by Age in Dublin
According to the labor force statistics for Dublin, out of the total population over 16 years of age (12,229), 47.4% or 5,797 individuals are in the labor force, with 7.5% or 435 of them unemployed. The age group with the highest labor force participation rate is 45 to 54 years, with 71.3% or 1,350 individuals in the labor force. Within the labor force, the 16 to 19 years age range has the highest percentage of unemployed individuals, with 25.7% or 27 of them being unemployed.
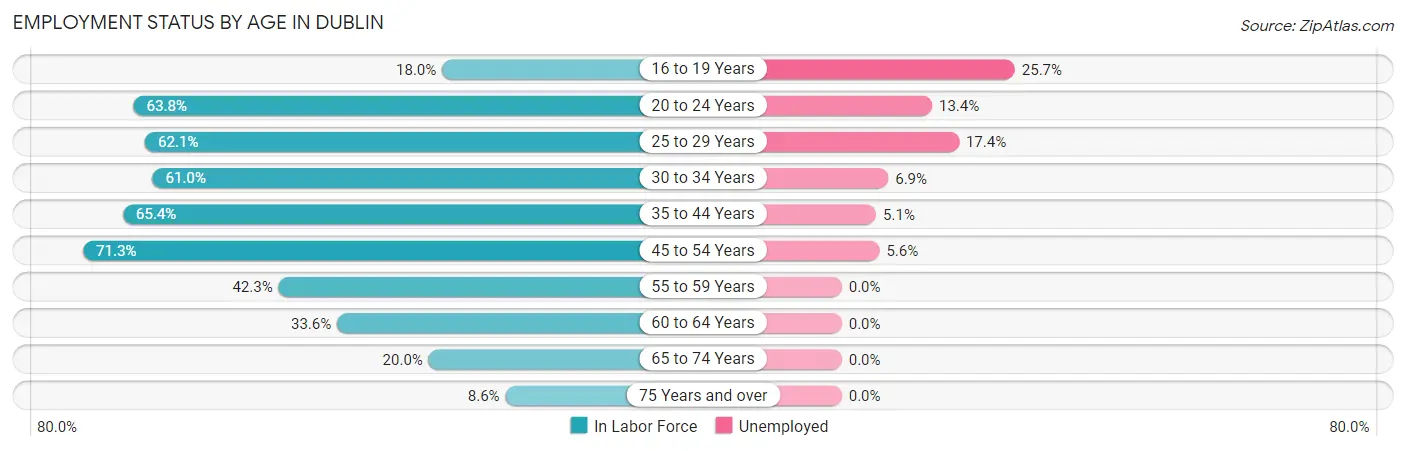
| Age Bracket | In Labor Force | Unemployed |
| 16 to 19 Years | 105 (18.0%) | 27 (25.7%) |
| 20 to 24 Years | 711 (63.8%) | 95 (13.4%) |
| 25 to 29 Years | 769 (62.1%) | 134 (17.4%) |
| 30 to 34 Years | 813 (61.0%) | 56 (6.9%) |
| 35 to 44 Years | 896 (65.4%) | 46 (5.1%) |
| 45 to 54 Years | 1,350 (71.3%) | 76 (5.6%) |
| 55 to 59 Years | 442 (42.3%) | 0 (0.0%) |
| 60 to 64 Years | 302 (33.6%) | 0 (0.0%) |
| 65 to 74 Years | 310 (20.0%) | 0 (0.0%) |
| 75 Years and over | 104 (8.6%) | 0 (0.0%) |
| Total | 5,797 (47.4%) | 435 (7.5%) |
Employment Status by Educational Attainment in Dublin
According to labor force statistics for Dublin, 58.8% of individuals (4,573) out of the total population between 25 and 64 years of age (7,778) are in the labor force, with 6.8% or 311 of them being unemployed. The group with the highest labor force participation rate are those with the educational attainment of college / associate degree, with 74.2% or 1,310 individuals in the labor force. Within the labor force, individuals with high school diploma education have the highest percentage of unemployment, with 11.9% or 209 of them being unemployed.
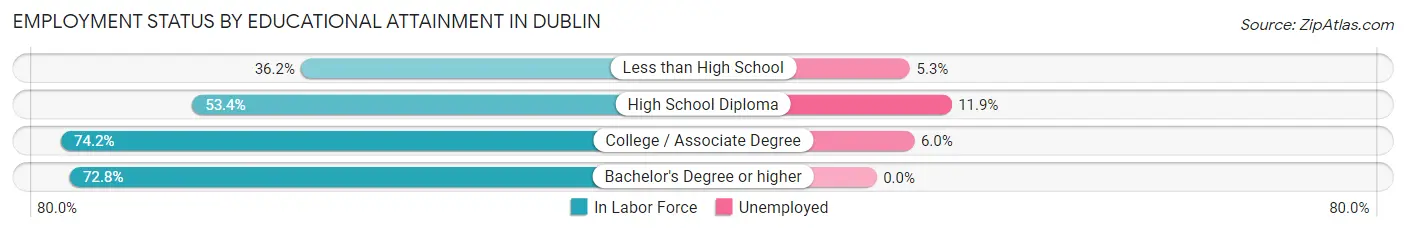
| Educational Attainment | In Labor Force | Unemployed |
| Less than High School | 470 (36.2%) | 69 (5.3%) |
| High School Diploma | 1,760 (53.4%) | 392 (11.9%) |
| College / Associate Degree | 1,310 (74.2%) | 106 (6.0%) |
| Bachelor's Degree or higher | 1,033 (72.8%) | 0 (0.0%) |
| Total | 4,573 (58.8%) | 529 (6.8%) |
Employment Occupations by Sex in Dublin
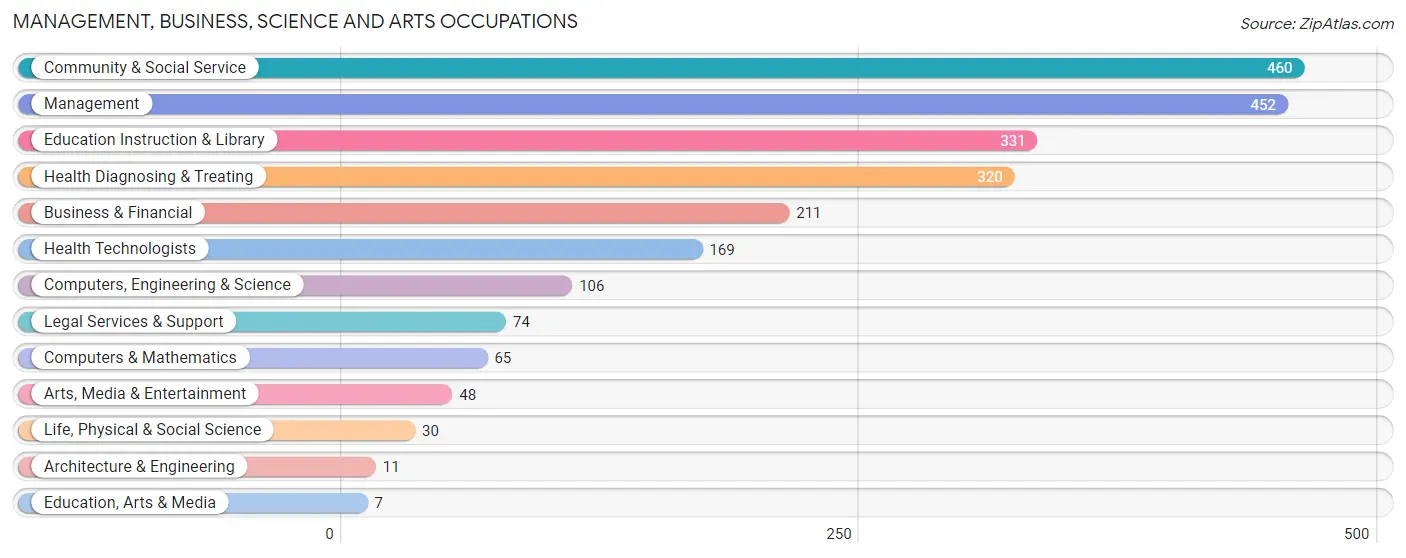
Management, Business, Science and Arts Occupations
The most common Management, Business, Science and Arts occupations in Dublin are Community & Social Service (460 | 8.6%), Management (452 | 8.4%), Education Instruction & Library (331 | 6.2%), Health Diagnosing & Treating (320 | 6.0%), and Business & Financial (211 | 3.9%).
Management, Business, Science and Arts Occupations by Sex
Within the Management, Business, Science and Arts occupations in Dublin, the most male-oriented occupations are Computers & Mathematics (100.0%), Life, Physical & Social Science (100.0%), and Arts, Media & Entertainment (100.0%), while the most female-oriented occupations are Education, Arts & Media (100.0%), Health Technologists (82.3%), and Education Instruction & Library (81.3%).
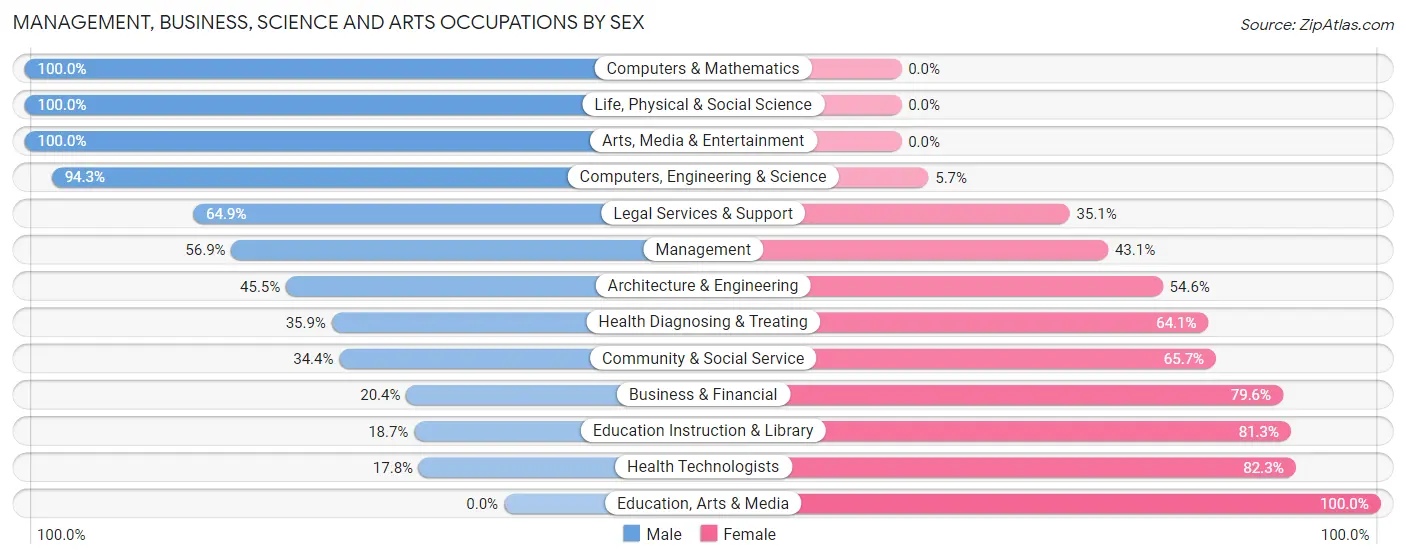
| Occupation | Male | Female |
| Management | 257 (56.9%) | 195 (43.1%) |
| Business & Financial | 43 (20.4%) | 168 (79.6%) |
| Computers, Engineering & Science | 100 (94.3%) | 6 (5.7%) |
| Computers & Mathematics | 65 (100.0%) | 0 (0.0%) |
| Architecture & Engineering | 5 (45.5%) | 6 (54.5%) |
| Life, Physical & Social Science | 30 (100.0%) | 0 (0.0%) |
| Community & Social Service | 158 (34.4%) | 302 (65.6%) |
| Education, Arts & Media | 0 (0.0%) | 7 (100.0%) |
| Legal Services & Support | 48 (64.9%) | 26 (35.1%) |
| Education Instruction & Library | 62 (18.7%) | 269 (81.3%) |
| Arts, Media & Entertainment | 48 (100.0%) | 0 (0.0%) |
| Health Diagnosing & Treating | 115 (35.9%) | 205 (64.1%) |
| Health Technologists | 30 (17.7%) | 139 (82.3%) |
| Total (Category) | 673 (43.4%) | 876 (56.6%) |
| Total (Overall) | 2,365 (44.1%) | 3,003 (55.9%) |
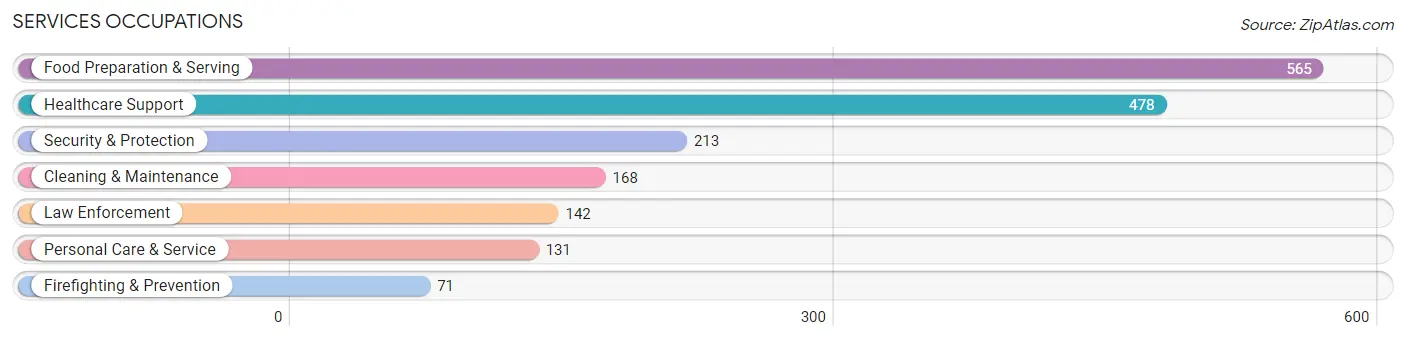
Services Occupations
The most common Services occupations in Dublin are Food Preparation & Serving (565 | 10.5%), Healthcare Support (478 | 8.9%), Security & Protection (213 | 4.0%), Cleaning & Maintenance (168 | 3.1%), and Law Enforcement (142 | 2.6%).
Services Occupations by Sex
Within the Services occupations in Dublin, the most male-oriented occupations are Firefighting & Prevention (60.6%), Security & Protection (54.5%), and Law Enforcement (51.4%), while the most female-oriented occupations are Food Preparation & Serving (82.8%), Healthcare Support (72.4%), and Cleaning & Maintenance (63.7%).
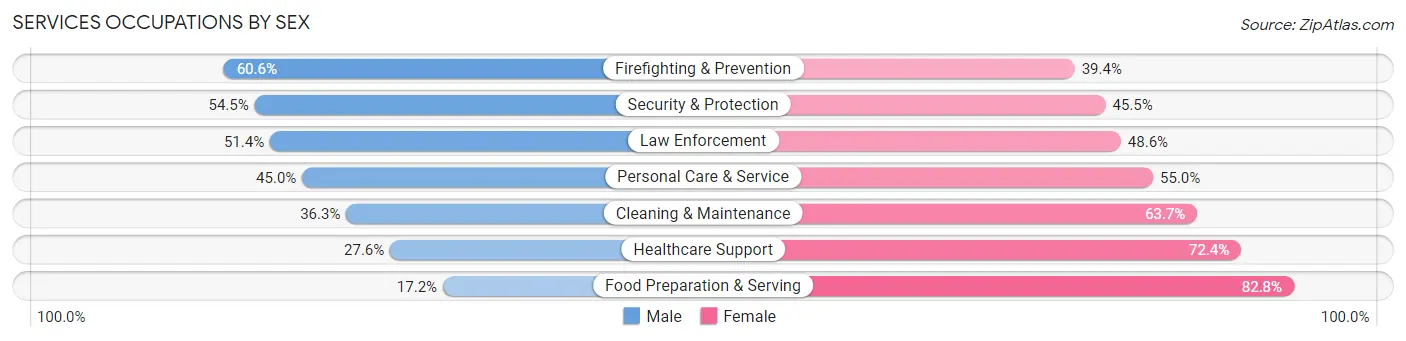
| Occupation | Male | Female |
| Healthcare Support | 132 (27.6%) | 346 (72.4%) |
| Security & Protection | 116 (54.5%) | 97 (45.5%) |
| Firefighting & Prevention | 43 (60.6%) | 28 (39.4%) |
| Law Enforcement | 73 (51.4%) | 69 (48.6%) |
| Food Preparation & Serving | 97 (17.2%) | 468 (82.8%) |
| Cleaning & Maintenance | 61 (36.3%) | 107 (63.7%) |
| Personal Care & Service | 59 (45.0%) | 72 (55.0%) |
| Total (Category) | 465 (29.9%) | 1,090 (70.1%) |
| Total (Overall) | 2,365 (44.1%) | 3,003 (55.9%) |
Sales and Office Occupations
The most common Sales and Office occupations in Dublin are Sales & Related (449 | 8.4%), and Office & Administration (363 | 6.8%).

Sales and Office Occupations by Sex
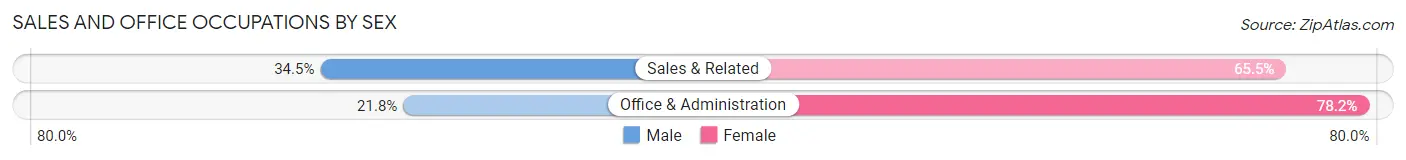
| Occupation | Male | Female |
| Sales & Related | 155 (34.5%) | 294 (65.5%) |
| Office & Administration | 79 (21.8%) | 284 (78.2%) |
| Total (Category) | 234 (28.8%) | 578 (71.2%) |
| Total (Overall) | 2,365 (44.1%) | 3,003 (55.9%) |
Natural Resources, Construction and Maintenance Occupations
The most common Natural Resources, Construction and Maintenance occupations in Dublin are Construction & Extraction (159 | 3.0%), Installation, Maintenance & Repair (135 | 2.5%), and Farming, Fishing & Forestry (6 | 0.1%).
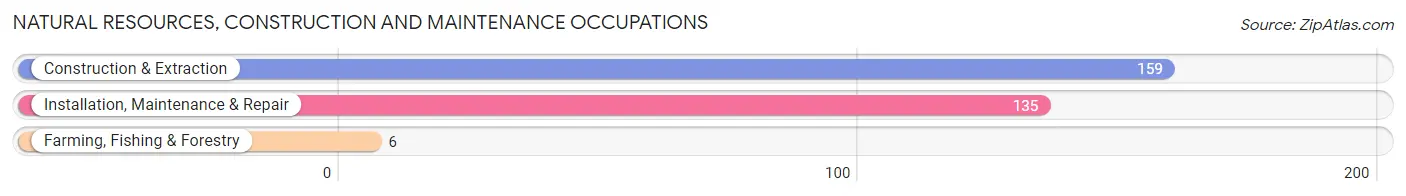
Natural Resources, Construction and Maintenance Occupations by Sex
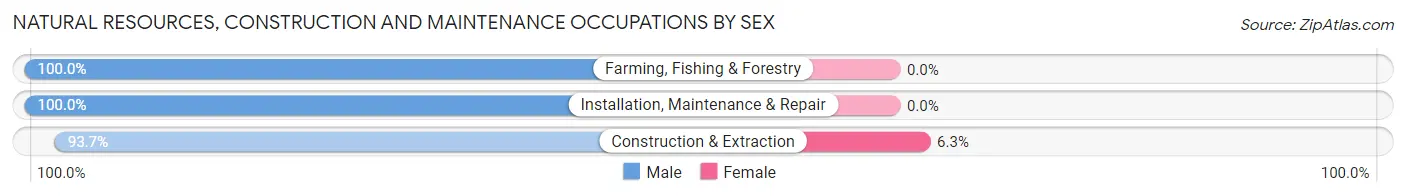
| Occupation | Male | Female |
| Farming, Fishing & Forestry | 6 (100.0%) | 0 (0.0%) |
| Construction & Extraction | 149 (93.7%) | 10 (6.3%) |
| Installation, Maintenance & Repair | 135 (100.0%) | 0 (0.0%) |
| Total (Category) | 290 (96.7%) | 10 (3.3%) |
| Total (Overall) | 2,365 (44.1%) | 3,003 (55.9%) |
Production, Transportation and Moving Occupations
The most common Production, Transportation and Moving occupations in Dublin are Production (458 | 8.5%), Material Moving (456 | 8.5%), and Transportation (238 | 4.4%).
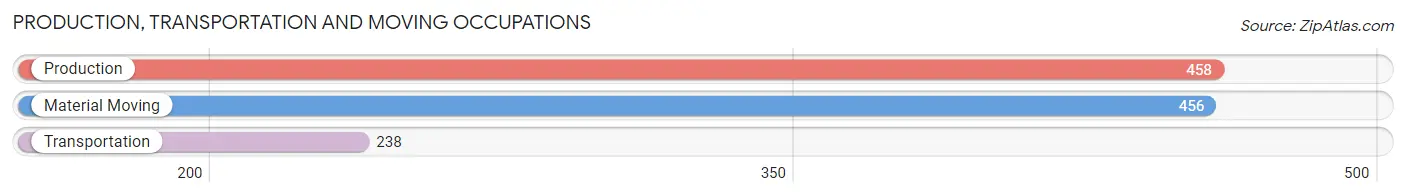
Production, Transportation and Moving Occupations by Sex
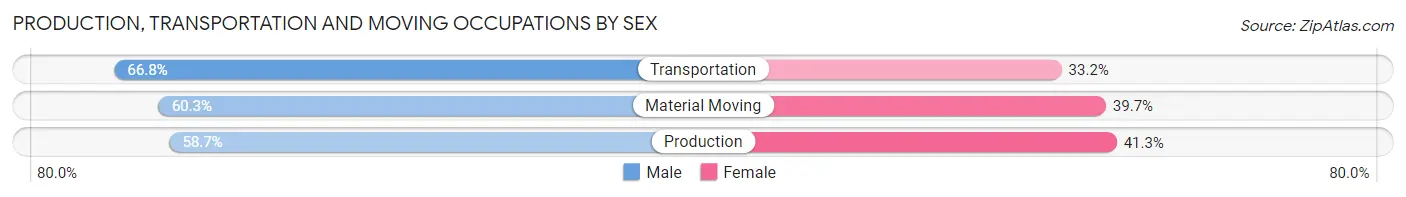
| Occupation | Male | Female |
| Production | 269 (58.7%) | 189 (41.3%) |
| Transportation | 159 (66.8%) | 79 (33.2%) |
| Material Moving | 275 (60.3%) | 181 (39.7%) |
| Total (Category) | 703 (61.0%) | 449 (39.0%) |
| Total (Overall) | 2,365 (44.1%) | 3,003 (55.9%) |
Employment Industries by Sex in Dublin
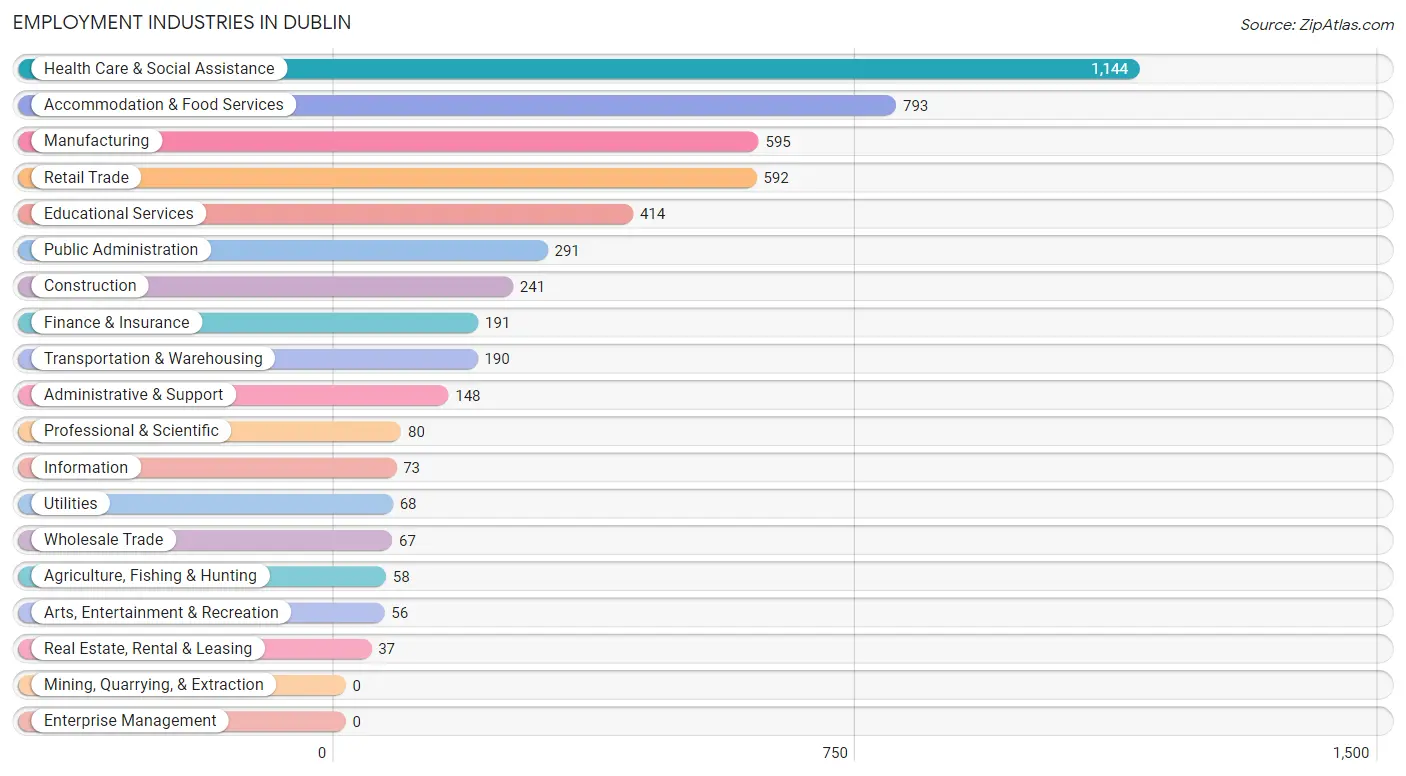
Employment Industries in Dublin
The major employment industries in Dublin include Health Care & Social Assistance (1,144 | 21.3%), Accommodation & Food Services (793 | 14.8%), Manufacturing (595 | 11.1%), Retail Trade (592 | 11.0%), and Educational Services (414 | 7.7%).
Employment Industries by Sex in Dublin
The Dublin industries that see more men than women are Agriculture, Fishing & Hunting (100.0%), Construction (95.9%), and Arts, Entertainment & Recreation (87.5%), whereas the industries that tend to have a higher number of women are Accommodation & Food Services (80.8%), Health Care & Social Assistance (75.7%), and Finance & Insurance (69.6%).
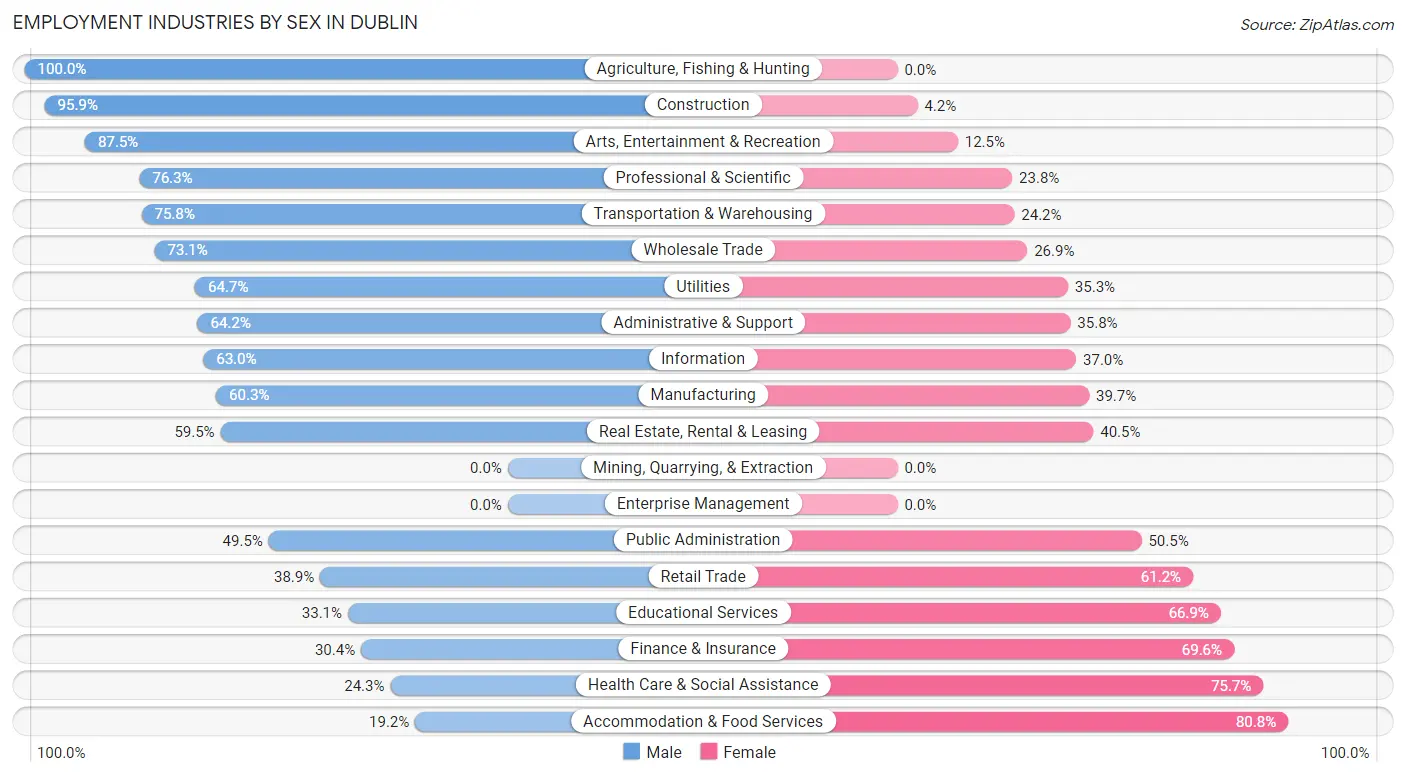
| Industry | Male | Female |
| Agriculture, Fishing & Hunting | 58 (100.0%) | 0 (0.0%) |
| Mining, Quarrying, & Extraction | 0 (0.0%) | 0 (0.0%) |
| Construction | 231 (95.9%) | 10 (4.2%) |
| Manufacturing | 359 (60.3%) | 236 (39.7%) |
| Wholesale Trade | 49 (73.1%) | 18 (26.9%) |
| Retail Trade | 230 (38.9%) | 362 (61.2%) |
| Transportation & Warehousing | 144 (75.8%) | 46 (24.2%) |
| Utilities | 44 (64.7%) | 24 (35.3%) |
| Information | 46 (63.0%) | 27 (37.0%) |
| Finance & Insurance | 58 (30.4%) | 133 (69.6%) |
| Real Estate, Rental & Leasing | 22 (59.5%) | 15 (40.5%) |
| Professional & Scientific | 61 (76.2%) | 19 (23.7%) |
| Enterprise Management | 0 (0.0%) | 0 (0.0%) |
| Administrative & Support | 95 (64.2%) | 53 (35.8%) |
| Educational Services | 137 (33.1%) | 277 (66.9%) |
| Health Care & Social Assistance | 278 (24.3%) | 866 (75.7%) |
| Arts, Entertainment & Recreation | 49 (87.5%) | 7 (12.5%) |
| Accommodation & Food Services | 152 (19.2%) | 641 (80.8%) |
| Public Administration | 144 (49.5%) | 147 (50.5%) |
| Total | 2,365 (44.1%) | 3,003 (55.9%) |
Education in Dublin
School Enrollment in Dublin
The most common levels of schooling among the 3,595 students in Dublin are high school (827 | 23.0%), elementary school (765 | 21.3%), and middle school (675 | 18.8%).
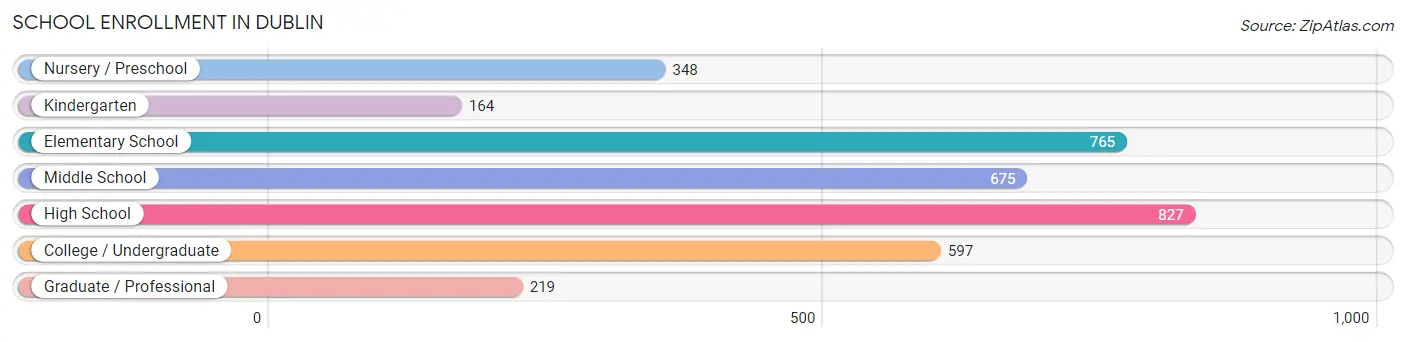
| School Level | # Students | % Students |
| Nursery / Preschool | 348 | 9.7% |
| Kindergarten | 164 | 4.6% |
| Elementary School | 765 | 21.3% |
| Middle School | 675 | 18.8% |
| High School | 827 | 23.0% |
| College / Undergraduate | 597 | 16.6% |
| Graduate / Professional | 219 | 6.1% |
| Total | 3,595 | 100.0% |
School Enrollment by Age by Funding Source in Dublin
Out of a total of 3,595 students who are enrolled in schools in Dublin, 424 (11.8%) attend a private institution, while the remaining 3,171 (88.2%) are enrolled in public schools. The age group of 35 years and over has the highest likelihood of being enrolled in private schools, with 75 (35.5% in the age bracket) enrolled. Conversely, the age group of 5 to 9 year old has the lowest likelihood of being enrolled in a private school, with 936 (95.2% in the age bracket) attending a public institution.
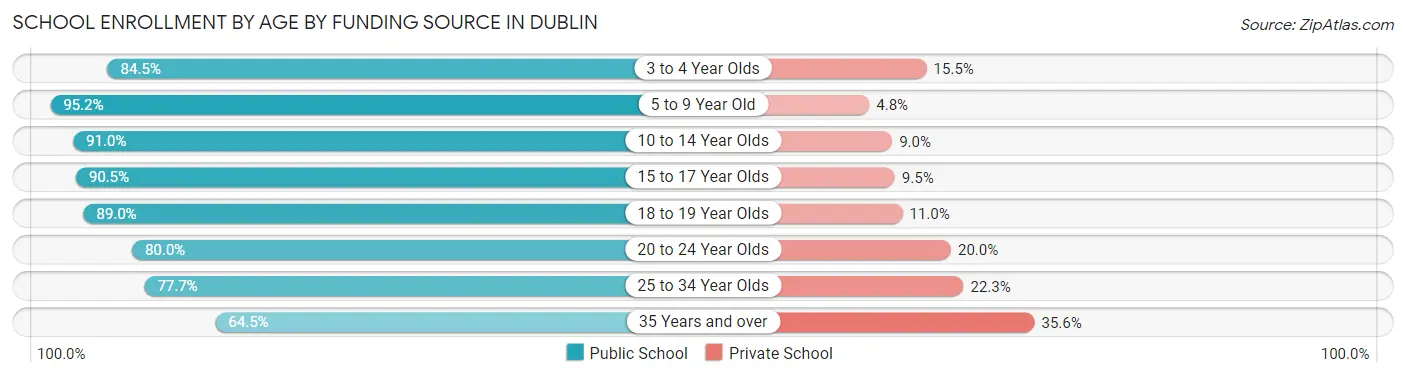
| Age Bracket | Public School | Private School |
| 3 to 4 Year Olds | 164 (84.5%) | 30 (15.5%) |
| 5 to 9 Year Old | 936 (95.2%) | 47 (4.8%) |
| 10 to 14 Year Olds | 865 (91.0%) | 86 (9.0%) |
| 15 to 17 Year Olds | 436 (90.5%) | 46 (9.5%) |
| 18 to 19 Year Olds | 203 (89.0%) | 25 (11.0%) |
| 20 to 24 Year Olds | 272 (80.0%) | 68 (20.0%) |
| 25 to 34 Year Olds | 160 (77.7%) | 46 (22.3%) |
| 35 Years and over | 136 (64.4%) | 75 (35.5%) |
| Total | 3,171 (88.2%) | 424 (11.8%) |
Educational Attainment by Field of Study in Dublin
Education (505 | 21.7%), business (397 | 17.1%), arts & humanities (251 | 10.8%), social sciences (194 | 8.3%), and visual & performing arts (162 | 7.0%) are the most common fields of study among 2,329 individuals in Dublin who have obtained a bachelor's degree or higher.
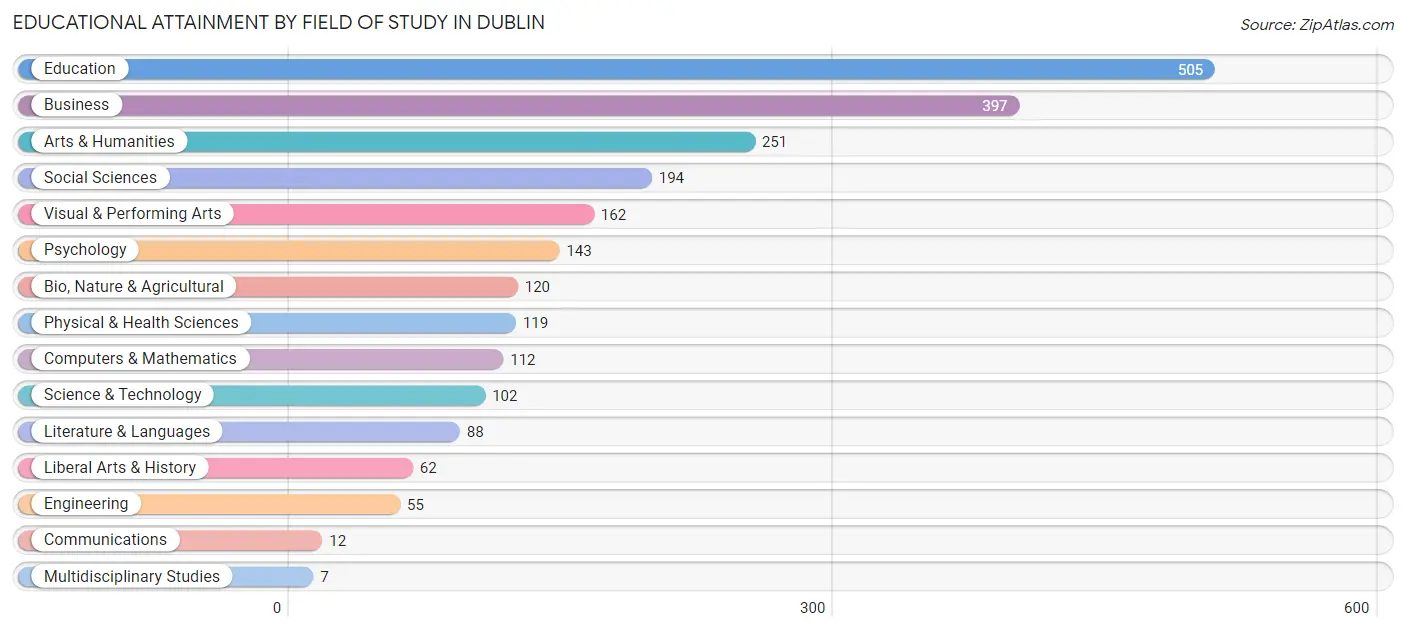
| Field of Study | # Graduates | % Graduates |
| Computers & Mathematics | 112 | 4.8% |
| Bio, Nature & Agricultural | 120 | 5.1% |
| Physical & Health Sciences | 119 | 5.1% |
| Psychology | 143 | 6.1% |
| Social Sciences | 194 | 8.3% |
| Engineering | 55 | 2.4% |
| Multidisciplinary Studies | 7 | 0.3% |
| Science & Technology | 102 | 4.4% |
| Business | 397 | 17.1% |
| Education | 505 | 21.7% |
| Literature & Languages | 88 | 3.8% |
| Liberal Arts & History | 62 | 2.7% |
| Visual & Performing Arts | 162 | 7.0% |
| Communications | 12 | 0.5% |
| Arts & Humanities | 251 | 10.8% |
| Total | 2,329 | 100.0% |
Transportation & Commute in Dublin
Vehicle Availability by Sex in Dublin
The most prevalent vehicle ownership categories in Dublin are males with 2 vehicles (873, accounting for 38.6%) and females with 2 vehicles (624, making up 30.1%).
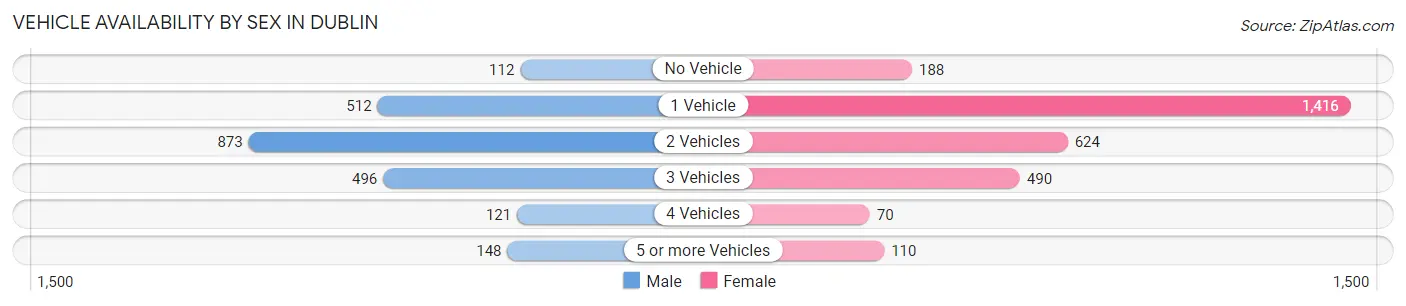
| Vehicles Available | Male | Female |
| No Vehicle | 112 (5.0%) | 188 (6.5%) |
| 1 Vehicle | 512 (22.6%) | 1,416 (48.9%) |
| 2 Vehicles | 873 (38.6%) | 624 (21.5%) |
| 3 Vehicles | 496 (21.9%) | 490 (16.9%) |
| 4 Vehicles | 121 (5.3%) | 70 (2.4%) |
| 5 or more Vehicles | 148 (6.5%) | 110 (3.8%) |
| Total | 2,262 (100.0%) | 2,898 (100.0%) |
Commute Time in Dublin
The most frequently occuring commute durations in Dublin are 10 to 14 minutes (1,870 commuters, 37.2%), 5 to 9 minutes (862 commuters, 17.2%), and 15 to 19 minutes (862 commuters, 17.2%).
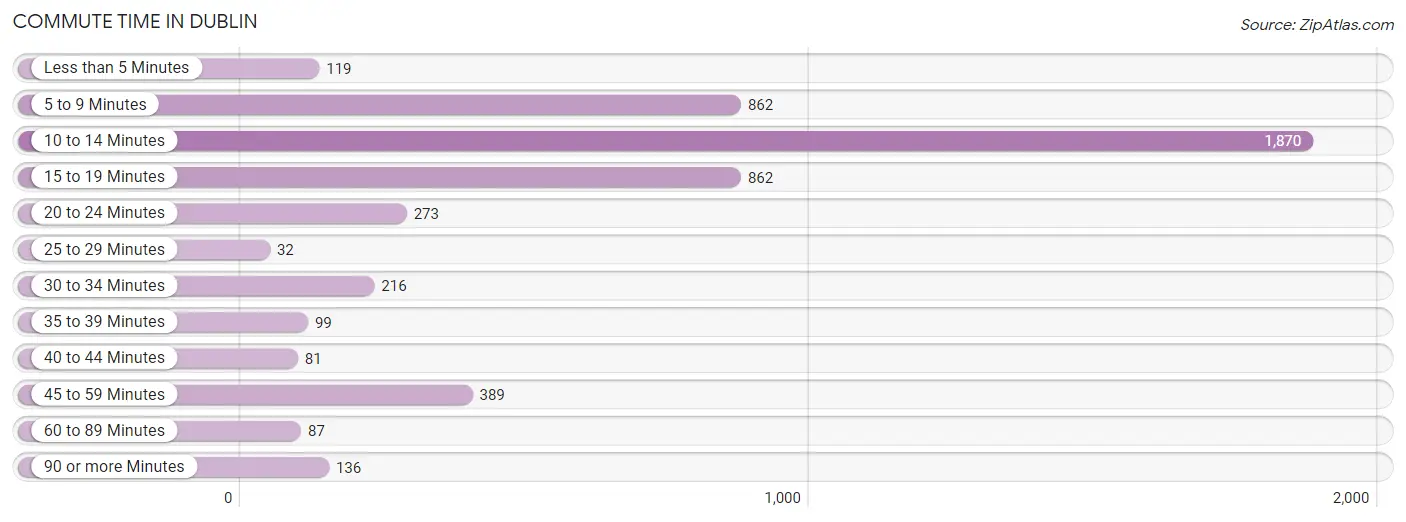
| Commute Time | # Commuters | % Commuters |
| Less than 5 Minutes | 119 | 2.4% |
| 5 to 9 Minutes | 862 | 17.2% |
| 10 to 14 Minutes | 1,870 | 37.2% |
| 15 to 19 Minutes | 862 | 17.2% |
| 20 to 24 Minutes | 273 | 5.4% |
| 25 to 29 Minutes | 32 | 0.6% |
| 30 to 34 Minutes | 216 | 4.3% |
| 35 to 39 Minutes | 99 | 2.0% |
| 40 to 44 Minutes | 81 | 1.6% |
| 45 to 59 Minutes | 389 | 7.7% |
| 60 to 89 Minutes | 87 | 1.7% |
| 90 or more Minutes | 136 | 2.7% |
Commute Time by Sex in Dublin
The most common commute times in Dublin are 10 to 14 minutes (726 commuters, 32.8%) for males and 10 to 14 minutes (1,144 commuters, 40.6%) for females.
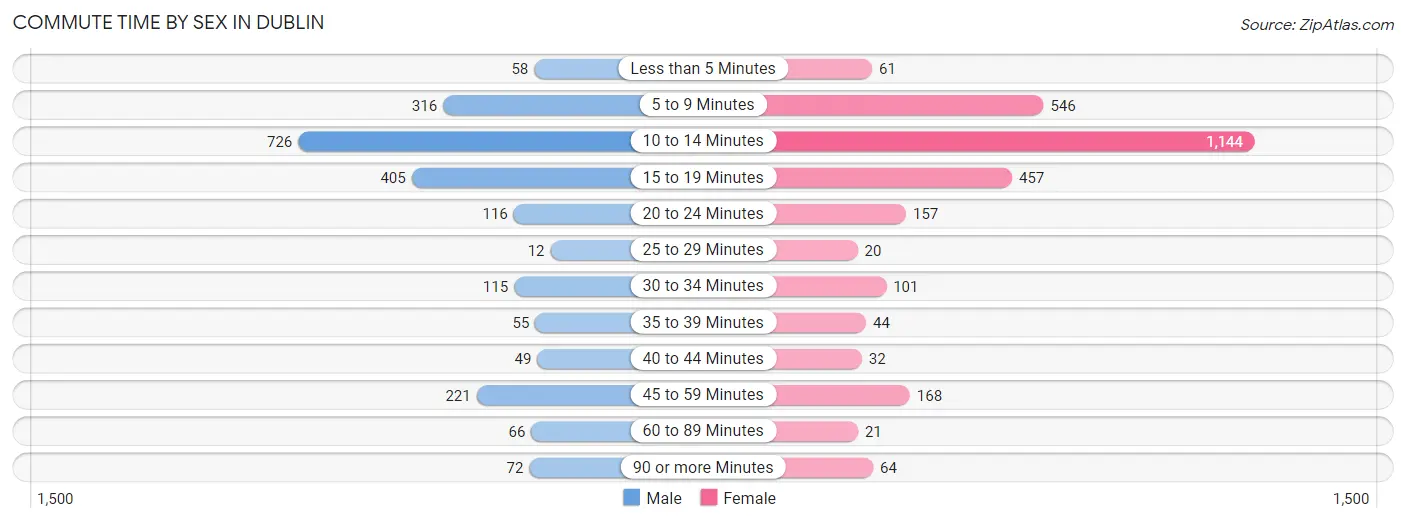
| Commute Time | Male | Female |
| Less than 5 Minutes | 58 (2.6%) | 61 (2.2%) |
| 5 to 9 Minutes | 316 (14.3%) | 546 (19.4%) |
| 10 to 14 Minutes | 726 (32.8%) | 1,144 (40.6%) |
| 15 to 19 Minutes | 405 (18.3%) | 457 (16.2%) |
| 20 to 24 Minutes | 116 (5.2%) | 157 (5.6%) |
| 25 to 29 Minutes | 12 (0.5%) | 20 (0.7%) |
| 30 to 34 Minutes | 115 (5.2%) | 101 (3.6%) |
| 35 to 39 Minutes | 55 (2.5%) | 44 (1.6%) |
| 40 to 44 Minutes | 49 (2.2%) | 32 (1.1%) |
| 45 to 59 Minutes | 221 (10.0%) | 168 (6.0%) |
| 60 to 89 Minutes | 66 (3.0%) | 21 (0.7%) |
| 90 or more Minutes | 72 (3.3%) | 64 (2.3%) |
Time of Departure to Work by Sex in Dublin
The most frequent times of departure to work in Dublin are 7:00 AM to 7:29 AM (413, 18.7%) for males and 6:30 AM to 6:59 AM (441, 15.7%) for females.
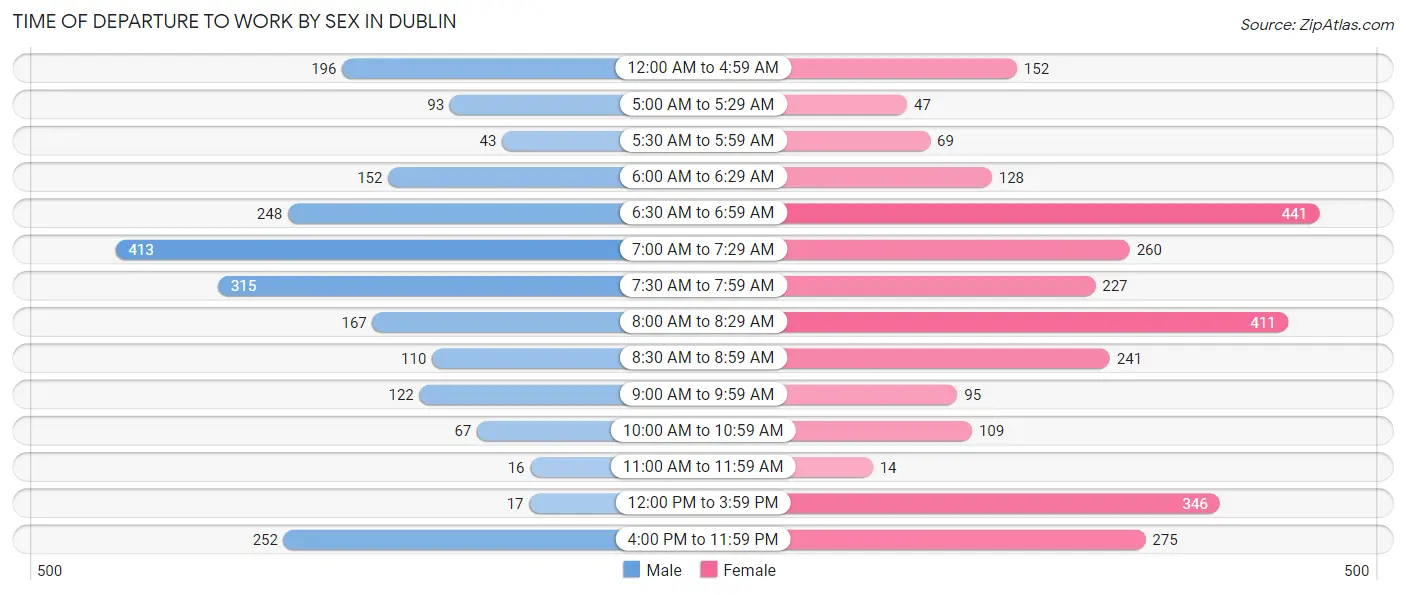
| Time of Departure | Male | Female |
| 12:00 AM to 4:59 AM | 196 (8.9%) | 152 (5.4%) |
| 5:00 AM to 5:29 AM | 93 (4.2%) | 47 (1.7%) |
| 5:30 AM to 5:59 AM | 43 (1.9%) | 69 (2.5%) |
| 6:00 AM to 6:29 AM | 152 (6.9%) | 128 (4.5%) |
| 6:30 AM to 6:59 AM | 248 (11.2%) | 441 (15.7%) |
| 7:00 AM to 7:29 AM | 413 (18.7%) | 260 (9.2%) |
| 7:30 AM to 7:59 AM | 315 (14.2%) | 227 (8.1%) |
| 8:00 AM to 8:29 AM | 167 (7.5%) | 411 (14.6%) |
| 8:30 AM to 8:59 AM | 110 (5.0%) | 241 (8.6%) |
| 9:00 AM to 9:59 AM | 122 (5.5%) | 95 (3.4%) |
| 10:00 AM to 10:59 AM | 67 (3.0%) | 109 (3.9%) |
| 11:00 AM to 11:59 AM | 16 (0.7%) | 14 (0.5%) |
| 12:00 PM to 3:59 PM | 17 (0.8%) | 346 (12.3%) |
| 4:00 PM to 11:59 PM | 252 (11.4%) | 275 (9.8%) |
| Total | 2,211 (100.0%) | 2,815 (100.0%) |
Housing Occupancy in Dublin
Occupancy by Ownership in Dublin
Of the total 5,709 dwellings in Dublin, owner-occupied units account for 2,311 (40.5%), while renter-occupied units make up 3,398 (59.5%).
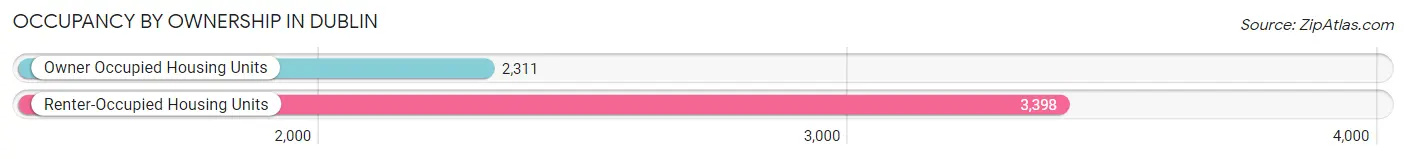
| Occupancy | # Housing Units | % Housing Units |
| Owner Occupied Housing Units | 2,311 | 40.5% |
| Renter-Occupied Housing Units | 3,398 | 59.5% |
| Total Occupied Housing Units | 5,709 | 100.0% |
Occupancy by Household Size in Dublin
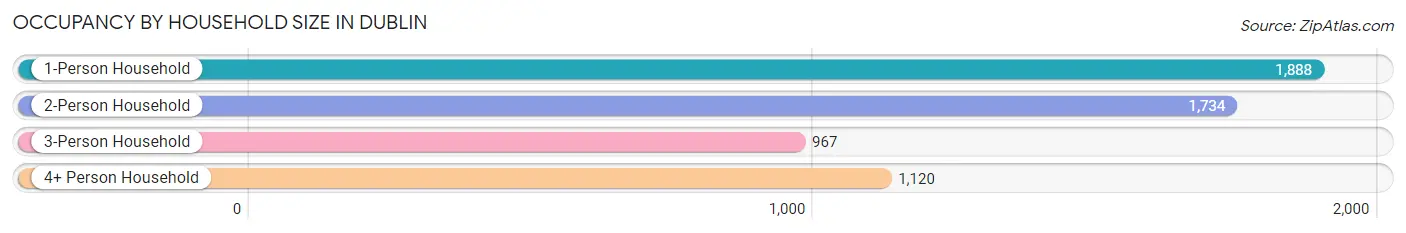
| Household Size | # Housing Units | % Housing Units |
| 1-Person Household | 1,888 | 33.1% |
| 2-Person Household | 1,734 | 30.4% |
| 3-Person Household | 967 | 16.9% |
| 4+ Person Household | 1,120 | 19.6% |
| Total Housing Units | 5,709 | 100.0% |
Occupancy by Ownership by Household Size in Dublin
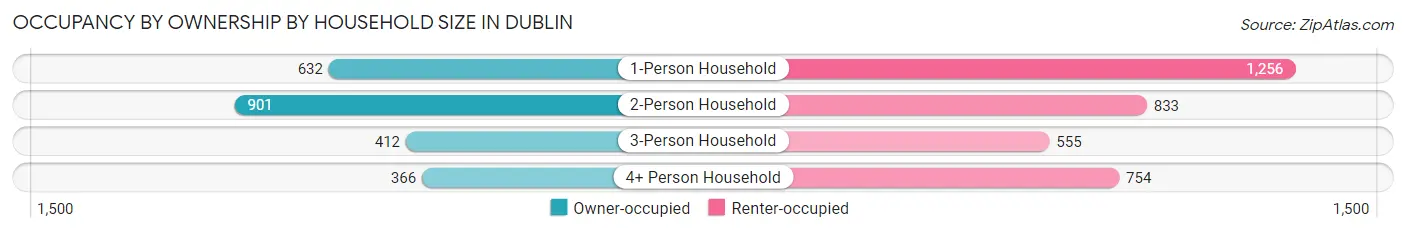
| Household Size | Owner-occupied | Renter-occupied |
| 1-Person Household | 632 (33.5%) | 1,256 (66.5%) |
| 2-Person Household | 901 (52.0%) | 833 (48.0%) |
| 3-Person Household | 412 (42.6%) | 555 (57.4%) |
| 4+ Person Household | 366 (32.7%) | 754 (67.3%) |
| Total Housing Units | 2,311 (40.5%) | 3,398 (59.5%) |
Occupancy by Educational Attainment in Dublin
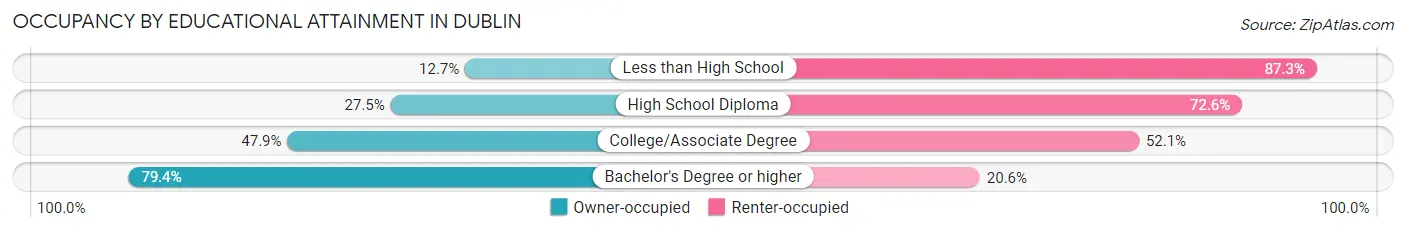
| Household Size | Owner-occupied | Renter-occupied |
| Less than High School | 112 (12.7%) | 773 (87.3%) |
| High School Diploma | 632 (27.5%) | 1,670 (72.6%) |
| College/Associate Degree | 663 (47.9%) | 721 (52.1%) |
| Bachelor's Degree or higher | 904 (79.4%) | 234 (20.6%) |
Occupancy by Age of Householder in Dublin
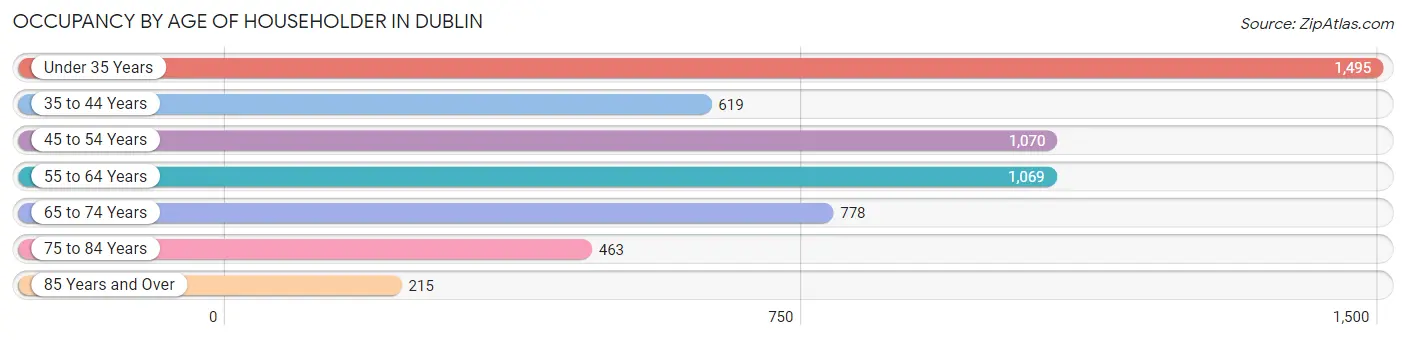
| Age Bracket | # Households | % Households |
| Under 35 Years | 1,495 | 26.2% |
| 35 to 44 Years | 619 | 10.8% |
| 45 to 54 Years | 1,070 | 18.7% |
| 55 to 64 Years | 1,069 | 18.7% |
| 65 to 74 Years | 778 | 13.6% |
| 75 to 84 Years | 463 | 8.1% |
| 85 Years and Over | 215 | 3.8% |
| Total | 5,709 | 100.0% |
Housing Finances in Dublin
Median Income by Occupancy in Dublin
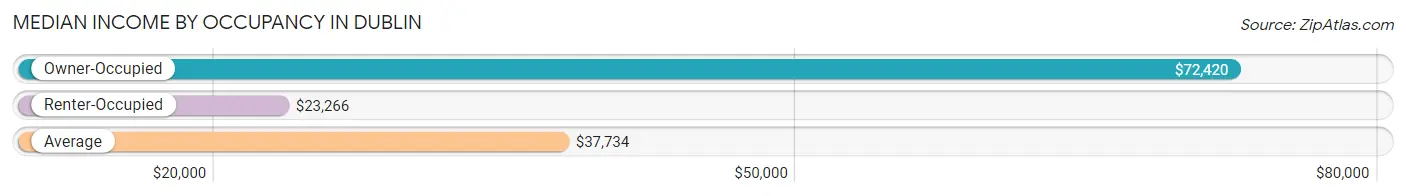
| Occupancy Type | # Households | Median Income |
| Owner-Occupied | 2,311 (40.5%) | $72,420 |
| Renter-Occupied | 3,398 (59.5%) | $23,266 |
| Average | 5,709 (100.0%) | $37,734 |
Occupancy by Householder Income Bracket in Dublin
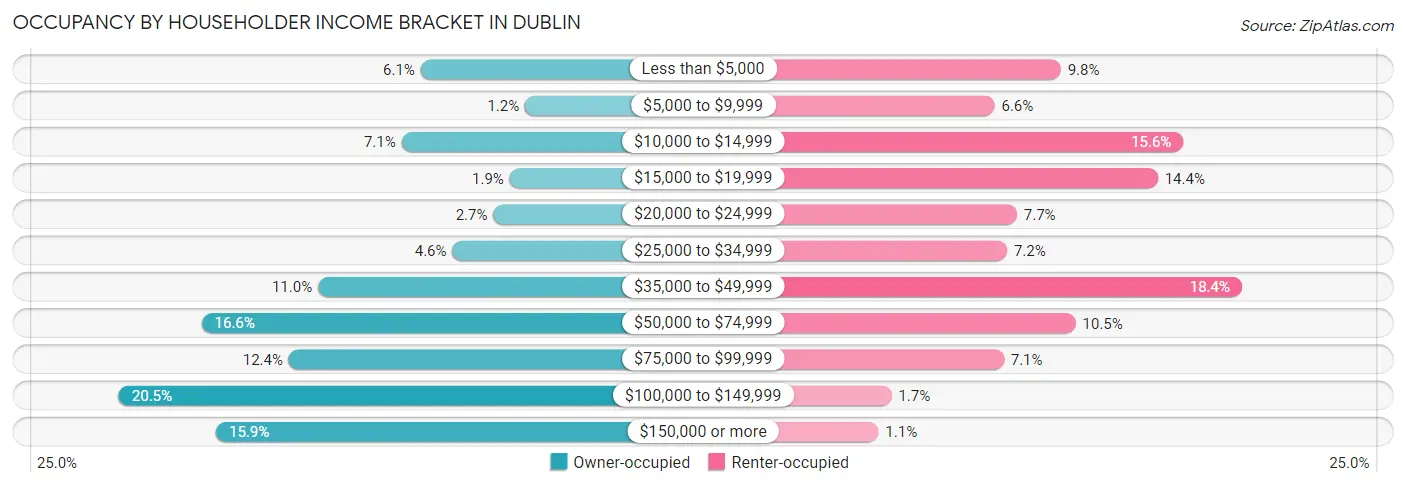
| Income Bracket | Owner-occupied | Renter-occupied |
| Less than $5,000 | 142 (6.1%) | 332 (9.8%) |
| $5,000 to $9,999 | 27 (1.2%) | 225 (6.6%) |
| $10,000 to $14,999 | 163 (7.0%) | 530 (15.6%) |
| $15,000 to $19,999 | 44 (1.9%) | 489 (14.4%) |
| $20,000 to $24,999 | 62 (2.7%) | 261 (7.7%) |
| $25,000 to $34,999 | 107 (4.6%) | 245 (7.2%) |
| $35,000 to $49,999 | 255 (11.0%) | 625 (18.4%) |
| $50,000 to $74,999 | 383 (16.6%) | 356 (10.5%) |
| $75,000 to $99,999 | 287 (12.4%) | 240 (7.1%) |
| $100,000 to $149,999 | 474 (20.5%) | 58 (1.7%) |
| $150,000 or more | 367 (15.9%) | 37 (1.1%) |
| Total | 2,311 (100.0%) | 3,398 (100.0%) |
Monthly Housing Cost Tiers in Dublin
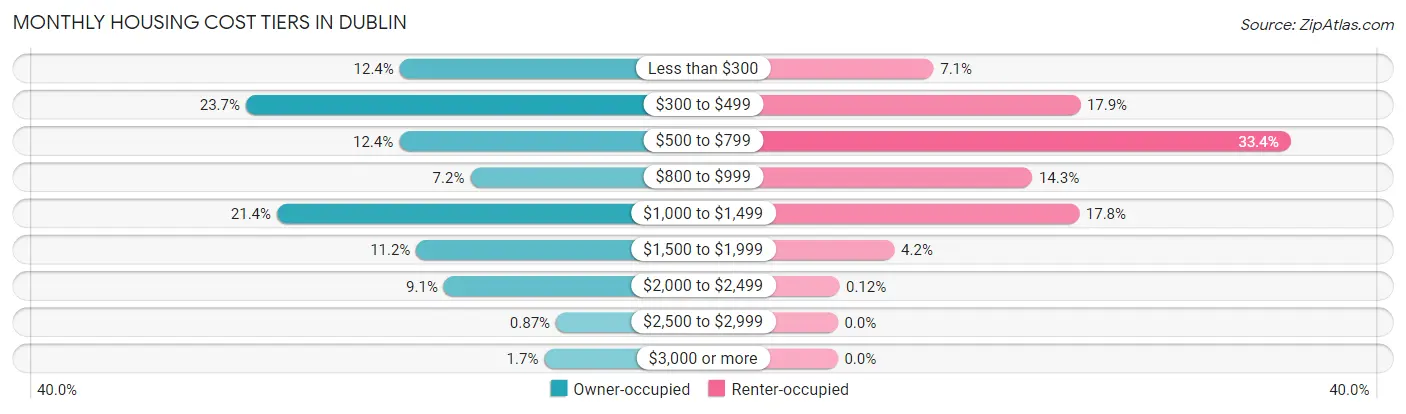
| Monthly Cost | Owner-occupied | Renter-occupied |
| Less than $300 | 286 (12.4%) | 240 (7.1%) |
| $300 to $499 | 548 (23.7%) | 607 (17.9%) |
| $500 to $799 | 287 (12.4%) | 1,134 (33.4%) |
| $800 to $999 | 166 (7.2%) | 487 (14.3%) |
| $1,000 to $1,499 | 495 (21.4%) | 604 (17.8%) |
| $1,500 to $1,999 | 258 (11.2%) | 142 (4.2%) |
| $2,000 to $2,499 | 211 (9.1%) | 4 (0.1%) |
| $2,500 to $2,999 | 20 (0.9%) | 0 (0.0%) |
| $3,000 or more | 40 (1.7%) | 0 (0.0%) |
| Total | 2,311 (100.0%) | 3,398 (100.0%) |
Physical Housing Characteristics in Dublin
Housing Structures in Dublin
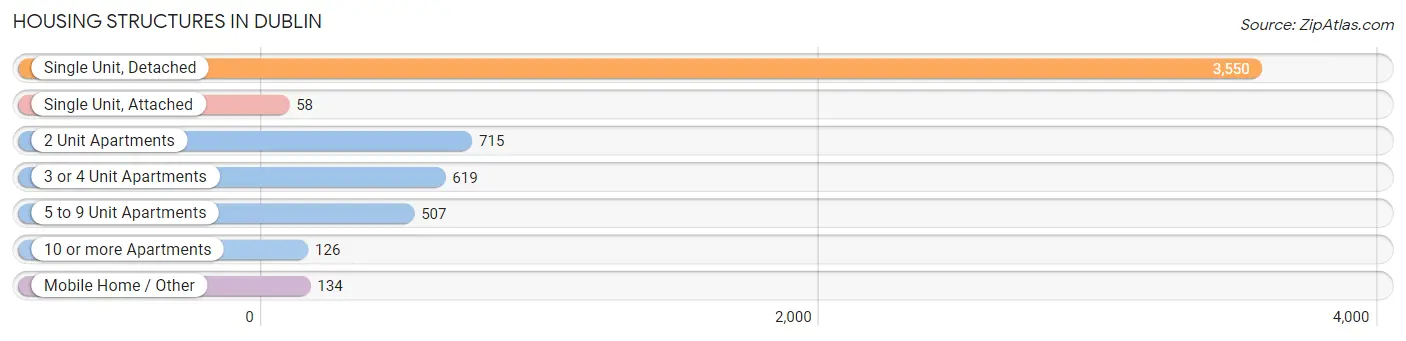
| Structure Type | # Housing Units | % Housing Units |
| Single Unit, Detached | 3,550 | 62.2% |
| Single Unit, Attached | 58 | 1.0% |
| 2 Unit Apartments | 715 | 12.5% |
| 3 or 4 Unit Apartments | 619 | 10.8% |
| 5 to 9 Unit Apartments | 507 | 8.9% |
| 10 or more Apartments | 126 | 2.2% |
| Mobile Home / Other | 134 | 2.4% |
| Total | 5,709 | 100.0% |
Housing Structures by Occupancy in Dublin
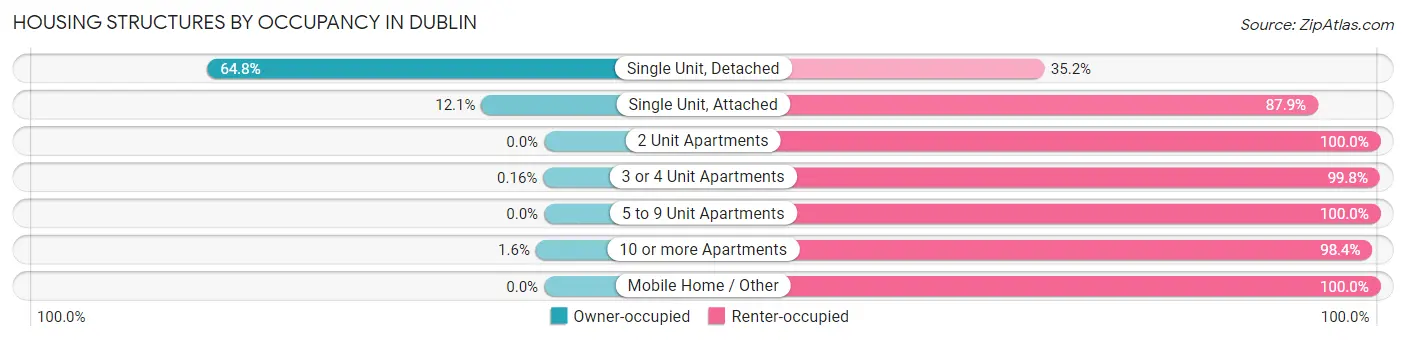
| Structure Type | Owner-occupied | Renter-occupied |
| Single Unit, Detached | 2,301 (64.8%) | 1,249 (35.2%) |
| Single Unit, Attached | 7 (12.1%) | 51 (87.9%) |
| 2 Unit Apartments | 0 (0.0%) | 715 (100.0%) |
| 3 or 4 Unit Apartments | 1 (0.2%) | 618 (99.8%) |
| 5 to 9 Unit Apartments | 0 (0.0%) | 507 (100.0%) |
| 10 or more Apartments | 2 (1.6%) | 124 (98.4%) |
| Mobile Home / Other | 0 (0.0%) | 134 (100.0%) |
| Total | 2,311 (40.5%) | 3,398 (59.5%) |
Housing Structures by Number of Rooms in Dublin
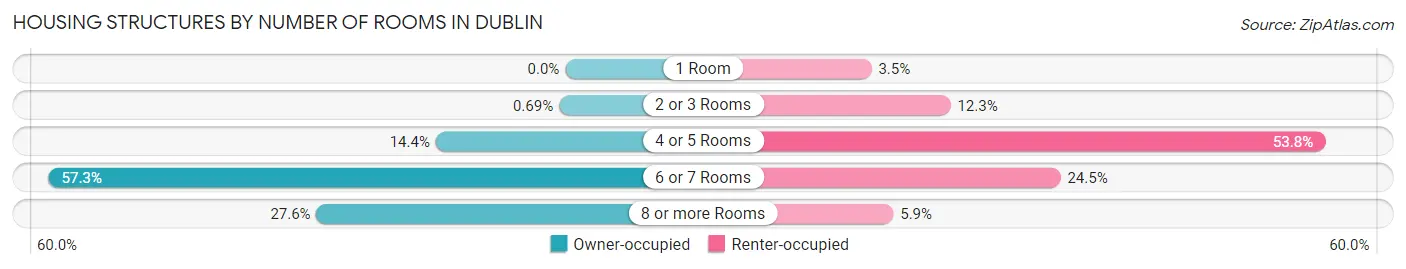
| Number of Rooms | Owner-occupied | Renter-occupied |
| 1 Room | 0 (0.0%) | 119 (3.5%) |
| 2 or 3 Rooms | 16 (0.7%) | 417 (12.3%) |
| 4 or 5 Rooms | 332 (14.4%) | 1,829 (53.8%) |
| 6 or 7 Rooms | 1,325 (57.3%) | 832 (24.5%) |
| 8 or more Rooms | 638 (27.6%) | 201 (5.9%) |
| Total | 2,311 (100.0%) | 3,398 (100.0%) |
Housing Structure by Heating Type in Dublin
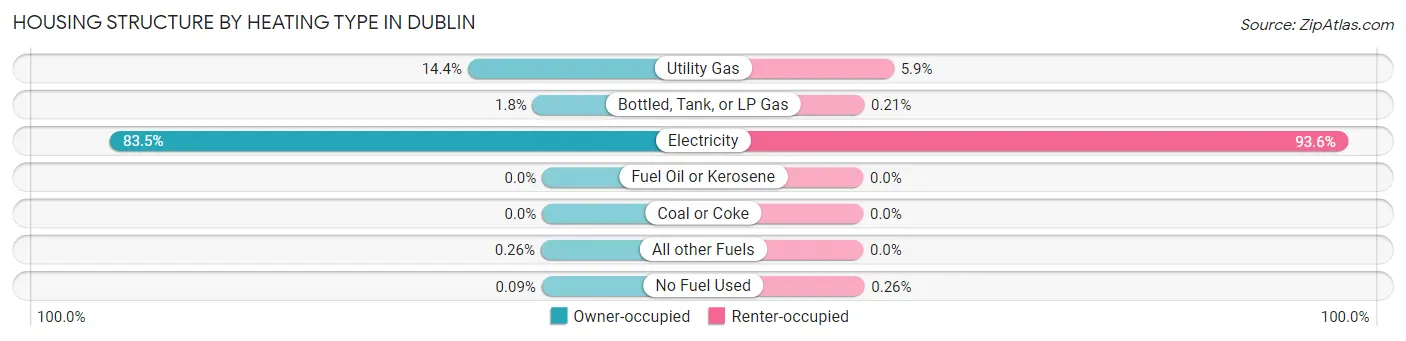
| Heating Type | Owner-occupied | Renter-occupied |
| Utility Gas | 332 (14.4%) | 201 (5.9%) |
| Bottled, Tank, or LP Gas | 42 (1.8%) | 7 (0.2%) |
| Electricity | 1,929 (83.5%) | 3,181 (93.6%) |
| Fuel Oil or Kerosene | 0 (0.0%) | 0 (0.0%) |
| Coal or Coke | 0 (0.0%) | 0 (0.0%) |
| All other Fuels | 6 (0.3%) | 0 (0.0%) |
| No Fuel Used | 2 (0.1%) | 9 (0.3%) |
| Total | 2,311 (100.0%) | 3,398 (100.0%) |
Household Vehicle Usage in Dublin
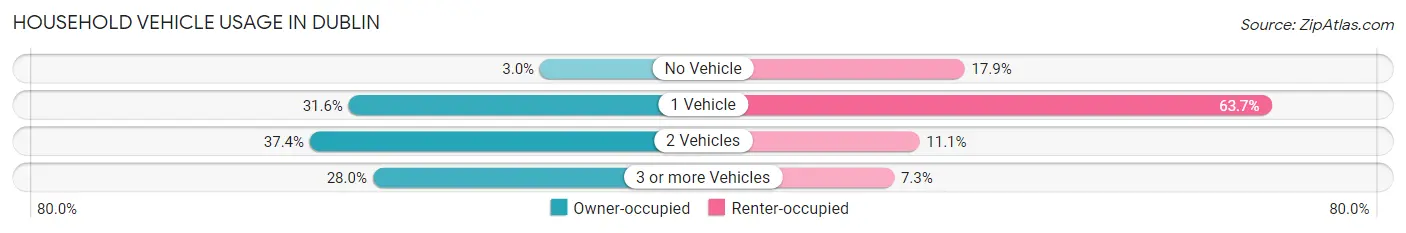
| Vehicles per Household | Owner-occupied | Renter-occupied |
| No Vehicle | 70 (3.0%) | 607 (17.9%) |
| 1 Vehicle | 730 (31.6%) | 2,164 (63.7%) |
| 2 Vehicles | 864 (37.4%) | 378 (11.1%) |
| 3 or more Vehicles | 647 (28.0%) | 249 (7.3%) |
| Total | 2,311 (100.0%) | 3,398 (100.0%) |
Real Estate & Mortgages in Dublin
Real Estate and Mortgage Overview in Dublin
| Characteristic | Without Mortgage | With Mortgage |
| Housing Units | 1,146 | 1,165 |
| Median Property Value | $114,100 | $170,100 |
| Median Household Income | $58,571 | $257 |
| Monthly Housing Costs | $403 | $40 |
| Real Estate Taxes | $1,112 | $62 |
Property Value by Mortgage Status in Dublin
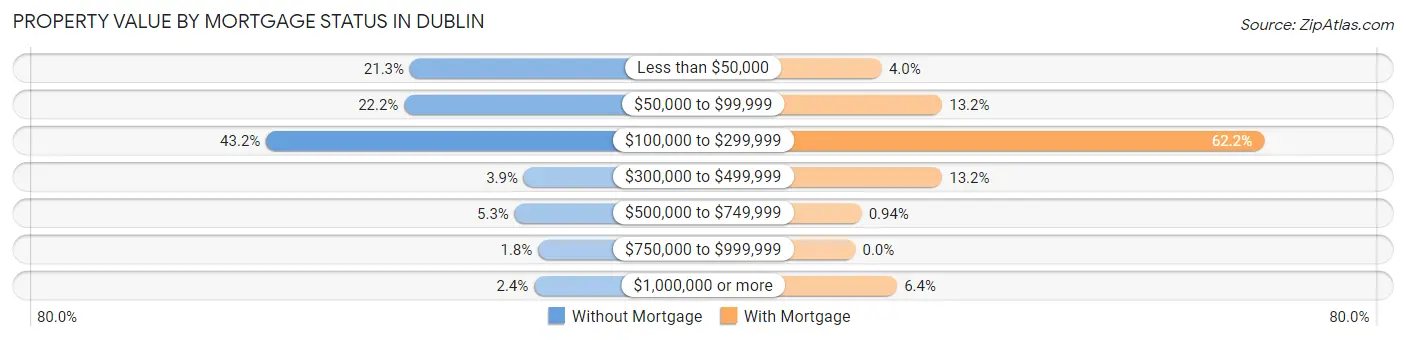
| Property Value | Without Mortgage | With Mortgage |
| Less than $50,000 | 244 (21.3%) | 47 (4.0%) |
| $50,000 to $99,999 | 254 (22.2%) | 154 (13.2%) |
| $100,000 to $299,999 | 495 (43.2%) | 725 (62.2%) |
| $300,000 to $499,999 | 45 (3.9%) | 154 (13.2%) |
| $500,000 to $749,999 | 61 (5.3%) | 11 (0.9%) |
| $750,000 to $999,999 | 20 (1.8%) | 0 (0.0%) |
| $1,000,000 or more | 27 (2.4%) | 74 (6.4%) |
| Total | 1,146 (100.0%) | 1,165 (100.0%) |
Household Income by Mortgage Status in Dublin
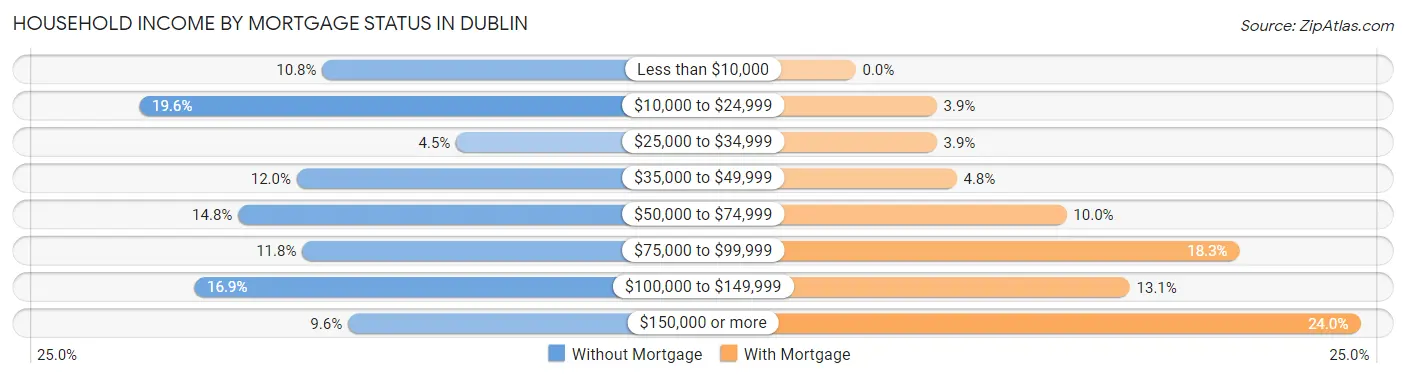
| Household Income | Without Mortgage | With Mortgage |
| Less than $10,000 | 124 (10.8%) | 0 (0.0%) |
| $10,000 to $24,999 | 224 (19.6%) | 45 (3.9%) |
| $25,000 to $34,999 | 51 (4.4%) | 45 (3.9%) |
| $35,000 to $49,999 | 138 (12.0%) | 56 (4.8%) |
| $50,000 to $74,999 | 170 (14.8%) | 117 (10.0%) |
| $75,000 to $99,999 | 135 (11.8%) | 213 (18.3%) |
| $100,000 to $149,999 | 194 (16.9%) | 152 (13.1%) |
| $150,000 or more | 110 (9.6%) | 280 (24.0%) |
| Total | 1,146 (100.0%) | 1,165 (100.0%) |
Property Value to Household Income Ratio in Dublin
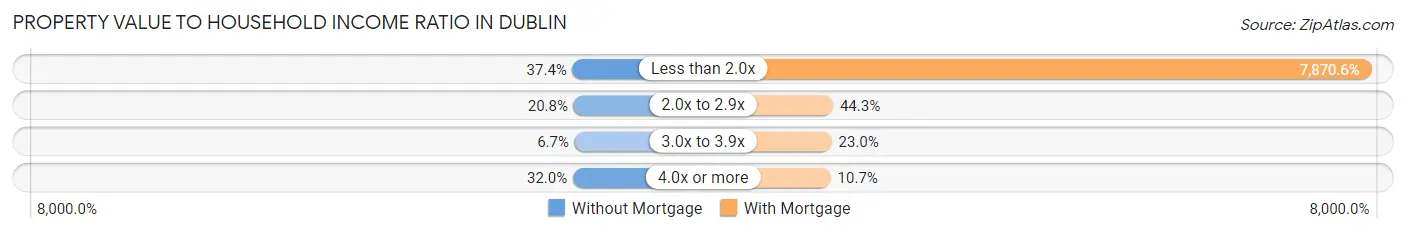
| Value-to-Income Ratio | Without Mortgage | With Mortgage |
| Less than 2.0x | 428 (37.3%) | 91,693 (7,870.6%) |
| 2.0x to 2.9x | 238 (20.8%) | 516 (44.3%) |
| 3.0x to 3.9x | 77 (6.7%) | 268 (23.0%) |
| 4.0x or more | 367 (32.0%) | 125 (10.7%) |
| Total | 1,146 (100.0%) | 1,165 (100.0%) |
Real Estate Taxes by Mortgage Status in Dublin
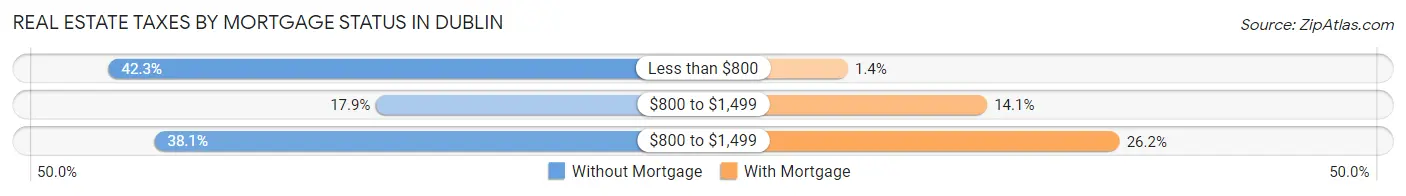
| Property Taxes | Without Mortgage | With Mortgage |
| Less than $800 | 485 (42.3%) | 16 (1.4%) |
| $800 to $1,499 | 205 (17.9%) | 164 (14.1%) |
| $800 to $1,499 | 437 (38.1%) | 305 (26.2%) |
| Total | 1,146 (100.0%) | 1,165 (100.0%) |
Health & Disability in Dublin
Health Insurance Coverage by Age in Dublin
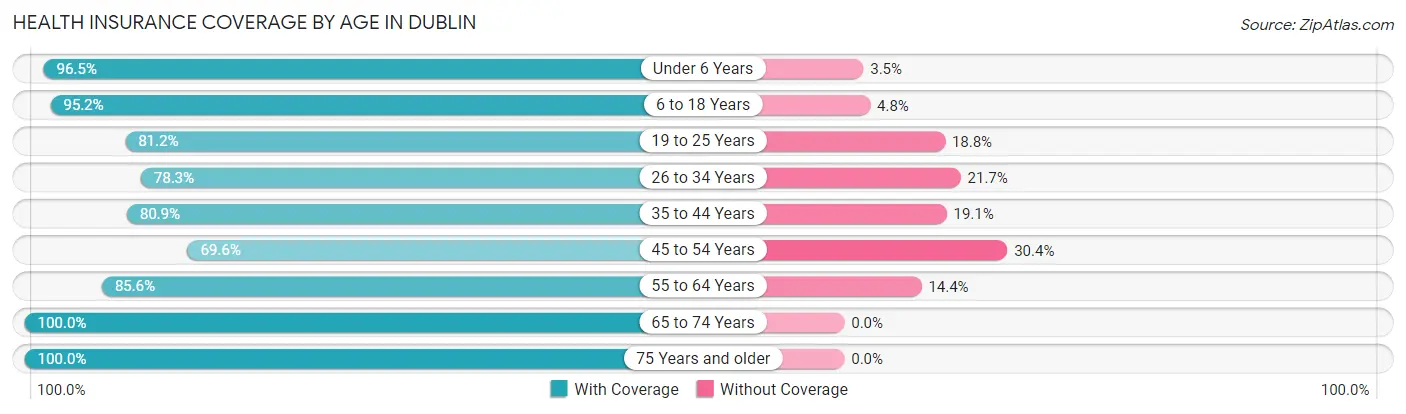
| Age Bracket | With Coverage | Without Coverage |
| Under 6 Years | 1,445 (96.5%) | 53 (3.5%) |
| 6 to 18 Years | 2,493 (95.2%) | 126 (4.8%) |
| 19 to 25 Years | 1,229 (81.2%) | 284 (18.8%) |
| 26 to 34 Years | 1,830 (78.3%) | 507 (21.7%) |
| 35 to 44 Years | 1,065 (80.9%) | 251 (19.1%) |
| 45 to 54 Years | 1,265 (69.6%) | 552 (30.4%) |
| 55 to 64 Years | 1,529 (85.6%) | 257 (14.4%) |
| 65 to 74 Years | 1,391 (100.0%) | 0 (0.0%) |
| 75 Years and older | 1,014 (100.0%) | 0 (0.0%) |
| Total | 13,261 (86.7%) | 2,030 (13.3%) |
Health Insurance Coverage by Citizenship Status in Dublin
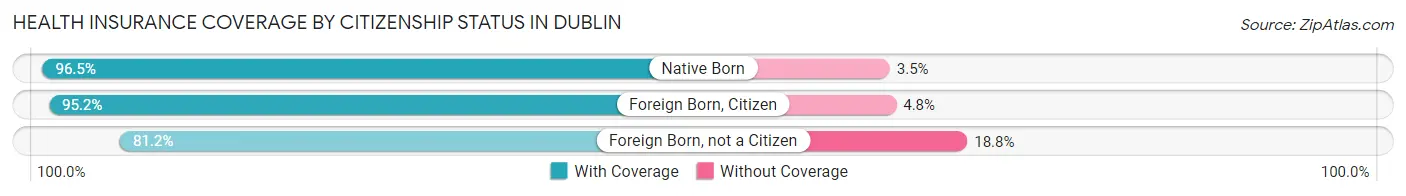
| Citizenship Status | With Coverage | Without Coverage |
| Native Born | 1,445 (96.5%) | 53 (3.5%) |
| Foreign Born, Citizen | 2,493 (95.2%) | 126 (4.8%) |
| Foreign Born, not a Citizen | 1,229 (81.2%) | 284 (18.8%) |
Health Insurance Coverage by Household Income in Dublin
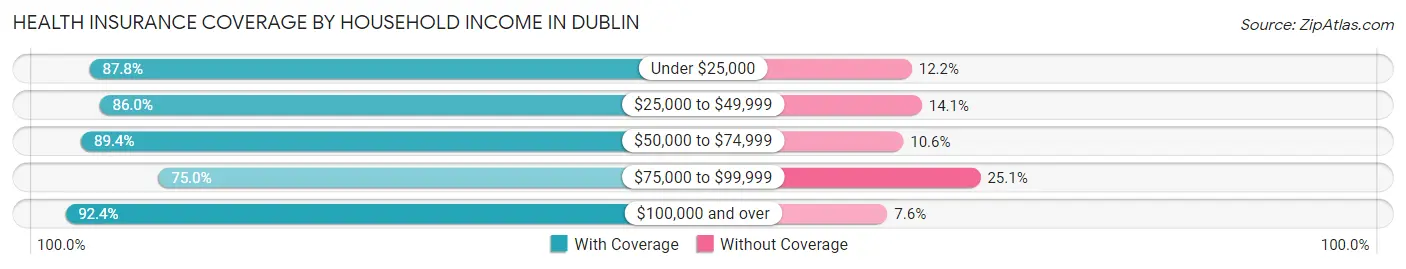
| Household Income | With Coverage | Without Coverage |
| Under $25,000 | 4,393 (87.8%) | 609 (12.2%) |
| $25,000 to $49,999 | 2,911 (86.0%) | 476 (14.1%) |
| $50,000 to $74,999 | 2,063 (89.4%) | 244 (10.6%) |
| $75,000 to $99,999 | 1,433 (75.0%) | 479 (25.1%) |
| $100,000 and over | 2,390 (92.4%) | 197 (7.6%) |
Public vs Private Health Insurance Coverage by Age in Dublin

| Age Bracket | Public Insurance | Private Insurance |
| Under 6 | 1,117 (74.6%) | 408 (27.2%) |
| 6 to 18 Years | 1,782 (68.0%) | 920 (35.1%) |
| 19 to 25 Years | 484 (32.0%) | 797 (52.7%) |
| 25 to 34 Years | 1,021 (43.7%) | 1,191 (51.0%) |
| 35 to 44 Years | 309 (23.5%) | 766 (58.2%) |
| 45 to 54 Years | 449 (24.7%) | 834 (45.9%) |
| 55 to 64 Years | 631 (35.3%) | 1,032 (57.8%) |
| 65 to 74 Years | 1,291 (92.8%) | 864 (62.1%) |
| 75 Years and over | 1,005 (99.1%) | 629 (62.0%) |
| Total | 8,089 (52.9%) | 7,441 (48.7%) |
Disability Status by Sex by Age in Dublin
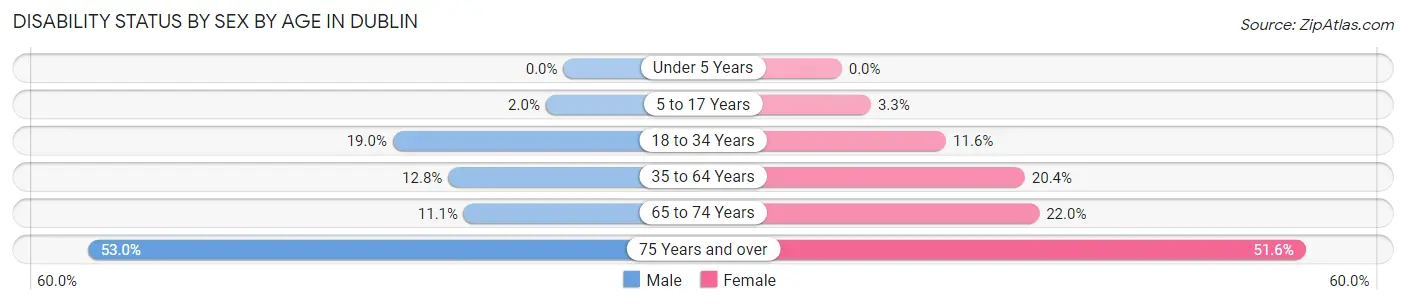
| Age Bracket | Male | Female |
| Under 5 Years | 0 (0.0%) | 0 (0.0%) |
| 5 to 17 Years | 28 (2.0%) | 44 (3.3%) |
| 18 to 34 Years | 335 (19.0%) | 252 (11.6%) |
| 35 to 64 Years | 273 (12.8%) | 569 (20.4%) |
| 65 to 74 Years | 73 (11.1%) | 161 (22.0%) |
| 75 Years and over | 214 (53.0%) | 315 (51.6%) |
Disability Class by Sex by Age in Dublin
Disability Class: Hearing Difficulty
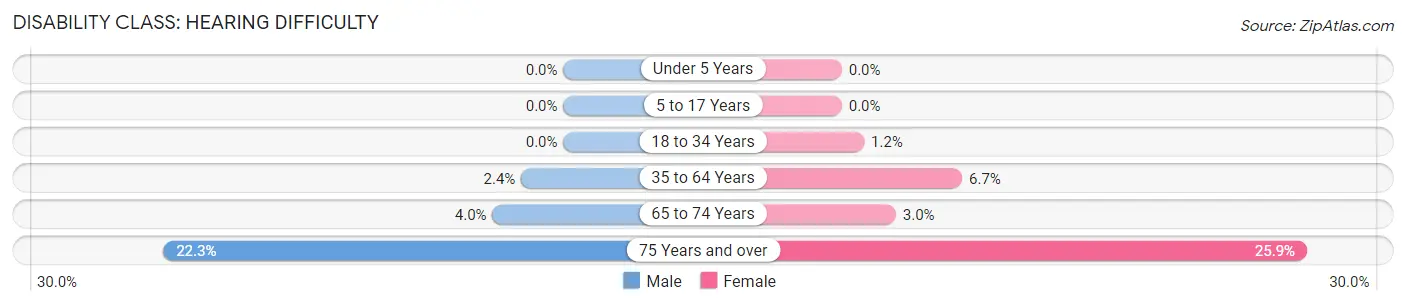
| Age Bracket | Male | Female |
| Under 5 Years | 0 (0.0%) | 0 (0.0%) |
| 5 to 17 Years | 0 (0.0%) | 0 (0.0%) |
| 18 to 34 Years | 0 (0.0%) | 27 (1.2%) |
| 35 to 64 Years | 50 (2.4%) | 187 (6.7%) |
| 65 to 74 Years | 26 (4.0%) | 22 (3.0%) |
| 75 Years and over | 90 (22.3%) | 158 (25.9%) |
Disability Class: Vision Difficulty
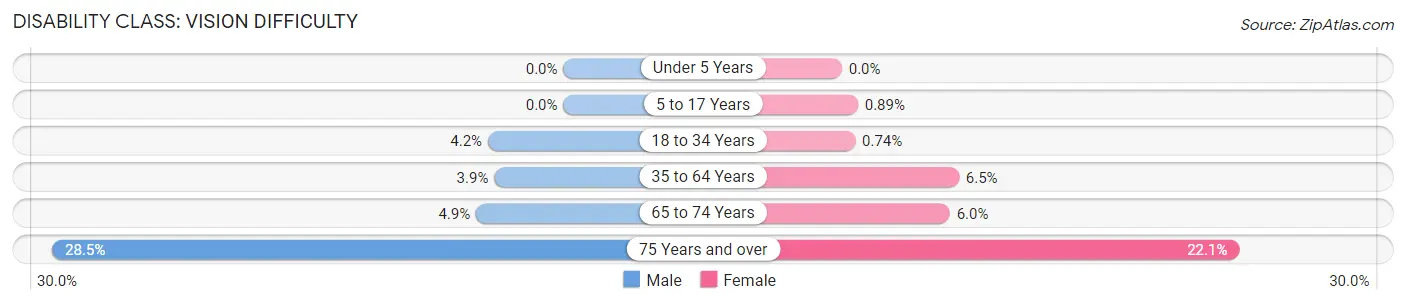
| Age Bracket | Male | Female |
| Under 5 Years | 0 (0.0%) | 0 (0.0%) |
| 5 to 17 Years | 0 (0.0%) | 12 (0.9%) |
| 18 to 34 Years | 74 (4.2%) | 16 (0.7%) |
| 35 to 64 Years | 82 (3.8%) | 182 (6.5%) |
| 65 to 74 Years | 32 (4.9%) | 44 (6.0%) |
| 75 Years and over | 115 (28.5%) | 135 (22.1%) |
Disability Class: Cognitive Difficulty
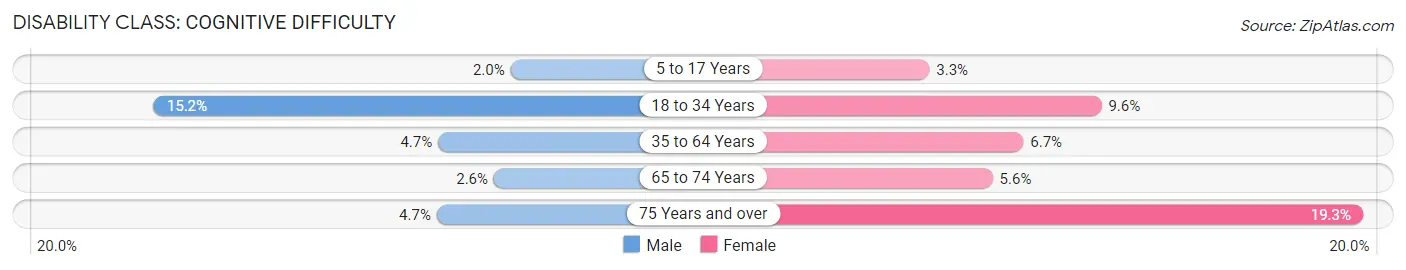
| Age Bracket | Male | Female |
| 5 to 17 Years | 28 (2.0%) | 44 (3.3%) |
| 18 to 34 Years | 268 (15.2%) | 209 (9.6%) |
| 35 to 64 Years | 99 (4.6%) | 188 (6.7%) |
| 65 to 74 Years | 17 (2.6%) | 41 (5.6%) |
| 75 Years and over | 19 (4.7%) | 118 (19.3%) |
Disability Class: Ambulatory Difficulty
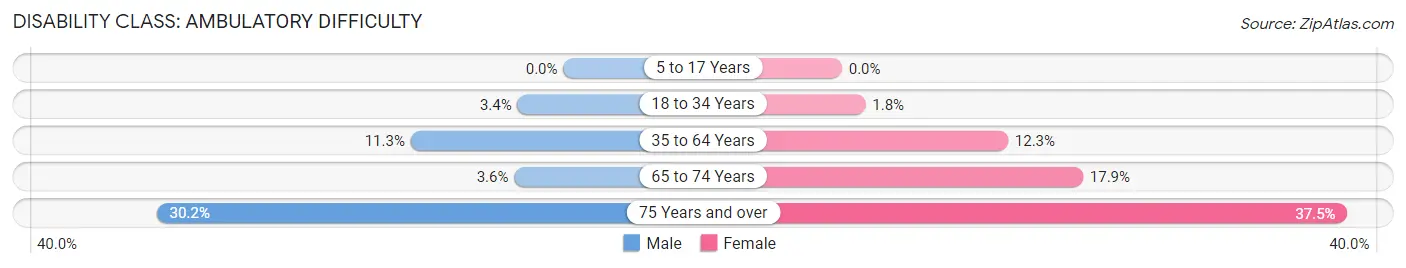
| Age Bracket | Male | Female |
| 5 to 17 Years | 0 (0.0%) | 0 (0.0%) |
| 18 to 34 Years | 60 (3.4%) | 38 (1.8%) |
| 35 to 64 Years | 241 (11.3%) | 344 (12.3%) |
| 65 to 74 Years | 24 (3.6%) | 131 (17.9%) |
| 75 Years and over | 122 (30.2%) | 229 (37.5%) |
Disability Class: Self-Care Difficulty
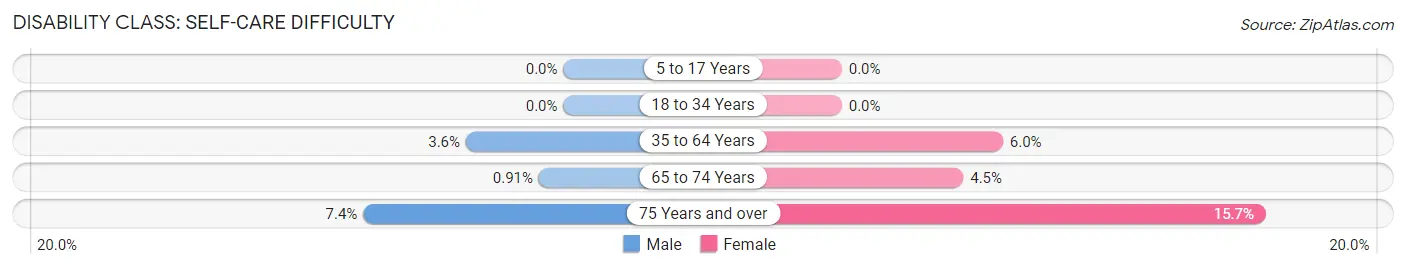
| Age Bracket | Male | Female |
| 5 to 17 Years | 0 (0.0%) | 0 (0.0%) |
| 18 to 34 Years | 0 (0.0%) | 0 (0.0%) |
| 35 to 64 Years | 77 (3.6%) | 167 (6.0%) |
| 65 to 74 Years | 6 (0.9%) | 33 (4.5%) |
| 75 Years and over | 30 (7.4%) | 96 (15.7%) |
Technology Access in Dublin
Computing Device Access in Dublin
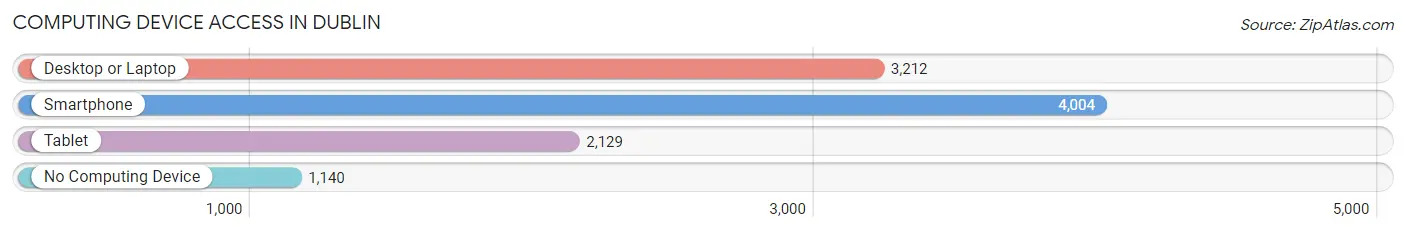
| Device Type | # Households | % Households |
| Desktop or Laptop | 3,212 | 56.3% |
| Smartphone | 4,004 | 70.1% |
| Tablet | 2,129 | 37.3% |
| No Computing Device | 1,140 | 20.0% |
| Total | 5,709 | 100.0% |
Internet Access in Dublin
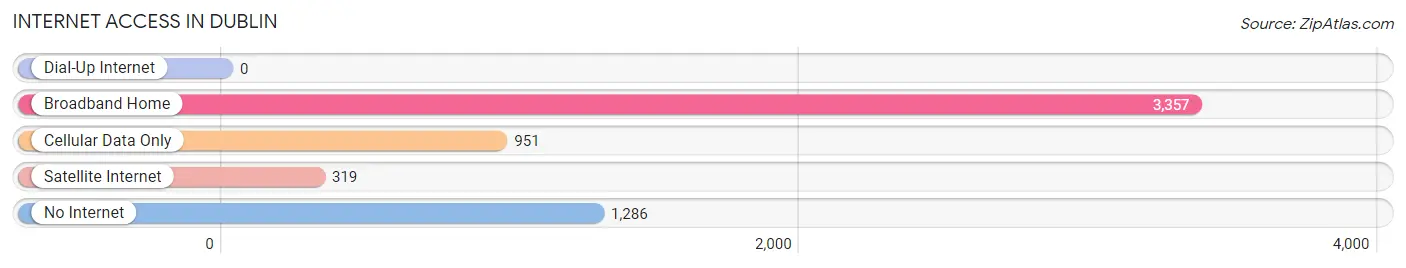
| Internet Type | # Households | % Households |
| Dial-Up Internet | 0 | 0.0% |
| Broadband Home | 3,357 | 58.8% |
| Cellular Data Only | 951 | 16.7% |
| Satellite Internet | 319 | 5.6% |
| No Internet | 1,286 | 22.5% |
| Total | 5,709 | 100.0% |
Dublin Summary
Dublin, Georgia is a city located in Laurens County in the state of Georgia. It is the county seat of Laurens County and is located in the heart of the state, approximately 85 miles southeast of Atlanta. The city is situated along the Oconee River and is home to a population of approximately 16,201 people, according to the 2010 census.
History
The city of Dublin was founded in 1812 by John Edward Dubose, a Revolutionary War veteran. The city was named after Dublin, Ireland, and was originally known as “Dubose’s Crossroads”. The city was incorporated in 1825 and was the first city in Laurens County.
In the early 19th century, Dublin was a major trading center for cotton and tobacco. The city was also home to several cotton mills and other industries. During the Civil War, Dublin was the site of several battles, including the Battle of Dublin Station.
Geography
Dublin is located in the heart of the state of Georgia, approximately 85 miles southeast of Atlanta. The city is situated along the Oconee River and is surrounded by the cities of East Dublin, Dexter, Dudley, and Rentz. The city covers an area of 8.3 square miles and has an elevation of 441 feet.
Climate
Dublin has a humid subtropical climate, with hot, humid summers and mild winters. The average temperature in the summer is around 90 degrees Fahrenheit, while the average temperature in the winter is around 50 degrees Fahrenheit. The city receives an average of 48 inches of rain per year.
Economy
Dublin’s economy is largely based on agriculture and manufacturing. The city is home to several large manufacturing companies, including Georgia-Pacific, which produces paper products, and the Dublin Mills, which produces textiles. The city is also home to several agricultural businesses, including poultry farms and dairy farms.
Demographics
According to the 2010 census, the population of Dublin was 16,201. The racial makeup of the city was 57.3% White, 37.2% African American, 0.4% Native American, 1.2% Asian, 0.1% Pacific Islander, and 3.8% from other races. The median household income was $30,945, and the median family income was $37,945.
Conclusion
Dublin, Georgia is a city located in Laurens County in the state of Georgia. It is the county seat of Laurens County and is located in the heart of the state, approximately 85 miles southeast of Atlanta. The city is situated along the Oconee River and is home to a population of approximately 16,201 people, according to the 2010 census. Dublin’s economy is largely based on agriculture and manufacturing, and the city is home to several large manufacturing companies and agricultural businesses. The racial makeup of the city was 57.3% White, 37.2% African American, 0.4% Native American, 1.2% Asian, 0.1% Pacific Islander, and 3.8% from other races. The median household income was $30,945, and the median family income was $37,945.
Common Questions
What is Per Capita Income in Dublin?
Per Capita income in Dublin is $27,194.
What is the Median Family Income in Dublin?
Median Family Income in Dublin is $48,420.
What is the Median Household income in Dublin?
Median Household Income in Dublin is $37,734.
What is Income or Wage Gap in Dublin?
Income or Wage Gap in Dublin is 32.5%.
Women in Dublin earn 67.5 cents for every dollar earned by a man.
What is Inequality or Gini Index in Dublin?
Inequality or Gini Index in Dublin is 0.61.
What is the Total Population of Dublin?
Total Population of Dublin is 15,985.
What is the Total Male Population of Dublin?
Total Male Population of Dublin is 7,558.
What is the Total Female Population of Dublin?
Total Female Population of Dublin is 8,427.
What is the Ratio of Males per 100 Females in Dublin?
There are 89.69 Males per 100 Females in Dublin.
What is the Ratio of Females per 100 Males in Dublin?
There are 111.50 Females per 100 Males in Dublin.
What is the Median Population Age in Dublin?
Median Population Age in Dublin is 34.9 Years.
What is the Average Family Size in Dublin
Average Family Size in Dublin is 3.4 People.
What is the Average Household Size in Dublin
Average Household Size in Dublin is 2.7 People.
How Large is the Labor Force in Dublin?
There are 5,797 People in the Labor Forcein in Dublin.
What is the Percentage of People in the Labor Force in Dublin?
47.4% of People are in the Labor Force in Dublin.
What is the Unemployment Rate in Dublin?
Unemployment Rate in Dublin is 7.5%.