Zip Codes with the Highest Percentage of Population Employed in Installation, Maintenance & Repair in Dover, DE
RELATED REPORTS & OPTIONS
Installation, Maintenance & Repair
Dover
Compare Zip Codes
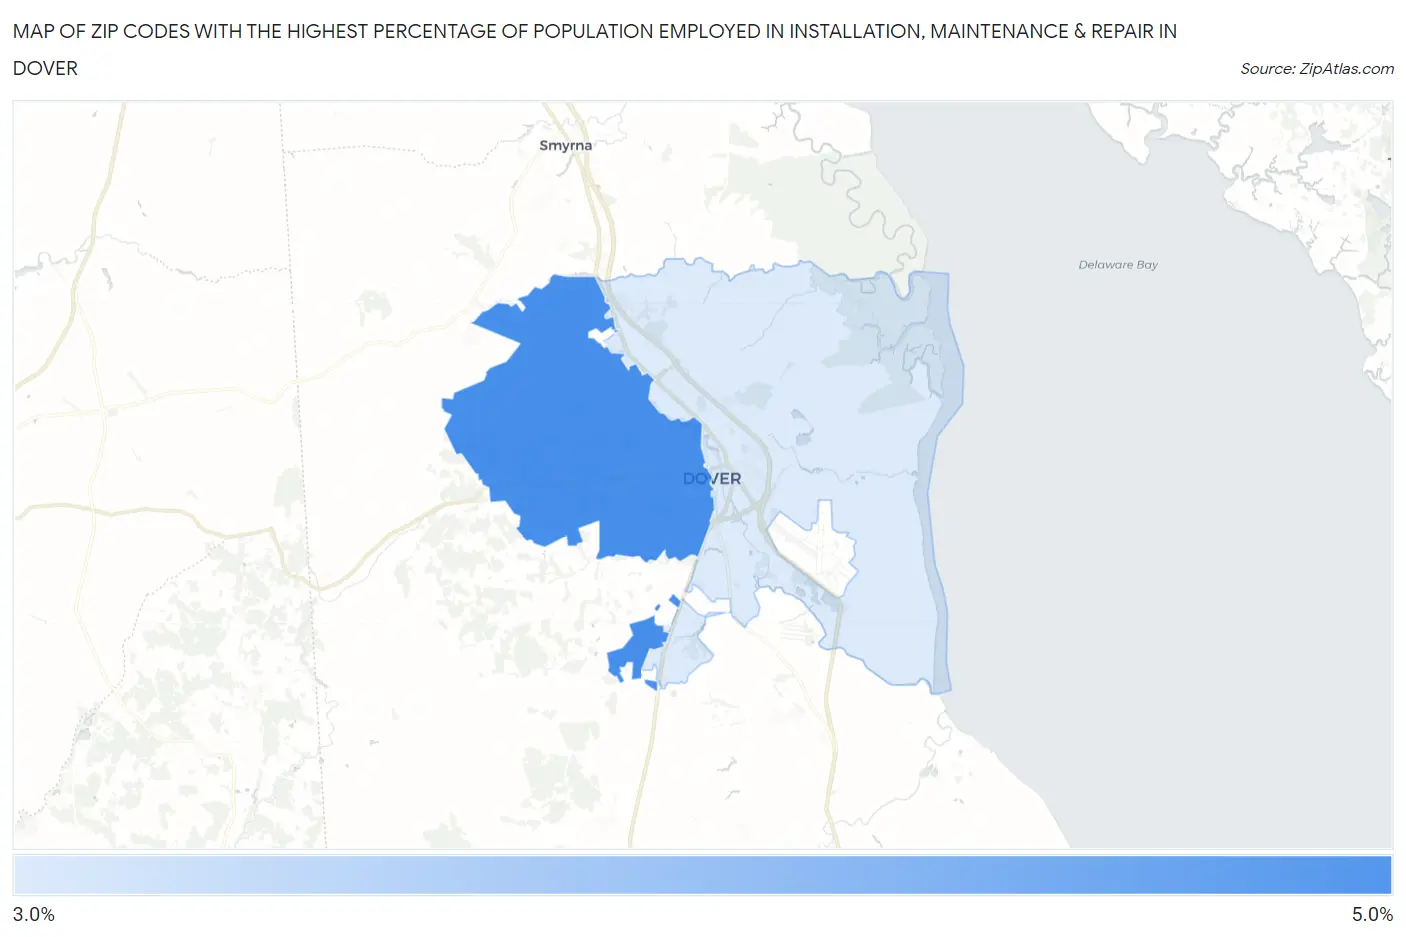
Map of Zip Codes with the Highest Percentage of Population Employed in Installation, Maintenance & Repair in Dover
3.1%
4.8%
Zip Codes with the Highest Percentage of Population Employed in Installation, Maintenance & Repair in Dover, DE
| Zip Code | % Employed | vs State | vs National | |
| 1. | 19904 | 4.8% | 3.4%(+1.38)#15 | 3.1%(+1.76)#9,256 |
| 2. | 19901 | 3.1% | 3.4%(-0.299)#37 | 3.1%(+0.082)#16,283 |
1
Common Questions
What are the Top Zip Codes with the Highest Percentage of Population Employed in Installation, Maintenance & Repair in Dover, DE?
Top Zip Codes with the Highest Percentage of Population Employed in Installation, Maintenance & Repair in Dover, DE are:
What zip code has the Highest Percentage of Population Employed in Installation, Maintenance & Repair in Dover, DE?
19904 has the Highest Percentage of Population Employed in Installation, Maintenance & Repair in Dover, DE with 4.8%.
What is the Percentage of Population Employed in Installation, Maintenance & Repair in Dover, DE?
Percentage of Population Employed in Installation, Maintenance & Repair in Dover is 3.4%.
What is the Percentage of Population Employed in Installation, Maintenance & Repair in Delaware?
Percentage of Population Employed in Installation, Maintenance & Repair in Delaware is 3.4%.
What is the Percentage of Population Employed in Installation, Maintenance & Repair in the United States?
Percentage of Population Employed in Installation, Maintenance & Repair in the United States is 3.1%.