Zip Codes with the Highest Percentage of Population Employed in Installation, Maintenance & Repair in Delaware
RELATED REPORTS & OPTIONS
Installation, Maintenance & Repair
Delaware
Compare Zip Codes
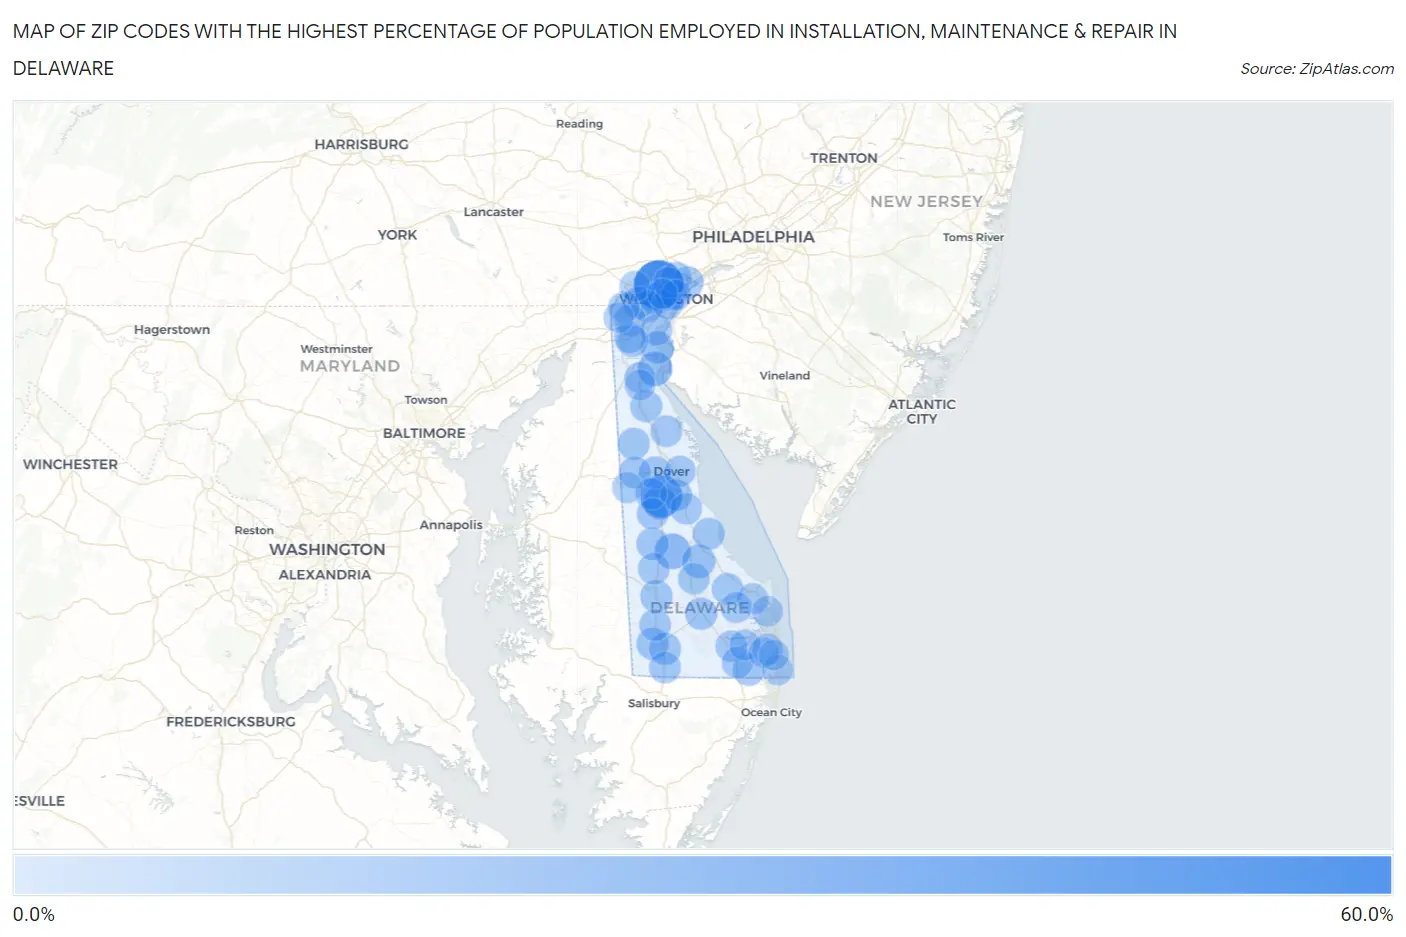
Map of Zip Codes with the Highest Percentage of Population Employed in Installation, Maintenance & Repair in Delaware
0.0%
60.0%
Zip Codes with the Highest Percentage of Population Employed in Installation, Maintenance & Repair in Delaware
| Zip Code | % Employed | vs State | vs National | |
| 1. | 19710 | 52.9% | 3.4%(+49.5)#1 | 3.1%(+49.9)#45 |
| 2. | 19980 | 32.3% | 3.4%(+28.8)#2 | 3.1%(+29.2)#147 |
| 3. | 19954 | 14.6% | 3.4%(+11.1)#3 | 3.1%(+11.5)#833 |
| 4. | 19731 | 11.7% | 3.4%(+8.22)#4 | 3.1%(+8.60)#1,415 |
| 5. | 19979 | 9.5% | 3.4%(+6.08)#5 | 3.1%(+6.46)#2,247 |
| 6. | 19960 | 8.8% | 3.4%(+5.30)#6 | 3.1%(+5.68)#2,722 |
| 7. | 19706 | 6.6% | 3.4%(+3.11)#7 | 3.1%(+3.50)#5,098 |
| 8. | 19952 | 5.8% | 3.4%(+2.38)#8 | 3.1%(+2.76)#6,484 |
| 9. | 19933 | 5.5% | 3.4%(+2.09)#9 | 3.1%(+2.47)#7,173 |
| 10. | 19947 | 5.2% | 3.4%(+1.79)#10 | 3.1%(+2.17)#7,998 |
| 11. | 19703 | 5.1% | 3.4%(+1.63)#11 | 3.1%(+2.01)#8,455 |
| 12. | 19931 | 5.0% | 3.4%(+1.59)#12 | 3.1%(+1.97)#8,592 |
| 13. | 19956 | 5.0% | 3.4%(+1.53)#13 | 3.1%(+1.91)#8,776 |
| 14. | 19805 | 4.9% | 3.4%(+1.49)#14 | 3.1%(+1.87)#8,909 |
| 15. | 19904 | 4.8% | 3.4%(+1.38)#15 | 3.1%(+1.76)#9,256 |
| 16. | 19963 | 4.7% | 3.4%(+1.30)#16 | 3.1%(+1.68)#9,506 |
| 17. | 19938 | 4.5% | 3.4%(+1.08)#17 | 3.1%(+1.46)#10,307 |
| 18. | 19734 | 4.5% | 3.4%(+1.01)#18 | 3.1%(+1.39)#10,564 |
| 19. | 19953 | 4.4% | 3.4%(+1.000)#19 | 3.1%(+1.38)#10,605 |
| 20. | 19962 | 4.0% | 3.4%(+0.552)#20 | 3.1%(+0.932)#12,351 |
| 21. | 19973 | 4.0% | 3.4%(+0.521)#21 | 3.1%(+0.902)#12,502 |
| 22. | 19808 | 3.9% | 3.4%(+0.495)#22 | 3.1%(+0.876)#12,614 |
| 23. | 19804 | 3.9% | 3.4%(+0.492)#23 | 3.1%(+0.873)#12,627 |
| 24. | 19975 | 3.9% | 3.4%(+0.455)#24 | 3.1%(+0.836)#12,790 |
| 25. | 19940 | 3.9% | 3.4%(+0.438)#25 | 3.1%(+0.818)#12,862 |
| 26. | 19713 | 3.9% | 3.4%(+0.434)#26 | 3.1%(+0.815)#12,878 |
| 27. | 19977 | 3.9% | 3.4%(+0.422)#27 | 3.1%(+0.803)#12,944 |
| 28. | 19950 | 3.7% | 3.4%(+0.298)#28 | 3.1%(+0.679)#13,472 |
| 29. | 19720 | 3.6% | 3.4%(+0.151)#29 | 3.1%(+0.532)#14,158 |
| 30. | 19701 | 3.6% | 3.4%(+0.142)#30 | 3.1%(+0.523)#14,190 |
| 31. | 19968 | 3.6% | 3.4%(+0.126)#31 | 3.1%(+0.507)#14,262 |
| 32. | 19946 | 3.4% | 3.4%(-0.007)#32 | 3.1%(+0.374)#14,896 |
| 33. | 19802 | 3.4% | 3.4%(-0.023)#33 | 3.1%(+0.358)#14,972 |
| 34. | 19966 | 3.3% | 3.4%(-0.108)#34 | 3.1%(+0.273)#15,359 |
| 35. | 19941 | 3.3% | 3.4%(-0.112)#35 | 3.1%(+0.268)#15,380 |
| 36. | 19945 | 3.3% | 3.4%(-0.160)#36 | 3.1%(+0.221)#15,604 |
| 37. | 19901 | 3.1% | 3.4%(-0.299)#37 | 3.1%(+0.082)#16,283 |
| 38. | 19934 | 3.1% | 3.4%(-0.302)#38 | 3.1%(+0.079)#16,299 |
| 39. | 19801 | 3.1% | 3.4%(-0.313)#39 | 3.1%(+0.068)#16,358 |
| 40. | 19702 | 3.1% | 3.4%(-0.360)#40 | 3.1%(+0.021)#16,579 |
| 41. | 19943 | 2.9% | 3.4%(-0.509)#41 | 3.1%(-0.128)#17,292 |
| 42. | 19711 | 2.5% | 3.4%(-0.912)#42 | 3.1%(-0.532)#19,373 |
| 43. | 19810 | 2.5% | 3.4%(-0.968)#43 | 3.1%(-0.587)#19,642 |
| 44. | 19958 | 2.4% | 3.4%(-1.05)#44 | 3.1%(-0.666)#20,054 |
| 45. | 19951 | 2.3% | 3.4%(-1.12)#45 | 3.1%(-0.737)#20,417 |
| 46. | 19939 | 2.1% | 3.4%(-1.32)#46 | 3.1%(-0.937)#21,388 |
| 47. | 19803 | 2.1% | 3.4%(-1.39)#47 | 3.1%(-1.01)#21,748 |
| 48. | 19709 | 1.9% | 3.4%(-1.57)#48 | 3.1%(-1.19)#22,529 |
| 49. | 19707 | 1.7% | 3.4%(-1.71)#49 | 3.1%(-1.33)#23,183 |
| 50. | 19964 | 1.7% | 3.4%(-1.73)#50 | 3.1%(-1.35)#23,283 |
| 51. | 19971 | 1.7% | 3.4%(-1.74)#51 | 3.1%(-1.36)#23,310 |
| 52. | 19970 | 1.2% | 3.4%(-2.22)#52 | 3.1%(-1.84)#25,170 |
| 53. | 19944 | 1.2% | 3.4%(-2.23)#53 | 3.1%(-1.85)#25,185 |
| 54. | 19809 | 1.2% | 3.4%(-2.26)#54 | 3.1%(-1.88)#25,306 |
| 55. | 19967 | 0.93% | 3.4%(-2.52)#55 | 3.1%(-2.13)#26,102 |
| 56. | 19730 | 0.76% | 3.4%(-2.69)#56 | 3.1%(-2.30)#26,605 |
| 57. | 19717 | 0.33% | 3.4%(-3.12)#57 | 3.1%(-2.74)#27,513 |
| 58. | 19806 | 0.25% | 3.4%(-3.20)#58 | 3.1%(-2.82)#27,632 |
| 59. | 19930 | 0.21% | 3.4%(-3.24)#59 | 3.1%(-2.86)#27,677 |
1
Common Questions
What are the Top 10 Zip Codes with the Highest Percentage of Population Employed in Installation, Maintenance & Repair in Delaware?
Top 10 Zip Codes with the Highest Percentage of Population Employed in Installation, Maintenance & Repair in Delaware are:
What zip code has the Highest Percentage of Population Employed in Installation, Maintenance & Repair in Delaware?
19710 has the Highest Percentage of Population Employed in Installation, Maintenance & Repair in Delaware with 52.9%.
What is the Percentage of Population Employed in Installation, Maintenance & Repair in the State of Delaware?
Percentage of Population Employed in Installation, Maintenance & Repair in Delaware is 3.4%.
What is the Percentage of Population Employed in Installation, Maintenance & Repair in the United States?
Percentage of Population Employed in Installation, Maintenance & Repair in the United States is 3.1%.