Hardin, TX Map & Demographics
Hardin Map
Hardin Overview
$29,613
PER CAPITA INCOME
$63,621
AVG FAMILY INCOME
$62,716
AVG HOUSEHOLD INCOME
65.8%
WAGE / INCOME GAP [ % ]
34.2¢/ $1
WAGE / INCOME GAP [ $ ]
0.31
INEQUALITY / GINI INDEX
721
TOTAL POPULATION
349
MALE POPULATION
372
FEMALE POPULATION
93.82
MALES / 100 FEMALES
106.59
FEMALES / 100 MALES
43.0
MEDIAN AGE
2.9
AVG FAMILY SIZE
2.3
AVG HOUSEHOLD SIZE
279
LABOR FORCE [ PEOPLE ]
48.9%
PERCENT IN LABOR FORCE
1.1%
UNEMPLOYMENT RATE
Hardin Zip Codes
Income in Hardin
Income Overview in Hardin
Per Capita Income in Hardin is $29,613, while median incomes of families and households are $63,621 and $62,716 respectively.
| Characteristic | Number | Measure |
| Per Capita Income | 721 | $29,613 |
| Median Family Income | 202 | $63,621 |
| Mean Family Income | 202 | $68,338 |
| Median Household Income | 315 | $62,716 |
| Mean Household Income | 315 | $66,472 |
| Income Deficit | 202 | $0 |
| Wage / Income Gap (%) | 721 | 65.76% |
| Wage / Income Gap ($) | 721 | 34.24¢ per $1 |
| Gini / Inequality Index | 721 | 0.31 |
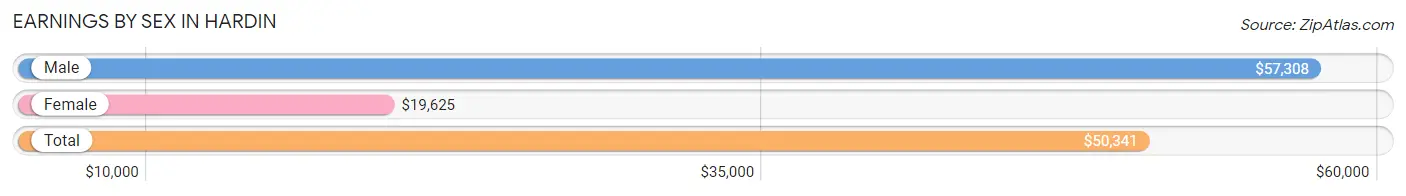
Earnings by Sex in Hardin
Average Earnings in Hardin are $50,341, $57,308 for men and $19,625 for women, a difference of 65.8%.
| Sex | Number | Average Earnings |
| Male | 156 (54.7%) | $57,308 |
| Female | 129 (45.3%) | $19,625 |
| Total | 285 (100.0%) | $50,341 |
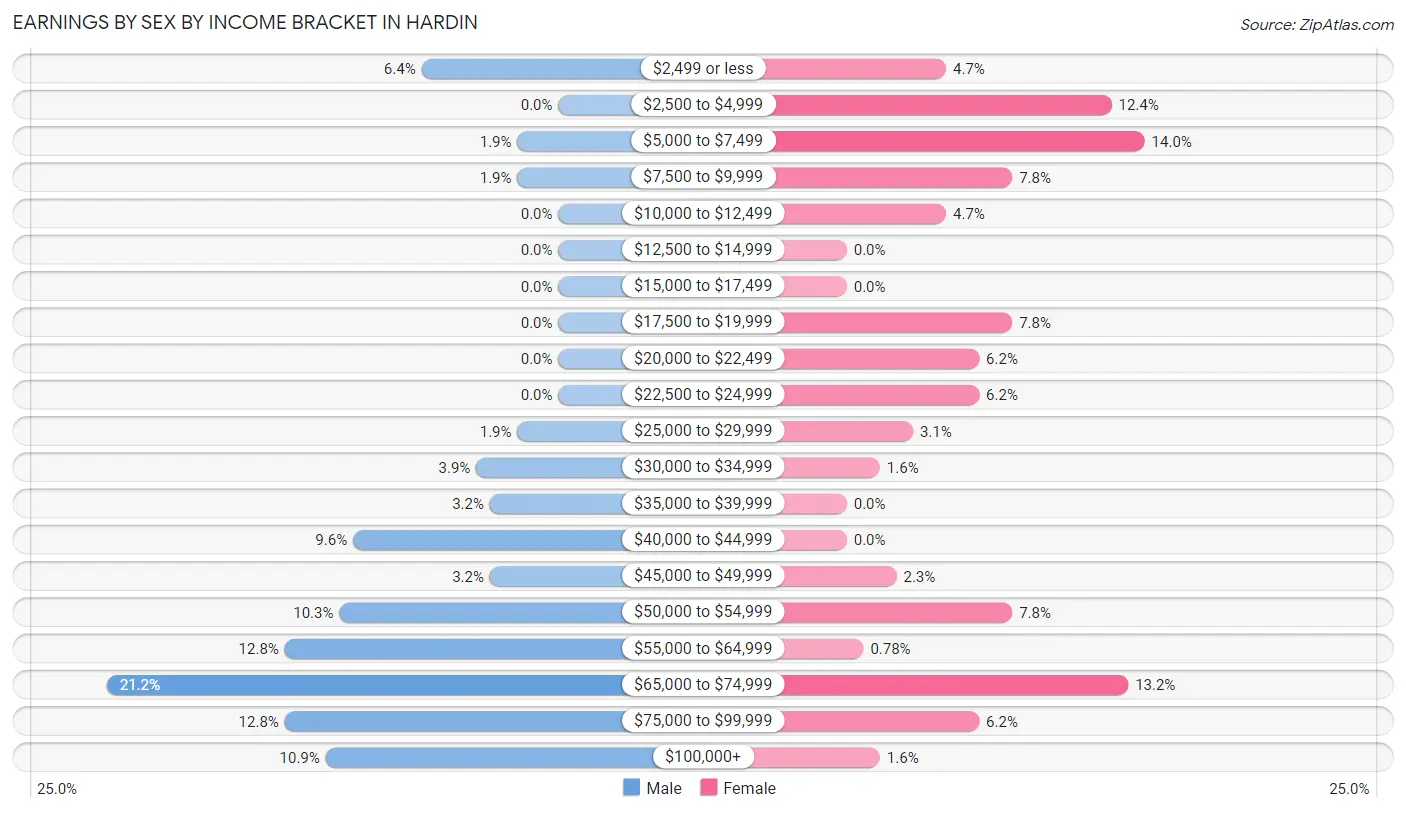
Earnings by Sex by Income Bracket in Hardin
The most common earnings brackets in Hardin are $65,000 to $74,999 for men (33 | 21.1%) and $5,000 to $7,499 for women (18 | 14.0%).
| Income | Male | Female |
| $2,499 or less | 10 (6.4%) | 6 (4.6%) |
| $2,500 to $4,999 | 0 (0.0%) | 16 (12.4%) |
| $5,000 to $7,499 | 3 (1.9%) | 18 (14.0%) |
| $7,500 to $9,999 | 3 (1.9%) | 10 (7.7%) |
| $10,000 to $12,499 | 0 (0.0%) | 6 (4.6%) |
| $12,500 to $14,999 | 0 (0.0%) | 0 (0.0%) |
| $15,000 to $17,499 | 0 (0.0%) | 0 (0.0%) |
| $17,500 to $19,999 | 0 (0.0%) | 10 (7.7%) |
| $20,000 to $22,499 | 0 (0.0%) | 8 (6.2%) |
| $22,500 to $24,999 | 0 (0.0%) | 8 (6.2%) |
| $25,000 to $29,999 | 3 (1.9%) | 4 (3.1%) |
| $30,000 to $34,999 | 6 (3.8%) | 2 (1.5%) |
| $35,000 to $39,999 | 5 (3.2%) | 0 (0.0%) |
| $40,000 to $44,999 | 15 (9.6%) | 0 (0.0%) |
| $45,000 to $49,999 | 5 (3.2%) | 3 (2.3%) |
| $50,000 to $54,999 | 16 (10.3%) | 10 (7.7%) |
| $55,000 to $64,999 | 20 (12.8%) | 1 (0.8%) |
| $65,000 to $74,999 | 33 (21.1%) | 17 (13.2%) |
| $75,000 to $99,999 | 20 (12.8%) | 8 (6.2%) |
| $100,000+ | 17 (10.9%) | 2 (1.5%) |
| Total | 156 (100.0%) | 129 (100.0%) |
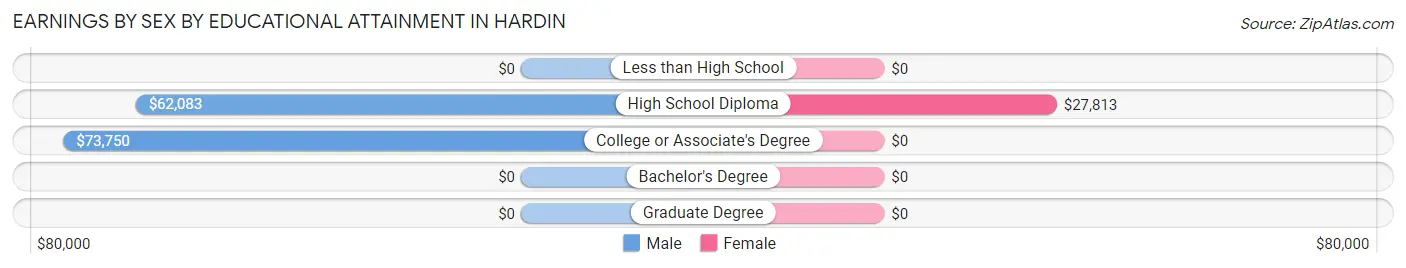
Earnings by Sex by Educational Attainment in Hardin
| Educational Attainment | Male Income | Female Income |
| Less than High School | - | - |
| High School Diploma | $62,083 | $27,813 |
| College or Associate's Degree | $73,750 | $0 |
| Bachelor's Degree | - | - |
| Graduate Degree | - | - |
| Total | $63,750 | $0 |
Family Income in Hardin
Family Income Brackets in Hardin
According to the Hardin family income data, there are 51 families falling into the $50,000 to $74,999 income range, which is the most common income bracket and makes up 25.3% of all families.
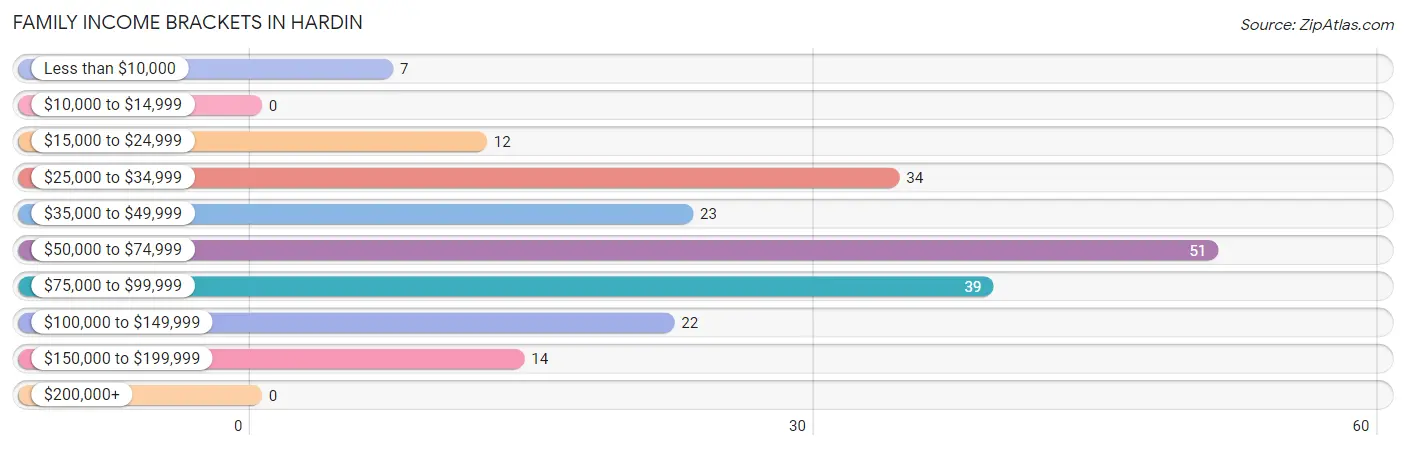
| Income Bracket | # Families | % Families |
| Less than $10,000 | 7 | 3.5% |
| $10,000 to $14,999 | 0 | 0.0% |
| $15,000 to $24,999 | 12 | 5.9% |
| $25,000 to $34,999 | 34 | 16.8% |
| $35,000 to $49,999 | 23 | 11.4% |
| $50,000 to $74,999 | 51 | 25.2% |
| $75,000 to $99,999 | 39 | 19.3% |
| $100,000 to $149,999 | 22 | 10.9% |
| $150,000 to $199,999 | 14 | 6.9% |
| $200,000+ | 0 | 0.0% |
Family Income by Famaliy Size in Hardin
3-person families (76 | 37.6%) account for the highest median family income in Hardin with $63,824 per family, while 2-person families (81 | 40.1%) have the highest median income of $31,484 per family member.
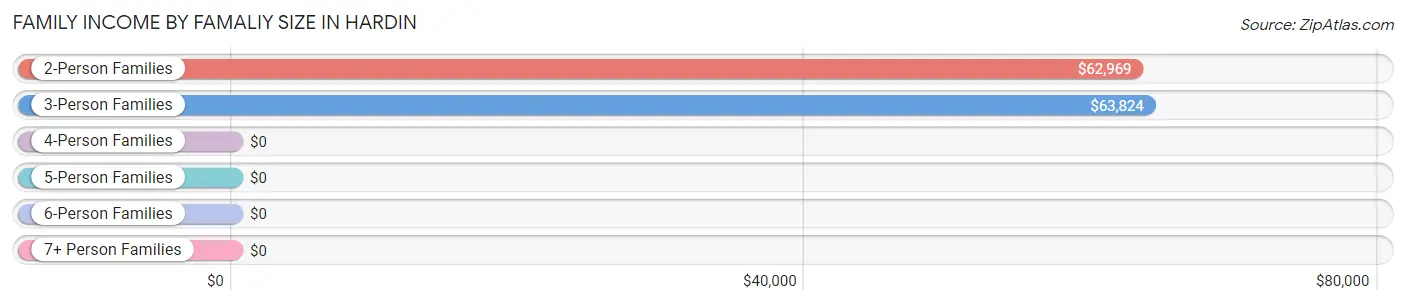
| Income Bracket | # Families | Median Income |
| 2-Person Families | 81 (40.1%) | $62,969 |
| 3-Person Families | 76 (37.6%) | $63,824 |
| 4-Person Families | 43 (21.3%) | $0 |
| 5-Person Families | 0 (0.0%) | $0 |
| 6-Person Families | 2 (1.0%) | $0 |
| 7+ Person Families | 0 (0.0%) | $0 |
| Total | 202 (100.0%) | $63,621 |
Family Income by Number of Earners in Hardin
The median family income in Hardin is $63,621, with families comprising 2 earners (52) having the highest median family income of $110,714, while families with no earners (54) have the lowest median family income of $31,167, accounting for 25.7% and 26.7% of families, respectively.
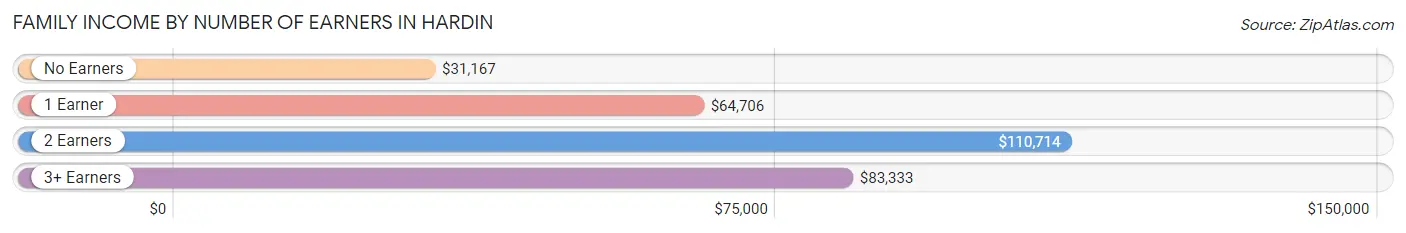
| Number of Earners | # Families | Median Income |
| No Earners | 54 (26.7%) | $31,167 |
| 1 Earner | 86 (42.6%) | $64,706 |
| 2 Earners | 52 (25.7%) | $110,714 |
| 3+ Earners | 10 (5.0%) | $83,333 |
| Total | 202 (100.0%) | $63,621 |
Household Income in Hardin
Household Income Brackets in Hardin
With 72 households falling in the category, the $50,000 to $74,999 income range is the most frequent in Hardin, accounting for 22.9% of all households.
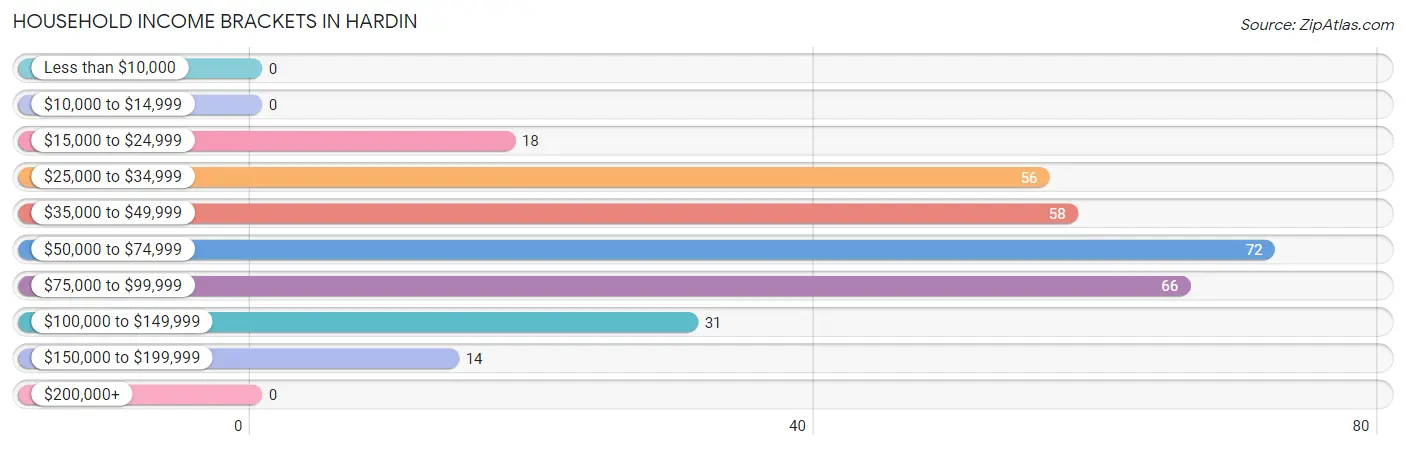
| Income Bracket | # Households | % Households |
| Less than $10,000 | 0 | 0.0% |
| $10,000 to $14,999 | 0 | 0.0% |
| $15,000 to $24,999 | 18 | 5.7% |
| $25,000 to $34,999 | 56 | 17.8% |
| $35,000 to $49,999 | 58 | 18.4% |
| $50,000 to $74,999 | 72 | 22.9% |
| $75,000 to $99,999 | 66 | 21.0% |
| $100,000 to $149,999 | 31 | 9.8% |
| $150,000 to $199,999 | 14 | 4.4% |
| $200,000+ | 0 | 0.0% |
Household Income by Householder Age in Hardin
The median household income in Hardin is $62,716, with the highest median household income of $83,438 found in the 25 to 44 years age bracket for the primary householder. A total of 87 households (27.6%) fall into this category. Meanwhile, the 15 to 24 years age bracket for the primary householder has the lowest median household income of $0, with 10 households (3.2%) in this group.
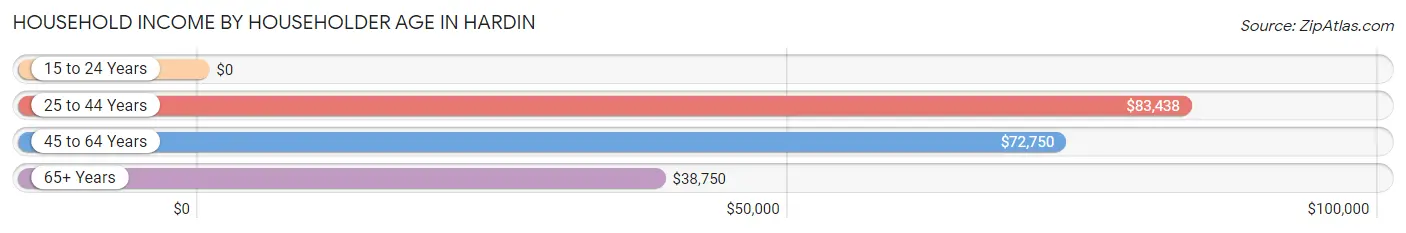
| Income Bracket | # Households | Median Income |
| 15 to 24 Years | 10 (3.2%) | $0 |
| 25 to 44 Years | 87 (27.6%) | $83,438 |
| 45 to 64 Years | 98 (31.1%) | $72,750 |
| 65+ Years | 120 (38.1%) | $38,750 |
| Total | 315 (100.0%) | $62,716 |
Poverty in Hardin
Income Below Poverty by Sex and Age in Hardin
With 5.4% poverty level for males and 5.7% for females among the residents of Hardin, under 5 year old males and 18 to 24 year old females are the most vulnerable to poverty, with 16 males (80.0%) and 10 females (34.5%) in their respective age groups living below the poverty level.
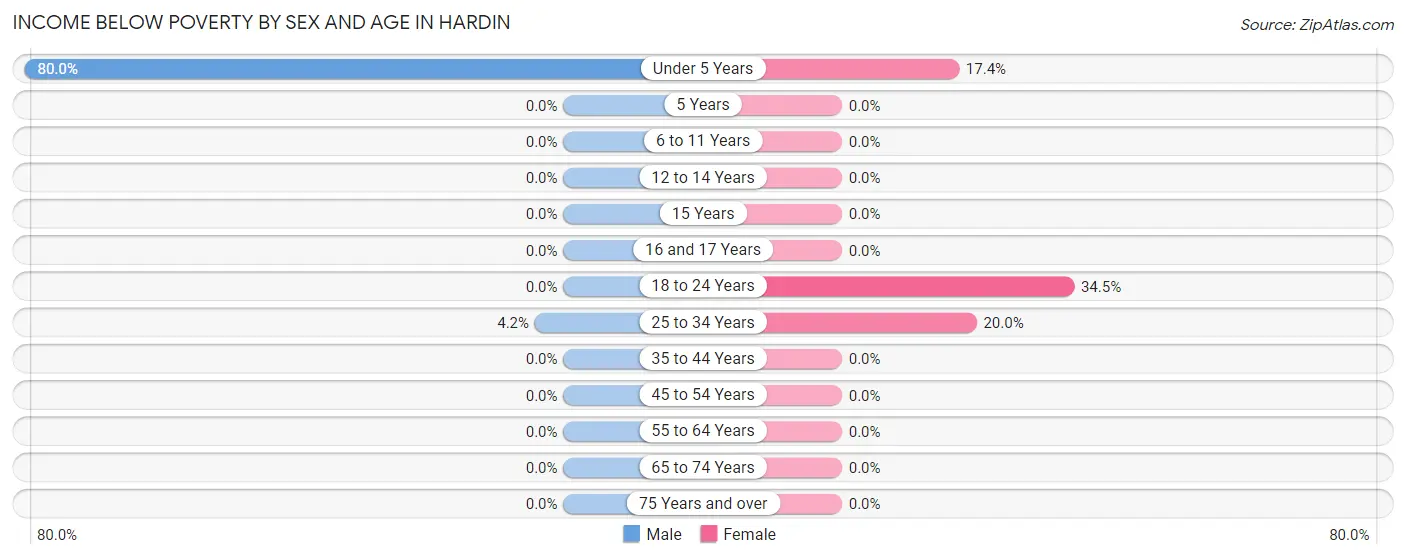
| Age Bracket | Male | Female |
| Under 5 Years | 16 (80.0%) | 4 (17.4%) |
| 5 Years | 0 (0.0%) | 0 (0.0%) |
| 6 to 11 Years | 0 (0.0%) | 0 (0.0%) |
| 12 to 14 Years | 0 (0.0%) | 0 (0.0%) |
| 15 Years | 0 (0.0%) | 0 (0.0%) |
| 16 and 17 Years | 0 (0.0%) | 0 (0.0%) |
| 18 to 24 Years | 0 (0.0%) | 10 (34.5%) |
| 25 to 34 Years | 3 (4.2%) | 7 (20.0%) |
| 35 to 44 Years | 0 (0.0%) | 0 (0.0%) |
| 45 to 54 Years | 0 (0.0%) | 0 (0.0%) |
| 55 to 64 Years | 0 (0.0%) | 0 (0.0%) |
| 65 to 74 Years | 0 (0.0%) | 0 (0.0%) |
| 75 Years and over | 0 (0.0%) | 0 (0.0%) |
| Total | 19 (5.4%) | 21 (5.7%) |
Income Above Poverty by Sex and Age in Hardin
According to the poverty statistics in Hardin, males aged 6 to 11 years and females aged 6 to 11 years are the age groups that are most secure financially, with 100.0% of males and 100.0% of females in these age groups living above the poverty line.
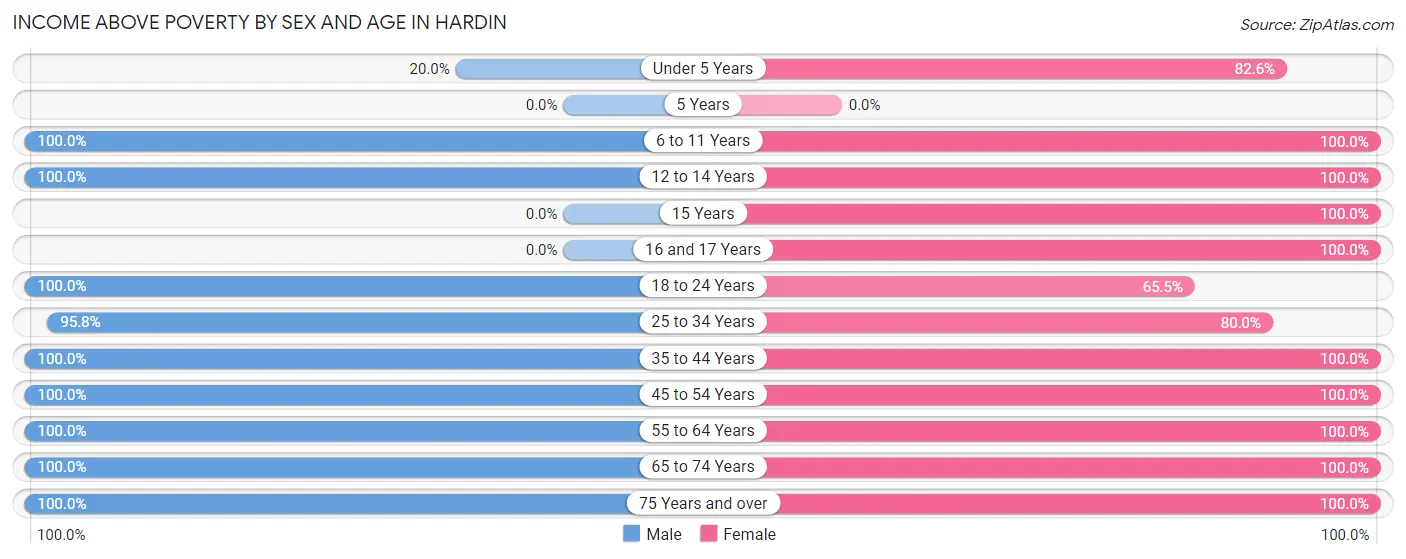
| Age Bracket | Male | Female |
| Under 5 Years | 4 (20.0%) | 19 (82.6%) |
| 5 Years | 0 (0.0%) | 0 (0.0%) |
| 6 to 11 Years | 22 (100.0%) | 17 (100.0%) |
| 12 to 14 Years | 23 (100.0%) | 27 (100.0%) |
| 15 Years | 0 (0.0%) | 18 (100.0%) |
| 16 and 17 Years | 0 (0.0%) | 4 (100.0%) |
| 18 to 24 Years | 34 (100.0%) | 19 (65.5%) |
| 25 to 34 Years | 68 (95.8%) | 28 (80.0%) |
| 35 to 44 Years | 49 (100.0%) | 14 (100.0%) |
| 45 to 54 Years | 18 (100.0%) | 55 (100.0%) |
| 55 to 64 Years | 29 (100.0%) | 51 (100.0%) |
| 65 to 74 Years | 46 (100.0%) | 34 (100.0%) |
| 75 Years and over | 37 (100.0%) | 65 (100.0%) |
| Total | 330 (94.6%) | 351 (94.4%) |
Income Below Poverty Among Married-Couple Families in Hardin
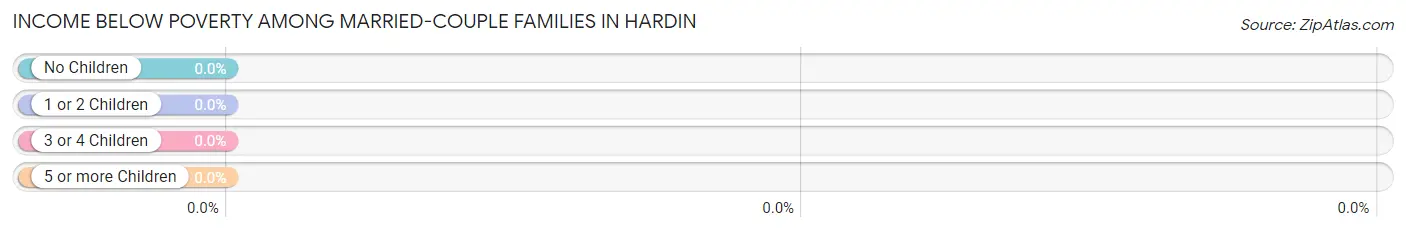
| Children | Above Poverty | Below Poverty |
| No Children | 83 (100.0%) | 0 (0.0%) |
| 1 or 2 Children | 20 (100.0%) | 0 (0.0%) |
| 3 or 4 Children | 2 (100.0%) | 0 (0.0%) |
| 5 or more Children | 0 (0.0%) | 0 (0.0%) |
| Total | 105 (100.0%) | 0 (0.0%) |
Income Below Poverty Among Single-Parent Households in Hardin
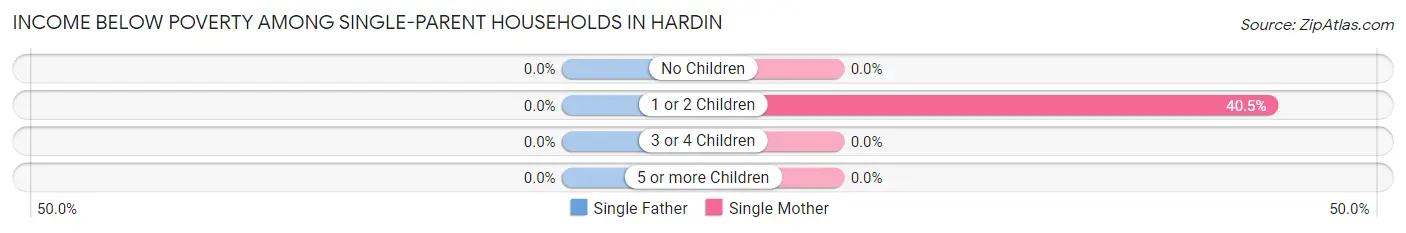
| Children | Single Father | Single Mother |
| No Children | 0 (0.0%) | 0 (0.0%) |
| 1 or 2 Children | 0 (0.0%) | 17 (40.5%) |
| 3 or 4 Children | 0 (0.0%) | 0 (0.0%) |
| 5 or more Children | 0 (0.0%) | 0 (0.0%) |
| Total | 0 (0.0%) | 17 (26.2%) |
Income Below Poverty Among Married-Couple vs Single-Parent Households in Hardin
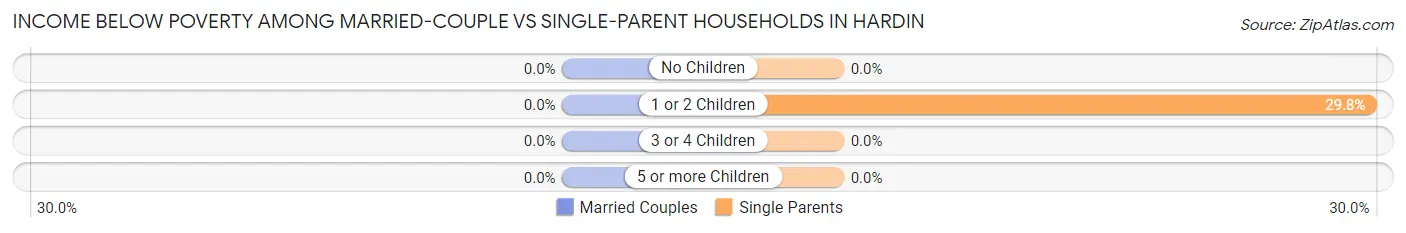
| Children | Married-Couple Families | Single-Parent Households |
| No Children | 0 (0.0%) | 0 (0.0%) |
| 1 or 2 Children | 0 (0.0%) | 17 (29.8%) |
| 3 or 4 Children | 0 (0.0%) | 0 (0.0%) |
| 5 or more Children | 0 (0.0%) | 0 (0.0%) |
| Total | 0 (0.0%) | 17 (17.5%) |
Race in Hardin
The most populous races in Hardin are White / Caucasian (661 | 91.7%), Hispanic or Latino (45 | 6.2%), and Two or more Races (41 | 5.7%).
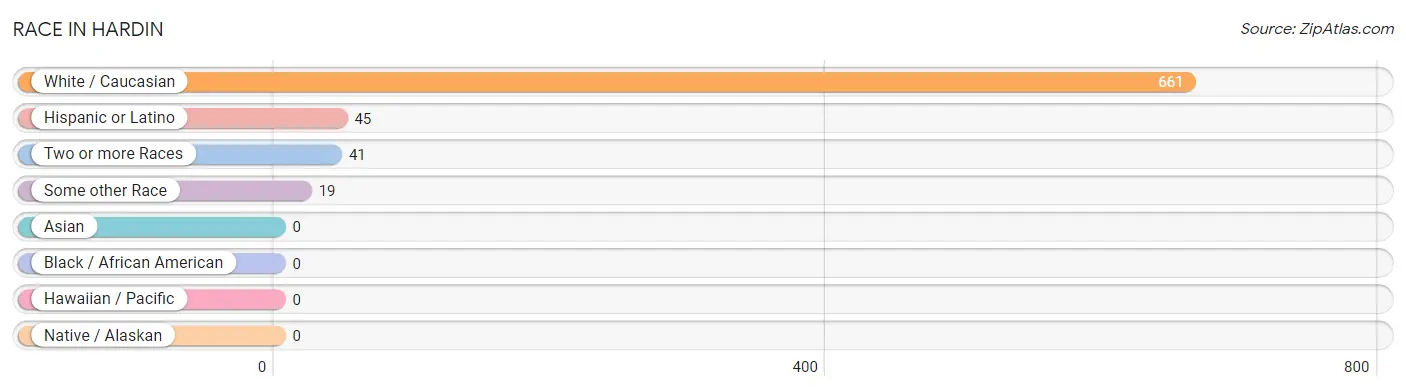
| Race | # Population | % Population |
| Asian | 0 | 0.0% |
| Black / African American | 0 | 0.0% |
| Hawaiian / Pacific | 0 | 0.0% |
| Hispanic or Latino | 45 | 6.2% |
| Native / Alaskan | 0 | 0.0% |
| White / Caucasian | 661 | 91.7% |
| Two or more Races | 41 | 5.7% |
| Some other Race | 19 | 2.6% |
| Total | 721 | 100.0% |
Ancestry in Hardin
The most populous ancestries reported in Hardin are Irish (125 | 17.3%), French (54 | 7.5%), German (54 | 7.5%), English (47 | 6.5%), and Mexican (45 | 6.2%), together accounting for 45.1% of all Hardin residents.
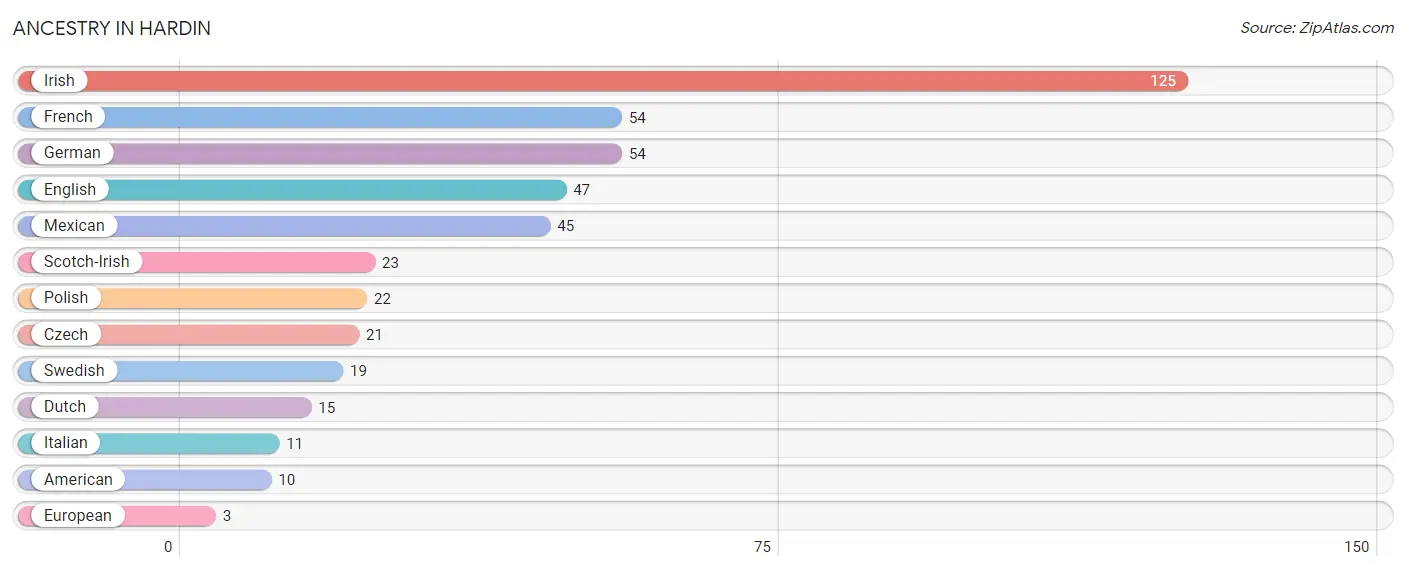
| Ancestry | # Population | % Population |
| American | 10 | 1.4% |
| Czech | 21 | 2.9% |
| Dutch | 15 | 2.1% |
| English | 47 | 6.5% |
| European | 3 | 0.4% |
| French | 54 | 7.5% |
| German | 54 | 7.5% |
| Irish | 125 | 17.3% |
| Italian | 11 | 1.5% |
| Mexican | 45 | 6.2% |
| Polish | 22 | 3.0% |
| Scotch-Irish | 23 | 3.2% |
| Swedish | 19 | 2.6% | View All 13 Rows |
Immigrants in Hardin
The most numerous immigrant groups reported in Hardin came from , and Canada (1 | 0.1%), together accounting for 0.1% of all Hardin residents.

| Immigration Origin | # Population | % Population |
| Canada | 1 | 0.1% | View All 1 Rows |
Sex and Age in Hardin
Sex and Age in Hardin
The most populous age groups in Hardin are 25 to 29 Years (55 | 15.8%) for men and 10 to 14 Years (44 | 11.8%) for women.
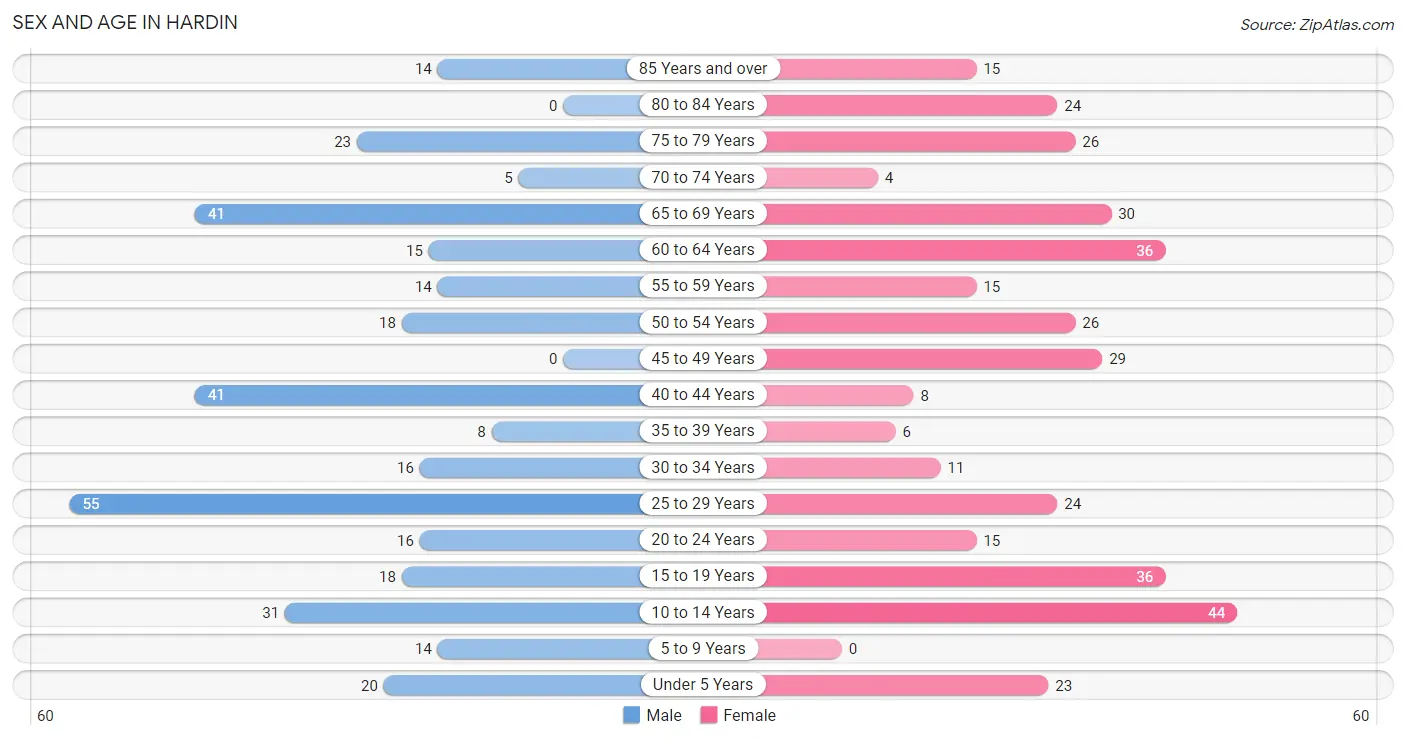
| Age Bracket | Male | Female |
| Under 5 Years | 20 (5.7%) | 23 (6.2%) |
| 5 to 9 Years | 14 (4.0%) | 0 (0.0%) |
| 10 to 14 Years | 31 (8.9%) | 44 (11.8%) |
| 15 to 19 Years | 18 (5.2%) | 36 (9.7%) |
| 20 to 24 Years | 16 (4.6%) | 15 (4.0%) |
| 25 to 29 Years | 55 (15.8%) | 24 (6.5%) |
| 30 to 34 Years | 16 (4.6%) | 11 (3.0%) |
| 35 to 39 Years | 8 (2.3%) | 6 (1.6%) |
| 40 to 44 Years | 41 (11.7%) | 8 (2.1%) |
| 45 to 49 Years | 0 (0.0%) | 29 (7.8%) |
| 50 to 54 Years | 18 (5.2%) | 26 (7.0%) |
| 55 to 59 Years | 14 (4.0%) | 15 (4.0%) |
| 60 to 64 Years | 15 (4.3%) | 36 (9.7%) |
| 65 to 69 Years | 41 (11.7%) | 30 (8.1%) |
| 70 to 74 Years | 5 (1.4%) | 4 (1.1%) |
| 75 to 79 Years | 23 (6.6%) | 26 (7.0%) |
| 80 to 84 Years | 0 (0.0%) | 24 (6.5%) |
| 85 Years and over | 14 (4.0%) | 15 (4.0%) |
| Total | 349 (100.0%) | 372 (100.0%) |
Families and Households in Hardin
Median Family Size in Hardin
The median family size in Hardin is 2.90 persons per family, with single female/mother families (65 | 32.2%) accounting for the largest median family size of 3.11 persons per family. On the other hand, married-couple families (105 | 52.0%) represent the smallest median family size with 2.74 persons per family.
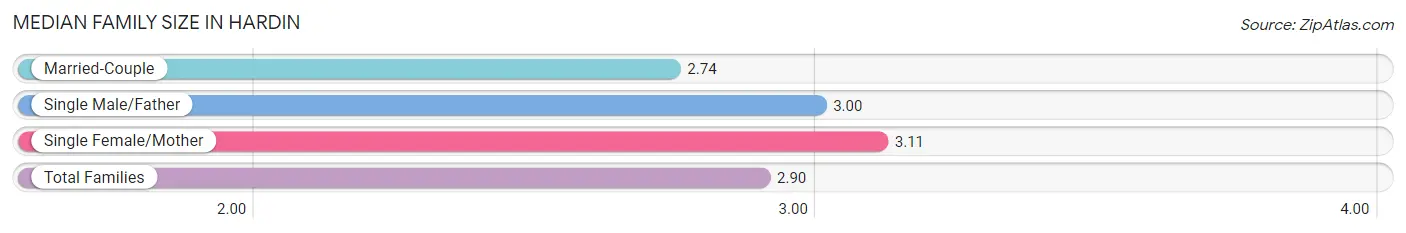
| Family Type | # Families | Family Size |
| Married-Couple | 105 (52.0%) | 2.74 |
| Single Male/Father | 32 (15.8%) | 3.00 |
| Single Female/Mother | 65 (32.2%) | 3.11 |
| Total Families | 202 (100.0%) | 2.90 |
Median Household Size in Hardin
The median household size in Hardin is 2.29 persons per household, with single female/mother households (65 | 20.6%) accounting for the largest median household size of 3.15 persons per household. non-family households (113 | 35.9%) represent the smallest median household size with 1.17 persons per household.
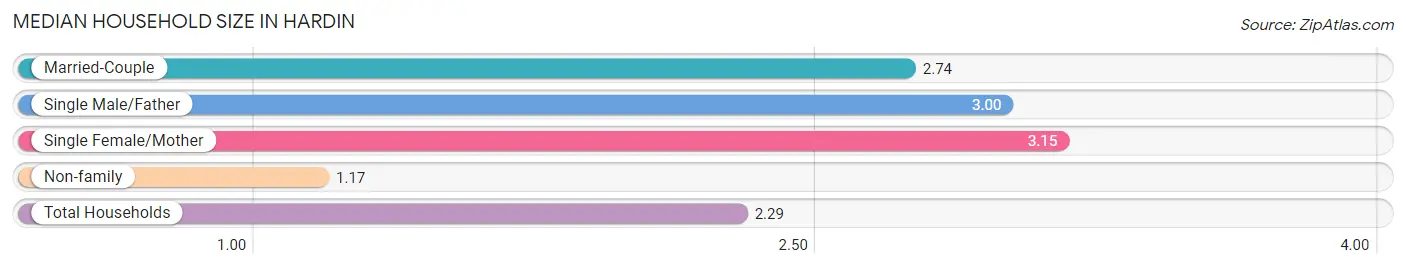
| Household Type | # Households | Household Size |
| Married-Couple | 105 (33.3%) | 2.74 |
| Single Male/Father | 32 (10.2%) | 3.00 |
| Single Female/Mother | 65 (20.6%) | 3.15 |
| Non-family | 113 (35.9%) | 1.17 |
| Total Households | 315 (100.0%) | 2.29 |
Household Size by Marriage Status in Hardin
Out of a total of 315 households in Hardin, 202 (64.1%) are family households, while 113 (35.9%) are nonfamily households. The most numerous type of family households are 3-person households, comprising 83, and the most common type of nonfamily households are 1-person households, comprising 97.
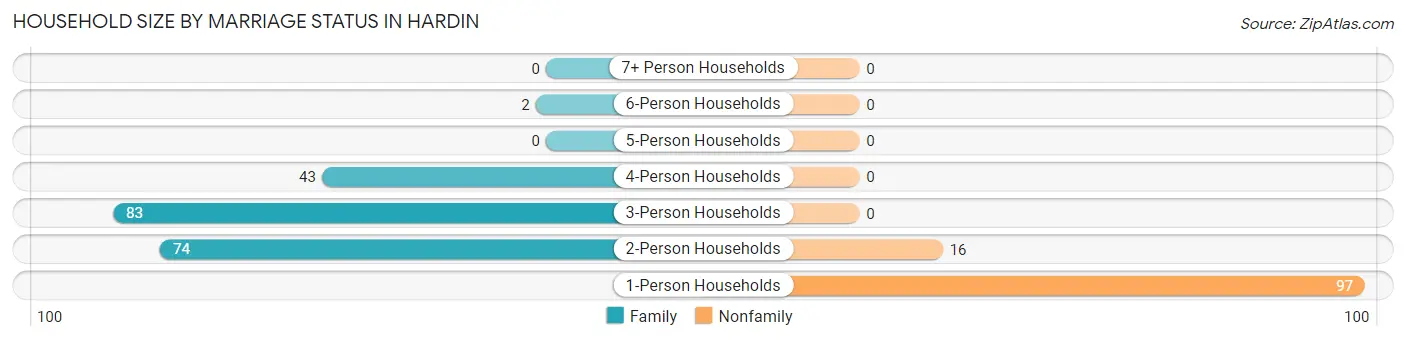
| Household Size | Family Households | Nonfamily Households |
| 1-Person Households | - | 97 (30.8%) |
| 2-Person Households | 74 (23.5%) | 16 (5.1%) |
| 3-Person Households | 83 (26.4%) | 0 (0.0%) |
| 4-Person Households | 43 (13.7%) | 0 (0.0%) |
| 5-Person Households | 0 (0.0%) | 0 (0.0%) |
| 6-Person Households | 2 (0.6%) | 0 (0.0%) |
| 7+ Person Households | 0 (0.0%) | 0 (0.0%) |
| Total | 202 (64.1%) | 113 (35.9%) |
Female Fertility in Hardin
Fertility by Age in Hardin
Average fertility rate in Hardin is 124.0 births per 1,000 women. Women in the age bracket of 20 to 34 years have the highest fertility rate with 240.0 births per 1,000 women. Women in the age bracket of 20 to 34 years acount for 75.0% of all women with births.
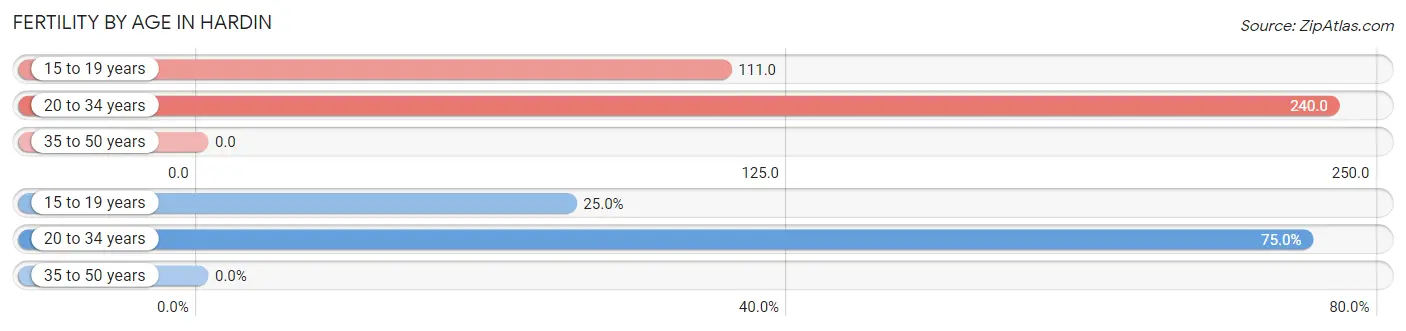
| Age Bracket | Women with Births | Births / 1,000 Women |
| 15 to 19 years | 4 (25.0%) | 111.0 |
| 20 to 34 years | 12 (75.0%) | 240.0 |
| 35 to 50 years | 0 (0.0%) | 0.0 |
| Total | 16 (100.0%) | 124.0 |
Fertility by Age by Marriage Status in Hardin
12.5% of women with births (16) in Hardin are married. The highest percentage of unmarried women with births falls into 15 to 19 years age bracket with 100.0% of them unmarried at the time of birth, while the lowest percentage of unmarried women with births belong to 20 to 34 years age bracket with 83.3% of them unmarried.
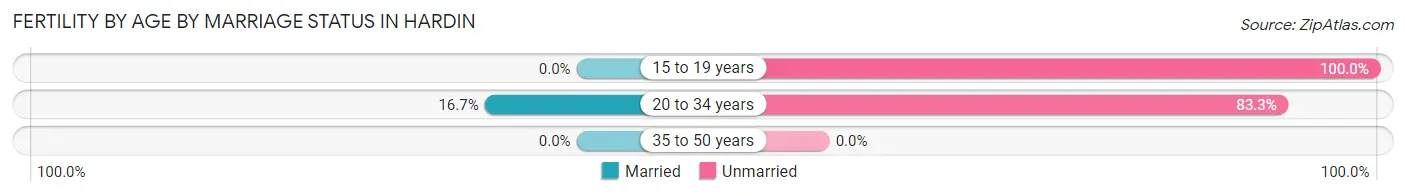
| Age Bracket | Married | Unmarried |
| 15 to 19 years | 0 (0.0%) | 4 (100.0%) |
| 20 to 34 years | 2 (16.7%) | 10 (83.3%) |
| 35 to 50 years | 0 (0.0%) | 0 (0.0%) |
| Total | 2 (12.5%) | 14 (87.5%) |
Fertility by Education in Hardin
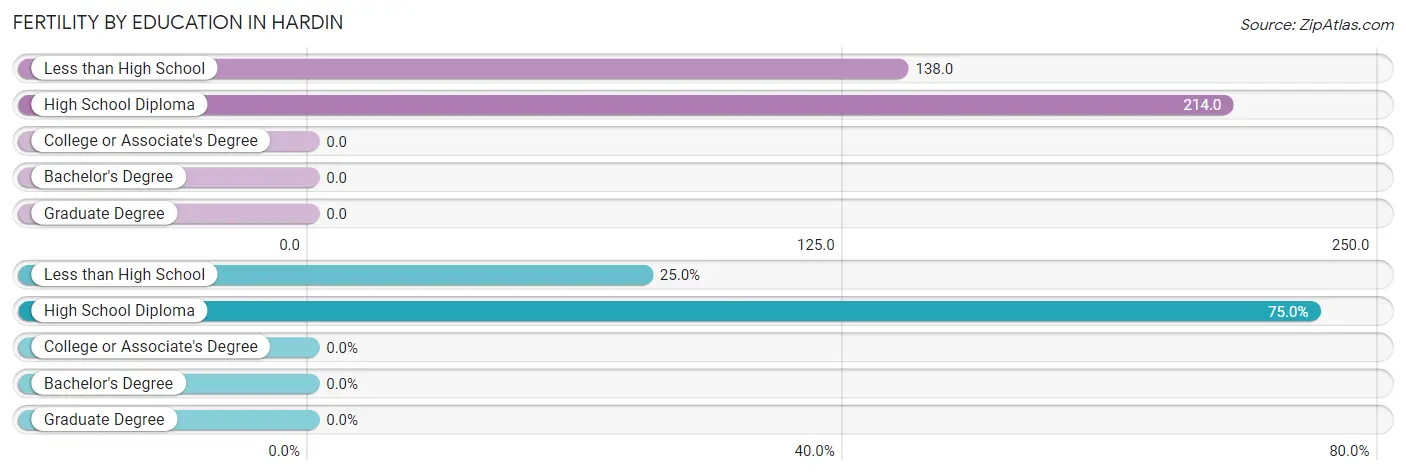
| Educational Attainment | Women with Births | Births / 1,000 Women |
| Less than High School | 4 (25.0%) | 138.0 |
| High School Diploma | 12 (75.0%) | 214.0 |
| College or Associate's Degree | 0 (0.0%) | 0.0 |
| Bachelor's Degree | 0 (0.0%) | 0.0 |
| Graduate Degree | 0 (0.0%) | 0.0 |
| Total | 16 (100.0%) | 124.0 |
Fertility by Education by Marriage Status in Hardin
87.5% of women with births in Hardin are unmarried. Women with the educational attainment of high school diploma are most likely to be married with 16.7% of them married at childbirth, while women with the educational attainment of less than high school are least likely to be married with 100.0% of them unmarried at childbirth.
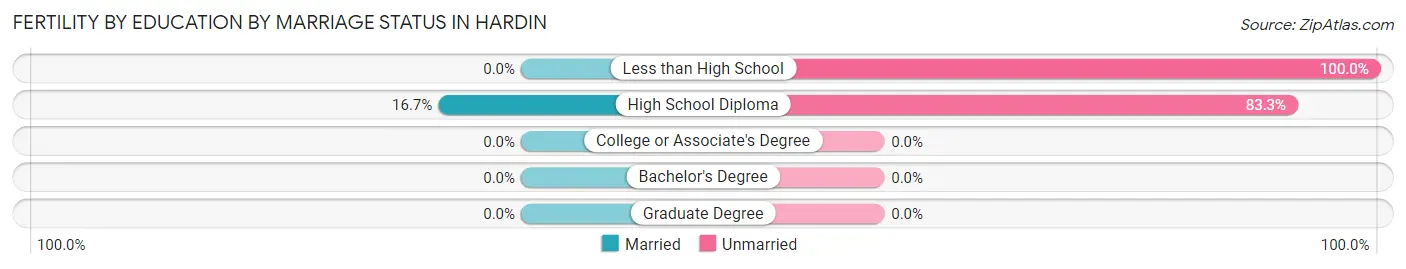
| Educational Attainment | Married | Unmarried |
| Less than High School | 0 (0.0%) | 4 (100.0%) |
| High School Diploma | 2 (16.7%) | 10 (83.3%) |
| College or Associate's Degree | 0 (0.0%) | 0 (0.0%) |
| Bachelor's Degree | 0 (0.0%) | 0 (0.0%) |
| Graduate Degree | 0 (0.0%) | 0 (0.0%) |
| Total | 2 (12.5%) | 14 (87.5%) |
Employment Characteristics in Hardin
Employment by Class of Employer in Hardin
Among the 256 employed individuals in Hardin, private company employees (199 | 77.7%), state government employees (26 | 10.2%), and self-employed (not incorporated) (12 | 4.7%) make up the most common classes of employment.
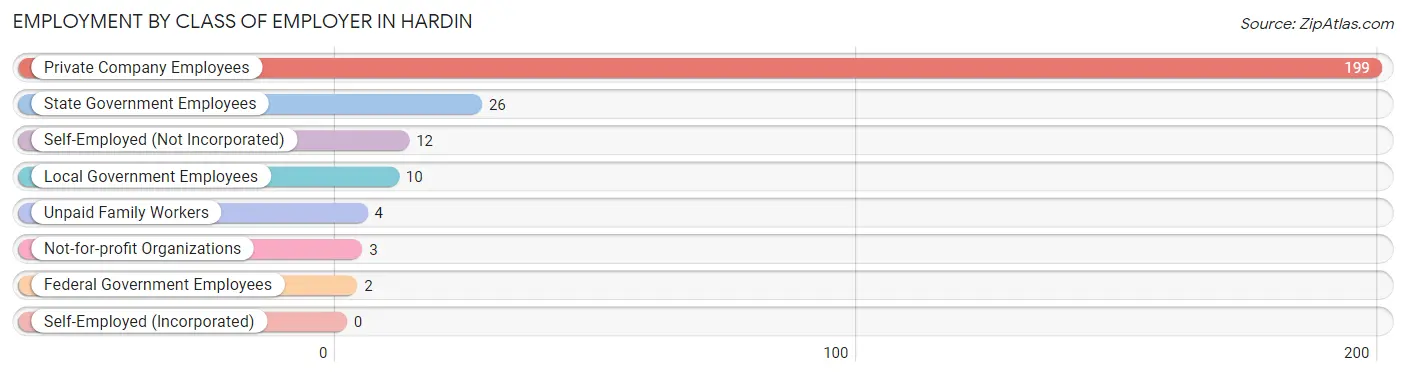
| Employer Class | # Employees | % Employees |
| Private Company Employees | 199 | 77.7% |
| Self-Employed (Incorporated) | 0 | 0.0% |
| Self-Employed (Not Incorporated) | 12 | 4.7% |
| Not-for-profit Organizations | 3 | 1.2% |
| Local Government Employees | 10 | 3.9% |
| State Government Employees | 26 | 10.2% |
| Federal Government Employees | 2 | 0.8% |
| Unpaid Family Workers | 4 | 1.6% |
| Total | 256 | 100.0% |
Employment Status by Age in Hardin
According to the labor force statistics for Hardin, out of the total population over 16 years of age (571), 48.9% or 279 individuals are in the labor force, with 1.1% or 3 of them unemployed. The age group with the highest labor force participation rate is 20 to 24 years, with 100.0% or 31 individuals in the labor force. Within the labor force, the 30 to 34 years age range has the highest percentage of unemployed individuals, with 12.0% or 3 of them being unemployed.
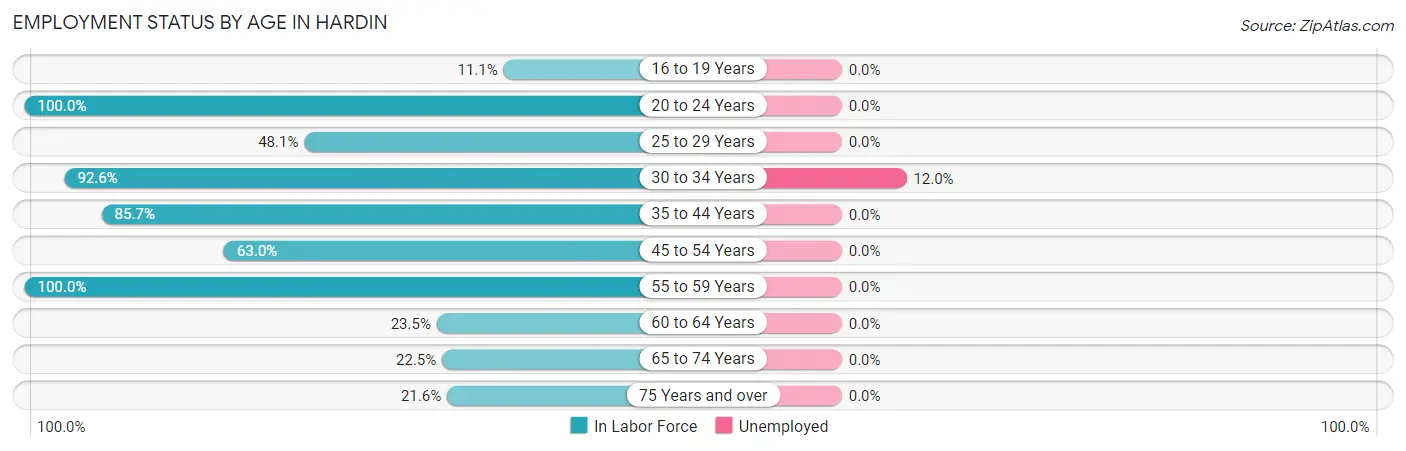
| Age Bracket | In Labor Force | Unemployed |
| 16 to 19 Years | 4 (11.1%) | 0 (0.0%) |
| 20 to 24 Years | 31 (100.0%) | 0 (0.0%) |
| 25 to 29 Years | 38 (48.1%) | 0 (0.0%) |
| 30 to 34 Years | 25 (92.6%) | 3 (12.0%) |
| 35 to 44 Years | 54 (85.7%) | 0 (0.0%) |
| 45 to 54 Years | 46 (63.0%) | 0 (0.0%) |
| 55 to 59 Years | 29 (100.0%) | 0 (0.0%) |
| 60 to 64 Years | 12 (23.5%) | 0 (0.0%) |
| 65 to 74 Years | 18 (22.5%) | 0 (0.0%) |
| 75 Years and over | 22 (21.6%) | 0 (0.0%) |
| Total | 279 (48.9%) | 3 (1.1%) |
Employment Status by Educational Attainment in Hardin
According to labor force statistics for Hardin, 63.4% of individuals (204) out of the total population between 25 and 64 years of age (322) are in the labor force, with 1.5% or 3 of them being unemployed. The group with the highest labor force participation rate are those with the educational attainment of bachelor's degree or higher, with 88.9% or 24 individuals in the labor force. Within the labor force, individuals with high school diploma education have the highest percentage of unemployment, with 2.8% or 3 of them being unemployed.
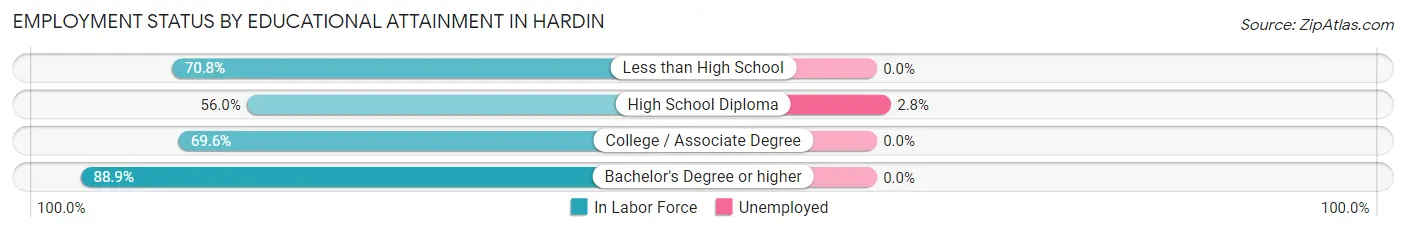
| Educational Attainment | In Labor Force | Unemployed |
| Less than High School | 34 (70.8%) | 0 (0.0%) |
| High School Diploma | 107 (56.0%) | 5 (2.8%) |
| College / Associate Degree | 39 (69.6%) | 0 (0.0%) |
| Bachelor's Degree or higher | 24 (88.9%) | 0 (0.0%) |
| Total | 204 (63.4%) | 5 (1.5%) |
Employment Occupations by Sex in Hardin
Management, Business, Science and Arts Occupations
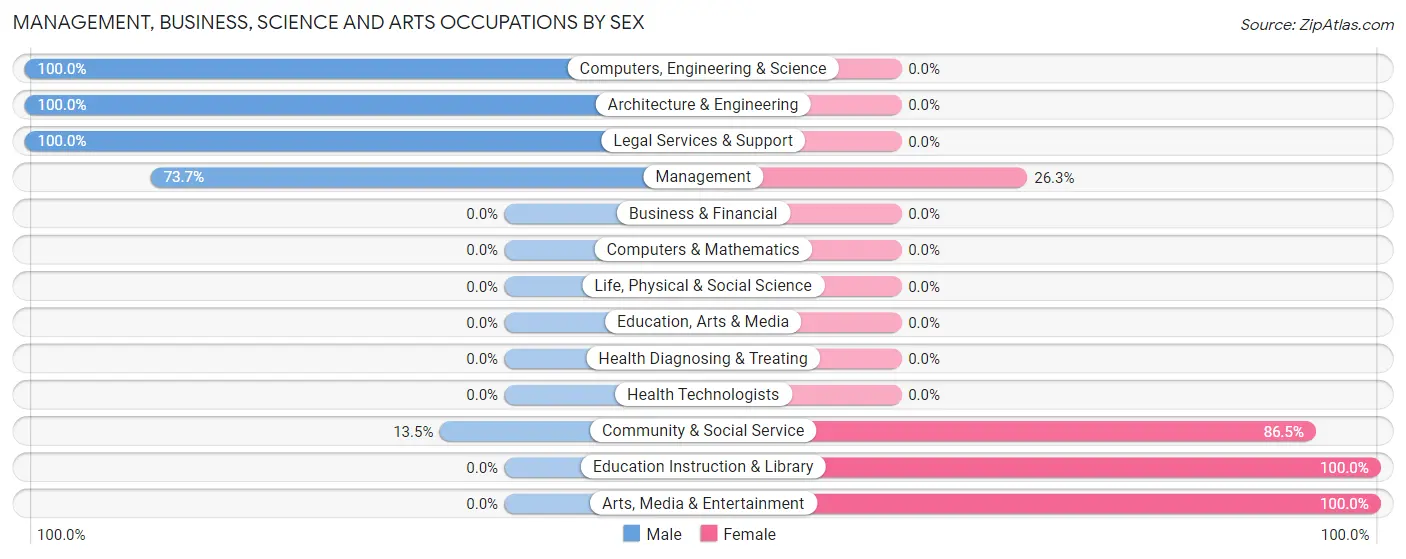
The most common Management, Business, Science and Arts occupations in Hardin are Management (38 | 13.8%), Community & Social Service (37 | 13.4%), Education Instruction & Library (28 | 10.1%), Legal Services & Support (5 | 1.8%), and Arts, Media & Entertainment (4 | 1.5%).
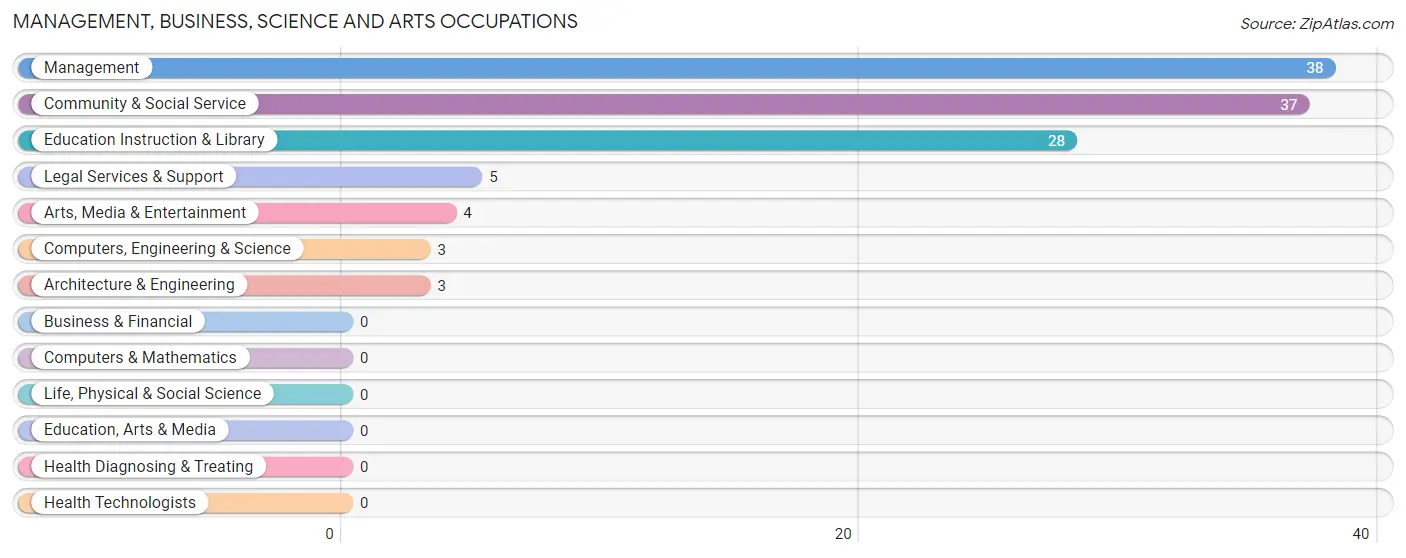
Management, Business, Science and Arts Occupations by Sex
Within the Management, Business, Science and Arts occupations in Hardin, the most male-oriented occupations are Computers, Engineering & Science (100.0%), Architecture & Engineering (100.0%), and Legal Services & Support (100.0%), while the most female-oriented occupations are Education Instruction & Library (100.0%), Arts, Media & Entertainment (100.0%), and Community & Social Service (86.5%).
| Occupation | Male | Female |
| Management | 28 (73.7%) | 10 (26.3%) |
| Business & Financial | 0 (0.0%) | 0 (0.0%) |
| Computers, Engineering & Science | 3 (100.0%) | 0 (0.0%) |
| Computers & Mathematics | 0 (0.0%) | 0 (0.0%) |
| Architecture & Engineering | 3 (100.0%) | 0 (0.0%) |
| Life, Physical & Social Science | 0 (0.0%) | 0 (0.0%) |
| Community & Social Service | 5 (13.5%) | 32 (86.5%) |
| Education, Arts & Media | 0 (0.0%) | 0 (0.0%) |
| Legal Services & Support | 5 (100.0%) | 0 (0.0%) |
| Education Instruction & Library | 0 (0.0%) | 28 (100.0%) |
| Arts, Media & Entertainment | 0 (0.0%) | 4 (100.0%) |
| Health Diagnosing & Treating | 0 (0.0%) | 0 (0.0%) |
| Health Technologists | 0 (0.0%) | 0 (0.0%) |
| Total (Category) | 36 (46.2%) | 42 (53.8%) |
| Total (Overall) | 149 (54.0%) | 127 (46.0%) |
Services Occupations
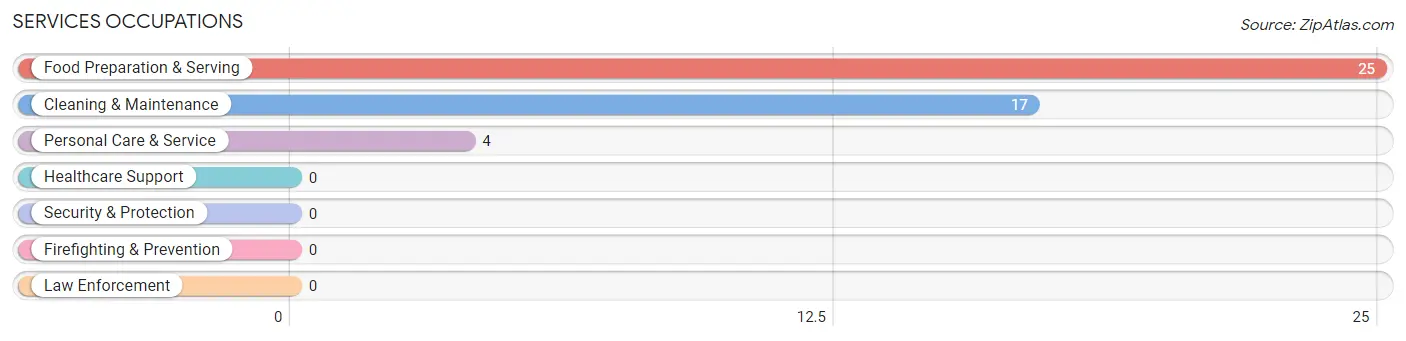
The most common Services occupations in Hardin are Food Preparation & Serving (25 | 9.1%), Cleaning & Maintenance (17 | 6.2%), and Personal Care & Service (4 | 1.5%).
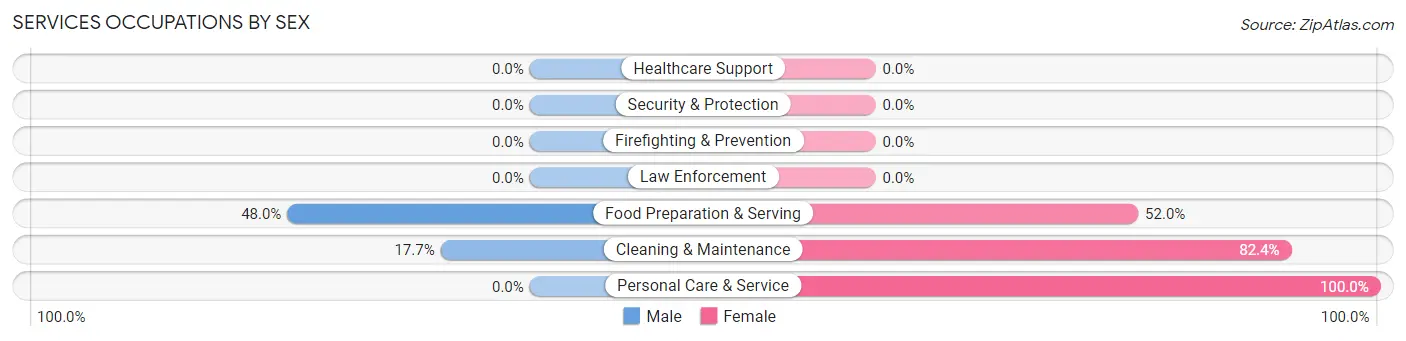
Services Occupations by Sex
Within the Services occupations in Hardin, the most male-oriented occupations are Food Preparation & Serving (48.0%), and Cleaning & Maintenance (17.6%), while the most female-oriented occupations are Personal Care & Service (100.0%), Cleaning & Maintenance (82.4%), and Food Preparation & Serving (52.0%).
| Occupation | Male | Female |
| Healthcare Support | 0 (0.0%) | 0 (0.0%) |
| Security & Protection | 0 (0.0%) | 0 (0.0%) |
| Firefighting & Prevention | 0 (0.0%) | 0 (0.0%) |
| Law Enforcement | 0 (0.0%) | 0 (0.0%) |
| Food Preparation & Serving | 12 (48.0%) | 13 (52.0%) |
| Cleaning & Maintenance | 3 (17.6%) | 14 (82.4%) |
| Personal Care & Service | 0 (0.0%) | 4 (100.0%) |
| Total (Category) | 15 (32.6%) | 31 (67.4%) |
| Total (Overall) | 149 (54.0%) | 127 (46.0%) |
Sales and Office Occupations
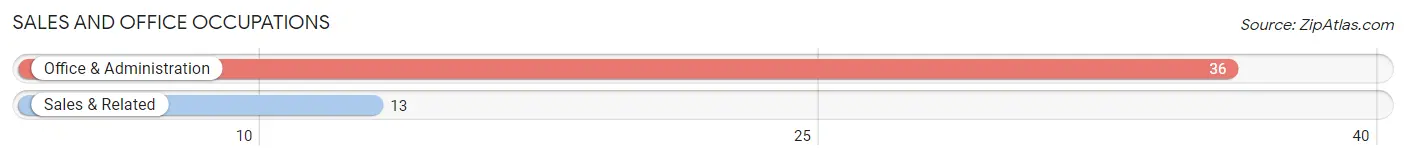
The most common Sales and Office occupations in Hardin are Office & Administration (36 | 13.0%), and Sales & Related (13 | 4.7%).
Sales and Office Occupations by Sex
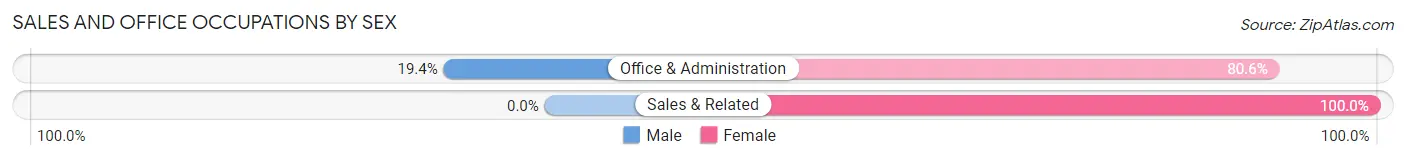
| Occupation | Male | Female |
| Sales & Related | 0 (0.0%) | 13 (100.0%) |
| Office & Administration | 7 (19.4%) | 29 (80.6%) |
| Total (Category) | 7 (14.3%) | 42 (85.7%) |
| Total (Overall) | 149 (54.0%) | 127 (46.0%) |
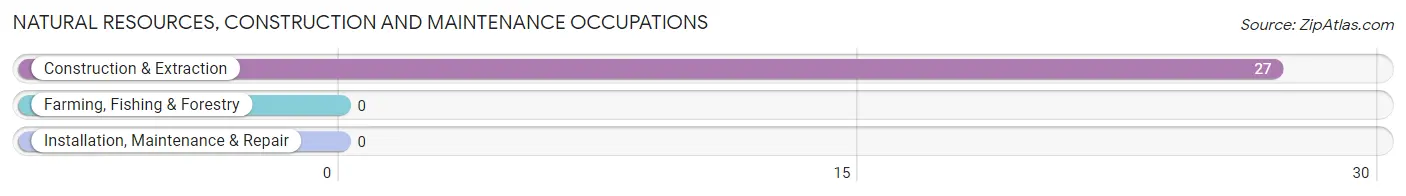
Natural Resources, Construction and Maintenance Occupations
The most common Natural Resources, Construction and Maintenance occupations in Hardin are , and Construction & Extraction (27 | 9.8%).
Natural Resources, Construction and Maintenance Occupations by Sex
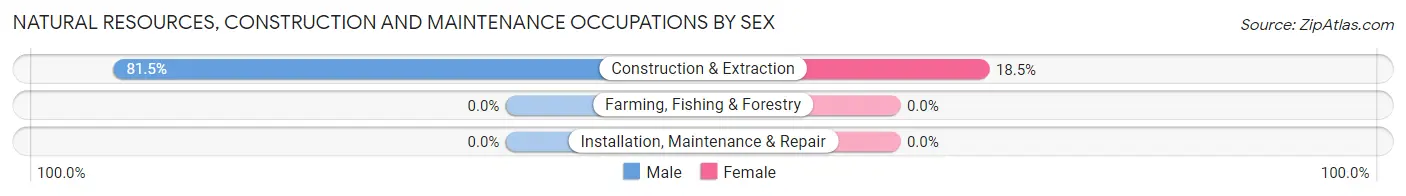
| Occupation | Male | Female |
| Farming, Fishing & Forestry | 0 (0.0%) | 0 (0.0%) |
| Construction & Extraction | 22 (81.5%) | 5 (18.5%) |
| Installation, Maintenance & Repair | 0 (0.0%) | 0 (0.0%) |
| Total (Category) | 22 (81.5%) | 5 (18.5%) |
| Total (Overall) | 149 (54.0%) | 127 (46.0%) |
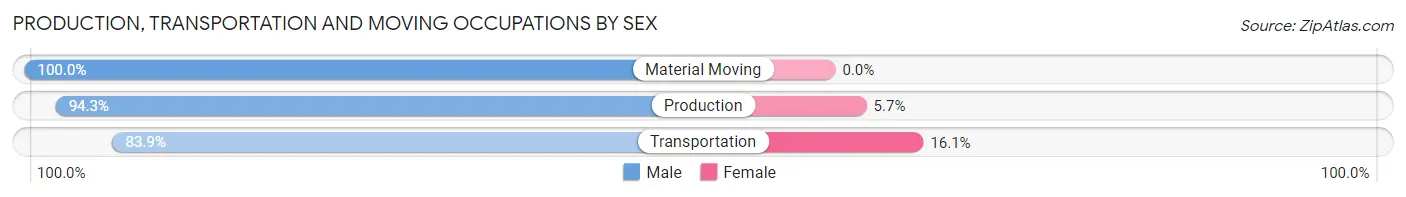
Production, Transportation and Moving Occupations
The most common Production, Transportation and Moving occupations in Hardin are Production (35 | 12.7%), Transportation (31 | 11.2%), and Material Moving (10 | 3.6%).
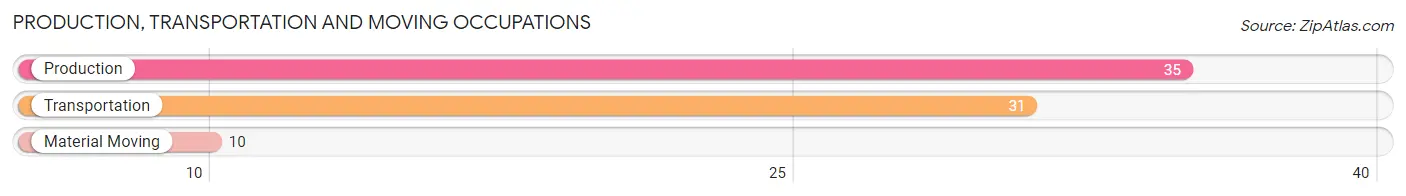
Production, Transportation and Moving Occupations by Sex
| Occupation | Male | Female |
| Production | 33 (94.3%) | 2 (5.7%) |
| Transportation | 26 (83.9%) | 5 (16.1%) |
| Material Moving | 10 (100.0%) | 0 (0.0%) |
| Total (Category) | 69 (90.8%) | 7 (9.2%) |
| Total (Overall) | 149 (54.0%) | 127 (46.0%) |
Employment Industries by Sex in Hardin
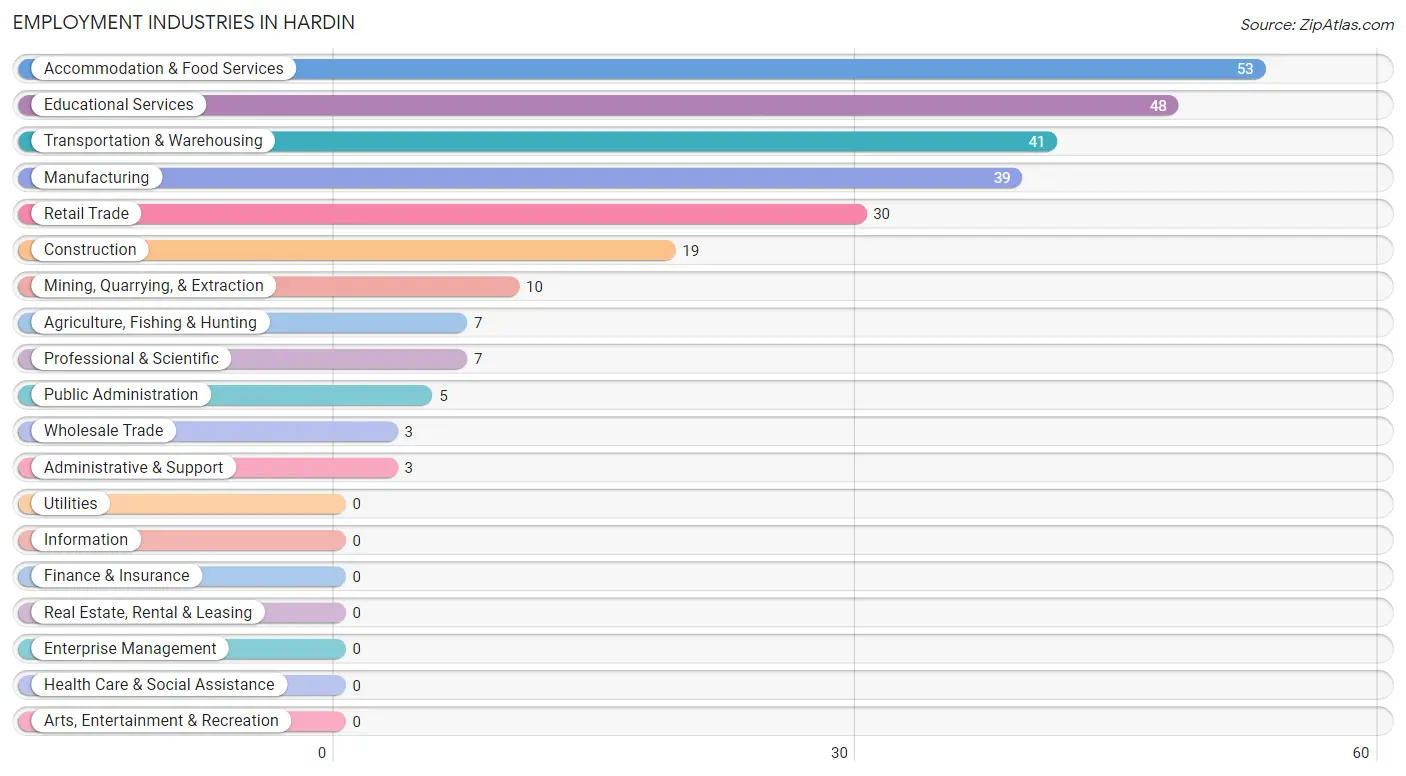
Employment Industries in Hardin
The major employment industries in Hardin include Accommodation & Food Services (53 | 19.2%), Educational Services (48 | 17.4%), Transportation & Warehousing (41 | 14.9%), Manufacturing (39 | 14.1%), and Retail Trade (30 | 10.9%).
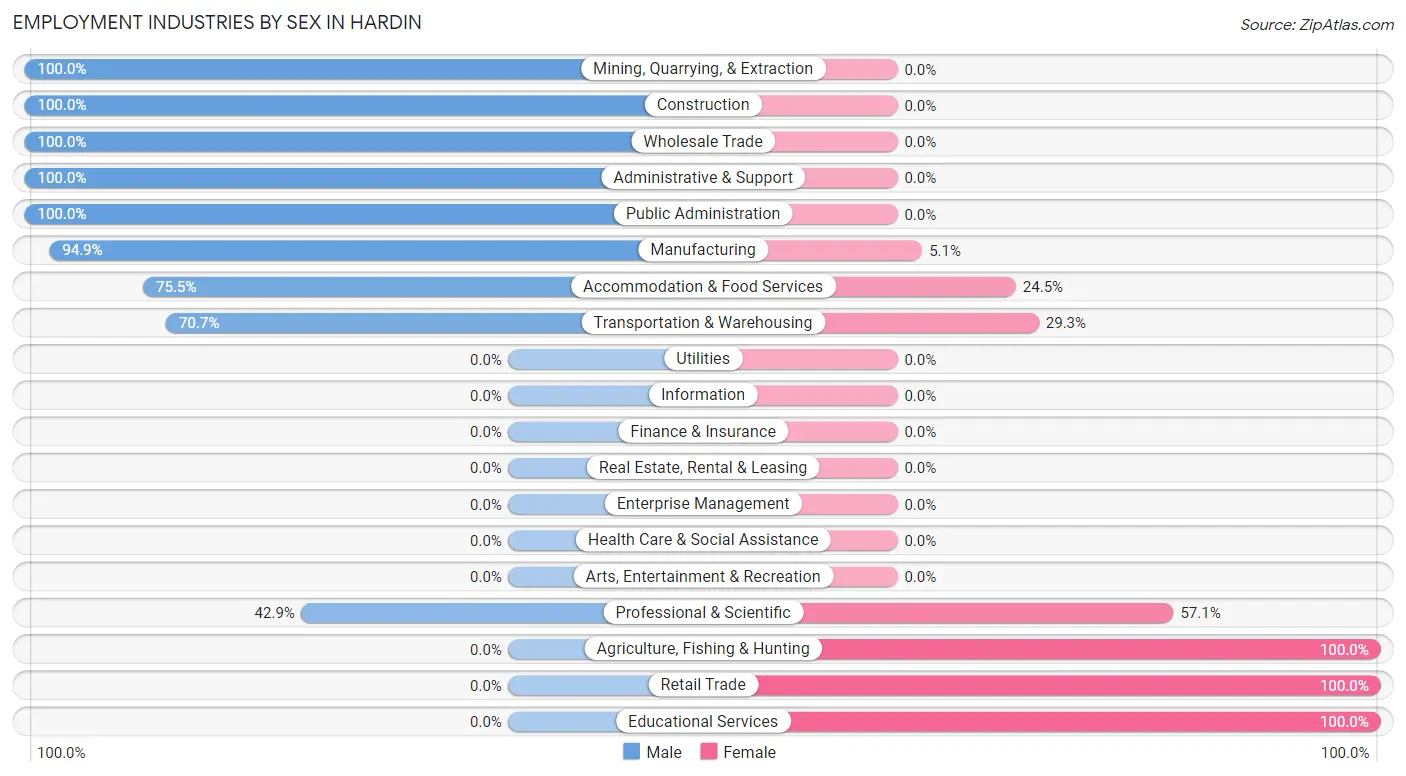
Employment Industries by Sex in Hardin
The Hardin industries that see more men than women are Mining, Quarrying, & Extraction (100.0%), Construction (100.0%), and Wholesale Trade (100.0%), whereas the industries that tend to have a higher number of women are Agriculture, Fishing & Hunting (100.0%), Retail Trade (100.0%), and Educational Services (100.0%).
| Industry | Male | Female |
| Agriculture, Fishing & Hunting | 0 (0.0%) | 7 (100.0%) |
| Mining, Quarrying, & Extraction | 10 (100.0%) | 0 (0.0%) |
| Construction | 19 (100.0%) | 0 (0.0%) |
| Manufacturing | 37 (94.9%) | 2 (5.1%) |
| Wholesale Trade | 3 (100.0%) | 0 (0.0%) |
| Retail Trade | 0 (0.0%) | 30 (100.0%) |
| Transportation & Warehousing | 29 (70.7%) | 12 (29.3%) |
| Utilities | 0 (0.0%) | 0 (0.0%) |
| Information | 0 (0.0%) | 0 (0.0%) |
| Finance & Insurance | 0 (0.0%) | 0 (0.0%) |
| Real Estate, Rental & Leasing | 0 (0.0%) | 0 (0.0%) |
| Professional & Scientific | 3 (42.9%) | 4 (57.1%) |
| Enterprise Management | 0 (0.0%) | 0 (0.0%) |
| Administrative & Support | 3 (100.0%) | 0 (0.0%) |
| Educational Services | 0 (0.0%) | 48 (100.0%) |
| Health Care & Social Assistance | 0 (0.0%) | 0 (0.0%) |
| Arts, Entertainment & Recreation | 0 (0.0%) | 0 (0.0%) |
| Accommodation & Food Services | 40 (75.5%) | 13 (24.5%) |
| Public Administration | 5 (100.0%) | 0 (0.0%) |
| Total | 149 (54.0%) | 127 (46.0%) |
Education in Hardin
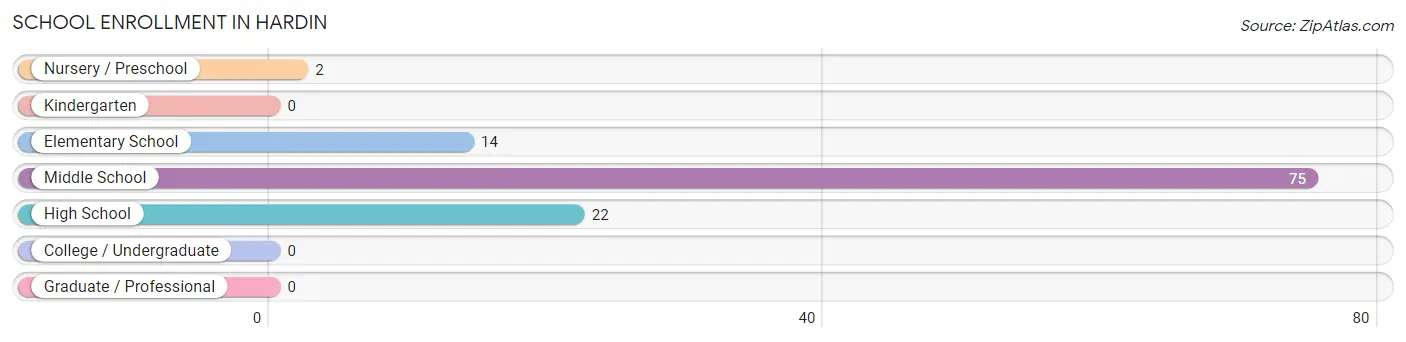
School Enrollment in Hardin
The most common levels of schooling among the 113 students in Hardin are middle school (75 | 66.4%), high school (22 | 19.5%), and elementary school (14 | 12.4%).
| School Level | # Students | % Students |
| Nursery / Preschool | 2 | 1.8% |
| Kindergarten | 0 | 0.0% |
| Elementary School | 14 | 12.4% |
| Middle School | 75 | 66.4% |
| High School | 22 | 19.5% |
| College / Undergraduate | 0 | 0.0% |
| Graduate / Professional | 0 | 0.0% |
| Total | 113 | 100.0% |
School Enrollment by Age by Funding Source in Hardin
Out of a total of 113 students who are enrolled in schools in Hardin, 4 (3.5%) attend a private institution, while the remaining 109 (96.5%) are enrolled in public schools. The age group of 15 to 17 year olds has the highest likelihood of being enrolled in private schools, with 4 (18.2% in the age bracket) enrolled. Conversely, the age group of 3 to 4 year olds has the lowest likelihood of being enrolled in a private school, with 2 (100.0% in the age bracket) attending a public institution.
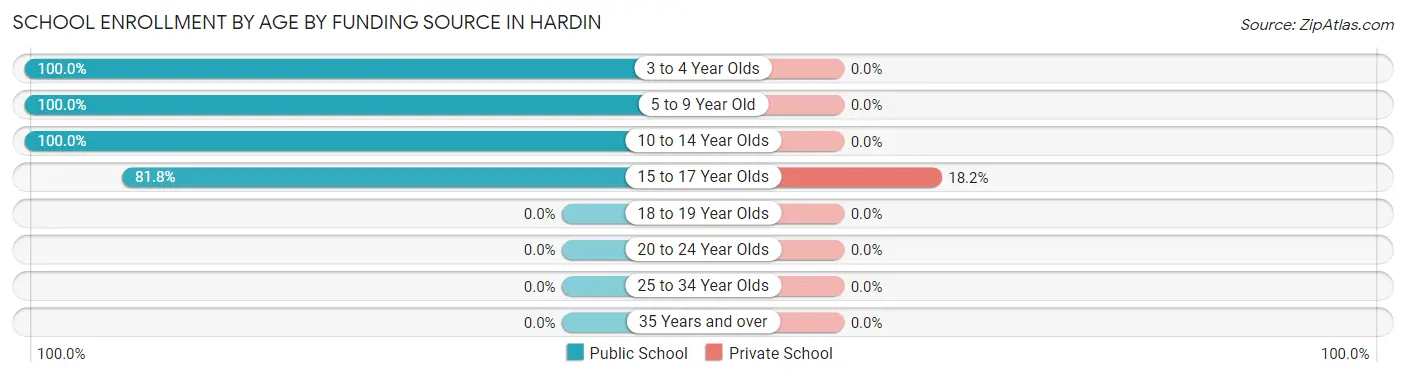
| Age Bracket | Public School | Private School |
| 3 to 4 Year Olds | 2 (100.0%) | 0 (0.0%) |
| 5 to 9 Year Old | 14 (100.0%) | 0 (0.0%) |
| 10 to 14 Year Olds | 75 (100.0%) | 0 (0.0%) |
| 15 to 17 Year Olds | 18 (81.8%) | 4 (18.2%) |
| 18 to 19 Year Olds | 0 (0.0%) | 0 (0.0%) |
| 20 to 24 Year Olds | 0 (0.0%) | 0 (0.0%) |
| 25 to 34 Year Olds | 0 (0.0%) | 0 (0.0%) |
| 35 Years and over | 0 (0.0%) | 0 (0.0%) |
| Total | 109 (96.5%) | 4 (3.5%) |
Educational Attainment by Field of Study in Hardin
Business (27 | 42.2%), education (17 | 26.6%), liberal arts & history (8 | 12.5%), social sciences (5 | 7.8%), and literature & languages (4 | 6.2%) are the most common fields of study among 64 individuals in Hardin who have obtained a bachelor's degree or higher.
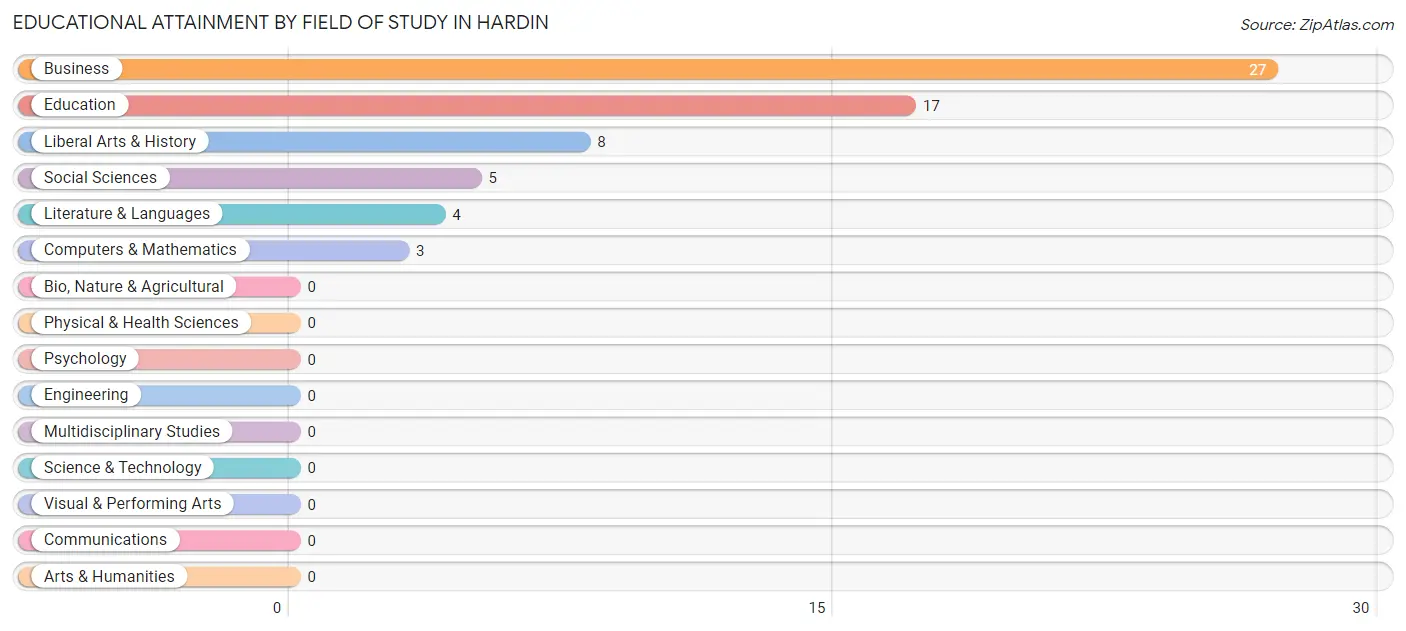
| Field of Study | # Graduates | % Graduates |
| Computers & Mathematics | 3 | 4.7% |
| Bio, Nature & Agricultural | 0 | 0.0% |
| Physical & Health Sciences | 0 | 0.0% |
| Psychology | 0 | 0.0% |
| Social Sciences | 5 | 7.8% |
| Engineering | 0 | 0.0% |
| Multidisciplinary Studies | 0 | 0.0% |
| Science & Technology | 0 | 0.0% |
| Business | 27 | 42.2% |
| Education | 17 | 26.6% |
| Literature & Languages | 4 | 6.2% |
| Liberal Arts & History | 8 | 12.5% |
| Visual & Performing Arts | 0 | 0.0% |
| Communications | 0 | 0.0% |
| Arts & Humanities | 0 | 0.0% |
| Total | 64 | 100.0% |
Transportation & Commute in Hardin
Vehicle Availability by Sex in Hardin
The most prevalent vehicle ownership categories in Hardin are males with 2 vehicles (70, accounting for 47.9%) and females with 2 vehicles (49, making up 63.6%).
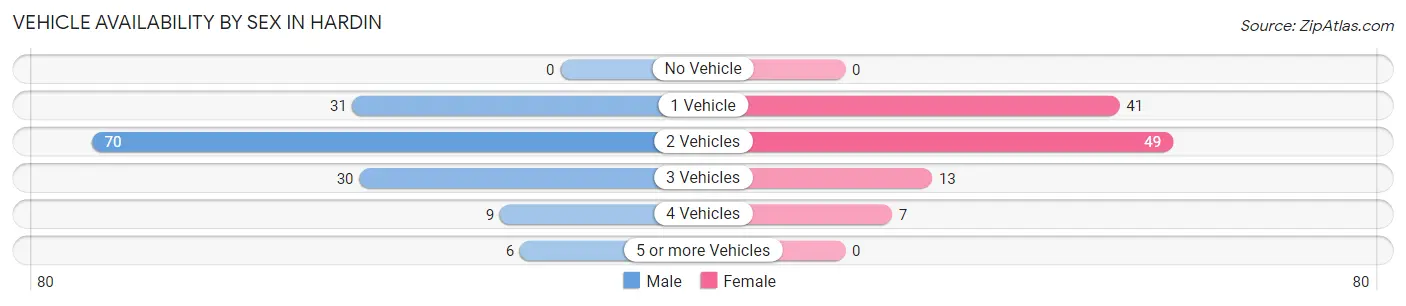
| Vehicles Available | Male | Female |
| No Vehicle | 0 (0.0%) | 0 (0.0%) |
| 1 Vehicle | 31 (21.2%) | 41 (37.3%) |
| 2 Vehicles | 70 (47.9%) | 49 (44.6%) |
| 3 Vehicles | 30 (20.5%) | 13 (11.8%) |
| 4 Vehicles | 9 (6.2%) | 7 (6.4%) |
| 5 or more Vehicles | 6 (4.1%) | 0 (0.0%) |
| Total | 146 (100.0%) | 110 (100.0%) |
Commute Time in Hardin
The most frequently occuring commute durations in Hardin are 60 to 89 minutes (65 commuters, 26.8%), 10 to 14 minutes (47 commuters, 19.3%), and 20 to 24 minutes (47 commuters, 19.3%).
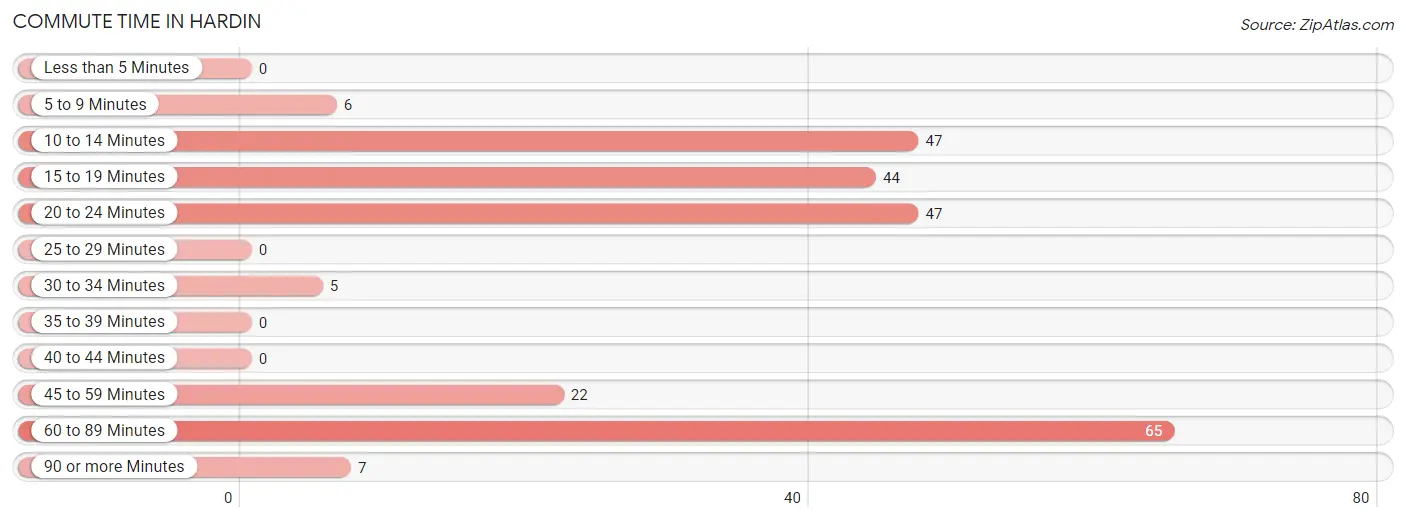
| Commute Time | # Commuters | % Commuters |
| Less than 5 Minutes | 0 | 0.0% |
| 5 to 9 Minutes | 6 | 2.5% |
| 10 to 14 Minutes | 47 | 19.3% |
| 15 to 19 Minutes | 44 | 18.1% |
| 20 to 24 Minutes | 47 | 19.3% |
| 25 to 29 Minutes | 0 | 0.0% |
| 30 to 34 Minutes | 5 | 2.1% |
| 35 to 39 Minutes | 0 | 0.0% |
| 40 to 44 Minutes | 0 | 0.0% |
| 45 to 59 Minutes | 22 | 9.0% |
| 60 to 89 Minutes | 65 | 26.8% |
| 90 or more Minutes | 7 | 2.9% |
Commute Time by Sex in Hardin
The most common commute times in Hardin are 60 to 89 minutes (55 commuters, 37.7%) for males and 10 to 14 minutes (42 commuters, 43.3%) for females.
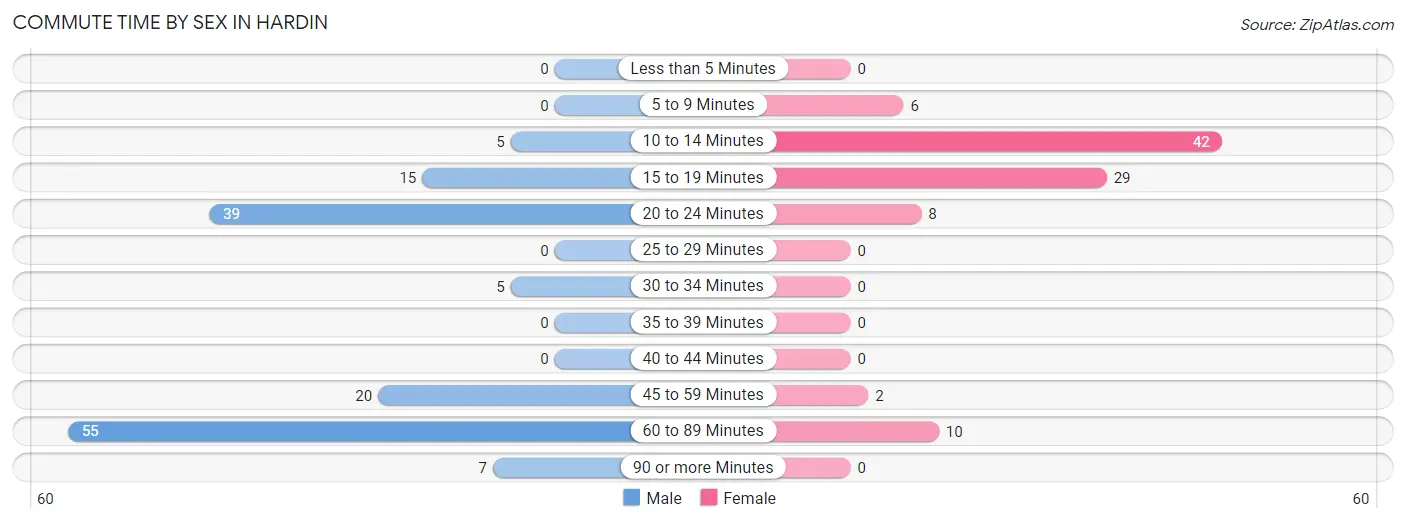
| Commute Time | Male | Female |
| Less than 5 Minutes | 0 (0.0%) | 0 (0.0%) |
| 5 to 9 Minutes | 0 (0.0%) | 6 (6.2%) |
| 10 to 14 Minutes | 5 (3.4%) | 42 (43.3%) |
| 15 to 19 Minutes | 15 (10.3%) | 29 (29.9%) |
| 20 to 24 Minutes | 39 (26.7%) | 8 (8.3%) |
| 25 to 29 Minutes | 0 (0.0%) | 0 (0.0%) |
| 30 to 34 Minutes | 5 (3.4%) | 0 (0.0%) |
| 35 to 39 Minutes | 0 (0.0%) | 0 (0.0%) |
| 40 to 44 Minutes | 0 (0.0%) | 0 (0.0%) |
| 45 to 59 Minutes | 20 (13.7%) | 2 (2.1%) |
| 60 to 89 Minutes | 55 (37.7%) | 10 (10.3%) |
| 90 or more Minutes | 7 (4.8%) | 0 (0.0%) |
Time of Departure to Work by Sex in Hardin
The most frequent times of departure to work in Hardin are 12:00 AM to 4:59 AM (44, 30.1%) for males and 6:30 AM to 6:59 AM (24, 24.7%) for females.
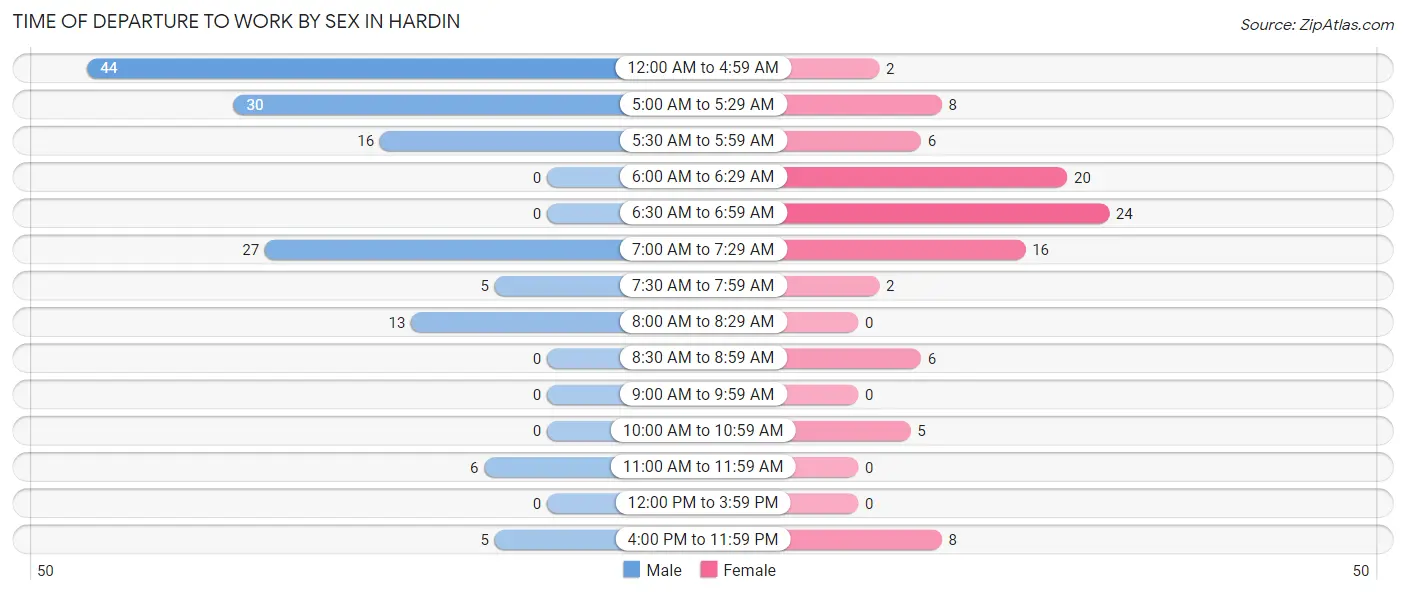
| Time of Departure | Male | Female |
| 12:00 AM to 4:59 AM | 44 (30.1%) | 2 (2.1%) |
| 5:00 AM to 5:29 AM | 30 (20.5%) | 8 (8.3%) |
| 5:30 AM to 5:59 AM | 16 (11.0%) | 6 (6.2%) |
| 6:00 AM to 6:29 AM | 0 (0.0%) | 20 (20.6%) |
| 6:30 AM to 6:59 AM | 0 (0.0%) | 24 (24.7%) |
| 7:00 AM to 7:29 AM | 27 (18.5%) | 16 (16.5%) |
| 7:30 AM to 7:59 AM | 5 (3.4%) | 2 (2.1%) |
| 8:00 AM to 8:29 AM | 13 (8.9%) | 0 (0.0%) |
| 8:30 AM to 8:59 AM | 0 (0.0%) | 6 (6.2%) |
| 9:00 AM to 9:59 AM | 0 (0.0%) | 0 (0.0%) |
| 10:00 AM to 10:59 AM | 0 (0.0%) | 5 (5.1%) |
| 11:00 AM to 11:59 AM | 6 (4.1%) | 0 (0.0%) |
| 12:00 PM to 3:59 PM | 0 (0.0%) | 0 (0.0%) |
| 4:00 PM to 11:59 PM | 5 (3.4%) | 8 (8.3%) |
| Total | 146 (100.0%) | 97 (100.0%) |
Housing Occupancy in Hardin
Occupancy by Ownership in Hardin
Of the total 315 dwellings in Hardin, owner-occupied units account for 240 (76.2%), while renter-occupied units make up 75 (23.8%).
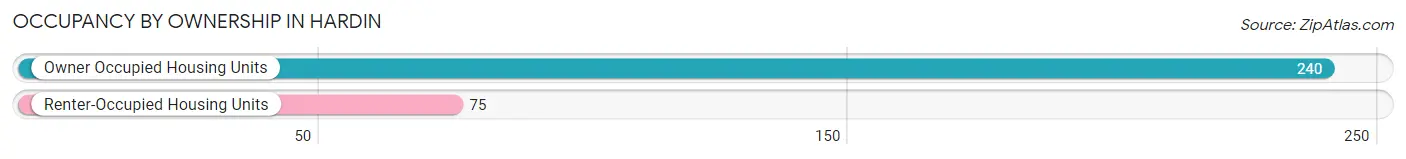
| Occupancy | # Housing Units | % Housing Units |
| Owner Occupied Housing Units | 240 | 76.2% |
| Renter-Occupied Housing Units | 75 | 23.8% |
| Total Occupied Housing Units | 315 | 100.0% |
Occupancy by Household Size in Hardin
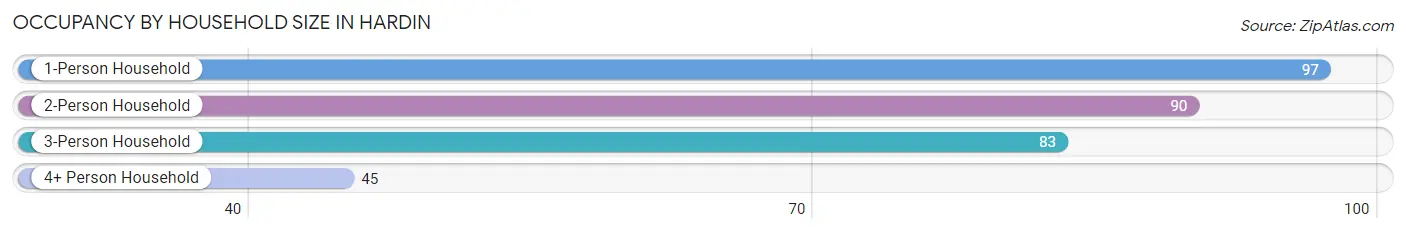
| Household Size | # Housing Units | % Housing Units |
| 1-Person Household | 97 | 30.8% |
| 2-Person Household | 90 | 28.6% |
| 3-Person Household | 83 | 26.4% |
| 4+ Person Household | 45 | 14.3% |
| Total Housing Units | 315 | 100.0% |
Occupancy by Ownership by Household Size in Hardin
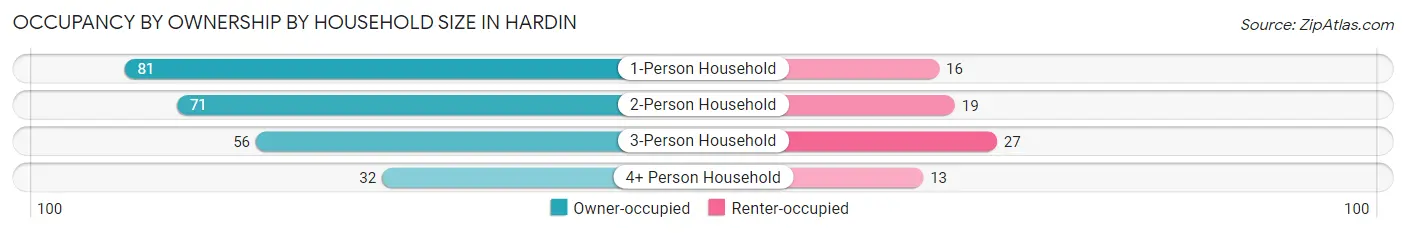
| Household Size | Owner-occupied | Renter-occupied |
| 1-Person Household | 81 (83.5%) | 16 (16.5%) |
| 2-Person Household | 71 (78.9%) | 19 (21.1%) |
| 3-Person Household | 56 (67.5%) | 27 (32.5%) |
| 4+ Person Household | 32 (71.1%) | 13 (28.9%) |
| Total Housing Units | 240 (76.2%) | 75 (23.8%) |
Occupancy by Educational Attainment in Hardin
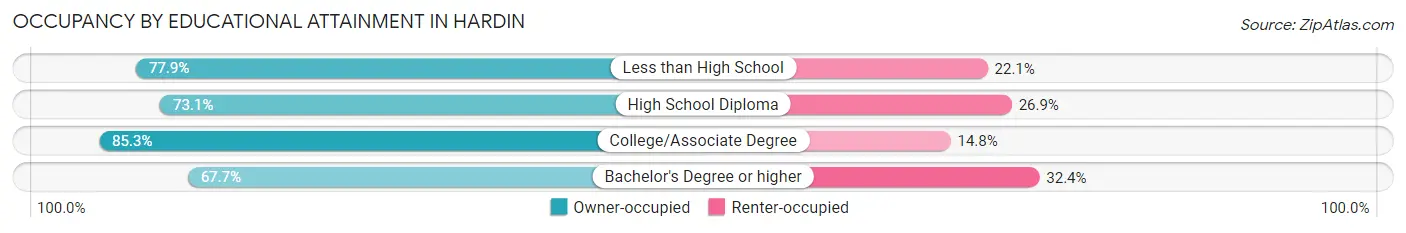
| Household Size | Owner-occupied | Renter-occupied |
| Less than High School | 67 (77.9%) | 19 (22.1%) |
| High School Diploma | 98 (73.1%) | 36 (26.9%) |
| College/Associate Degree | 52 (85.3%) | 9 (14.7%) |
| Bachelor's Degree or higher | 23 (67.6%) | 11 (32.4%) |
Occupancy by Age of Householder in Hardin
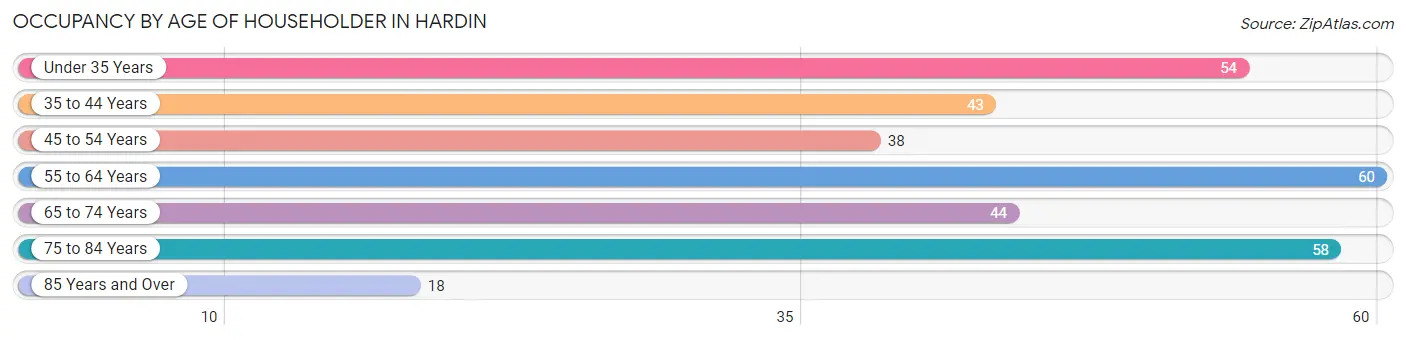
| Age Bracket | # Households | % Households |
| Under 35 Years | 54 | 17.1% |
| 35 to 44 Years | 43 | 13.7% |
| 45 to 54 Years | 38 | 12.1% |
| 55 to 64 Years | 60 | 19.1% |
| 65 to 74 Years | 44 | 14.0% |
| 75 to 84 Years | 58 | 18.4% |
| 85 Years and Over | 18 | 5.7% |
| Total | 315 | 100.0% |
Housing Finances in Hardin
Median Income by Occupancy in Hardin
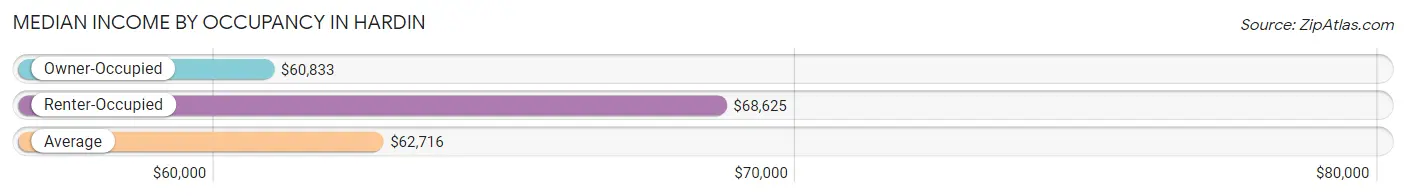
| Occupancy Type | # Households | Median Income |
| Owner-Occupied | 240 (76.2%) | $60,833 |
| Renter-Occupied | 75 (23.8%) | $68,625 |
| Average | 315 (100.0%) | $62,716 |
Occupancy by Householder Income Bracket in Hardin
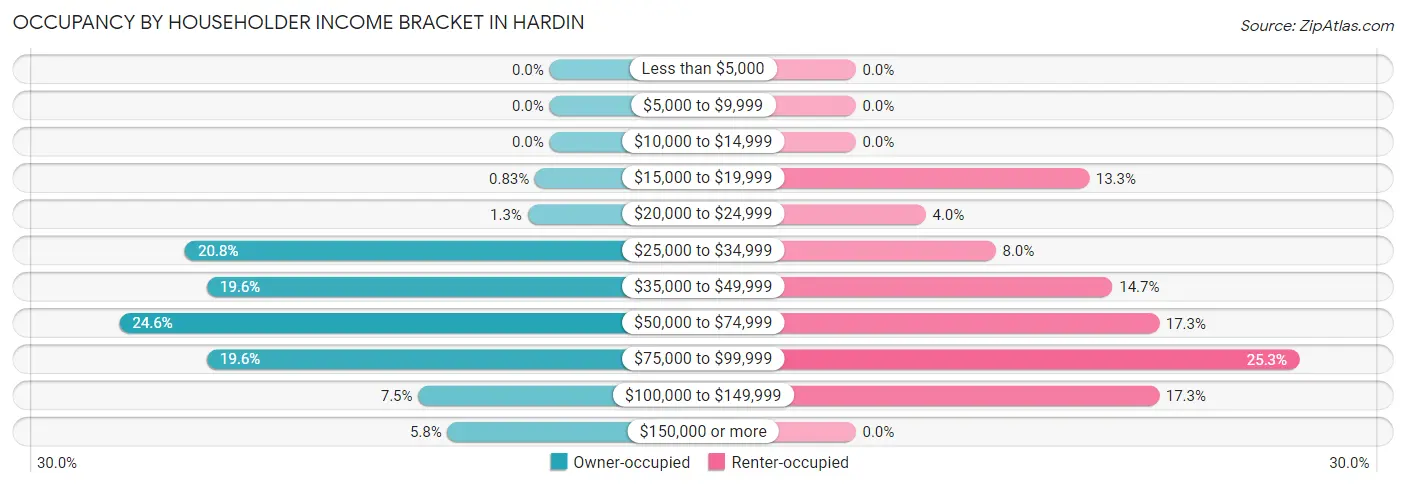
| Income Bracket | Owner-occupied | Renter-occupied |
| Less than $5,000 | 0 (0.0%) | 0 (0.0%) |
| $5,000 to $9,999 | 0 (0.0%) | 0 (0.0%) |
| $10,000 to $14,999 | 0 (0.0%) | 0 (0.0%) |
| $15,000 to $19,999 | 2 (0.8%) | 10 (13.3%) |
| $20,000 to $24,999 | 3 (1.3%) | 3 (4.0%) |
| $25,000 to $34,999 | 50 (20.8%) | 6 (8.0%) |
| $35,000 to $49,999 | 47 (19.6%) | 11 (14.7%) |
| $50,000 to $74,999 | 59 (24.6%) | 13 (17.3%) |
| $75,000 to $99,999 | 47 (19.6%) | 19 (25.3%) |
| $100,000 to $149,999 | 18 (7.5%) | 13 (17.3%) |
| $150,000 or more | 14 (5.8%) | 0 (0.0%) |
| Total | 240 (100.0%) | 75 (100.0%) |
Monthly Housing Cost Tiers in Hardin
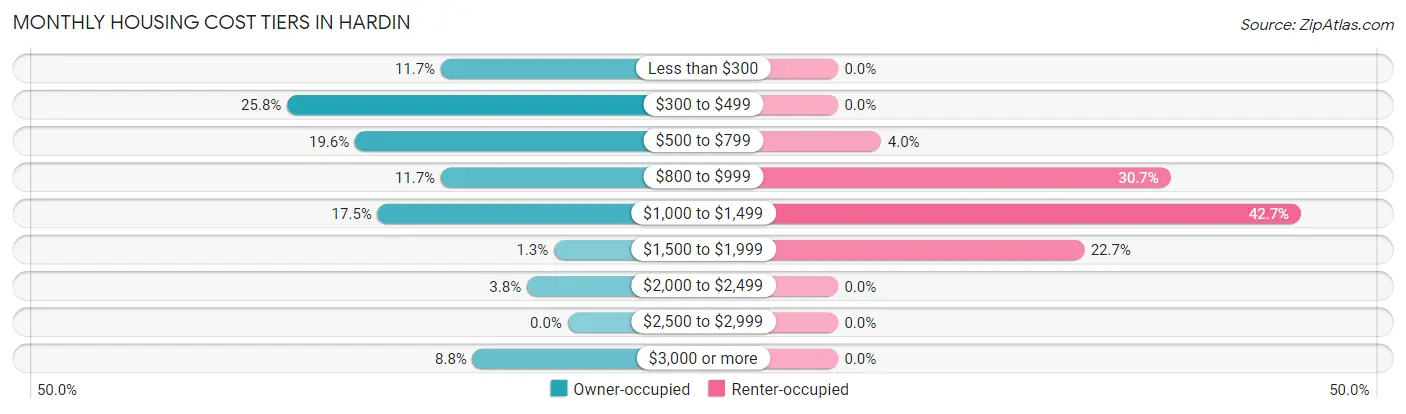
| Monthly Cost | Owner-occupied | Renter-occupied |
| Less than $300 | 28 (11.7%) | 0 (0.0%) |
| $300 to $499 | 62 (25.8%) | 0 (0.0%) |
| $500 to $799 | 47 (19.6%) | 3 (4.0%) |
| $800 to $999 | 28 (11.7%) | 23 (30.7%) |
| $1,000 to $1,499 | 42 (17.5%) | 32 (42.7%) |
| $1,500 to $1,999 | 3 (1.3%) | 17 (22.7%) |
| $2,000 to $2,499 | 9 (3.7%) | 0 (0.0%) |
| $2,500 to $2,999 | 0 (0.0%) | 0 (0.0%) |
| $3,000 or more | 21 (8.7%) | 0 (0.0%) |
| Total | 240 (100.0%) | 75 (100.0%) |
Physical Housing Characteristics in Hardin
Housing Structures in Hardin
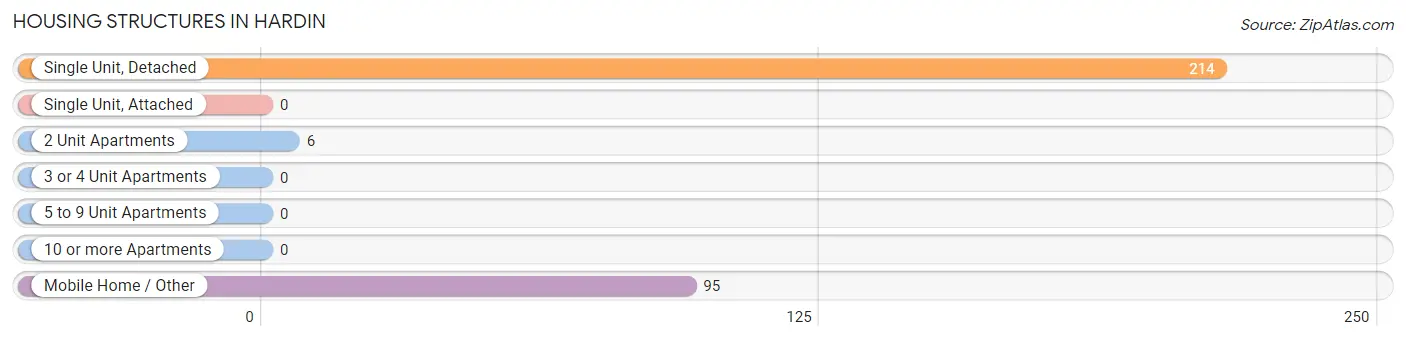
| Structure Type | # Housing Units | % Housing Units |
| Single Unit, Detached | 214 | 67.9% |
| Single Unit, Attached | 0 | 0.0% |
| 2 Unit Apartments | 6 | 1.9% |
| 3 or 4 Unit Apartments | 0 | 0.0% |
| 5 to 9 Unit Apartments | 0 | 0.0% |
| 10 or more Apartments | 0 | 0.0% |
| Mobile Home / Other | 95 | 30.2% |
| Total | 315 | 100.0% |
Housing Structures by Occupancy in Hardin
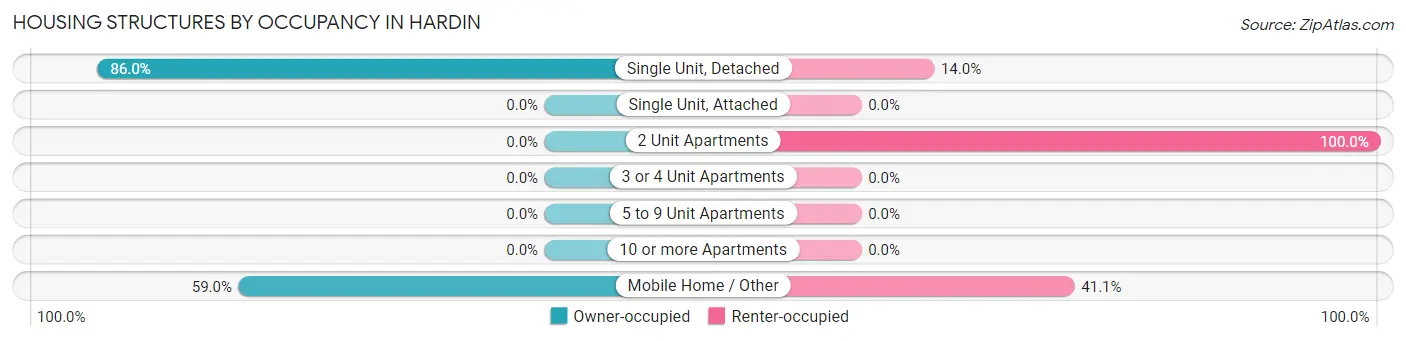
| Structure Type | Owner-occupied | Renter-occupied |
| Single Unit, Detached | 184 (86.0%) | 30 (14.0%) |
| Single Unit, Attached | 0 (0.0%) | 0 (0.0%) |
| 2 Unit Apartments | 0 (0.0%) | 6 (100.0%) |
| 3 or 4 Unit Apartments | 0 (0.0%) | 0 (0.0%) |
| 5 to 9 Unit Apartments | 0 (0.0%) | 0 (0.0%) |
| 10 or more Apartments | 0 (0.0%) | 0 (0.0%) |
| Mobile Home / Other | 56 (59.0%) | 39 (41.0%) |
| Total | 240 (76.2%) | 75 (23.8%) |
Housing Structures by Number of Rooms in Hardin
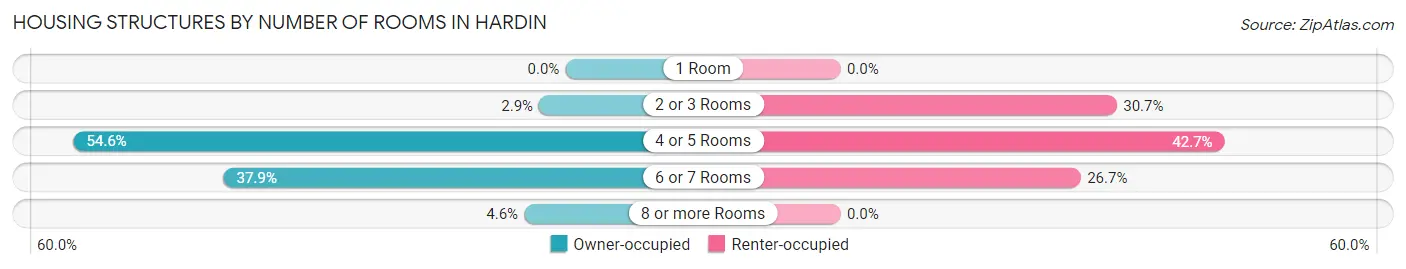
| Number of Rooms | Owner-occupied | Renter-occupied |
| 1 Room | 0 (0.0%) | 0 (0.0%) |
| 2 or 3 Rooms | 7 (2.9%) | 23 (30.7%) |
| 4 or 5 Rooms | 131 (54.6%) | 32 (42.7%) |
| 6 or 7 Rooms | 91 (37.9%) | 20 (26.7%) |
| 8 or more Rooms | 11 (4.6%) | 0 (0.0%) |
| Total | 240 (100.0%) | 75 (100.0%) |
Housing Structure by Heating Type in Hardin
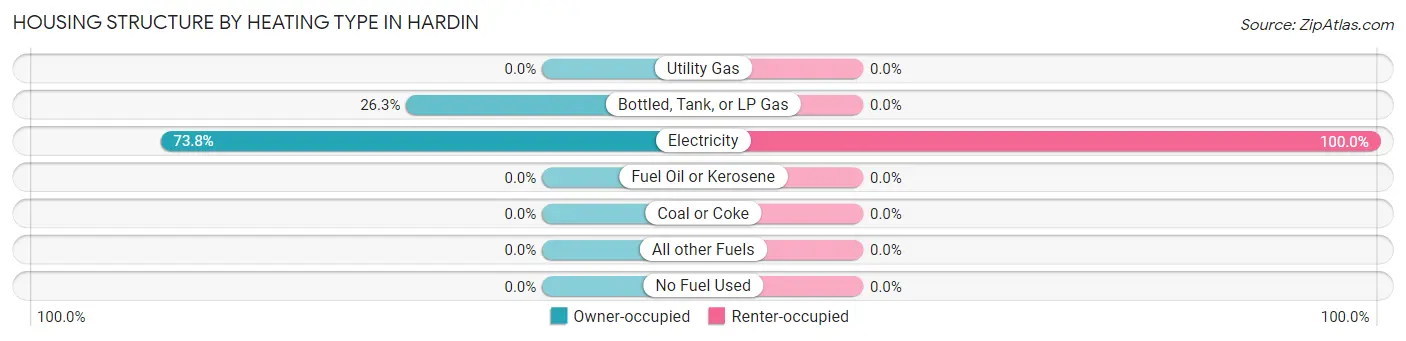
| Heating Type | Owner-occupied | Renter-occupied |
| Utility Gas | 0 (0.0%) | 0 (0.0%) |
| Bottled, Tank, or LP Gas | 63 (26.3%) | 0 (0.0%) |
| Electricity | 177 (73.8%) | 75 (100.0%) |
| Fuel Oil or Kerosene | 0 (0.0%) | 0 (0.0%) |
| Coal or Coke | 0 (0.0%) | 0 (0.0%) |
| All other Fuels | 0 (0.0%) | 0 (0.0%) |
| No Fuel Used | 0 (0.0%) | 0 (0.0%) |
| Total | 240 (100.0%) | 75 (100.0%) |
Household Vehicle Usage in Hardin
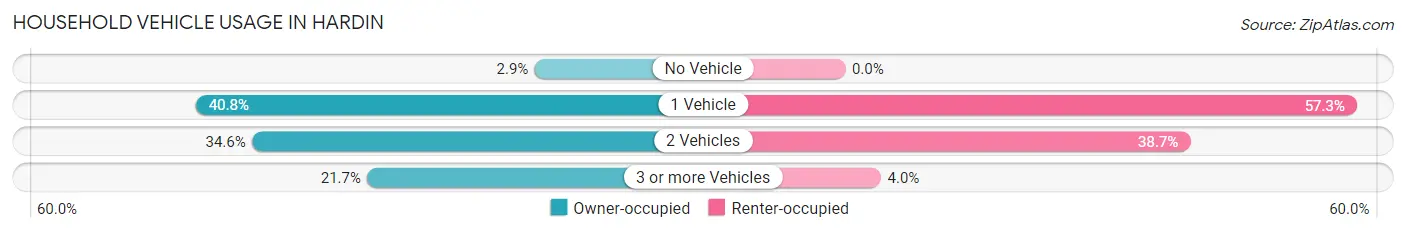
| Vehicles per Household | Owner-occupied | Renter-occupied |
| No Vehicle | 7 (2.9%) | 0 (0.0%) |
| 1 Vehicle | 98 (40.8%) | 43 (57.3%) |
| 2 Vehicles | 83 (34.6%) | 29 (38.7%) |
| 3 or more Vehicles | 52 (21.7%) | 3 (4.0%) |
| Total | 240 (100.0%) | 75 (100.0%) |
Real Estate & Mortgages in Hardin
Real Estate and Mortgage Overview in Hardin
| Characteristic | Without Mortgage | With Mortgage |
| Housing Units | 143 | 97 |
| Median Property Value | $113,400 | $153,400 |
| Median Household Income | $61,250 | $1 |
| Monthly Housing Costs | $466 | $21 |
| Real Estate Taxes | $1,200 | $9 |
Property Value by Mortgage Status in Hardin
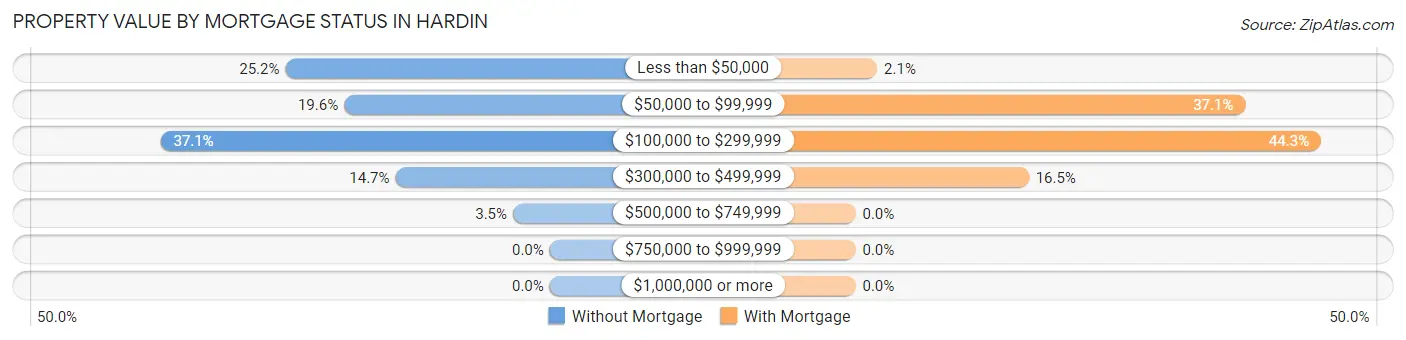
| Property Value | Without Mortgage | With Mortgage |
| Less than $50,000 | 36 (25.2%) | 2 (2.1%) |
| $50,000 to $99,999 | 28 (19.6%) | 36 (37.1%) |
| $100,000 to $299,999 | 53 (37.1%) | 43 (44.3%) |
| $300,000 to $499,999 | 21 (14.7%) | 16 (16.5%) |
| $500,000 to $749,999 | 5 (3.5%) | 0 (0.0%) |
| $750,000 to $999,999 | 0 (0.0%) | 0 (0.0%) |
| $1,000,000 or more | 0 (0.0%) | 0 (0.0%) |
| Total | 143 (100.0%) | 97 (100.0%) |
Household Income by Mortgage Status in Hardin
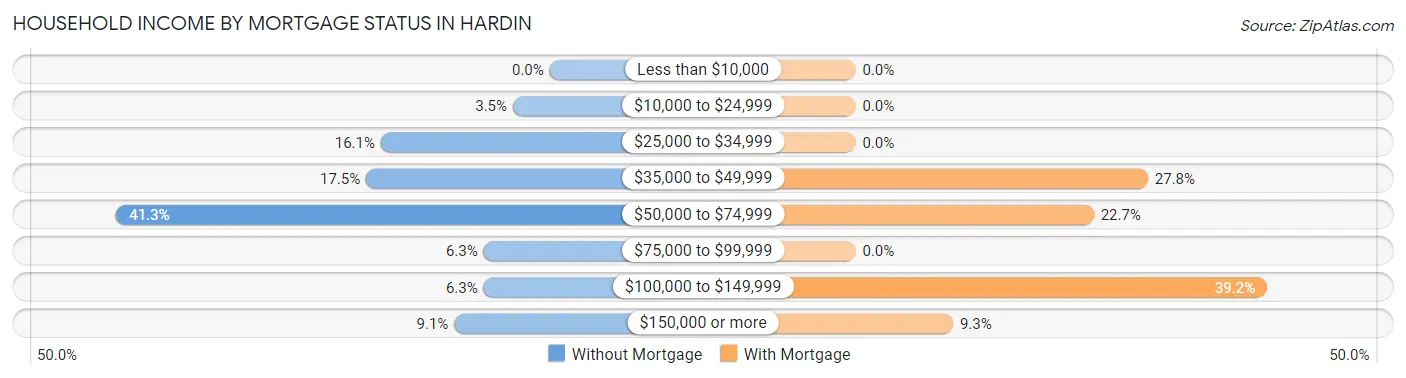
| Household Income | Without Mortgage | With Mortgage |
| Less than $10,000 | 0 (0.0%) | 0 (0.0%) |
| $10,000 to $24,999 | 5 (3.5%) | 0 (0.0%) |
| $25,000 to $34,999 | 23 (16.1%) | 0 (0.0%) |
| $35,000 to $49,999 | 25 (17.5%) | 27 (27.8%) |
| $50,000 to $74,999 | 59 (41.3%) | 22 (22.7%) |
| $75,000 to $99,999 | 9 (6.3%) | 0 (0.0%) |
| $100,000 to $149,999 | 9 (6.3%) | 38 (39.2%) |
| $150,000 or more | 13 (9.1%) | 9 (9.3%) |
| Total | 143 (100.0%) | 97 (100.0%) |
Property Value to Household Income Ratio in Hardin
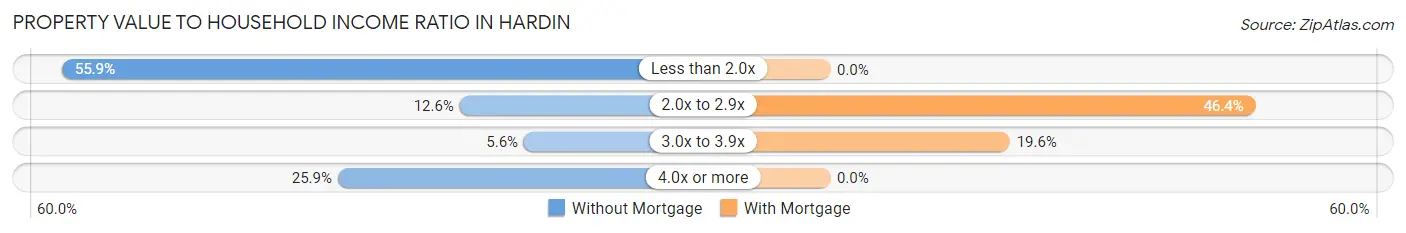
| Value-to-Income Ratio | Without Mortgage | With Mortgage |
| Less than 2.0x | 80 (55.9%) | 0 (0.0%) |
| 2.0x to 2.9x | 18 (12.6%) | 45 (46.4%) |
| 3.0x to 3.9x | 8 (5.6%) | 19 (19.6%) |
| 4.0x or more | 37 (25.9%) | 0 (0.0%) |
| Total | 143 (100.0%) | 97 (100.0%) |
Real Estate Taxes by Mortgage Status in Hardin
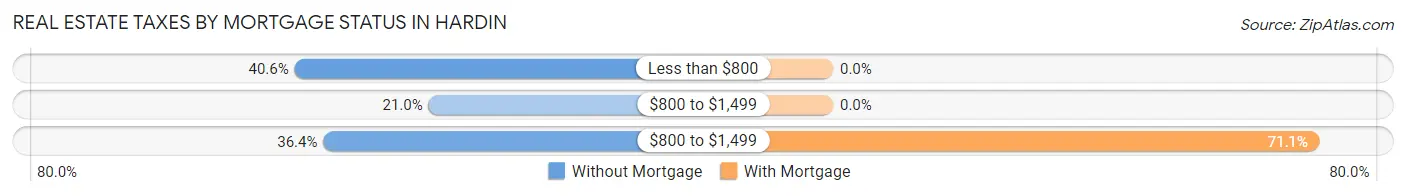
| Property Taxes | Without Mortgage | With Mortgage |
| Less than $800 | 58 (40.6%) | 0 (0.0%) |
| $800 to $1,499 | 30 (21.0%) | 0 (0.0%) |
| $800 to $1,499 | 52 (36.4%) | 69 (71.1%) |
| Total | 143 (100.0%) | 97 (100.0%) |
Health & Disability in Hardin
Health Insurance Coverage by Age in Hardin
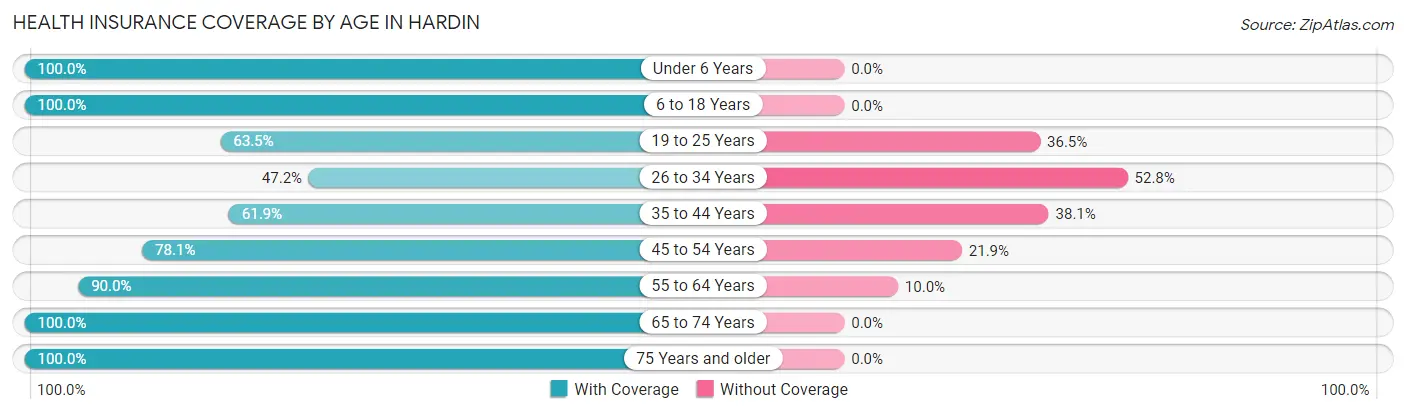
| Age Bracket | With Coverage | Without Coverage |
| Under 6 Years | 43 (100.0%) | 0 (0.0%) |
| 6 to 18 Years | 111 (100.0%) | 0 (0.0%) |
| 19 to 25 Years | 40 (63.5%) | 23 (36.5%) |
| 26 to 34 Years | 50 (47.2%) | 56 (52.8%) |
| 35 to 44 Years | 39 (61.9%) | 24 (38.1%) |
| 45 to 54 Years | 57 (78.1%) | 16 (21.9%) |
| 55 to 64 Years | 72 (90.0%) | 8 (10.0%) |
| 65 to 74 Years | 80 (100.0%) | 0 (0.0%) |
| 75 Years and older | 102 (100.0%) | 0 (0.0%) |
| Total | 594 (82.4%) | 127 (17.6%) |
Health Insurance Coverage by Citizenship Status in Hardin
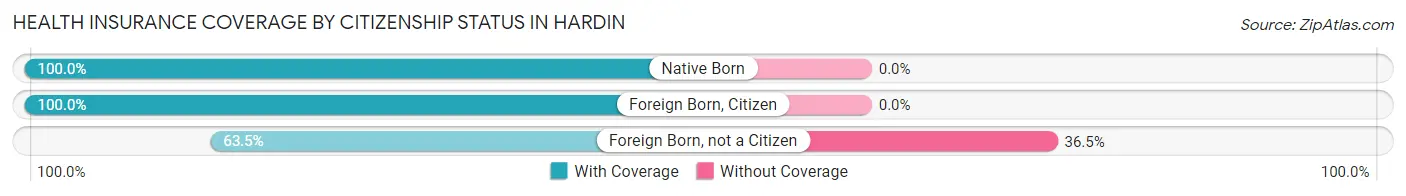
| Citizenship Status | With Coverage | Without Coverage |
| Native Born | 43 (100.0%) | 0 (0.0%) |
| Foreign Born, Citizen | 111 (100.0%) | 0 (0.0%) |
| Foreign Born, not a Citizen | 40 (63.5%) | 23 (36.5%) |
Health Insurance Coverage by Household Income in Hardin
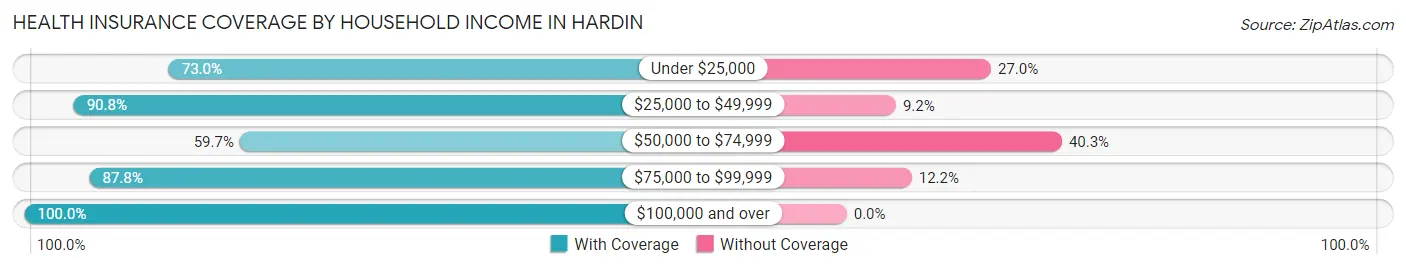
| Household Income | With Coverage | Without Coverage |
| Under $25,000 | 27 (73.0%) | 10 (27.0%) |
| $25,000 to $49,999 | 207 (90.8%) | 21 (9.2%) |
| $50,000 to $74,999 | 114 (59.7%) | 77 (40.3%) |
| $75,000 to $99,999 | 137 (87.8%) | 19 (12.2%) |
| $100,000 and over | 109 (100.0%) | 0 (0.0%) |
Public vs Private Health Insurance Coverage by Age in Hardin
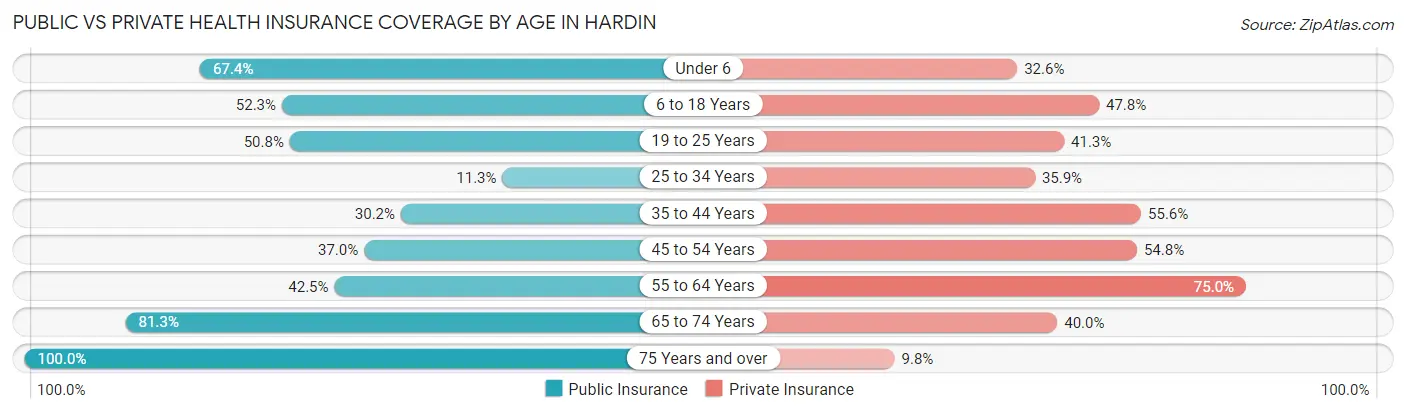
| Age Bracket | Public Insurance | Private Insurance |
| Under 6 | 29 (67.4%) | 14 (32.6%) |
| 6 to 18 Years | 58 (52.2%) | 53 (47.7%) |
| 19 to 25 Years | 32 (50.8%) | 26 (41.3%) |
| 25 to 34 Years | 12 (11.3%) | 38 (35.8%) |
| 35 to 44 Years | 19 (30.2%) | 35 (55.6%) |
| 45 to 54 Years | 27 (37.0%) | 40 (54.8%) |
| 55 to 64 Years | 34 (42.5%) | 60 (75.0%) |
| 65 to 74 Years | 65 (81.2%) | 32 (40.0%) |
| 75 Years and over | 102 (100.0%) | 10 (9.8%) |
| Total | 378 (52.4%) | 308 (42.7%) |
Disability Status by Sex by Age in Hardin
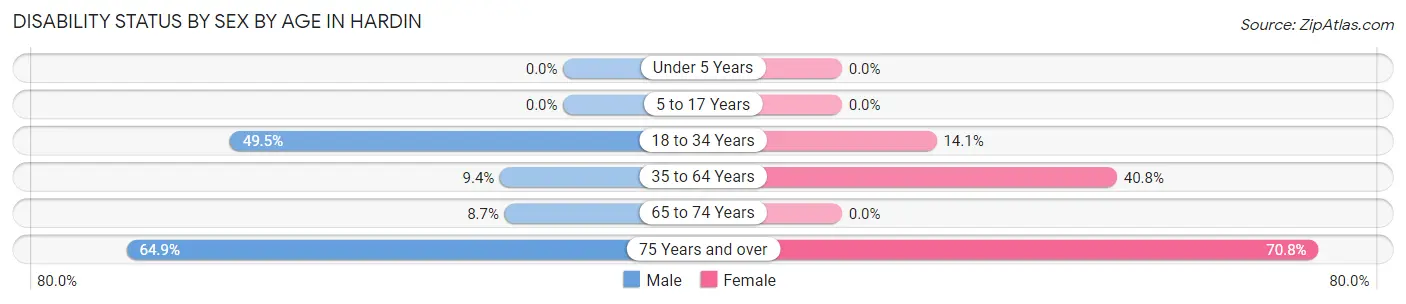
| Age Bracket | Male | Female |
| Under 5 Years | 0 (0.0%) | 0 (0.0%) |
| 5 to 17 Years | 0 (0.0%) | 0 (0.0%) |
| 18 to 34 Years | 52 (49.5%) | 9 (14.1%) |
| 35 to 64 Years | 9 (9.4%) | 49 (40.8%) |
| 65 to 74 Years | 4 (8.7%) | 0 (0.0%) |
| 75 Years and over | 24 (64.9%) | 46 (70.8%) |
Disability Class by Sex by Age in Hardin
Disability Class: Hearing Difficulty
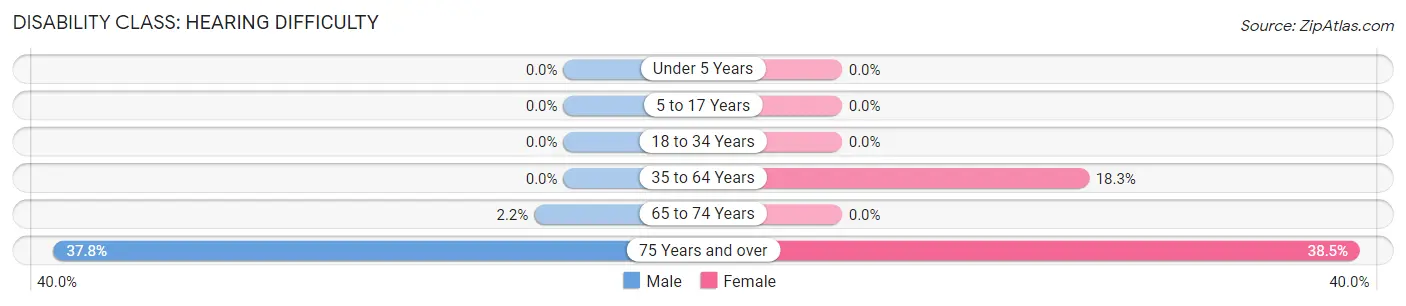
| Age Bracket | Male | Female |
| Under 5 Years | 0 (0.0%) | 0 (0.0%) |
| 5 to 17 Years | 0 (0.0%) | 0 (0.0%) |
| 18 to 34 Years | 0 (0.0%) | 0 (0.0%) |
| 35 to 64 Years | 0 (0.0%) | 22 (18.3%) |
| 65 to 74 Years | 1 (2.2%) | 0 (0.0%) |
| 75 Years and over | 14 (37.8%) | 25 (38.5%) |
Disability Class: Vision Difficulty
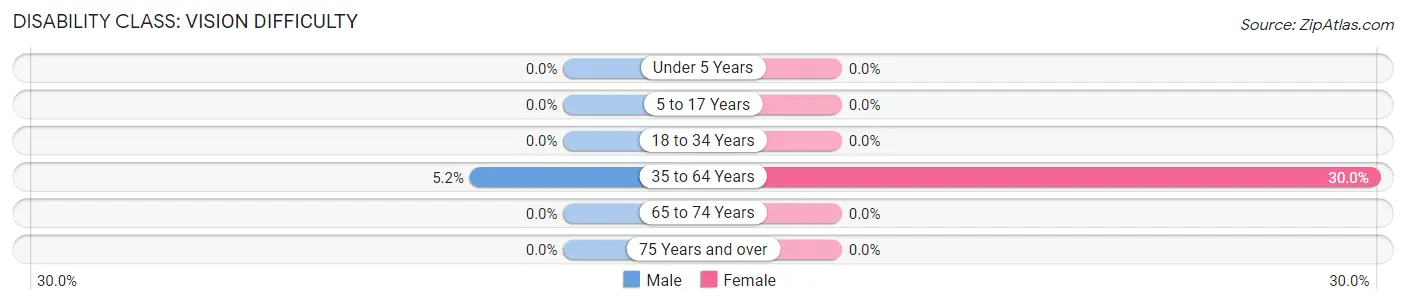
| Age Bracket | Male | Female |
| Under 5 Years | 0 (0.0%) | 0 (0.0%) |
| 5 to 17 Years | 0 (0.0%) | 0 (0.0%) |
| 18 to 34 Years | 0 (0.0%) | 0 (0.0%) |
| 35 to 64 Years | 5 (5.2%) | 36 (30.0%) |
| 65 to 74 Years | 0 (0.0%) | 0 (0.0%) |
| 75 Years and over | 0 (0.0%) | 0 (0.0%) |
Disability Class: Cognitive Difficulty
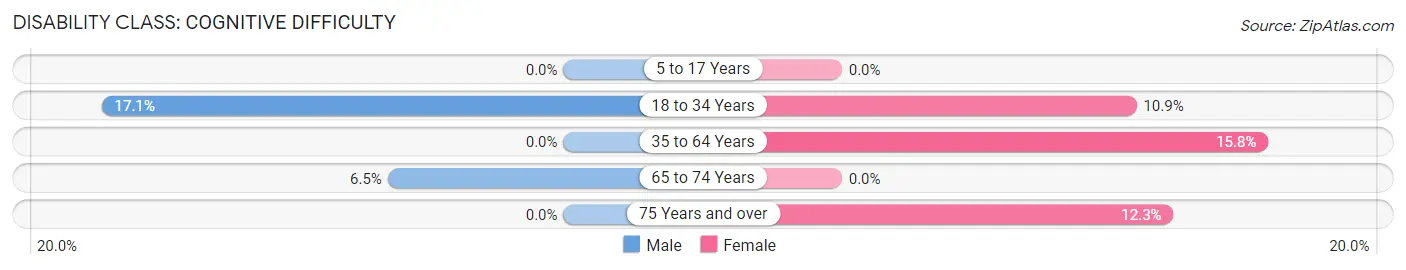
| Age Bracket | Male | Female |
| 5 to 17 Years | 0 (0.0%) | 0 (0.0%) |
| 18 to 34 Years | 18 (17.1%) | 7 (10.9%) |
| 35 to 64 Years | 0 (0.0%) | 19 (15.8%) |
| 65 to 74 Years | 3 (6.5%) | 0 (0.0%) |
| 75 Years and over | 0 (0.0%) | 8 (12.3%) |
Disability Class: Ambulatory Difficulty
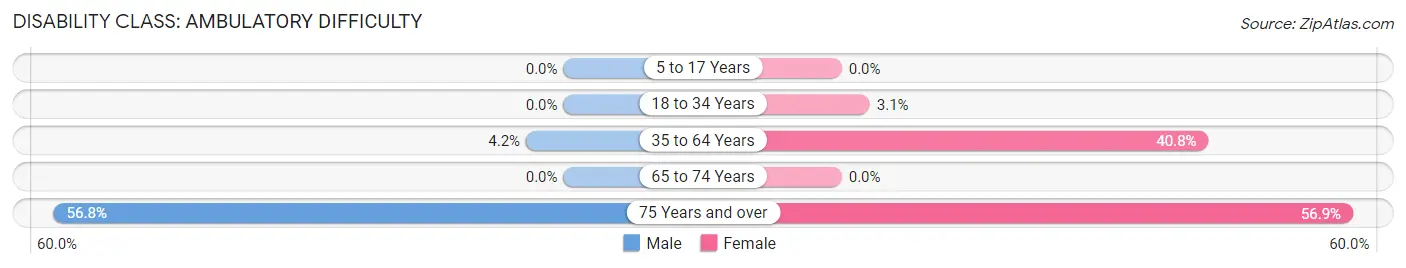
| Age Bracket | Male | Female |
| 5 to 17 Years | 0 (0.0%) | 0 (0.0%) |
| 18 to 34 Years | 0 (0.0%) | 2 (3.1%) |
| 35 to 64 Years | 4 (4.2%) | 49 (40.8%) |
| 65 to 74 Years | 0 (0.0%) | 0 (0.0%) |
| 75 Years and over | 21 (56.8%) | 37 (56.9%) |
Disability Class: Self-Care Difficulty
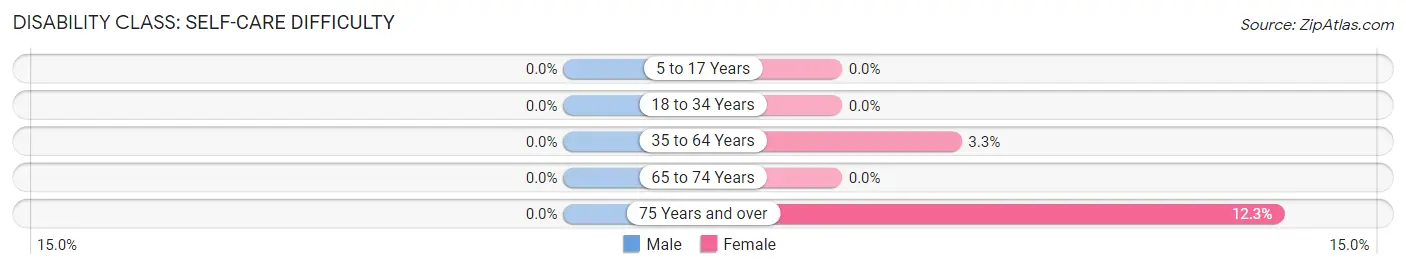
| Age Bracket | Male | Female |
| 5 to 17 Years | 0 (0.0%) | 0 (0.0%) |
| 18 to 34 Years | 0 (0.0%) | 0 (0.0%) |
| 35 to 64 Years | 0 (0.0%) | 4 (3.3%) |
| 65 to 74 Years | 0 (0.0%) | 0 (0.0%) |
| 75 Years and over | 0 (0.0%) | 8 (12.3%) |
Technology Access in Hardin
Computing Device Access in Hardin
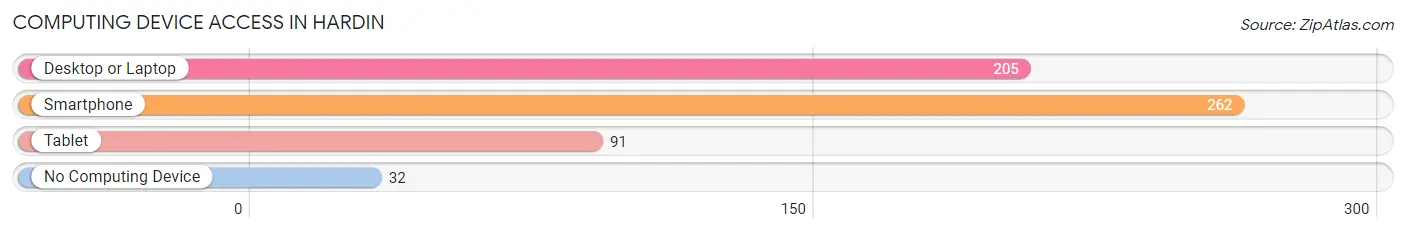
| Device Type | # Households | % Households |
| Desktop or Laptop | 205 | 65.1% |
| Smartphone | 262 | 83.2% |
| Tablet | 91 | 28.9% |
| No Computing Device | 32 | 10.2% |
| Total | 315 | 100.0% |
Internet Access in Hardin
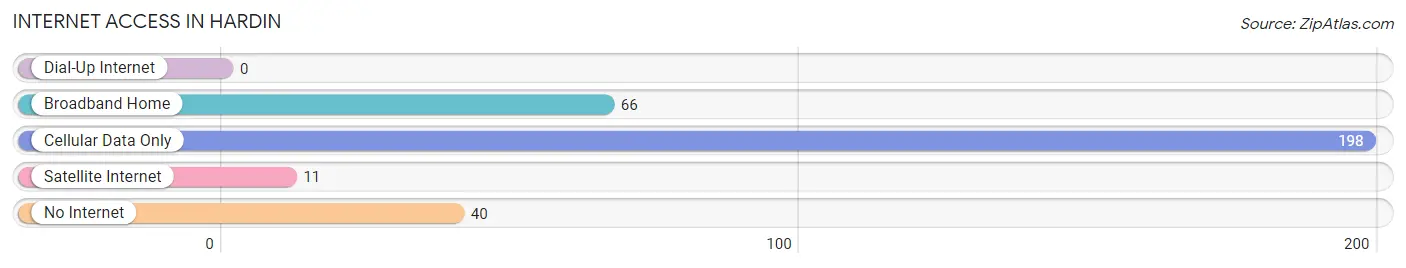
| Internet Type | # Households | % Households |
| Dial-Up Internet | 0 | 0.0% |
| Broadband Home | 66 | 20.9% |
| Cellular Data Only | 198 | 62.9% |
| Satellite Internet | 11 | 3.5% |
| No Internet | 40 | 12.7% |
| Total | 315 | 100.0% |
Hardin Summary
Hardin, Texas is a small town located in the southeastern corner of Texas, in the county of Jefferson. It is situated on the banks of the Neches River, and is part of the Beaumont-Port Arthur metropolitan area. The town has a population of just over 1,000 people, and is known for its rural charm and friendly atmosphere.
History
The area that is now Hardin was first settled in the early 1800s by a group of settlers from the United States. The town was originally known as Hardin's Settlement, and was named after the first settler, John Hardin. The town was officially incorporated in 1891, and was named after the Hardin family.
The town grew slowly over the years, and by the early 1900s, it had become a thriving agricultural community. The town was home to several cotton gins, and the local economy was largely based on the production of cotton. The town also had a number of small businesses, including a general store, a blacksmith shop, and a hotel.
In the mid-1900s, the town began to experience a decline in population as many of the local businesses closed down. However, in the late 1990s, the town began to experience a resurgence in population as new businesses began to move into the area. Today, Hardin is a small but vibrant community, with a variety of businesses and services.
Geography
Hardin is located in the southeastern corner of Texas, in the county of Jefferson. It is situated on the banks of the Neches River, and is part of the Beaumont-Port Arthur metropolitan area. The town is located about 30 miles east of Beaumont, and about 50 miles west of Houston.
The town is situated in a flat, low-lying area, and is surrounded by a number of small lakes and ponds. The climate in Hardin is generally mild, with hot summers and mild winters. The average annual temperature is around 70 degrees Fahrenheit.
Economy
The economy of Hardin is largely based on agriculture and tourism. The town is home to several cotton gins, and the local economy is largely based on the production of cotton. The town also has a number of small businesses, including a general store, a blacksmith shop, and a hotel.
In recent years, the town has also become a popular destination for tourists. The town is home to several historic sites, including the Hardin County Courthouse, the Hardin County Museum, and the Hardin County Historical Society. The town also hosts a number of festivals and events throughout the year, including the Hardin County Fair and the Hardin County Music Festival.
Demographics
As of the 2010 census, Hardin had a population of 1,072 people. The racial makeup of the town was 94.3% White, 0.7% African American, 0.3% Native American, 0.2% Asian, 0.1% Pacific Islander, and 4.4% from other races. The median household income in Hardin was $31,250, and the median family income was $37,500.
Conclusion
Hardin, Texas is a small town located in the southeastern corner of Texas, in the county of Jefferson. It is situated on the banks of the Neches River, and is part of the Beaumont-Port Arthur metropolitan area. The town has a population of just over 1,000 people, and is known for its rural charm and friendly atmosphere. The economy of Hardin is largely based on agriculture and tourism, and the town is home to several historic sites and hosts a number of festivals and events throughout the year. The town has a diverse population, with a median household income of $31,250 and a median family income of $37,500. Hardin is a small but vibrant community, with a variety of businesses and services.
Common Questions
What is Per Capita Income in Hardin?
Per Capita income in Hardin is $29,613.
What is the Median Family Income in Hardin?
Median Family Income in Hardin is $63,621.
What is the Median Household income in Hardin?
Median Household Income in Hardin is $62,716.
What is Income or Wage Gap in Hardin?
Income or Wage Gap in Hardin is 65.8%.
Women in Hardin earn 34.2 cents for every dollar earned by a man.
What is Inequality or Gini Index in Hardin?
Inequality or Gini Index in Hardin is 0.31.
What is the Total Population of Hardin?
Total Population of Hardin is 721.
What is the Total Male Population of Hardin?
Total Male Population of Hardin is 349.
What is the Total Female Population of Hardin?
Total Female Population of Hardin is 372.
What is the Ratio of Males per 100 Females in Hardin?
There are 93.82 Males per 100 Females in Hardin.
What is the Ratio of Females per 100 Males in Hardin?
There are 106.59 Females per 100 Males in Hardin.
What is the Median Population Age in Hardin?
Median Population Age in Hardin is 43.0 Years.
What is the Average Family Size in Hardin
Average Family Size in Hardin is 2.9 People.
What is the Average Household Size in Hardin
Average Household Size in Hardin is 2.3 People.
How Large is the Labor Force in Hardin?
There are 279 People in the Labor Forcein in Hardin.
What is the Percentage of People in the Labor Force in Hardin?
48.9% of People are in the Labor Force in Hardin.
What is the Unemployment Rate in Hardin?
Unemployment Rate in Hardin is 1.1%.